

Abstract
Super-enhancers (SEs) are clusters of enhancers that cooperatively assemble a high density of transcriptional apparatus to drive robust expression of genes with prominent roles in cell identity. Here, we demonstrate that the SE-enriched transcriptional coactivators BRD4 and MED1 form nuclear puncta at SEs that exhibit properties of liquid-like condensates and are disrupted by chemicals that perturb condensates. The intrinsically disordered regions (IDRs) of BRD4 and MED1 can form phase-separated droplets and MED1-IDR droplets can compartmentalize and concentrate transcription apparatus from nuclear extracts. These results support the idea that coactivators form phase-separated condensates at SEs that compartmentalize and concentrate the transcription apparatus, suggest a role for coactivator IDRs in this process, and offer insights into mechanisms involved in control of key cell identity genes.
Phase separation of fluids is a physicochemical process by which molecules separate into a dense phase and a dilute phase. Phase-separated biomolecular condensates, which include the nucleolus, nuclear speckles, stress granules, and others, provide a mechanism to compartmentalize and concentrate biochemical reactions within cells (1–3). Biomolecular condensates produced by liquid-liquid phase separation allow rapid movement of components into and within the dense phase and exhibit properties of liquid droplets such as fusion and fission (4). Dynamic and cooperative multivalent interactions among molecules, such as those produced by certain intrinsically disordered regions of proteins, have been implicated in liquid-liquid phase separation (5–7).
Enhancers are gene regulatory elements bound by transcription factors and other components of the transcription apparatus that function to regulate expression of cell type-specific genes (8–13). Super-enhancers (SEs), clusters of enhancers that are occupied by exceptionally high densities of transcriptional machinery, regulate genes with especially important roles in cell identity (14, 15). DNA interaction data show that enhancer elements in the clusters are in close spatial proximity with each other and the promoters of the genes they regulate (16–18), consistent with the notion of a dense assembly of transcriptional machinery at these sites. This high-density assembly at SEs has been shown to exhibit sharp transitions of formation and dissolution, forming as the consequence of a single nucleation event (19, 20) and collapsing when concentrated factors are depleted from chromatin (21–25) or when nucleation sites are deleted (26–29). These properties of SEs led to the proposal that the high-density assembly of biomolecules at active SEs is due to phase separation of enriched factors at these genetic elements (30). Here, we provide experimental evidence that the transcriptional coactivators BRD4 and MED1 form condensates at SEs. This establishes a new framework to account for the diverse properties described for these regulatory elements and expands the biochemical processes regulated by phase separation to include cell identity gene control.
BRD4 and MED1 coactivators form nuclear puncta
The enhancer clusters comprising SEs are occupied by master transcription factors and unusually high densities of factors, including BRD4 and MED1, which are coactivators (31–35) whose presence can be used to define SEs (14, 15, 21). We reasoned that if BRD4 and MED1, a subunit of the Mediator complex, are components of nuclear condensates, then they might be visualized as discrete puncta in the nuclei of cells and the properties of these puncta could be investigated. Fixed cell immunofluorescence (IF) with antibodies against BRD4 and MED1 in murine embryonic stem cells (mESC) revealed nuclear puncta for both factors (Fig. 1A). To determine whether such puncta occur in live cells, mESCs were engineered using CRISPR/Cas9 to tag endogenous BRD4 and MED1 with mEGFP (Fig. S1). Live cell fluorescence microscopy of these engineered mESCs lines also revealed discrete nuclear puncta (Fig. 1B). Analysis of these images revealed that there were 1034 ± 130 (SEM) BRD4 and 983 ± 102 (SEM) MED1 puncta per nucleus (Table S1). These results demonstrate that BRD4 and MED1 are components of puncta within the nuclei of mESCs.
Fig. 1. BRD4 and MED1 form puncta at super-enhancers.
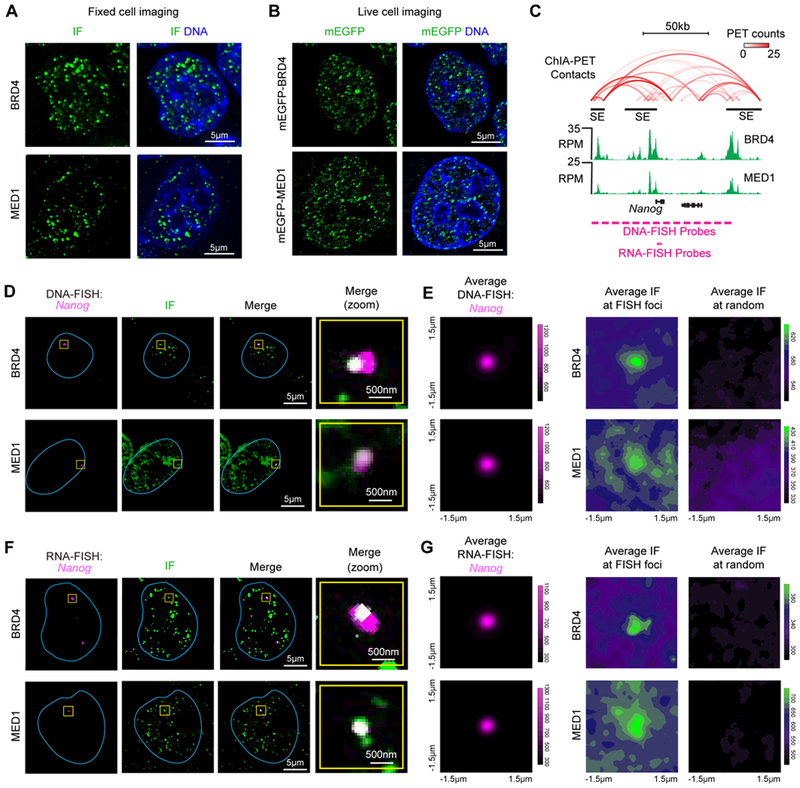
(A) Immunofluorescence (IF) imaging of BRD4 and MED1 in mouse embryonic stem cells (mESC). Fluorescence signal is shown alone (left) and merged with Hoechst stain (right). (B) Live imaging of endogenously-tagged mEGFP-BRD4 and mEGFP-MED1 in mESC. (C) Depiction of Nanog locus, associated super-enhancers (black bars), DNA contacts (red arcs), BRD4 and MED1 ChIP-seq (green histograms), and location of FISH probes. (D) Co-localization between BRD4 or MED1 and the Nanog locus by IF and DNA-FISH in fixed mESC. Separate images of the indicated IF and FISH are shown, along with an image showing the merged channels (overlapping signal in white). The blue line highlights nuclear periphery, determined by Hoechst staining (not shown). The “Merge (zoom)” column displays region of image (yellow box) zoomed in for greater detail. (E) Averaged signal of either FISH, IF for BRD4, or IF for MED1 centered at Nanog DNA-FISH foci or randomly selected nuclear positions. (F) Co-localization between BRD4 or MED1 and the nascent RNA of Nanog by IF and RNA-FISH in fixed mESC. Data shown as in (D). (G) Averaged signal of either FISH, IF for BRD4, or IF for MED1 centered at Nanog RNA-FISH foci or randomly selected nuclear positions.
Super-enhancers are associated with coactivator puncta
Several lines of evidence suggest that SEs are likely to be associated with some of the BRD4 and MED1 puncta in mESCs. ChIP-seq data for BRD4 and MED1 show that SEs are especially enriched in these coactivators (14, 15). DNA interaction data suggests that SE constituents occupied by BRD4 and MED1 are in close spatial proximity to one another (Fig. 1C, Fig. S2A). Co-occupancy of the genome by BRD4 and MED1 is most evident at SEs (Fig. S2B) (14, 15). To determine if SEs are associated with some of the BRD4 and MED1 puncta, we performed IF for BRD4 or MED1 together with DNA-FISH or nascent RNA-FISH for the genomic region containing the Nanog gene and its super-enhancers (Fig. 1D–G). We found that BRD4 and MED1 puncta consistently overlapped the DNA-FISH foci (Fig. 1D) or RNA-FISH foci (Fig. 1F). An average image analysis (see methods for details) of BRD4 or MED1 IF signal centered at DNA-FISH foci (N=137 for BRD4 and N=125 for MED1) or RNA-FISH foci (N=121 for BRD4 and N=181 for MED1) revealed that, on average, BRD4 and MED1 fluorescence intensities are most enriched at the center of FISH foci (Fig. 1E, 1G); this trend was not observed for average images centered at randomly selected nuclear positions (Fig. 1E, 1G). Radial distribution functions of the averaged images for FISH and IF pairs show a significant correlation (Spearman correlation coefficients > 0.6, p-values < 1×10⁻¹⁶), with both BRD4 and MED1 having highest signal intensity at the center of the FISH focus, decaying with distance from this center (Fig. S3). The radial distributions of FISH and IF at randomly selected nuclear positions do not show a correlation (Spearman correlation coefficients < 0.2) (Fig. S3). Similar results were obtained when we performed IF for BRD4 or MED1 together with nascent RNA-FISH for the SE-regulated genes Klf4, Mir290, and Trim28 (Fig. S3 and S4A–F). When a similar experiment was conducted for two genes expressed in mESCs but not associated with a SE (Fam168b and Zfp606), there was no evident overlap between FISH foci and BRD4 puncta (Fig. S4G). These results indicate that both BRD4 and MED1 puncta are present at SEs.
Coactivator puncta exhibit liquid-like rates of fluorescence recovery after photobleaching
We next sought to examine whether BRD4 and MED1 puncta exhibit features characteristic of liquid-like condensates. A hallmark of liquid-like condensates is internal dynamical reorganization and rapid exchange kinetics (1–3), which can be interrogated by measuring the rate of fluorescence recovery after photobleaching (FRAP). To study the dynamics of BRD4 and MED1 foci in live cells, we performed FRAP experiments on endogenously tagged mEGFP-BRD4 or mEGFP-MED1 cell lines. After photobleaching, mEGFP-BRD4 and mEGFP-MED1 puncta recovered fluorescence on a time-scale of seconds (Fig. 2A–2D), with approximate apparent diffusion coefficients of 0.37 ± 0.13 μm2/s and 0.14 ± 0.04 μm2/s, respectively. These values are similar to previously described components of liquid-like condensates (36, 37). ATP has been implicated in promoting condensate fluidity by driving energy-dependent processes and/or through its intrinsic hydrotrope activity (38, 39). Depletion of cellular ATP by glucose deprivation and oligomycin treatment altered fluorescence recovery after photobleaching for both mEGFP-BRD4 and mEGFP-MED1 foci, with the rate of recovery for MED1 reduced and the extent of recovery for BRD4 diminished (Fig. 2E–2H). These results indicate that puncta containing BRD4 and MED1 have liquid-like properties in cells, consistent with previously described phase-separated condensates.
Fig. 2. BRD4 and MED1 nuclear puncta exhibit properties expected for biomolecular condensates.
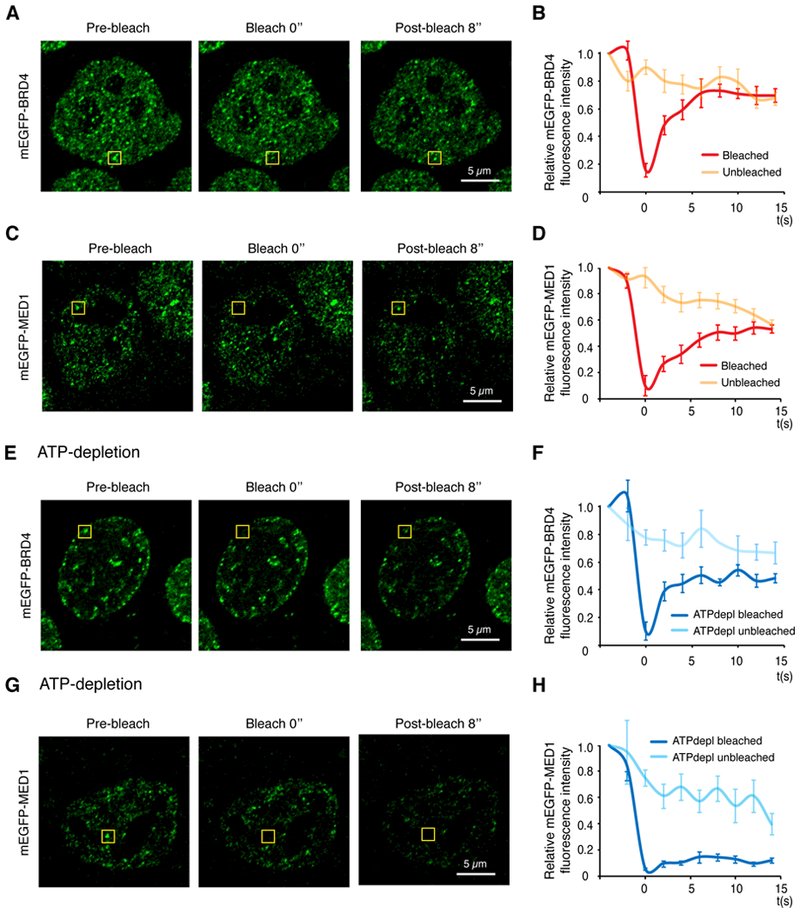
(A) Representative images of FRAP experiment of mEGFP-BRD4 engineered mESCs. Yellow box highlights the punctum undergoing targeted bleaching. (B) Quantification of FRAP data for mEGFP-BRD4 puncta. Bleaching event occurs at t = 0s. For both bleached area and unbleached control, background-subtracted fluorescence intensities are plotted relative to a pre-bleach time point (t = −4s). Data are plotted as mean +/− SEM (N=9). (C) Same as (A) with mEGFP-MED1 engineered mESC cells. (D) Quantification of FRAP data for mEGFP-MED1 puncta (N=9), same as (B). (E) Representative images of FRAP experiment of mEGFP-BRD4 engineered mESCs upon ATP-depletion. (F) Quantification of FRAP data of mEGFP-BRD4 upon ATP-depletion (N=8), same as (B). (G) Representative images of FRAP experiment of mEGFP-MED1 engineered mESC cells upon ATP depletion. (H) Quantification of FRAP data for mEGFP-MED1 puncta upon ATP-depletion (N=8), same as (B). Images were taken using the Zeiss LSM 880 confocal microscope with Airyscan detector with 63x objective at 37°C.
Coactivator puncta and super-enhancer occupancy are sensitive to condensate perturbation
To further investigate the biophysical properties of BRD4 and MED1 puncta, we investigated their sensitivity to 1,6-hexanediol, a compound known to disrupt liquid-like condensates, putatively through the disruption of hydrophobic interactions (40). We found that treatment of mESCs expressing endogenously tagged mEGFP-BRD4 or mEGFP-MED1 with 1,6-hexanediol caused a reduction in the number of BRD4 and MED1 puncta (Fig. 3A, B).
Fig. 3. 1,6-hexanediol disrupts BRD4 and MED1 puncta and disrupts BRD4, MED1, and RNAPII occupancy at super-enhancers and super-enhancer driven genes.
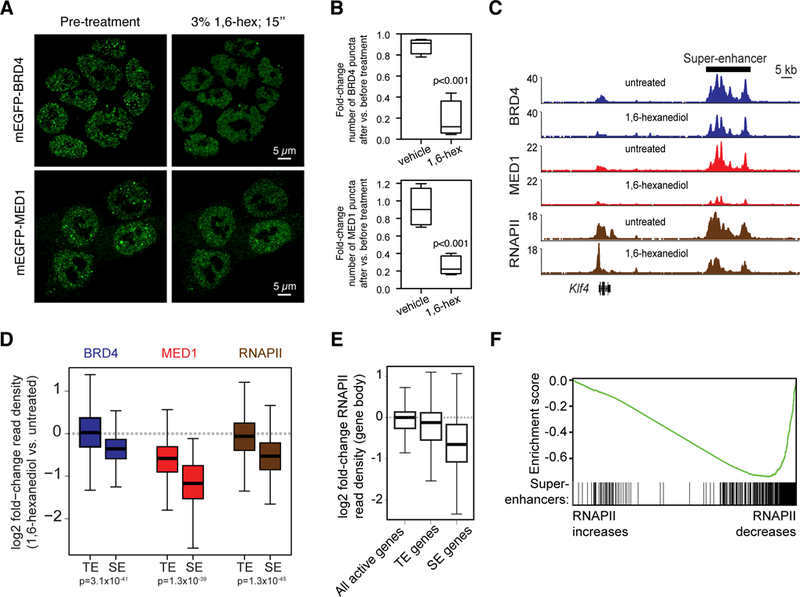
(A) Representative images of mEGFP-BRD4 or mEGP-MED1 engineered mESCs before and after treatment with 3% hexanediol for 15 seconds. (B) Box plot presentation of the fold change in number of mEGFP-BRD4 or mEGFP-MED1 puncta observed before and after addition of vehicle or 1,6-hexanediol to a final concentration of 3%. (C) Genome browser view of BRD4 (blue), MED1 (red), and RNAPII (brown) ChIP-seq data from untreated or 1,6-hexanediol treated (1.5% for 30 minutes) mESCs at the Klf4 locus. (D) Box plot representation of log2 fold-change in BRD4 (blue), MED1 (red), and RNAPII (brown) ChIP-seq read density (1,6-hexanediol versus untreated) for regions defined as super-enhancers (SEs) or typical enhancers (TEs) (see methods and Table S2). (E) Boxplot representation of log2 fold-change in RNAPII ChIP-seq density (1,6-hexanediol versus untreated) within the gene body (transcription start site to transcription end site) of all active genes (RPKM>1), typical-enhancer associated genes (TE genes) or super-enhancer associated genes (SE genes). (F) Gene Set Enrichment Analysis of genes, ranked by their log2 fold-change in RNAPII ChIP-seq density within the gene body and annotated against the set of super-enhancer-associated genes. Enrichment score profile and position of SE-associated genes is shown.
To determine the effect of 1,6-hexanediol on BRD4, MED1 and RNA polymerase II (RNAPII) occupancy at enhancers and genes, ChIP-seq was performed with antibodies against these proteins in untreated or 1,6-hexanediol-treated mESCs. The results showed that 1,6-hexanediol treatment caused a reduction in all three proteins at enhancers, with the most profound effects occurring at super-enhancers (Fig. 3C, 3D, S5A). For example, at the Klf4 super-enhancer, the levels of BRD4 were reduced by 44%, those of MED1 by 80% and those of RNA polymerase II by 56% upon 1,6-hexanediol treatment (Fig. 3C). Similar effects were observed genome-wide, where reductions in BRD4, MED1, and RNAPII were substantially larger at super-enhancers than typical enhancers (Fig. 3D) and the degree to which BRD4 and MED1 were lost from SEs was positively correlated (Fig. S5B). These results are consistent with the notion that BRD4 and MED1 form condensates at super-enhancers that are sensitive to 1,6-hexanediol.
The level of RNAPII occupancy across gene bodies can be used as a measure of transcriptional output (41). The ChIP-seq data revealed that the reduction of BRD4 and MED1 occupancy at SEs was associated with a loss of RNAPII occupancy across SE-associated gene bodies (Fig. 3C, E, and S5A). When genes were ranked by the extent to which RNAPII was lost upon 1,6-hexanediol treatment, SE-associated genes were highly enriched among those that lost the most RNAPII (Fig. 3F). These results are consistent with the idea that BRD4 and MED1 condensates are associated with super-enhancers and the notion that loss of condensate integrity adversely affects transcription.
Intrinsically disordered regions of BRD4 and MED1 phase separate in vitro
BRD4 and MED1 contain large intrinsically disordered regions (IDRs) (Fig. 4A) and share features with the IDRs of several proteins known to facilitate condensate formation (2, 3), including high proline and glutamine content (BRD4), high serine content (MED1), and acidic and basic regions (BRD4 and MED1). The purified IDRs of several proteins involved in condensate formation form phase-separated droplets in vitro (36, 37, 42, 43), so we investigated whether the IDRs of BRD4 or MED1 form such droplets in vitro. Purified recombinant mEGFP-IDR fusion proteins (BRD4-IDR and MED1-IDR) (Fig. 4B) were added to buffers containing 10% PEG-8000 (see materials and methods), turning the solution opaque, while equivalent solutions with mEGFP alone remained clear (Fig. 4C). Fluorescence microscopy of the opaque MED1-IDR and BRD4-IDR solutions revealed GFP-positive, micron-sized spherical droplets freely moving in solution (Movies S1 and S2) and falling onto and wetting the surface of the glass coverslip, where the droplets remained stationary (Movie S3). As determined by aspect ratio analysis, the MED1-IDR and BRD4-IDR droplets were highly spherical (Fig. S6A), a property expected for liquid-like droplets (1–3).
Fig. 4. Intrinsically disordered regions (IDRs) of BRD4 and MED1 phase separate in vitro.
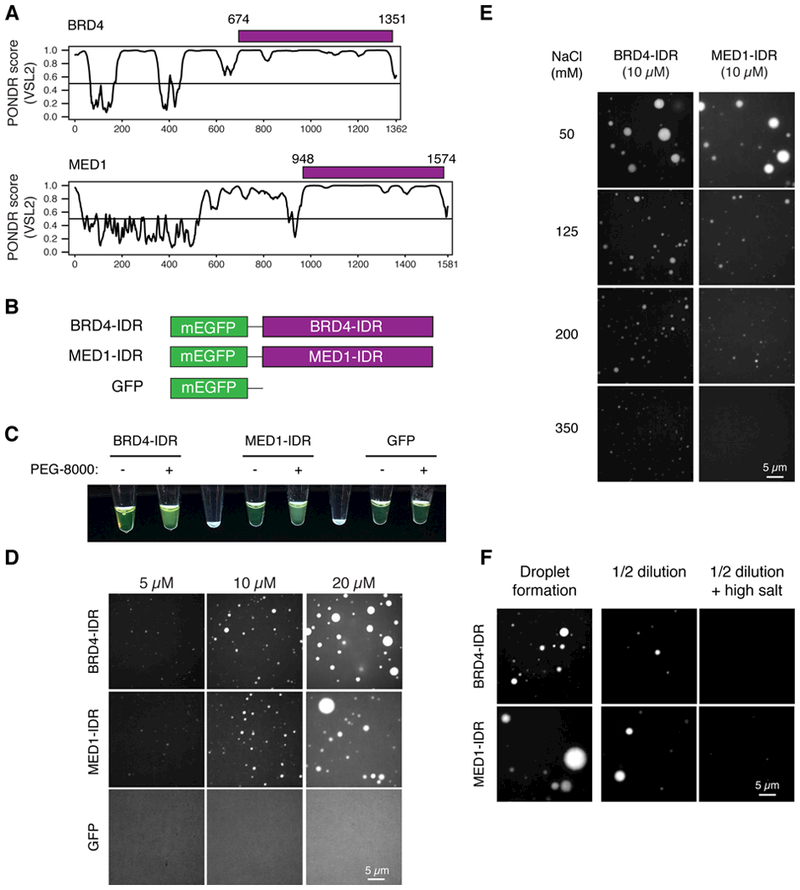
(A) Graphs plotting intrinsic disorder (PONDR VSL2) for BRD4 and MED1. PONDR VSL2 score (y-axis) and amino acid position (x-axis) are shown. Purple bar designates the IDR under investigation. (B) Schematic of recombinant mEGFP fusion proteins used here. Purple boxes indicate IDR’s of BRD4 (BRD4-IDR) and MED1 (MED1-IDR) shown in (A). (C) Visualization of turbidity associated with droplet formation. Tubes containing BRD4-IDR (left pair), MED1-IDR (middle pair) or GFP (right pair) in the presence (+) or absence (−) of PEG-8000 are shown. Blank tubes included between pairs for contrast. (D) Representative images of droplet formation at different protein concentrations. BRD4-IDR, MED1-IDR or mEGFP were added to droplet formation buffer to final concentrations indicated. (E) Representative images of droplet formation at different salt concentrations. BRD4-IDR or MED1-IDR was added to droplet formation buffer to achieve 10 μM protein concentration with a final NaCl concentration as indicated. (F) Representative images of droplet reversibility experiment. BRD4-IDR (top row) or MED1-IDR (bottom row) BRD4-IDR or MED1-IDR, as indicated, (20 μM protein, 75 mM NaCl) (initial) or followed by a 1:1 dilution (diluted 1/2) or a 1:1 dilution with an increase to 425mM NaCl (diluted 1/2 + NaCl)
Phase-separated droplets typically scale in size according to the concentration of components in the system (44). We performed the droplet formation assay with varying concentrations of BRD4-IDR, MED1-IDR, and mEGFP ranging from 0.625μM to 20μM. BRD4-IDR and MED1-IDR formed droplets with concentration-dependent size distributions, whereas mEGFP remained diffuse in all conditions tested (Fig. 4D and S6B). Although these droplets were smaller at lower concentrations, we observed BRD4-IDR and MED1-IDR droplets at the lowest concentration tested (0.625μM) (Fig. S6C).
To investigate the biophysical properties of these droplets we tested their ability to form droplets under varying salt concentrations (to probe the contribution of electrostatic interactions) or upon 1,6-hexanediol (to probe the contribution of hydrophobic interactions). The size distributions or opacity of both BRD4-IDR and MED1-IDR droplets shifted toward smaller droplets with increasing NaCl concentration (from 50mM to 350mM) (Fig. 4E, S6D) or in 10% 1,6-hexanediol (S7A). These results demonstrate that a variety of molecular interactions contribute to BRD4-IDR and MED1-IDR droplet formation.
We next sought to test whether the droplets are irreversible aggregates or reversible phase-separated condensates. To do this, BRD4-IDR and MED1-IDR were allowed to form droplets in an initial solution. The protein concentration was then diluted by half in equimolar salt or in a higher salt solution (Fig. 4F). The pre-formed droplets of both BRD4-IDR and MED1-IDR were reduced in size and number with dilution and even further reduced with elevated salt concentration (Fig. 4F, Fig. S7B). These results show that the BRD4-IDR and MED1-IDR droplets form a distribution of sizes dependent on the conditions of the system and, once formed, respond to changes in the system, with rapid adjustments in size. These features are characteristic of phase-separated condensates formed by networks of weak protein-protein interactions (1–3).
MED1-IDR participates in liquid-liquid phase separation in cells
To investigate whether the coactivator IDRs facilitate phase separation in cells, we used a previously developed assay to manipulate local protein concentrations within the cell; this optoIDR assay tests IDR-dependent, light-inducible droplet formation in vivo (45). Briefly, the photo-activatable, self-associating Cry2 protein was labeled with mCherry and fused to an IDR of interest. This fusion mediates a blue light-inducible increase in local concentration of selected IDRs within the cell (Fig. 5A) (45). In this assay, IDRs known to promote phase separation enhance the photo-responsive clustering properties of Cry2, causing rapid formation of liquid-like spherical droplets upon blue light-stimulation (46, 47). Fusion of a portion of the MED1 IDR to Cry2-mCherry facilitated the rapid formation of micron-sized spherical droplets upon blue light-stimulation (optoDroplets) (Fig. 5B, C, S8). During blue light-stimulation, proximal droplets were observed to fuse (Fig. 5D, 5E and Movie S4). The fusions exhibited characteristic liquid-like fusion properties of necking and relaxation to spherical shape (Fig. 5E). The MED1-IDR droplets persisted after blue light-stimulation and exhibited liquid-like FRAP recovery rates in the absence of blue light-stimulation (Fig. 5F–H). The rapid FRAP kinetics in the absence of light-activated Cry2 interactions suggests that the MED1-IDR optoDroplets established by blue light are dynamic assemblies exchanging with the dilute phase.
Fig. 5. The IDR of MED1 participates in phase separation in cells.
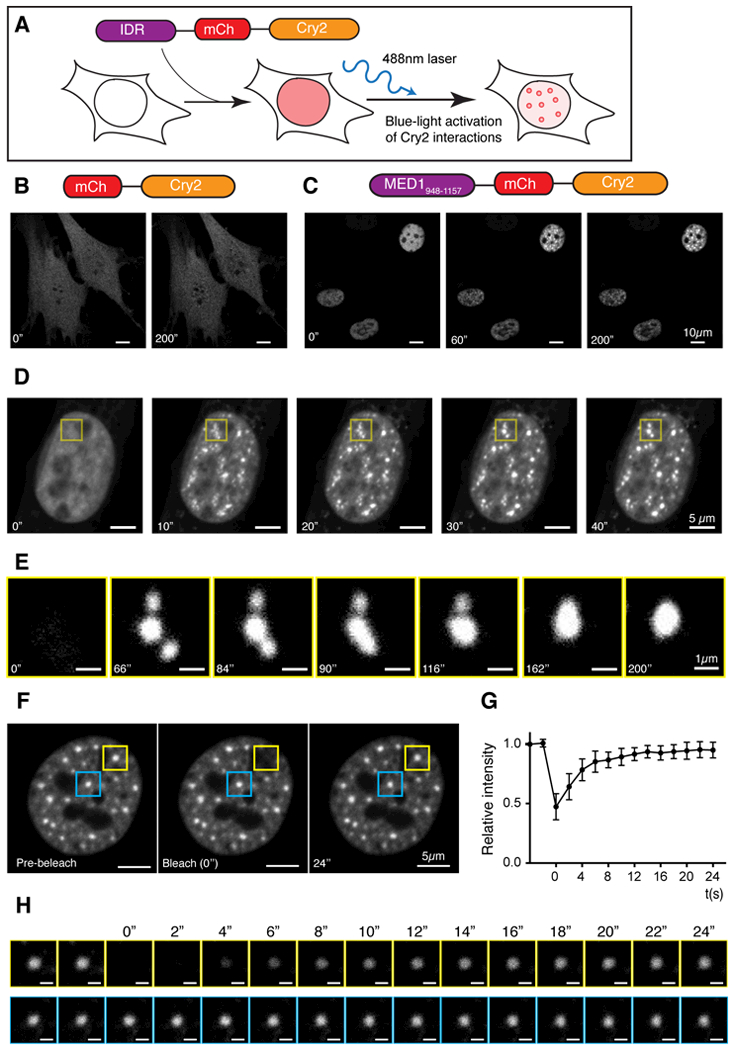
(A) Schematic of optoIDR assay, depicting recombinant protein with intrinsically disordered domain (purple), mCherry (red) and Cry2 (orange) expressed in cells exposed to blue light. (B and C) Images of NIH3T3 cells expressing either (B) mCherry-Cry2 or (C) a portion of the MED1 IDR (amino acids 948–1157) fused to mCherry-Cry2 (MED1-optoIDR). Cells were subjected to laser excitation every 2 seconds for indicated time. (D) Time-lapse images of the nucleus of an NIH3T3 cell expressing MED1-optoIDR subjected to laser excitation every 2 seconds for the times indicated. A droplet fusion event occurs in the region highlighted by the yellow box. (E) Droplet fusion event highlighted in (D) at higher resolution and extended times as indicated. (F) Image of a MED1-optoIDR optoDroplet (yellow box) before (left), during (middle) and after (right) photobleaching. The blue box highlights an unbleached region for comparison. Time relative to photobleaching (0”) is indicated. (G) Signal intensity relative to pre-bleaching signal (y-axis) and time relative to photobleaching (x-axis) are shown. Data shown as average relative intensity ± SD (n=15). (H) Time-lapse and close-up view of droplet recovery for regions highlighted in (F). Times relative to photobleaching are indicated. Scale bar, 1 μm.
Conserved serine bias in the MED1-IDR is necessary for phase separation
Previous studies have implicated low complexity, intrinsically disordered regions of proteins in liquid-liquid phase separation (7, 36, 37, 43). An examination of the amino acid content of MED1 revealed that the IDR contains a striking compositional bias for serine (Fig. 6A). Interestingly, this serine compositional bias is conserved among vertebrates (Fig. 6B). To investigate whether this serine bias is necessary for the MED1 IDR’s capacity to phase separate, we mutated all the serine residues to alanine and investigated the ability of this mutated IDR to form phase-separated droplets in vitro. The MED1-IDR S-to-A mutant was incapable of forming phase-separated droplets under conditions where the wild type IDR readily formed droplets (Fig. 6C), indicating that the conserved serine bias in the MED1 IDR is necessary for droplet formation.
Fig. 6: Conserved serine bias is necessary for MED1-IDR phase separation.
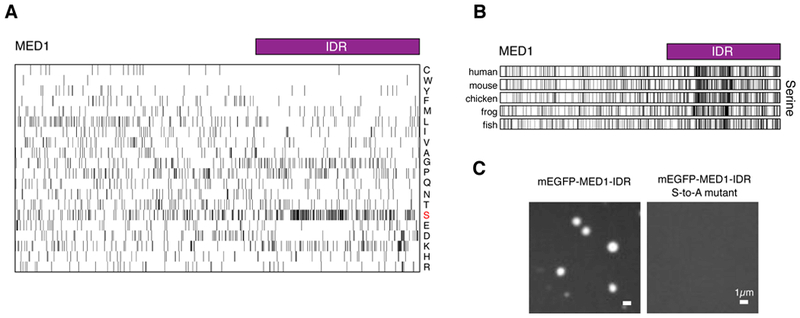
(A) Amino acid composition of the MED1 protein. Each row represents information for a single amino acid, single letter amino code shown on right. The length of the row corresponds to the length of the MED1 protein. Black bars represent occurrence of indicated amino acid at that position in MED1. Purple bar represents the IDR of MED1 under investigation. (B) Serine composition of MED1 protein from indicated organisms. Presented as in (A). (C) Mutating all serines to alanine disrupts phase separation. Representative images of wild type MED1-IDR or all serines to alanine mutant MED1-IDR (MED1-IDR S-to-A mutant) fused to mEGFP in droplet formation assay (10uM protein, 125mM NaCl, 10% Ficoll-400).
MED1-IDR droplets can incorporate proteins necessary for transcription
A proposed function of phase separation at SEs is the ability to compartmentalize and concentrate factors within a biomolecular condensate, so we sought to test whether MED1-IDR droplets could recapitulate this compartmentalization function in vitro. We identified conditions where the MED1-IDR could form droplets but the BRD4-IDR could not (Fig. S9). We then investigated whether the MED1-IDR droplets could compartmentalize BRD4-IDR protein under these conditions (Fig. 7A). Using either mEGFP or mCherry fused proteins, we found that the MED1-IDR droplets (mCherry-fused) could incorporate, and thus concentrate, the BRD4-IDR protein (mEGFP-fused) (Fig. 7A). The MED1-IDR droplets (mCherry-fused) did not incorporate mEGFP (Fig. 7A). To probe the approximate mesh size of the MED1-IDR droplet (48), we incubated MED1-IDR droplets with fluorescently-labeled dextrans of average molecular weights 4kDa, 10kDa, and 40kDa. We found that the 4kDa dextrans were incorporated into the MED1-IDR droplets, the 10kDa dextrans were incorporated with less efficiency, and the 40kDa dextrans were excluded (Fig. S10). These results suggest that the incorporation of mEGFP-BRD4-IDR (105 kDa) into the MED1-IDR droplet is due to attractive molecular interactions, as opposed to passive diffusion through the droplet mesh.
Fig. 7: MED1-IDR droplets compartmentalize and concentrate proteins necessary for transcription.
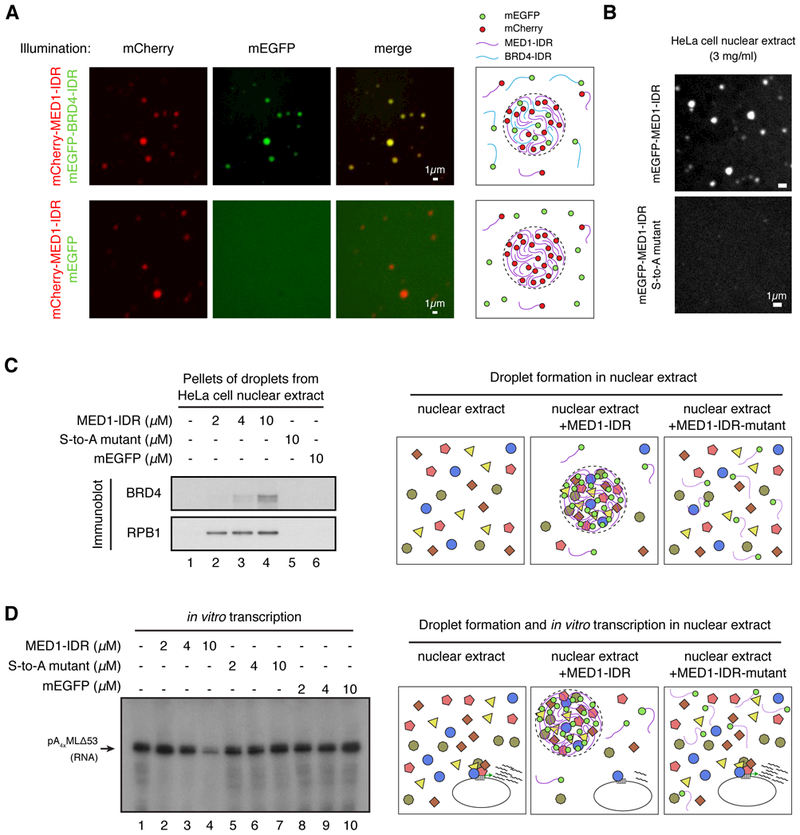
(A) MED1-IDR droplets incorporate BRD4-IDR protein in vitro. The indicated mEGFP or mCherry fusion proteins were mixed at 10μM each in Buffer D containing 10% Ficoll-400 and 125mM NaCl. Indicated fluorescence channels are presented for each mixture. Illustrations summarizing results shown on left. (B) MED1-IDR forms droplets in an in vitro transcription reaction containing HeLa cell nuclear extract, while the MED1-IDR S-to-A mutant does not. Representative images of indicated mEGFP-fusion protein when added to an in vitro transcription reaction containing HeLa cell nuclear extract at a final concentration of 3mg/ml (see Materials and Methods for complete list of components). (C) MED1-IDR droplets compartmentalize transcriptional machinery from a nuclear extract. Immunoblots of the pellet fraction of indicated protein added to in vitro transcription reactions (as in B). Illustration of a proposed model of molecular interactions taking place within MED1-IDR droplets in the nuclear extract is presented to the right. (D) MED1-IDR droplets compartmentalize machinery necessary for the in vitro transcription reaction. Autoradiograph of radiolabelled RNA products of in vitro transcription reactions under indicated conditions. Arrow indicates expected RNA product. Reactions conducted as in (69) with minor modifications. See Materials and Methods for full details. Illustration of a proposed model of molecular interactions taking place within MED1-IDR droplets in nuclear extract and the impact on in vitro transcription reaction is presented to the right.
We next investigated whether the MED1-IDR, introduced into a transcription-competent nuclear extract, would form droplets that might incorporate BRD4 or other transcriptional components. We found that the wild type MED1-IDR but not the MED1-IDR S-to-A mutant formed droplets in these extracts (Fig. 7B). The MED1-IDR phase-separated droplets are denser than the surrounding extract and thus can be purified from solution by centrifugation. Immunoblot analysis revealed that BRD4 and the largest subunit of RNAPII (RPB1) were enriched in pelleted droplets in a MED1-IDR dose-dependent manner (Fig. 7C). These results indicate that the MED1-IDR droplets can incorporate BRD4 and RNAPII.
The ability of the MED1-IDR protein to incorporate BRD4 and RNAPII into an artificial phase-separated compartment suggests that it sequesters key components of the transcription apparatus and might thus be used to “squelch” transcription in the nuclear extract. We carried out an in vitro transcription assay with these extracts and found that the wild type MED1-IDR protein does indeed squelch transcription, correlating with the amount of material separated from solution by the MED1-IDR droplets (Fig. 7D). We did not observe these effects with equivalent concentrations of mEGFP or with the MED1-IDR S-to-A mutant (Fig. 7D). These results demonstrate that the MED1-IDR has the capacity to compartmentalize and concentrate transcriptional machinery from a complex nuclear extract.
Discussion
Super-enhancers (SEs) regulate genes with prominent roles in healthy and diseased cellular states (14, 15, 19–25, 49, 50). SEs and their components have been proposed to form phase-separated condensates (30), but with no direct evidence. Here, we demonstrate that two key components of SEs, BRD4 and MED1, form nuclear condensates at sites of SE-driven transcription. Within these condensates, BRD4 and MED1 exhibit apparent diffusion coefficients similar to those previously reported for other proteins in phase-separated condensates in vivo (36, 37). The IDRs of both BRD4 and MED1 are sufficient to form phase-separated droplets in vitro and the MED1-IDR facilitates phase separation in living cells. Droplets formed by MED1-IDR are capable of concentrating transcription machinery in a transcriptionally competent nuclear extract. These results support a model in which transcriptional coactivators form phase-separated condensates that compartmentalize and concentrate the transcription apparatus at SE-regulated genes and identify SE components that likely play a role in phase separation.
SEs are established by the binding of master transcription factors (TFs) to enhancer clusters (14, 15). These TFs typically consist of a structured DNA binding domain and an intrinsically disordered transcriptional activation domain (51–53). The activation domains of these TFs recruit high densities of many transcription proteins, which as a class are enriched for IDRs (54). While the exact client-scaffold relationship (55) between these components remains an open question, it is likely that these protein sequences mediate weak multivalent interactions thereby facilitating condensation. We propose that condensation of such high-valency factors at SEs creates a reaction crucible within the separated dense phase, where high local concentrations of the transcriptional machinery ensure robust gene expression.
The nuclear organization of chromosomes is likely influenced by condensates at SEs. DNA interaction technologies indicate that the individual enhancers within the SEs have exceptionally high interaction frequencies with one another (16–18), consistent with the idea that condensates draw these elements into close proximity in the dense phase. Several recent studies suggest that SEs can interact with one another and may also contribute in this fashion to chromosome organization (56, 57). Cohesin, a Structural Maintenance of Chromosomes (SMC) protein complex, has been implicated in constraining SE-SE interactions because its loss causes extensive fusion of SEs within the nucleus (57). These SE-SE interactions may be due to a tendency of liquid phase condensates to undergo fusion (1–3).
The model that phase separation of coactivators compartmentalizes and concentrates the transcription apparatus at SEs and their regulated genes raises many questions. How does condensation contribute to regulation of transcriptional output? A study of RNAPII clusters, which may be phase-separated condensates, suggests a positive correlation between condensate lifetime and transcriptional output (58). What components drive formation and dissolution of transcriptional condensates? Our studies indicate that BRD4 and MED1 likely participate, but the roles of DNA-binding TFs, RNAPII and regulatory RNAs require further study. Why do some proteins, such as HP1a, contribute to phase-separated heterochromatin condensates (59, 60) and others contribute to euchromatic condensates? Studies to dissect the rules that govern partitioning into specific types of condensates have begun (61–65) and will need to be defined for proteins involved in transcriptional condensates. Does condensate misregulation contribute to pathological processes in disease and will new insights into condensate behaviors present new opportunities for therapy? Mutations within IDRs and misregulation of phase separation have already been implicated in a number of neurodegenerative diseases (66–68). Tumor cells have exceptionally large SEs at driver oncogenes that are not found in their cell of origin, and some of these are exceptionally sensitive to drugs that target SE components (22–25). How do we take advantage of phase separation principles established in physics and chemistry to more effectively improve our understanding of this form of regulatory biology? Addressing these questions at the crossroads of physics, chemistry, and biology will require collaboration across these diverse sciences.
Supplementary Material
Acknowledgments:
We thank Wendy Salmon of the W.M Keck Microscopy Facility; Douglas Richardson and Sven Terclavers of the Harvard Center for Biological Imaging; Tom Volkert, David Reynolds, Stephen Mraz, and Sumeet Gupta of the Whitehead Genome Technologies Core for technical assistance and the Imaging Platform at the Broad Institute for assistance with CellProfiler.
Funding: The work was supported by NIH grants GM123511 (R.A.Y.) and P01-CA042063 (P.A.S.), NSF grant PHY-1743900 (A.K.C., R.A.Y, P.A.S.), Koch Institute Support (core) grant (P30-CA14051) from the NCI (P.A.S), Damon Runyon Cancer Research Foundation Fellowship (2309–17) (B.R.S.), Swedish Research Council Postdoctoral Fellowship (VR 2017–00372) (A.B.), Hope Funds for Cancer Research fellowship (B.J.A.), NSF Graduate Research Fellowship (A.V.Z.), Cancer Research Institute Irvington Fellowship (Y.E.G.), American Cancer Society New England Division Postdoctoral Fellowship PF-16–146-01-DMC (D.S.D.), and NWO Rubicon Fellowship (J.S.). Author contributions: B.R.S. and A.D. conceptualized and organized the project and wrote the manuscript. A.D., A.B., J.C.M., and Y.E.G performed cell imaging experiments and image analysis. I.A.K. and A.V.Z. generated endogenously-tagged cell lines. B.R.S. and A.B. performed ChIP-Seq. B.R.S. and E.L.C. performed in vitro droplet assays and optoIDR experiments. K.S. and B.J.A. developed and performed image analysis and produced visualization. B.J.A. produced ChIP-seq analysis and visualization. N.M.H. produced and purified recombinant proteins. A.V.Z. helped with biochemical experiments. C.H.L. performed protein amino acid analysis. D.S.D. performed ChIA-PET analysis and visualization. B.R.S., I.A.K, E.L.C., J.S. and A.V.Z. generated constructs. S.M. performed in vitro transcription assays. D.H., E.V., T.I.L., I.I.C., R.G.R, P.A.S., A.K.C. and R.A.Y. provided input into experimental design and interpretation. P.A.S., A.K.C. and R.A.Y. acquired funding for this study. T.I.L. and A.K.C. helped supervise the project. R.A.Y. conceptualized, organized and supervised the project and wrote the manuscript. All authors contributed to editing the manuscript. Competing interests: The Whitehead Institute filed a patent application based on this paper. R.A.Y. is a founder and shareholder of Syros Pharmaceuticals, Camp4 Therapeutics, and Omega Therapeutics. B.J.A. and T.I.L are shareholders of Syros Pharmaceuticals and T.I.L. is a consultant to Camp4 Therapeutics. All other authors declare no competing interests. Data and materials availability: Data sets generated in this study have been deposited in the Gene Expression Omnibus under accession number GSE112808.
Supplementary Materials
Materials and Methods
Table S1 to S3
Fig S1 to S10
References 70–82
Movie S1 to S4
One Sentence Summary: Phase-separated condensates compartmentalize the transcription apparatus at key cell identity genes.
References and Notes:
- 1.Hyman AA, Weber CA, Jülicher F, Liquid-Liquid Phase Separation in Biology. Annu. Rev. Cell Dev. Biol. 30, 39–58 (2014). [DOI] [PubMed] [Google Scholar]
- 2.Banani SF, Lee HO, Hyman AA, Rosen MK, Biomolecular condensates: organizers of cellular biochemistry. Nat Rev Mol Cell Biol. 18, 285–298 (2017). [DOI] [PMC free article] [PubMed] [Google Scholar]
- 3.Shin Y, Brangwynne CP, Liquid phase condensation in cell physiology and disease. Science. 357, eaaf4382 (2017). [DOI] [PubMed] [Google Scholar]
- 4.Brangwynne CP et al. , Germline P Granules Are Liquid Droplets That Localize by Controlled Dissolution/Condensation. Science. 324, 1729–1732 (2009). [DOI] [PubMed] [Google Scholar]
- 5.Kato M et al. , Cell-free Formation of RNA Granules: Low Complexity Sequence Domains Form Dynamic Fibers within Hydrogels. Cell. 149, 753–767 (2012). [DOI] [PMC free article] [PubMed] [Google Scholar]
- 6.Li P et al. , Phase transitions in the assembly of multivalent signalling proteins. Nature. 483, 336–340 (2012). [DOI] [PMC free article] [PubMed] [Google Scholar]
- 7.Lin Y, Protter DSW, Rosen MK, Parker R, Formation and Maturation of Phase-Separated Liquid Droplets by RNA-Binding Proteins. Molecular Cell. 60, 208–219 (2015). [DOI] [PMC free article] [PubMed] [Google Scholar]
- 8.Adelman K, Lis JT, Promoter-proximal pausing of RNA polymerase II: emerging roles in metazoans. Nature Reviews Genetics. 13, 720–731 (2012). [DOI] [PMC free article] [PubMed] [Google Scholar]
- 9.Bulger M, Groudine M, Functional and Mechanistic Diversity of Distal Transcription Enhancers. Cell. 144, 327–339 (2011). [DOI] [PMC free article] [PubMed] [Google Scholar]
- 10.Calo E, Wysocka J, Modification of Enhancer Chromatin: What, How, and Why? Molecular Cell. 49, 825–837 (2013). [DOI] [PMC free article] [PubMed] [Google Scholar]
- 11.Spitz F, Furlong EEM, Transcription factors: from enhancer binding to developmental control. Nature Reviews Genetics. 13, 613–626 (2012). [DOI] [PubMed] [Google Scholar]
- 12.Xie W, Ren B, Enhancing Pluripotency and Lineage Specification. Science. 341, 245–247 (2013). [DOI] [PubMed] [Google Scholar]
- 13.Levine M, Cattoglio C, Tjian R, Looping Back to Leap Forward: Transcription Enters a New Era. Cell. 157, 13–25 (2014). [DOI] [PMC free article] [PubMed] [Google Scholar]
- 14.Whyte WA et al. , Master Transcription Factors and Mediator Establish Super-Enhancers at Key Cell Identity Genes. Cell. 153, 307–319 (2013). [DOI] [PMC free article] [PubMed] [Google Scholar]
- 15.Hnisz D et al. , Super-enhancers in the control of cell identity and disease. Cell. 155, 934–947 (2013). [DOI] [PMC free article] [PubMed] [Google Scholar]
- 16.Dowen JM et al. , Control of Cell Identity Genes Occurs in Insulated Neighborhoods in Mammalian Chromosomes. Cell. 159, 374–387 (2014). [DOI] [PMC free article] [PubMed] [Google Scholar]
- 17.Hnisz D et al. , Activation of proto-oncogenes by disruption of chromosome neighborhoods. Science. 351, 1454–1458 (2016). [DOI] [PMC free article] [PubMed] [Google Scholar]
- 18.Ji X et al. , 3D Chromosome Regulatory Landscape of Human Pluripotent Cells. Cell Stem Cell. 18, 262–275 (2016). [DOI] [PMC free article] [PubMed] [Google Scholar]
- 19.Mansour MR et al. , Oncogene regulation. An oncogenic super-enhancer formed through somatic mutation of a noncoding intergenic element. Science. 346, 1373–1377 (2014). [DOI] [PMC free article] [PubMed] [Google Scholar]
- 20.Brown JD et al. , NF-κB Directs Dynamic Super Enhancer Formation in Inflammation and Atherogenesis. Molecular Cell. 56, 219–231 (2014). [DOI] [PMC free article] [PubMed] [Google Scholar]
- 21.Chapuy B et al. , Discovery and Characterization of Super-Enhancer-Associated Dependencies in Diffuse Large B Cell Lymphoma. Cancer Cell. 24, 777–790 (2013). [DOI] [PMC free article] [PubMed] [Google Scholar]
- 22.Lovén J et al. , Selective Inhibition of Tumor Oncogenes by Disruption of Super-Enhancers. Cell. 153, 320–334 (2013). [DOI] [PMC free article] [PubMed] [Google Scholar]
- 23.Chipumuro E et al. , CDK7 Inhibition Suppresses Super-Enhancer-Linked Oncogenic Transcription in MYCN-Driven Cancer. Cell. 159, 1126–1139 (2014). [DOI] [PMC free article] [PubMed] [Google Scholar]
- 24.Kwiatkowski N et al. , Targeting transcription regulation in cancer with a covalent CDK7 inhibitor. Nature. 511, 616–620 (2014). [DOI] [PMC free article] [PubMed] [Google Scholar]
- 25.Wang Y et al. , CDK7-Dependent Transcriptional Addiction in Triple-Negative Breast Cancer. Cell. 163, 174–186 (2015). [DOI] [PMC free article] [PubMed] [Google Scholar]
- 26.Hnisz D et al. , Convergence of developmental and oncogenic signaling pathways at transcriptional super-enhancers. Molecular Cell. 58, 362–370 (2015). [DOI] [PMC free article] [PubMed] [Google Scholar]
- 27.Jiang T et al. , Identification of multi-loci hubs from 4C-seq demonstrates the functional importance of simultaneous interactions. Nucleic Acids Research. 44, 8714–8725 (2016). [DOI] [PMC free article] [PubMed] [Google Scholar]
- 28.Proudhon C et al. , Active and Inactive Enhancers Cooperate to Exert Localized and Long-Range Control of Gene Regulation. Cell Research. 15, 2159–2169 (2016). [DOI] [PMC free article] [PubMed] [Google Scholar]
- 29.Shin HY et al. , Hierarchy within the mammary STAT5-driven Wap super-enhancer. Nat Genet. 48, 904–911 (2016). [DOI] [PMC free article] [PubMed] [Google Scholar]
- 30.Hnisz D, Shrinivas K, Young RA, Chakraborty AK, Sharp PA, A Phase Separation Model for Transcriptional Control. Cell. 169, 13–23 (2017). [DOI] [PMC free article] [PubMed] [Google Scholar]
- 31.Yang Z et al. , Recruitment of P-TEFb for Stimulation of Transcriptional Elongation by the Bromodomain Protein Brd4. Molecular Cell. 19, 535–545 (2005). [DOI] [PubMed] [Google Scholar]
- 32.Jang MK et al. , The Bromodomain Protein Brd4 Is a Positive Regulatory Component of P-TEFb and Stimulates RNA Polymerase II-Dependent Transcription. Molecular Cell. 19, 523–534 (2005). [DOI] [PubMed] [Google Scholar]
- 33.Di Micco R et al. , Control of Embryonic Stem Cell Identity by BRD4-Dependent Transcriptional Elongation of Super-Enhancer-Associated Pluripotency Genes. Cell Research. 9, 234–247 (2014). [DOI] [PMC free article] [PubMed] [Google Scholar]
- 34.Soutourina J, Wydau S, Ambroise Y, Boschiero C, Werner M, Direct Interaction of RNA Polymerase II and Mediator Required for Transcription in Vivo. Science. 331, 1451–1454 (2011). [DOI] [PubMed] [Google Scholar]
- 35.Soutourina J, Transcription regulation by the Mediator complex. Nat Rev Mol Cell Biol. 34, 77 (2017). [DOI] [PubMed] [Google Scholar]
- 36.Nott TJ et al. , Phase transition of a disordered nuage protein generates environmentally responsive membraneless organelles. Molecular Cell. 57, 936–947 (2015). [DOI] [PMC free article] [PubMed] [Google Scholar]
- 37.Pak CW et al. , Sequence Determinants of Intracellular Phase Separation by Complex Coacervation of a Disordered Protein. Molecular Cell. 63, 72–85 (2016). [DOI] [PMC free article] [PubMed] [Google Scholar]
- 38.Brangwynne CP, Mitchison TJ, Hyman AA, Active liquid-like behavior of nucleoli determines their size and shape in Xenopus laevis oocytes. Proceedings of the National Academy of Sciences. 108, 4334–4339 (2011). [DOI] [PMC free article] [PubMed] [Google Scholar]
- 39.Patel A et al. , ATP as a biological hydrotrope. Science. 356, 753–756 (2017). [DOI] [PubMed] [Google Scholar]
- 40.Kroschwald S, Maharana S, Simon A, Hexanediol: a chemical probe to investigate the material properties of membrane-less compartments. Matters. 3, e201702000010 (2017). [Google Scholar]
- 41.Lin CY et al. , Transcriptional Amplification in Tumor Cells with Elevated c-Myc. Cell. 151, 56–67 (2012). [DOI] [PMC free article] [PubMed] [Google Scholar]
- 42.Lin Y, Protter DSW, Rosen MK, Parker R, Formation and Maturation of Phase-Separated Liquid Droplets by RNA-Binding Proteins. Molecular Cell. 60, 208–219 (2015). [DOI] [PMC free article] [PubMed] [Google Scholar]
- 43.Elbaum-Garfinkle S et al. , The disordered P granule protein LAF-1 drives phase separation into droplets with tunable viscosity and dynamics. Proc. Natl. Acad. Sci. U.S.A. 112, 7189–7194 (2015). [DOI] [PMC free article] [PubMed] [Google Scholar]
- 44.Brangwynne CP, Phase transitions and size scaling of membrane-less organelles. J Cell Biol. 203, 875–881 (2013). [DOI] [PMC free article] [PubMed] [Google Scholar]
- 45.Shin Y et al. , Spatiotemporal Control of Intracellular Phase Transitions Using Light-Activated optoDroplets. Cell. 168, 159–171.e14 (2017). [DOI] [PMC free article] [PubMed] [Google Scholar]
- 46.Ozkan-Dagliyan I et al. , Formation of Arabidopsis Cryptochrome 2 Photobodies in Mammalian Nuclei APPLICATION AS AN OPTOGENETIC DNA DAMAGE CHECKPOINT SWITCH. J. Biol. Chem. 288, 23244–23251 (2013). [DOI] [PMC free article] [PubMed] [Google Scholar]
- 47.Yu X et al. , Formation of Nuclear Bodies of Arabidopsis CRY2 in Response to Blue Light Is Associated with Its Blue Light–Dependent Degradation. The Plant Cell. 21, 118–130 (2009). [DOI] [PMC free article] [PubMed] [Google Scholar]
- 48.Wei M-T et al. , Phase behaviour of disordered proteins underlying low density and high permeability of liquid organelles. Nature Chem. 9, 1118–1125 (2017). [DOI] [PMC free article] [PubMed] [Google Scholar]
- 49.Suzuki HI, Young RA, Sharp PA, Super-Enhancer-Mediated RNA Processing Revealed by Integrative MicroRNA Network Analysis. Cell. 168, 1000–1014.e15 (2017). [DOI] [PMC free article] [PubMed] [Google Scholar]
- 50.Bradner JE, Hnisz D, Young RA, Transcriptional Addiction in Cancer. Cell. 168, 629–643 (2017). [DOI] [PMC free article] [PubMed] [Google Scholar]
- 51.Ptashne M, How eukaryotic transcriptional activators work. Nature. 335, 683–689 (1988). [DOI] [PubMed] [Google Scholar]
- 52.Mitchell PJ, Tjian R, Transcriptional regulation in mammalian cells by sequence-specific DNA binding proteins. Science. 245, 371–378 (1989). [DOI] [PubMed] [Google Scholar]
- 53.Liu J et al. , Intrinsic Disorder in Transcription Factors. Biochemistry. 45, 6873–6888 (2006). [DOI] [PMC free article] [PubMed] [Google Scholar]
- 54.Xie H et al. , Functional Anthology of Intrinsic Disorder. 1. Biological Processes and Functions of Proteins with Long Disordered Regions. J. Proteome Res. 6, 1882–1898 (2007). [DOI] [PMC free article] [PubMed] [Google Scholar]
- 55.Banani SF et al. , Compositional Control of Phase-Separated Cellular Bodies. Cell. 166, 651–663 (2016). [DOI] [PMC free article] [PubMed] [Google Scholar]
- 56.Beagrie RA et al. , Complex multi-enhancer contacts captured by genome architecture mapping. Nature. 295, 1306 (2017). [DOI] [PMC free article] [PubMed] [Google Scholar]
- 57.Rao SSP et al. , Cohesin Loss Eliminates All Loop Domains. Cell. 171, 305–320.e24 (2017). [DOI] [PMC free article] [PubMed] [Google Scholar]
- 58.Cho W-K et al. , RNA Polymerase II cluster dynamics predict mRNA output in living cells. Elife. 5, 1123 (2016). [DOI] [PMC free article] [PubMed] [Google Scholar]
- 59.Larson AG et al. , Liquid droplet formation by HP1α suggests a role for phase separation in heterochromatin. Nature. 547, 236–240 (2017). [DOI] [PMC free article] [PubMed] [Google Scholar]
- 60.Strom AR et al. , Phase separation drives heterochromatin domain formation. Nature. 547, 241–245 (2017). [DOI] [PMC free article] [PubMed] [Google Scholar]
- 61.Feric M et al. , Coexisting Liquid Phases Underlie Nucleolar Subcompartments. Cell. 165, 1686–1697 (2016). [DOI] [PMC free article] [PubMed] [Google Scholar]
- 62.Harmon TS, Holehouse AS, Rosen MK, Pappu RV, Intrinsically disordered linkers determine the interplay between phase separation and gelation in multivalent proteins. Elife. 6, e30294 (2017). [DOI] [PMC free article] [PubMed] [Google Scholar]
- 63.Riback JA et al. , Stress-Triggered Phase Separation Is an Adaptive, Evolutionarily Tuned Response. Cell. 168, 1028–1040.e19 (2017). [DOI] [PMC free article] [PubMed] [Google Scholar]
- 64.Boeynaems S et al. , Phase Separation of C9orf72 Dipeptide Repeats Perturbs Stress Granule Dynamics. Molecular Cell. 65, 1044–1055.e5 (2017). [DOI] [PMC free article] [PubMed] [Google Scholar]
- 65.Brady JP et al. , Structural and hydrodynamic properties of an intrinsically disordered region of a germ cell-specific protein on phase separation. Proceedings of the National Academy of Sciences. 114, E8194–E8203 (2017). [DOI] [PMC free article] [PubMed] [Google Scholar]
- 66.Patel A et al. , A Liquid-to-Solid Phase Transition of the ALS Protein FUS Accelerated by Disease Mutation. Cell. 162, 1066–1077 (2015). [DOI] [PubMed] [Google Scholar]
- 67.Molliex A et al. , Phase Separation by Low Complexity Domains Promotes Stress Granule Assembly and Drives Pathological Fibrillization. Cell. 163, 123–133 (2015). [DOI] [PMC free article] [PubMed] [Google Scholar]
- 68.Jain A, Vale RD, RNA phase transitions in repeat expansion disorders. Nature. 8, 129 (2017). [DOI] [PMC free article] [PubMed] [Google Scholar]
- 69.Malik S, Roeder RG, in Nuclear Receptors (Elsevier, 2003), vol. 364 of Methods in Enzymology, pp. 257–284. [DOI] [PubMed] [Google Scholar]
- 70.Albini S et al. , Brahma is required for cell cycle arrest and late muscle gene expression during skeletal myogenesis. EMBO Rep 16, 1037–1050 (2015). [DOI] [PMC free article] [PubMed] [Google Scholar]
- 71.Schindelin J et al. , Fiji: an open-source platform for biological-image analysis. Nat Methods 9, 676–682 (2012). [DOI] [PMC free article] [PubMed] [Google Scholar]
- 72.Baddeley A, Rubak E, Turner R, Spatial Point Patterns: Methodology and Applications with R. Chapman and Hall/CRC Press, (2015). [Google Scholar]
- 73.Sprague BL, Pego RL, Stavreva DA, McNally JG, Analysis of binding reactions by fluorescence recovery after photobleaching. Biophys J 86, 3473–3495 (2004). [DOI] [PMC free article] [PubMed] [Google Scholar]
- 74.Mazza D, Abernathy A, Golob N, Morisaki T, McNally JG, A benchmark for chromatin binding measurements in live cells. Nucleic Acids Res 40, e119 (2012). [DOI] [PMC free article] [PubMed] [Google Scholar]
- 75.Trapnell C, Pachter L, Salzberg SL, TopHat: discovering splice junctions with RNA-Seq. Bioinformatics 25, 1105–1111 (2009). [DOI] [PMC free article] [PubMed] [Google Scholar]
- 76.Wang L, Wang S, Li W, RSeQC: quality control of RNA-seq experiments. Bioinformatics 28, 2184–2185 (2012). [DOI] [PubMed] [Google Scholar]
- 77.Langmead B, Trapnell C, Pop M, Salzberg SL, Ultrafast and memory-efficient alignment of short DNA sequences to the human genome. Genome Biol 10, R25 (2009). [DOI] [PMC free article] [PubMed] [Google Scholar]
- 78.Zhang Y et al. , Model-based analysis of ChIP-Seq (MACS). Genome Biol 9, R137 (2008). [DOI] [PMC free article] [PubMed] [Google Scholar]
- 79.Kent WJ et al. , The human genome browser at UCSC. Genome Res 12, 996–1006 (2002). [DOI] [PMC free article] [PubMed] [Google Scholar]
- 80.Quinlan AR, Hall IM, BEDTools: a flexible suite of utilities for comparing genomic features. Bioinformatics 26, 841–842 (2010). [DOI] [PMC free article] [PubMed] [Google Scholar]
- 81.Li H et al. , The Sequence Alignment/Map format and SAMtools. Bioinformatics 25, 2078–2079 (2009). [DOI] [PMC free article] [PubMed] [Google Scholar]
- 82.Mootha VK et al. , PGC-1alpha-responsive genes involved in oxidative phosphorylation are coordinately downregulated in human diabetes. Nat Genet 34, 267–273 (2003). [DOI] [PubMed] [Google Scholar]
Associated Data
This section collects any data citations, data availability statements, or supplementary materials included in this article.