

Abstract
Antiretroviral therapy (ART) during the earliest stage of acute HIV infection (Fiebig I) might minimize establishment of a latent HIV reservoir and thereby facilitate viremic control after analytical treatment interruption (ATI). We show that 8 participants, who initiated treatment during Fiebig I and were treated for a median of 2.8 years, all experienced rapid viral load rebound following ATI, indicating that additional strategies are required to control or eradicate HIV.
HIV latency is established during acute HIV infection in long-lived CD4+ T cells and other cell types in blood and tissue sanctuaries1–3. These reservoirs pose a major obstacle to HIV remission (i.e. viremic control without ART). Despite viral suppression by ART, most individuals experience viral load (VL) rebound within 2-4 weeks of stopping ART. HIV remission appears more common in a limited numbers of early treated individuals analyzed4. Fiebig I stage corresponds to the first 2 weeks following infection when HIV nucleic acid is detected in the absence of p24 antigen (viral capsid core protein) and HIV seroconversion. The brevity of this period and non-reactivity to HIV serology tests means that HIV is rarely diagnosed in Fiebig I. Treatment in these individuals can lead to preserved immunity, remarkably low HIV reservoir size and no seroconversion5,6, but its impact on post-treatment control is unknown. This study evaluated viremic control after ATI in Fiebig I treated individuals, and had planned to enroll 15 participants in 2 stages: 8 in stage 1 and 7 in stage 2. It was stopped after stage 1 when 0 of 8 participants met the viremic control end point (Supplementary Fig. 1). This study provides proof-of-concept that VL rebound will occur despite very early and fully suppressive ART. The sample size of 8 participants did not preclude a rate of control below 30%.
At enrollment, there were 7 men and 1 woman with a median age of 29 years, ART duration of 2.8 years, CD4+ T count of 577 cells/mm3 and suppressed VL (Supplementary Table 1). All had been on efavirenz-based ART and switched efavirenz to darunavir/ritonavir 4 weeks prior to ATI to limit resistance to that drug class. No participant achieved VL <50 copies/ml at 24 weeks post-ATI. All resumed ART following two VL >1,000 copies/ml, ranging 1-2 days apart per protocol. VL rebound, defined as VL >20 copies/ml, was observed at a median of 26 days (range 13-48 days) (Fig. 1a and Supplementary Fig. 2). Single copy VL assay (SCA) on samples with VL<20 copies/ml showed VL<0.45 copies/ml at baseline in all participants, and two had detectable SCA during ATI prior to VL rebound (Supplementary Fig. 3).
Figure 1.
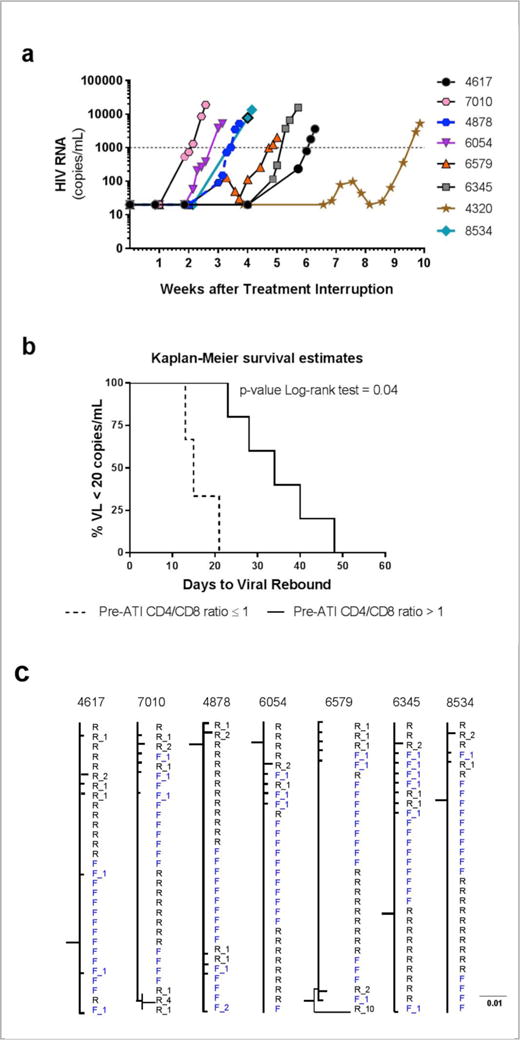
Viral load (VL) rebound following ATI in eight Fiebig I acutely treated participants. (a) Median (range) time to VL rebound >20 copies/ml was 26 (13-48) days. (b) Pre-ATI peripheral blood CD4+ T/CD8 ratio ≤1 was associated with faster time to VL rebound >20 copies/ml after ATI. (c) HIV-1 phylogenetic trees based on pro- rt sequences sampled in acute infection (F, gray) and following VL rebound (R, black). The number of mutations away from the founder consensus is figured as a suffix.
CD4+ T/CD8 ratio ≤ 1 was associated with faster time to VL rebound in a study of early treated people7. We also observed this in treated Fiebig I individuals (Fig. 1b). The median CD4+ T change at ART resumption was -9 (range -87 to 39) cells/mm3. No participant had acute retroviral syndrome, HIV-related symptoms or new drug resistance mutations (Supplementary Analyses and Supplementary Table 2). VL was <50 copies/ml in all participants by a median of 17 days (range 9-63) after ART resumption.
Phylogenetic analyses showed that sequences at time of ART initiation in acute infection and at ART resumption following VL rebound were intermingled in the trees, with no evidence of distinct sub-clusters (Fig. 1c and Supplementary Fig. 4a to 4c). Different sequence analyses suggest that VL rebound resulted from production of viral particles from latently infected cells (Supplementary analyses), supporting the survival and/or clonal expansion of latently infected CD4+ T cells during ART8,9.
The frequencies of blood CD4+ T cells harboring total HIV DNA were low pre-ART (median 66 copies/106 CD4+ T, interquartile range [IQR] 22-281) and pre-ATI (median 1 copy/106 CD4+ T, IQR 1-3) (Fig. 2a). Prior to ATI, our participants had an estimated ~ 2×10⁶ CD4+ T cells that harbor HIV DNA in the whole body. Total HIV DNA increased to a median of 17 copies/106 CD4+ T (IQR 6-60) at the time of ART resumption (p=0.03 compared to pre-ATI). However, 6 months after resuming ART, total HIV DNA returned to a median of 3 copies/106 CD4+ T (IQR 2-10) similar to pre-ATI levels (p=0.33) (Fig. 2a), demonstrating safety of this ATI strategy with a short duration of viremia. Individual participants’ total and integrated HIV DNA showed similar patterns and returned to approximate pre-ATI values (Supplementary Fig. 5). Inducible HIV RNA by the Tat/rev Induced Limiting Dilution Assay showed pre-ATI levels below the detection limit of 1.4 cells producing tat/rev mRNA/106 CD4+ T cells in all participants.
Figure 2.
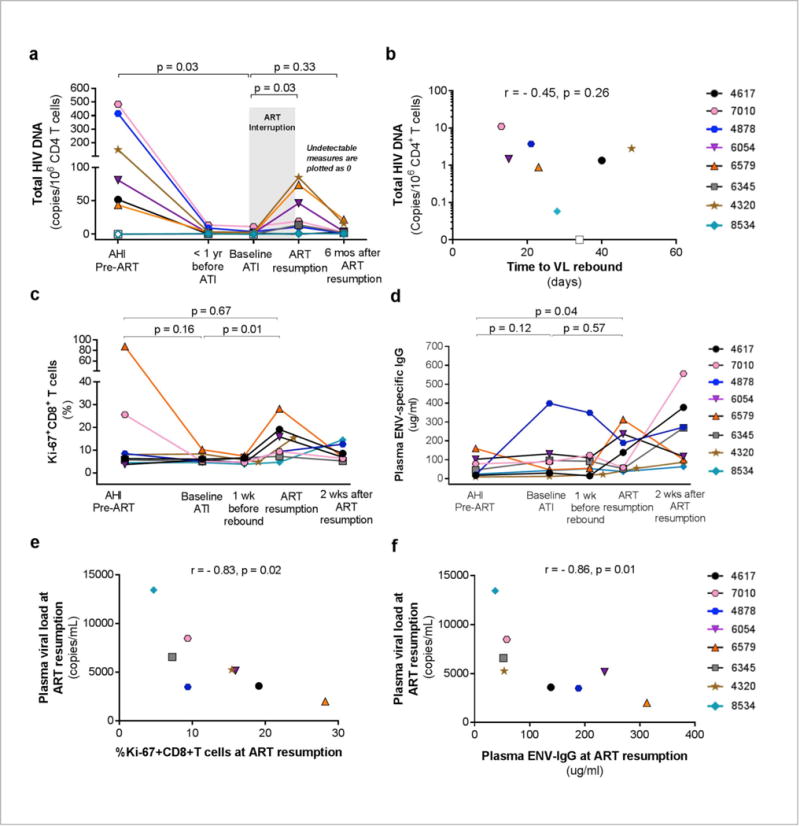
Longitudinal HIV reservoir markers and immune responses. (a) Frequencies of peripheral blood CD4+ T cells harboring total HIV DNA after ART resumption were not different to baseline values. (b) Total HIV DNA in CD4+ T cells prior to ATI was not significantly associated with time to VL rebound > 20 copies/ml post-ATI. Open symbols depict levels below the limit of detection of the assay. (c) Effector Ki67+CD8+ T cells expanded rapidly following VL rebound in all participants. (d) Envelope (ENV)-specific IgG levels were higher following VL rebound in 4 of 8 participants (4617, 6054, 6579, 4320). (e) The frequencies of Ki67+CD8+ T cells and (f) plasma ENV-IgG levels were negatively associated with the highest observed viral load levels at ART resumption.
In this small study, there was no association between pre-ATI total HIV DNA and time to VL rebound10 (Fig. 2b). Similarly, pre-ATI integrated HIV DNA and 2-LTR circles which reflect HIV reservoir maintenance and putatively residual replication, respectively, did not predict time to VL rebound, nor did any of the HIV reservoir markers (total and integrated HIV DNA, 2LTR circles) assessed at pre-ART (Supplementary Fig. 6a to 6c). A very low frequency of HIV-infected memory CD4+ T cells at time of ART resumption was observed among the four participants assessed, with LTR or gag RNA+ cells present at 0.001-0.01% (Supplementary Fig. 7a and 7b). HIV DNA content in mucosal mononuclear cells from sigmoid tissue (n=3) was also low at pre-ATI and at ART resumption (Supplementary analyses). HIV RNA+ and HIV DNA+ cells in inguinal lymph node tissue were detected by in situ hybridization in participant 4878 who consented to the biopsy at both pre-ATI and at ART resumption (vRNA+ cells 1.8×10⁵ and 2.4×10⁵ cells/gram and vDNA+ cells 4.2×10⁵ and 5.1×10⁵ cells/gram, respectively) (Supplementary Fig. 8a to 8d). The finding of vRNA+ cells during suppressive ART suggests ongoing virus production in the lymph node. HIV DNA content and Ki67+CD8+ cells are shown in Supplementary analyses and Supplementary Fig. 9a and 9b.
Reactivation of a single latently infected cell can lead to VL rebound in the absence of ART. One mathematical model postulates that control of viremia may depend on the strength of cytotoxic T lymphocytes (CTLs) and the size of the HIV reservoir11. We posit that the rapid VL rebound observed in this study was due to the inability to achieve a small enough pool of latently infected cells12 particularly in lymphoid tissues13 and inadequate immune control11. The reservoir in acute HIV infection may also be enriched in replication competent viruses facilitating viral rebound14. We previously reported that CTLs generated in Fiebig I are less abundant and differentiated than in later stages, but retain greater memory and survival potential6. We therefore investigated persistence and recall of memory immune responses during ART and post-ATI. In three participants expressing HLA-A11, the memory HIV-specific CTLs quantified longitudinally by tetramer staining6 persisted at low levels years after suppressive ART, and their expansion occurred faster following VL rebound than in AHI (Supplementary Fig. 10a to 10d). In all participants, there was a rapid expansion of effector Ki67+CD8+ T cells at ART resumption (median 12.4%) to frequencies higher than those at baseline ATI (median 5.4%, p value=0.01) (Fig. 2c). Env-specific IgG level was higher at ART resumption than in acute infection in 7 of 8 participants (median 98 vs. 34 μg/ml, p=0.04) (Fig. 2d). Four of these 7 had increased levels from baseline ATI to ART resumption (median 37.8 to 187.2 μg/ml, p =0.07) and seroconverted after ATI (Supplementary Fig. 11), suggesting a memory B cell response. Prior to ART resumption, the highest observed plasma VL levels were negatively associated with the frequency of effector Ki67+CD8+ T cells (r=−0.83, p=0.02; Fig 2e) and Env-specific IgG levels (r=−0.86, p=0.01; Fig. 2f). It is therefore possible that pre-ATI immune responses were “too little too late” to affect time to VL rebound, but were sufficient to affect the magnitude of viremia once expansion of HIV-specific CD8 T cells and secretion of Env-specific IgG occurred. Our stringent ART resumption criterion based on VL precluded assessing the effects of early ART on spontaneous VL re-suppression after rebound. Sneller et al. demonstrated that an initial sustained viremia (highest VL 103 to 107 copies/ml) was followed by VL <40 copies/ml in 2 of 15 (13%) early treated participants at 10 months post-ATI15. The optimal design and conduct of ATI trials is unknown, but can be informed by ongoing dialogues between researchers, the community, ethicists, social scientists and regulatory bodies.
Our study documented that in 8 participants, ART initiated in Fiebig I did not prevent VL rebound. Regardless of timing of ART, future research should aim to eliminate cells with replication competent HIV in blood and tissues through augmenting immune responses (for example, through the administration of latency reversal or immune adjuvant agents, broadly neutralizing antibodies (bNAbs), therapeutic vaccines or cell-based therapies)16. Early administration of immune interventions during acute infection should be explored as demonstrated in macaques to improve VL control17,18. Limited viral escape in acutely treated individuals may enhance the responses to such interventions. Combination therapies (e.g. multiple bNAbs and immune modulators) should be investigated as single bNAb administration in acutely and chronically treated people did not substantially delay VL rebound19.
ONLINE METHODS
The RV411 study (clinicaltrials.gov NCT02614950) included eight consenting participants who initiated antiretroviral therapy (ART) during Fiebig I acute HIV infection in the RV254 cohort in Thailand (clinicaltrials.gov NCT00796146)20, and had been on ART for ≥96 weeks. Inclusion criteria included VL <50 copies/ml for at least 48 weeks, integrated HIV DNA in peripheral blood mononuclear cells (PBMCs) of <10 copies/106 PBMCs, and CD4+ T cell of ≥ 400 cells/mm3. Exclusion criteria were pregnancy, breastfeeding, untreated syphilis, hepatitis B or C infection, active drug or alcohol use, or serious medical or psychiatric condition that could interfere with study participation. They were staged for acute HIV infection at time of ART initiation according to Fiebig et al21 Fiebig I is defined as HIV RNA+, p24 antigen-, HIV IgM-).
The participants underwent analytical treatment interruption (ATI) at baseline and were followed for 24 weeks or until they reached ART resumption criteria. ART resumption criteria included confirmed VL >1,000 copies/ml, VL rise of ≥0.5 log10copies/ml per day provided that the last VL was >1,000 copies/ml, a single VL >10,000 copies/ml, confirmed CD4+ T cell <350 cells/mm3, CD4+ T cell count decline >50% from baseline prior to ATI, acute retroviral syndrome, clinical progression to CDC category B or C disease, pregnancy or request by the participant. The study planned to enroll 15 participants in 2 stages: 8 in stage 1 and 7 in stage 2. However, this study did not reach the criterion to proceed to stage 2 of at least 1 participant in stage 1 achieving VL <50 copies/ml at 12 weeks post-ATI (Supplementary Fig. 1 and Life Sciences Reporting Summary).
The primary objective was to determine if the rate of sustained viral suppression <50 copies/ml was significantly higher than 5% at 24 weeks after ATI. Specifically, we hypothesized that ≥30% would maintain plasma VL <50 copies/ml at 24 weeks post- ATI. Assessment of safety, time to ART resumption, VL kinetics, HIV DNA reservoir and HIV-specific immune responses constituted secondary objectives. Optional sigmoid and lymph node biopsies were performed in willing participants at baseline ATI and/or prior to ART resumption. The study was approved by the Institutional Review Boards of Chulalongkorn University in Thailand, the University of Montreal in Canada, and the Walter Reed Army Institute of Research in the USA. The study received non-human subject research determination from Drexel University and the National Institutes of Health in the USA. The investigators have adhered to the policies for protection of human participants as prescribed in AR-70.
All RV411 participants were on efavirenz-based regimens prior to enrollment in the study, while some participants also received raltegravir and maraviroc during the first 24 weeks of ART in the RV254 study. Efavirenz was replaced with darunavir/ritonavir 4 weeks prior to ATI to limit the risk for development of genotypic resistance to the non-nucleoside reverse transcriptase inhibitor drug class (Supplementary Table 1).
Measurement of HIV RNA
Quantitative plasma VL by the COBAS® Taqman HIV-1 Test with a limit of detection of 20 copies/ml (Roche Diagnostics, Branchburg, New Jersey, USA) was monitored weekly except from weeks 2 to 6, when it was monitored twice weekly. In order to alleviate participants’ discomfort, qualitative nucleic acid testing (Aptima HIV-1 RNA Qualitative Assay, Hologic, Inc, San Diego, CA) by finger stick was also used during the twice weekly monitoring and at weekly monitoring visits when venapuncture was not required for additional laboratory testing. Any positive Aptima was confirmed with quantitative VL.
For single copy HIV RNA, 3ml of plasma was assayed using HMMCgag primers and probes optimized for CRF01_AE clade22 with a limit of detection of 0.45 copies/ml according to methods previously described23.
HIV genotyping
HIV genotyping was performed to detect mutations in the reverse transcriptase (RT) and protease (PR) genes at pre-ART and at time of ART resumption following ATI. TRUGENE (Siemens Healthcare Diagnostics, Bayswater, Victoria, Australia) was used for the pre-ART samples of 3 participants (4617, 7010, 8534). All other genotype testing used a validated in-house method as previously described24. Genotype sequences were analyzed using the Stanford University Drug Resistance Database25.
HIV sequencing
HIV-1 pro-RT (HXB2 corresponding numbers 2071 - 3870) and envelope gp160 (5956 - 9089) were amplified from plasma RNA following our previously described single genome amplification strategy26 adapted from Salazar-Gonzalez27. A nested PCR strategy was employed with primers specific for CRF01_AE and subtype B. cDNA synthesis was performed using JL68Rv2 (CTT CTT CCT GCC ATR KGA RAT GCC TAA G) for pro-RT and oligodT20 for gp160. First round primers were polRT2071F (GAR AGR CAG GCT AAT TTT TTA GG) and polG_AGrev (TRT CTA CTT GTT CAT TTC CYC C) for pro-RT; polK3 (TAA ARY TAG CAG GAA GAT GGC CAG T) and uninef7 (GCA CTC AAG GCA AGC TTT ATT GAG GCT T) for gp160. Second round primers were polRT2071F (GAR AGR CAG GCT AAT TTT TTA GG) and polRT3870R (CTA TTR GCT GCC CCA TCT ACA TA) for pro-RT, JL68 (CTT AGG CAT CTC CTA TGG CAG GAA GAA G) and JL89 (TCC AGT CCC CCC TTT TCT TTT AAA AA) for gp160.
Measurements of HIV DNA and TILDA in blood and tissues
Total and integrated HIV DNA were measured in CD4+ T cells enriched from PBMCs (StemCell) using a nested PCR for LTR-gag designed to amplify the clades circulating in Thailand, with a sensitivity of 1 copy per PCR reaction28. Multiple replicates were performed and average total numbers of 1.2×10⁶ cells (range = 1.4×10⁵ to 9.6×10⁶ cells) and 1.4×10⁵ cells (range = 4.5×10⁴ to 4.3×10⁵ cells) were analyzed for determinations of total and integrated HIV DNA, respectively. Larger number of cells from the baseline time points were used for quantification of total HIV DNA (mean 2.5×10⁶ (range = 1.1×10⁶ to 5.1×10⁶ cells). Total number of infected cells in the peripheral blood was estimated by taking into account the frequency of CD4+ T cells and assuming a total number of CD4+ T cells of 202.5×10⁹ cells in the body. HIV DNA in mucosal mononuclear cells (MMCs) from sigmoid tissue obtained from four participants and lymph node mononuclear cells (LNMCs) obtained from inguinal lymph node tissue from one participant was performed using the same method.
Tat/rev Induced Limiting Dilution Assay (TILDA) was performed as previously described with modifications of the primers and probes for efficient amplification of tat/rev from the A/E subtype29. tat1.4AE (TGG CAG GAA GAA GCG GAA G) and revAE (TGT CTC TGY CTT GCT CKC CAC C) were used for reverse transcription and pre-amplification. tat2AE (GCA GTA AGG ATC ATC AAA ATC CTA TAC CAG AGC A), revAE and probe MSHIVFAMzenAE (56-FAM/TTC YTT CGG/ZEN/GCC TGT CGG GTT CC/3IABkFQ) were used for the real-time PCR.
Measurements of HIV RNA+ and HIV DNA+ cells in inguinal lymph node tissue (LT)
Using HIV-specific riboprobes and in situ hybridization (ISH), HIV RNA-positive and HIV DNA-positive cells in lymph nodes were quantified by quantitative image analysis as previously described30.
Measurements of frequencies of HIV RNA+ CD4+ T memory T cells
CD4+ T memory (CR45RO+CD45RA-) T cells were FACS sorted directly ex vivo into 200- 400 replicate 1000-cell wells (n=2-4E+5 cells analyzed) for One-step Real-Time RT-PCR cDNA synthesis and pre-amplification as previously described31 (ThermoFisher). In addition to antibodies listed above, cells were stained with CD3-BV711 (clone UCHT1), CD14-BV510 (clone M5E2), CD16-BV510 (clone 3G8), CD20-BV510 (clone 2H7), CD45RO-BV650 (clone UCHL1), all BioLegend, and CD45RA-FITC (clone HI100, BD Biosciences). Quantitation of HIV genes was performed by qPCR. The frequency of 1000-cell replicate wells positive for any viral gene was <1%. Therefore a positive well was unlikely to contain more than one positive cell and thus was counted as a single positive cell. Kit lysis does not efficiently extract nucleic acid residing in the nucleus, as measured by Alu-LTR detection of integrated viral DNA32. As such we interpret the qPCR values for gag and LTR to reflect cytoplasmic nucleic acid, which is expected to be predominantly RNA, but may include unintegrated proviral DNA as well. The env assay is specific for spliced RNA as the probe spans the splice junction. qPCR oligo sequences were as follows: LTR (adapted from28) F: CTG GGT CTC TCT DGT TAG AC, R: CTG AGG GAT CTC TAG TTA CC, P: CAC TCA AGG CAA GCT TTA TTG AGG C; gag F: CAT TAG AAG ARA TGA TGA CAG CAT, R: GCT CAT TGC CTC RGC YAA AAC, P: AGT RGG AGG ACC TRG CCA TAA RGC AAG; env F: CTG MGG TGC ACA CAG CAA GA, R: GAG GAG KTC YTC GTC GGT G, P: TTC CGC TTC TTC CAG TCG CCG CTC T.
Antibodies and reagents for flow cytometry
Alexa Fluor 700-labeled anti-CD3, BUV496-labeled anti-CD4, allophycocyanin H7-labeled anti-CD45RA, and BUV395-labeled anti-Ki-67 were obtained from BD Biosciences. BV785-labeled anti-CD8, BV650-labeled anti-CD127, and Pacific Blue-labeled anti-Perforin came from BioLegend. Foxp3/Transcription Factor Staining Buffer Set was from eBioscience. HLA-A*1101 HIV-1 NEF (GAFDLSFFLK) soluble biotinylated monomers were produced at Chulalongkorn University (Bangkok, Thailand) as previously described33 and tetramerized with PE-conjugated extravidin (Sigma-Aldrich). LIVE/DEAD Fixable Aqua Dead Cell Stain Kit (LIVE/DEAD) was from Thermo Fisher Scientific (Molecular Probes).
Flow cytometry analysis
For general phenotyping, thawed PBMCs and LNMCs were first stained with LIVE/DEAD at RT for 10 minutes then cell surface markers at 4°C for 20 minutes. They were washed with PBS containing 2% fetal bovine serum (washing buffer) twice, and then fixed and permeabilized with Foxp3/Transcription Factor Staining Buffer Set. The cells were stained with anti-Ki-67 and anti-Perforin mAbs at room temperature for 30 minutes followed by 2 times wash with Foxp3 permeabilization buffer and washing buffer, respectively. For phenotypic analysis on antigen specific CD8+ T cells, thawed PBMCs were first stained with PE-labeled pMHC tetramer at 37°C for 15 minutes. The cells were stained for the other cell surface markers at 4°C for 20 minutes followed by 2 times wash with washing buffer. The cells were fixed/permeabilized and stained for Ki-67 and Perforin as mentioned earlier. All the stained cells were resuspended in PBS containing 2% formaldehyde before analysis on LSRII (BD Biosciences). All the flow cytometry data were analyzed with FlowJo v10 (FlowJo, LLC) (Supplementary Figure 12).
Plasma IgG Analyses
Total and HIV-specific IgG was measured by ELISA as previously described34,35. Human HIV immunoglobulin was used for the HIV ELISA standard curve, and was obtained through the NIH AIDS Research and Reference Reagent Program, Division of AIDS, NIAD, NIH (Cat no. 3957). OD values were read at 450nm using a multimode plate reader (Synergy HTX, BioTek).
Statistics
Time to VL rebound was calculated from the treatment interruption date to the date of first quantitative VL detection above 20 copies/ml. The Kaplan-Meier estimator was used to describe time to viral rebound. Survival functions of Fiebig I, Fiebig III and HIV- Chronic participants were compared using log-rank test. The same method was applied to compare CD4+ T/CD8 ratio groups. Plasma VL during rebound was compared to the values at baseline using Wilcoxon-signed rank test. The same statistics were used for other continuous endpoints. Correlation between days to viral rebound and continuous endpoints was done using Spearman’s correlation. Analyses were performed using Stata Statistical Software Release 13 (StataCorp, College Station, TX, USA) and GraphPad Prism version 7.00 for Windows, GraphPad Software, La Jolla California USA, www.graphpad.com.
GenBank Accession
The sequences reported in this paper have been deposited in GenBank as MF957336-MF957707. Request for access to other data should be done through the corresponding author to obtain appropriate institutional permission.
Supplementary Material
Acknowledgments
We are grateful to the participants who have made this research possible. We thank Dr. T. Schacker for providing data on the lymph node from one participant. This work was supported by the NIH grant R01AI108433 a cooperative agreement (W81XWH-07-2- 0067) between the Henry M. Jackson Foundation for the Advancement of Military Medicine, Inc., and the U.S. Department of Defense (DoD), and by the Division of AIDS, the U.S. National Institute of Allergy and Infectious Diseases, and by an intramural grant from the Thai Red Cross AIDS Research Center. The US Army Medical Research Acquisition Activity (820 Chandler Street, Fort Detrick, MD 21702-5014, USA) is the awarding and administering acquisition office for the cooperative agreement. It is also supported in part with federal funds from the National Cancer Institute, National Institutes of Health, under Contract No. HHSN261200800001E. Antiretroviral therapy was supported by the Thai Government Pharmaceutical Organization, Gilead, Merck and ViiV Healthcare.
The RV411 Study Group: from Thai Red Cross AIDS Research Centre: P. Phanuphak, N. Teeratakulpisarn, S. Chottanapund, M. de Souza, J. Fletcher, P. Tantivitayakul, P. Eamyoung, D. Sutthichom, P. Prueksakaew, S. Rattanamanee, S. Puttamaswin, S. Tipsuk, K. Benjapornpong, N. Ratnaratorn, C. Munkong, K., Tanjnareel, R. Kanaprach; from Chulalongkorn University: R. Rerknimitr, P. Wattanaboonyongcharoen, P. Rojnuckarin, S. Manasnayakorn; from Armed Forces Research Institute of Medical Sciences: A. Schuetz, S. Akapirat, B. Nuntapinit, N. Tantibul, H. Savadsukm, Y. PhuangNgern, S. Jongrakthaitae, W. Chuenaron, N. Churikanont, S. Getchalarat; from Military HIV Research Program: S. Krebs, B. Slike, A. Tokarev, E. Sanders-Buell, M. Bose, C. Ogega, J. Buahen, M. Ouellette, C. McCullough, O. Butterworth, E. Turk, L.A. Eller, M. Milazzo, J. Mitchell, C. Subra, N. Lima, J. Garnett, F. Fatmi, A. Sy, N. Dawson; from Yale: S. Spudich; from University of California San Francisco: V. Valcour; from NIH: F. Maldarelli, I. Sereti; from Frederick National Laboratory for Cancer Research: J. Lifson; from University of Minnesota: T. Schacker; from Université de Montréal: R. Fromentin; from EMMES: P. Dawson.
Footnotes
Disclaimer: The views expressed are those of the authors. The content of this publication does not necessarily reflect the views or policies of the Department of Health and Human Services, U.S. Army or Department of Defense, nor does mention of trade names, commercial products, or organizations imply endorsement by the U.S. Government including the U.S. National Institutes of Health.
AUTHOR CONTRIBUTIONS
DC, EK, LF, TC, ROC, JHK, NLM, MLR, NP and JA designed the study. SP designed and performed the statistical analyses. LT, LL, AP, MR, HT, SB, RM, EKH, ST, SU, DLB, BAF, RG, TS, RT and NChomont designed and performed the laboratory experiments. DC and JA led the study, with support from EK, JI and NChomchey in managing the study. JA drafted the manuscript. All authors reviewed the manuscript, provided feedback, and approved the manuscript in its final form.
COMPETING FINANCIAL INTERESTS
TC has received a speaker’s fee from Gilead. JA has received honorarium for participating in advisory meetings from Merck, Roche, AbbVie and ViiV Healthcare. All other authors declare no competing financial interests.
MANUSCRIPT REFERENCES
- 1.Finzi D, et al. Identification of a reservoir for HIV-1 in patients on highly active antiretroviral therapy. Science (New York, NY) 1997;278:1295–1300. doi: 10.1126/science.278.5341.1295. [DOI] [PubMed] [Google Scholar]
- 2.Chun TW, et al. Presence of an inducible HIV-1 latent reservoir during highly active antiretroviral therapy. Proceedings of the National Academy of Sciences of the United States of America. 1997;94:13193–13197. doi: 10.1073/pnas.94.24.13193. [DOI] [PMC free article] [PubMed] [Google Scholar]
- 3.Chomont N, et al. HIV reservoir size and persistence are driven by T cell survival and homeostatic proliferation. Nat Med. 2009;15:893–900. doi: 10.1038/nm.1972. [DOI] [PMC free article] [PubMed] [Google Scholar]
- 4.Saez-Cirion A, et al. Post-treatment HIV-1 controllers with a long-term virological remission after the interruption of early initiated antiretroviral therapy ANRS VISCONTI Study. PLoS pathogens. 2013;9:e1003211. doi: 10.1371/journal.ppat.1003211. [DOI] [PMC free article] [PubMed] [Google Scholar]
- 5.Schuetz A, et al. Initiation of ART during early acute HIV infection preserves mucosal Th17 function and reverses HIV-related immune activation. PLoS pathogens. 2014;10:e1004543. doi: 10.1371/journal.ppat.1004543. [DOI] [PMC free article] [PubMed] [Google Scholar]
- 6.Takata H, et al. Delayed differentiation of potent effector CD8+ T cells reducing viremia and reservoir seeding in acute HIV infection. Sci Transl Med. 2017;9 doi: 10.1126/scitranslmed.aag1809. [DOI] [PMC free article] [PubMed] [Google Scholar]
- 7.Hurst J, et al. Immunological biomarkers predict HIV-1 viral rebound after treatment interruption. Nature communications. 2015;6:8495. doi: 10.1038/ncomms9495. [DOI] [PMC free article] [PubMed] [Google Scholar]
- 8.Simonetti FR, et al. Clonally expanded CD4+ T cells can produce infectious HIV-1 in vivo. Proceedings of the National Academy of Sciences of the United States of America. 2016;113:1883–1888. doi: 10.1073/pnas.1522675113. [DOI] [PMC free article] [PubMed] [Google Scholar]
- 9.Wagner TA, et al. HIV latency. Proliferation of cells with HIV integrated into cancer genes contributes to persistent infection. Science (New York, NY) 2014;345:570–573. doi: 10.1126/science.1256304. [DOI] [PMC free article] [PubMed] [Google Scholar]
- 10.Williams JP, et al. HIV-1 DNA predicts disease progression and post-treatment virological control. Elife. 2014;3:e03821. doi: 10.7554/eLife.03821. [DOI] [PMC free article] [PubMed] [Google Scholar]
- 11.Conway JM, Perelson AS. Post-treatment control of HIV infection. Proceedings of the National Academy of Sciences of the United States of America. 2015;112:5467–5472. doi: 10.1073/pnas.1419162112. [DOI] [PMC free article] [PubMed] [Google Scholar]
- 12.Hill AL, Rosenbloom DI, Fu F, Nowak MA, Siliciano RF. Predicting the outcomes of treatment to eradicate the latent reservoir for HIV-1. Proceedings of the National Academy of Sciences of the United States of America. 2014;111:13475–13480. doi: 10.1073/pnas.1406663111. [DOI] [PMC free article] [PubMed] [Google Scholar]
- 13.Rothenberger MK, et al. Large number of rebounding/founder HIV variants emerge from multifocal infection in lymphatic tissues after treatment interruption. Proceedings of the National Academy of Sciences of the United States of America. 2015;112:E1126–1134. doi: 10.1073/pnas.1414926112. [DOI] [PMC free article] [PubMed] [Google Scholar]
- 14.Bruner KM, et al. Defective proviruses rapidly accumulate during acute HIV-1 infection. Nat Med. 2016;22:1043–1049. doi: 10.1038/nm.4156. [DOI] [PMC free article] [PubMed] [Google Scholar]
- 15.Sneller MC, et al. A randomized controlled safety/efficacy trial of therapeutic vaccination in HIV-infected individuals who initiated antiretroviral therapy early in infection. Sci Transl Med. 2017;9 doi: 10.1126/scitranslmed.aan8848. [DOI] [PMC free article] [PubMed] [Google Scholar]
- 16.Deeks SG, et al. International AIDS Society global scientific strategy: towards an HIV cure 2016. Nat Med. 2016;22:839–850. doi: 10.1038/nm.4108. [DOI] [PMC free article] [PubMed] [Google Scholar]
- 17.Hessell AJ, et al. Early short-term treatment with neutralizing human monoclonal antibodies halts SHIV infection in infant macaques. Nat Med. 2016;22:362–368. doi: 10.1038/nm.4063. [DOI] [PMC free article] [PubMed] [Google Scholar]
- 18.Byrareddy SN, et al. Sustained virologic control in SIV+ macaques after antiretroviral and alpha4beta7 antibody therapy. Science (New York, NY) 2016;354:197–202. doi: 10.1126/science.aag1276. [DOI] [PMC free article] [PubMed] [Google Scholar]
- 19.Bar KJ, et al. Effect of HIV Antibody VRC01 on Viral Rebound after Treatment Interruption. The New England journal of medicine. 2016;375:2037–2050. doi: 10.1056/NEJMoa1608243. [DOI] [PMC free article] [PubMed] [Google Scholar]
ONLINE METHODS REFERENCES
- 20.De Souza MS, et al. Impact of nucleic acid testing relative to antigen/antibody combination immunoassay on the detection of acute HIV infection. AIDS (London, England) 2015;29:793–800. doi: 10.1097/QAD.0000000000000616. [DOI] [PubMed] [Google Scholar]
- 21.Fiebig EW, et al. Dynamics of HIV viremia and antibody seroconversion in plasma donors: implications for diagnosis and staging of primary HIV infection. AIDS (London, England) 2003;17:1871–1879. doi: 10.1097/01.aids.0000076308.76477.b8. [DOI] [PubMed] [Google Scholar]
- 22.Somsouk M, et al. The immunologic effects of mesalamine in treated HIV-infected individuals with incomplete CD4+ T cell recovery: a randomized crossover trial. PloS one. 2014;9:e116306. doi: 10.1371/journal.pone.0116306. [DOI] [PMC free article] [PubMed] [Google Scholar]
- 23.Palmer S, et al. New real-time reverse transcriptase-initiated PCR assay with single-copy sensitivity for human immunodeficiency virus type 1 RNA in plasma. J Clin Microbiol. 2003;41:4531–4536. doi: 10.1128/JCM.41.10.4531-4536.2003. [DOI] [PMC free article] [PubMed] [Google Scholar]
- 24.Land S, et al. TREAT Asia Quality Assessment Scheme (TAQAS) to standardize the outcome of HIV genotypic resistance testing in a group of Asian laboratories. Journal of virological methods. 2009;159:185–193. doi: 10.1016/j.jviromet.2009.03.016. [DOI] [PMC free article] [PubMed] [Google Scholar]
- 25.Rhee SY, et al. Mutational Correlates of Virological Failure in Individuals Receiving a WHO-Recommended Tenofovir-Containing First-Line Regimen: An International Collaboration. EBioMedicine. 2017;18:225–235. doi: 10.1016/j.ebiom.2017.03.024. [DOI] [PMC free article] [PubMed] [Google Scholar]
- 26.Heipertz RA, Jr, et al. Molecular epidemiology of early and acute HIV type 1 infections in the United States Navy and Marine Corps, 2005–2010. AIDS Res Hum Retroviruses. 2013;29:1310–1320. doi: 10.1089/AID.2013.0087. [DOI] [PubMed] [Google Scholar]
- 27.Salazar-Gonzalez JF, et al. Deciphering human immunodeficiency virus type 1 transmission and early envelope diversification by single-genome amplification and sequencing. J Virol. 2008;82:3952–3970. doi: 10.1128/JVI.02660-07. [DOI] [PMC free article] [PubMed] [Google Scholar]
- 28.Vandergeeten C, et al. Cross-clade ultrasensitive PCR-based assays to measure HIV persistence in large-cohort studies. J Virol. 2014;88:12385–12396. doi: 10.1128/JVI.00609-14. [DOI] [PMC free article] [PubMed] [Google Scholar]
- 29.Procopio FA, et al. A Novel Assay to Measure the Magnitude of the Inducible Viral Reservoir in HIV-infected Individuals. EBioMedicine. 2015;2:872–881. doi: 10.1016/j.ebiom.2015.06.019. [DOI] [PMC free article] [PubMed] [Google Scholar]
- 30.Deleage C, et al. Defining HIV and SIV Reservoirs in Lymphoid Tissues. Pathogens & immunity. 2016;1:68–106. doi: 10.20411/pai.v1i1.100. [DOI] [PMC free article] [PubMed] [Google Scholar]
- 31.Dominguez MH, et al. Highly multiplexed quantitation of gene expression on single cells. Journal of immunological methods. 2013;391:133–145. doi: 10.1016/j.jim.2013.03.002. [DOI] [PMC free article] [PubMed] [Google Scholar]
- 32.Bolton DL, et al. Combined single-cell quantitation of host and SIV genes and proteins ex vivo reveals host-pathogen interactions in individual cells. PLoS pathogens. 2017;13:e1006445. doi: 10.1371/journal.ppat.1006445. [DOI] [PMC free article] [PubMed] [Google Scholar]
- 33.Altman JD, et al. Phenotypic analysis of antigen-specific T lymphocytes. Science. 1996. 274: 94-96. Journal of immunology (Baltimore, Md: 1950) 2011;187:7–9. [PubMed] [Google Scholar]
- 34.Cubas RA, et al. Inadequate T follicular cell help impairs B cell immunity during HIV infection. Nat Med. 2013;19:494–499. doi: 10.1038/nm.3109. [DOI] [PMC free article] [PubMed] [Google Scholar]
- 35.Muir R, et al. Altered Memory Circulating T Follicular Helper-B Cell Interaction in Early Acute HIV Infection. PLoS pathogens. 2016;12:e1005777. doi: 10.1371/journal.ppat.1005777. [DOI] [PMC free article] [PubMed] [Google Scholar]
Associated Data
This section collects any data citations, data availability statements, or supplementary materials included in this article.