

Abstract
Key points
The fluctuations in force during a steady isometric contraction (force steadiness) are associated with oscillations in common synaptic input to the involved motor neurons.
Decreases in force steadiness are associated with increases in pegboard times in older adults, although a mechanism for this link has not been established.
We used a state‐space model to estimate the variability in common synaptic input to motor neurons during steady, isometric contractions.
The estimate of common synaptic input was derived from the discharge times of motor units as recorded with high‐density surface electrodes.
We found that the variability in common synaptic input to motor neurons modulates force steadiness for young and older adults, as well as pegboard time for older adults.
Abstract
We investigated the associations between grooved pegboard times, force steadiness (coefficient of variation for force) and variability in an estimate of the common synaptic input to motor neurons innervating the wrist extensor muscles during steady contractions performed by young and older adults. The discharge times of motor units were derived from recordings obtained with high‐density surface electrodes when participants performed steady isometric contractions at 10% and 20% of maximal voluntary contraction force. The steady contractions were performed with a pinch grip and wrist extension, both independently (single action) and concurrently (double action). The variance in common synaptic input to motor neurons was estimated with a state‐space model of the latent common input dynamics. There was a statistically significant association between the coefficient of variation for force during the steady contractions and the estimated variance in common synaptic input in young (r 2 = 0.31) and older (r 2 = 0.39) adults, although not between either the mean or the coefficient of variation for interspike interval of single motor units with the coefficient of variation for force. Moreover, the estimated variance in common synaptic input during the double‐action task with the wrist extensors at the 20% target was significantly associated with grooved pegboard time (r 2 = 0.47) for older adults but not young adults. These findings indicate that longer pegboard times of older adults were associated with worse force steadiness and greater fluctuations in the estimated common synaptic input to motor neurons during steady contractions.
Keywords: state‐space model, aging, carotid body
Key points
The fluctuations in force during a steady isometric contraction (force steadiness) are associated with oscillations in common synaptic input to the involved motor neurons.
Decreases in force steadiness are associated with increases in pegboard times in older adults, although a mechanism for this link has not been established.
We used a state‐space model to estimate the variability in common synaptic input to motor neurons during steady, isometric contractions.
The estimate of common synaptic input was derived from the discharge times of motor units as recorded with high‐density surface electrodes.
We found that the variability in common synaptic input to motor neurons modulates force steadiness for young and older adults, as well as pegboard time for older adults.
Introduction
Manual dexterity is defined as the ability to co‐ordinate small movements of the hands and fingers quickly and accurately (Gershon et al. 2010). One measure of manual dexterity is the time that it takes to complete the Lafayette grooved pegboard test (Wang et al. 2011), which increases with advancing age (Ruff and Parker, 1993; Wang et al. 2011). Some of the age‐associated variance in pegboard times can be explained by the magnitude of the force fluctuations, comprising force steadiness (Galganski et al. 1993), during steady, submaximal isometric contractions of the hand and arm muscles (Marmon et al. 2011a; Almuklass et al. 2016; Hamilton et al. 2017). For example, Marmon et al. (2011a) found that 36% of the variance in pegboard times for 75 adults (18–89 years) was explained by the coefficient of variation for force, a measure of force steadiness, during index finger abduction (partial r = 0.57) and grip strength (partial r = −0.34). Moreover, a 28% decrease in grooved pegboard times after older adults practised the task on five occasions was accompanied by significant reductions in the coefficient of variation for force during isometric contractions with the index finger abductors (Marmon et al. 2011b).
To examine the influence of force steadiness on pegboard times in more detail, subsequent studies included double‐action tasks in which subjects were required to match target forces with steady contractions when performing two actions concurrently, such as a pinch grip and wrist extension, as occurs during tests of manual dexterity (Ambike et al. 2013; Werremeyer and Cole, 1997; Yu et al. 2010). With this approach, Almuklass et al. (2016) found that a multiple‐regression model comprising the time to match a target force during double‐action tasks and force steadiness during single‐action tasks could explain 70% of the variance in the pegboard times of young adults (Almuklass et al. 2016). Moreover, the coefficient of variation for force was greater during double‐action tasks than single‐action tasks, despite similar target forces during both actions (Almuklass et al. 2016; Hamilton et al. 2017), which indicates a difference in the control strategy used for each task (Dideriksen et al. 2017).
The greater coefficients of variation for force often exhibited by older adults during steady contractions were initially attributed to differences in the discharge characteristics of motor units (Galganski et al. 1993; Moritz et al. 2005). Subsequent studies, however, demonstrated that the greater coefficients of variation for force of older adults could not be explained by differences in either the mean or the coefficient of variation for interspike interval (ISI) of single motor units during steady isometric contractions (Barry et al. 2007). Rather, age‐associated differences in the coefficients of variation for force depend more on the cumulative activity of the recruited motor units (Negro et al. 2009; Castronovo et al. 2015). In a seminal study, Negro et al. (2009) showed that 74% of the variance in force during steady isometric contractions with a hand muscle could be explained by the first principal component of the instantaneous motor unit discharge rates, which was attributed to the common synaptic inputs received by the motor neurons (Farina et al. 2014, 2016; Negro et al. 2016a).
Given the associations between pegboard times and the coefficient of variation for force (Marmon et al. 2011a; Almuklass et al. 2016; Hamilton et al. 2017), as well as between low‐frequency oscillations in force and common synaptic input to motor neurons (Farina et al. 2014; Negro et al. 2009), the present study aimed to examine the associations between pegboard times, force steadiness (coefficients of variation for force) and variability in an estimate of the common synaptic input to motor neurons during steady contractions in young and older adults. We hypothesized that (i) variability in common synaptic input would be positively correlated with the coefficient of variation for force during steady contractions for both groups of subjects; (ii) the coefficient of variation for force and variability in common synaptic input would be greater during double‐action than single‐action tasks; and (iii) the pegboard times of older adults, but not young adults, would be associated with greater coefficients of variation for force and greater variability in common synaptic input during steady isometric contractions of the hand and arm muscles. The main findings were consistent with the first and third hypotheses, although only the results for the young adults were compatible with the second hypothesis.
Methods
Ethical approval
The present study conformed with the Declaration of Helsinki and was approved by the Institutional Review Board at the University of Colorado Boulder (Protocol # 16‐0782) except for registration in a database. All participants were given a verbal and written description of study protocols and provided their written informed consent prior to participating in the experiment.
All values are reported as the mean ± SD. Thirteen young (25 ± 4 years) and 12 older adults [78 ± 5 years) with no history of neurological disease or injury to the upper extremity consented to participate in a protocol. All participants were right‐handed, with an Edinburgh Handedness score of 0.9 ± 0.1 (Table 1).
Table 1.
Subject characteristics
| Young | Older | |
|---|---|---|
| Men/women | 5/8 | 7/5 |
| Age (years) | 25 ± 4 | 78 ± 5 |
| Height (cm) | 175 ± 8 | 175 ± 7 |
| Mass (kg) | 63 ± 13 | 73 ± 7 |
| Handedness (1 = right) | 0.8 ± 0.2 | 0.9 ± 0.2 |
| Grooved pegboard test (s) | 51 ± 5 | 73 ± 19 |
| MVC force (N) | ||
| Wrist extension | 105 ± 27 | 117 ± 46 |
| Pinch | 42 ± 14 | 32 ± 10 |
Data are the mean ± SD.
Experimental protocol
Each subject participated in a single experimental session lasting ∼60 min. The primary outcome variables were time to complete the grooved pegboard test, coefficient of variation for force during steady isometric contractions with the wrist extensors and thumb‐index finger pinch at two target forces (10% and 20% maximal voluntary contraction force), and motor unit recordings from the wrist extensors during steady isometric conditions. As in some of our previous studies (Almuklass et al. 2016; Hamilton et al. 2017), the coefficient of variation for force was measured for each task independently (single‐action tasks) and when the two tasks were performed concurrently (double‐action task). In addition, we calculated the root mean square of the single‐differential electromyographic (EMG) activity for the wrist extensors during the force‐steadiness tasks.
Grooved pegboard test
The grooved pegboard test requires individuals to place key‐shaped pegs into a 5 × 5 grid of key‐shaped holes with varying orientations. Individuals used only their right hand and completed the grooved pegboard from left to right, as well as top to bottom, as quickly as possible. Each participant was familiarized with the test by inserting pegs into a single row immediately preceding the timed trial. Pegboard time corresponded to the duration from a verbal cue to being the test through to the insertion of the final peg. The primary outcome variable was time to complete the grooved pegboard test.
Maximal voluntary contraction (MVC)
The MVC force was measured for the wrist extension and pinch grip tasks. Each MVC required individuals to gradually increase force over 3 s and to maintain the maximal force for ∼3 s. Vigorous verbal encouragement was provided during each task, which was repeated until the peak force for two trials was within 5% of each other. The average of those peak forces was deemed to comprise the MVC force. The force applied by the back of the hand during wrist extension was measured with a JR‐3 force transducer (0.0056 V N–1; Model 45E15A‐U760‐A; JR3, Woodland, CA, USA), whereas the pinch force was quantified with a hand‐held transducer (0.049 V N–1; Model LLB130; Futek, Irvine, CA, USA).
The force signals from both force transducers were low‐pass filtered at 50 Hz (V75‐48 High Performance Bandpass Filter; Coulbourn Instruments, White Hall, PA, USA) and sampled at 2 kHz with an analogue‐to‐digital converter (Power 1401; Cambridge Electronic Design, Cambridge, UK). The data were obtained with Spike2 data acquisition software, version 5.20 (Cambridge Electronic Design) and stored offline for analysis in MATLAB 2017a (MathWorks Inc., Natick, MA, USA).
Force steadiness tasks
The steadiness tasks required participants to match a target force displayed on a monitor ∼1.5 m in front of them (Fig. 1 A and B). The single‐action tasks comprised two trials at each target force (10 and 20% MVC) for wrist extension and pinch force, separately (Fig. 1 C). The double‐action tasks comprised two trials at both 10% and 20% MVC during which both the pinch and wrist extension forces were matched to the same target force (10% or 20%) concurrently for 30 s (Fig. 1 D). The steadiness tasks were performed with low‐gain visual feedback to minimize online corrections (Christou, 2013); the vertical axis of the monitor represented 100% MVC force, which created a visual angle of 0.75°. All participants were familiarized with the steadiness tasks and then performed two 30 s trials of each task (two actions and two target forces). In each trial, subjects were asked to reach the target force displayed on the monitor and to maintain a steady force until told to stop. The primary outcome measure was the coefficient of variation for force during the steady portion of each trial.
Figure 1. Experimental set‐up.
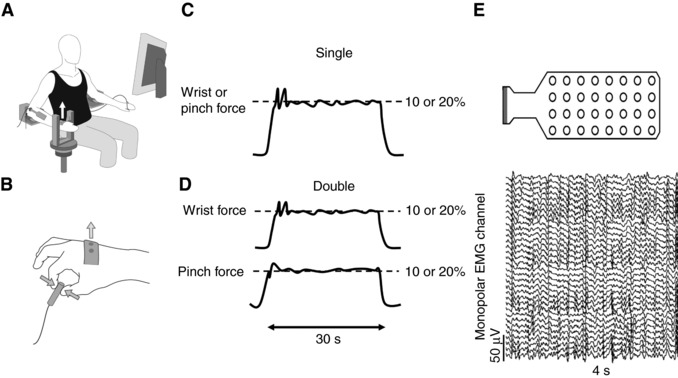
(A) seated participant facing the monitor. (B) location of the transducers to measure the wrist extension and pinch forces. (C) force for the single‐action task. (D) forces for the double‐action task. (E) 4 × 8 grid electrode (OTB Bioelettronica) was placed over the wrist extensor muscles. (F) monopolar EMG recordings from the grid electrode.
Prior to the steadiness tasks, the skin over the extensor digitorum communis was shaved, cleaned and abraded with a 70% ethanol solution. Subsequently, high‐density EMG (OT Bioelettronica, Torino, Italy) signals were recorded from the extensor digitorum communis using a 4 × 8 grid electrode with 10 mm interelectrode spacing (Fig. 1 E). The electrode was attached directly over the extensor digitorum communis muscle as determined by palpation. The electrodes were placed lengthwise from proximal to distal and a reference electrode was fixed over the olecranon process. The longer portion of the electrode was placed parallel to the presumed direction of the muscle fibres. Monopolar signals (Fig. 1 F) were recorded at 2 kHz (3 dB bandwidth, 10–500 Hz, multichannel amplifier OT Biolettronica, Torino, Italy). The primary outcome of the EMG recordings was the sum of the root‐mean‐square single‐differential recordings and the motor unit discharge activity (details below) during the steady 10 s for each trial.
Data analysis
The force signals were low‐pass filtered (fourth order bidirectional Butterworth, cut‐off 20 Hz) and representative data are shown in Fig. 2. Force steadiness was quantified as the coefficient of variation for force during the steadiest 10 s of each 30 s trial (Fig. 2 A and B). Each force signal was visually inspected after a semi‐automated analysis in which a 10 s moving average started from the end of the trial and moved backward by 1 ms (overlap 999 ms) to find the 10 s region with the lowest coefficient of variation for force. The trial with the lower coefficient of variation for force was used for further analysis.
Figure 2. Overview of methods.
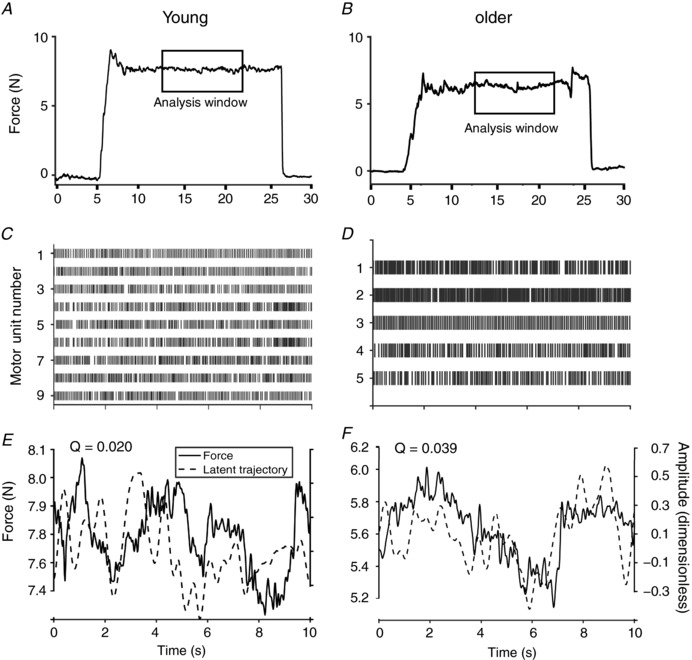
Representative force traces during the 30 s contraction for a young (A) and older (B) adult at the 10% MVC target force. The analysis windows indicate the steadiest 10 s of each trial. Raster plot of motor unit discharge times for the young (C) and older (D) adult during the 10 s window. Force (left y‐axis) and estimated state‐space trajectory smoothed with a 40 point Hann function (right y‐axis) for the young (E) and older (F) adults during the 10 s window.
EMG amplitude (mV) was quantified as the average (over 10 s; 1s bin width) of the sum of the root mean square of the rectified monopolar recordings from the 32‐recording sites on the high‐density electrode. In addition, the high‐density EMG signals were decomposed into motor unit discharge times (Fig. 2 C and D) using a semi‐automated convolution kernel algorithm (Holobar and Zazula, 2004; Negro et al. 2016b) from OT Bioelettronica. This algorithm has been validated previously (Negro et al. 2016b; Del Vecchio et al. 2017) and was initially implemented using an SIL of 0.85. The SIL represents the silhouette of the detected motor unit and has been established as a measure of motor unit discrimination (Holobar and Zazula, 2004).
Because we used a slightly lower SIL value (0.85) to discriminate motor units, it was necessary to evaluate the discharge characteristics of each motor unit before further analysis. The motor unit discharge characteristics were inspected and only motor units that met four criteria were included in the analysis: (i) a mean ISI between 20 and 200 ms; (ii) coefficient of variation for ISI ≤50%; (iii) a skewness for the ISI distribution <2; and (iv) an observable waveform in bipolar differential recordings. The primary outcome measures were the motor unit discharge times and these were used to estimate variance in the common synaptic input during the steady portion of the trial.
The motor unit discharge times were used to fit the parameters of a state‐space model (Feeney et al. 2017) to estimate the common synaptic input signal to motor neurons during the force steadiness tasks. In this model, discharge rate (γ) of the i th recorded motor unit is parameterized as a Poisson process and is represented by eqs (1) and (1):
| (1) |
| (2) |
z(t) represents an intermediate of motor unit discharge rates before being inserted into the exponential (eqn 1), which ensures positive discharge rates. x(t) represents the latent common input driving the pool of motor neurons, whereas C corresponds to the physiological parameters that encode how the discharge rate of each neuron will be influenced by x(t). D s(t) denotes the potential coupling between motor neurons, such as from persistent inward currents (Heckman et al. 2008; Johnson et al. 2017) or Renshaw cell inhibition (Kirkwood et al. 1981; Windhorst, 1989), and is the logarithm of the average discharge rate. The dynamics of the common input are modeled as follows:
| (3) |
A is a linear approximation of the dynamics of the common input signal, b f(t) allows for modelling the influence of the target force (or other external factors) on discharge rate and E(t) is a Gaussian noise vector that models the synaptic noise in signal transmission within the neuromuscular system (Katz and Miledi, 1970). The parameters of the model evolve according to Poisson linear dynamics with the distributions:
| (4) |
where x O and Q o represent the initial state and covariance matrix, which evolves over the trial, and Q is an estimate of the physiological fluctuations in the common input signal. The estimate of the common input, x(t), may be visualized as the trajectory of a vector over the trial (Fig. 2 E and F), whereas the variability in the common synaptic input (Q) may be estimated. We assume the variance in common input remains relatively constant during brief, steady, isometric contractions. We calculated the peak cross‐correlation and the average lag for the peak cross‐correlation for each trial. An overview of the model and its parameters is shown in Fig. 3.
Figure 3. Schematic overview of the parameters of the state‐space model.
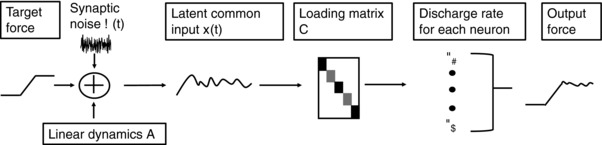
Only the motor unit discharge activity is used to fit the parameters x(t) (the latent input) and Q (variance in common synaptic input).
We used an open source Expectation‐Maximization (EM) algorithm (Macke et al. 2011; Buesing et al. 2012) to estimate the parameters of the state‐space model to quantify common input (and its variance) to the motor neurons. The motor unit discharge times were down‐sampled to 10 ms bins and arranged into an n × T binary matrix where 1 represented the occurrence of an action potential. The EM algorithm was initialized with a Poisson subspace estimate of the single‐dimension, state‐space trajectory and iteratively refined until a local maximum of the log‐likelihood function of the posterior distribution of trajectories had been reached. The EM algorithm was terminated when either a maximum number of iterations (100) was reached or when the relative error in log‐likelihood became less than 10–3 (Feeney et al. 2017). The model assumes the variance in common synaptic input is constant over the window of interest. The variance in the state‐space trajectory is the primary outcome measure and represents the variability in synaptic input to motor neurons and is represented by model parameter Q.
To assess the reliability of this methodology, we measured the coefficient of variation for force and the estimated variance in common synaptic input for two separate epochs from each force output. There were no significant differences in the coefficient of variation for force or variance in common input between sets of epochs. Accordingly, we only present results from the steadiest portion of each force output.
Statistical analysis
All data were tested for normality with a Shapiro–Wilk test. A three‐way ANOVA (age × force level × action) was used to compare the influence of age and task on force steadiness and variability in common input. Within each age group, 2 × 2 repeated‐measures ANOVAs examined the influence of action (single vs. double) and target force (10% vs. 20% MVC force) on the coefficient of variation for force and the estimate of variance in common input (Q). Paired t tests with Bonferroni corrections were applied post hoc to examine differences in the coefficient of variation for force and Q between actions and target forces. Effect size for ANOVA was estimated with partial eta squared and Cohen's d was used for post hoc pairwise comparisons. To estimate the relationship between variance in the common input with the coefficient of variation for force, a linear regression model was created across all tasks (two actions and two target forces) for both age groups.
To examine relations between grooved pegboard times with the coefficient of variation for force and variance in synaptic input, a backward stepwise multiple‐regression model was created for all subjects and, separately, for young and older adults. Subsequently, q–q plots were created to ensure normality of the residuals for each multiple‐regression model. All statistics were performed in R, version 3.4.1 (R Foundation for Statistical Computing, Vienna, Austria).
Results
Force and high‐density surface EMG signals were recorded during four force steadiness tasks for the wrist extensors and pinch grip: two target forces (10% and 20% MVC force) and two actions (single and double action). In addition to a single trial of the grooved pegboard test, each participant completed two trials of each steadiness task.
Force steadiness
We examined the influence of age, target force (10% or 20%) and action (single or double) on coefficient of variation for force during isometric contractions. A three‐way (2 ages × 2 target forces × 2 actions) ANOVA for all subjects detected a main effect for action, which indicated that young and older adults were less steady (greater coefficients of variation for force) during the double‐action tasks compared to the single‐action tasks (P = 0.0007, F = 12.4, η2 = 0.19). Similarly, a main effect for age indicated that older adults were less steady than young adults (P = 0.03, F = 4.6, η2 = 0.08). There was no main effect for target force on force steadiness (P = 0.91, F = 0.011, η2 = 0.001). All subjects completed each condition and so subsequent analyses were performed within each age group to optimize the statistical power with a repeated‐measures design.
Within age groups, young adults exhibited a main effect for task (target force and type of action) on the coefficient of variation for force during both wrist extension (P = 3.4 × 10⁻⁴, F = 7.9, η2 = 0.19) and pinch (P = 2.5 × 10⁻⁷, F = 18.3, η2 = 0.45). Similarly, older adults displayed a main effect for task on the coefficient of variation for force for both wrist extension (P = 0.013, F = 4.16, η2 = 0.15) and pinch (P = 0. 003, F = 5.9, η2 = 0.21). Post hoc analyses indicated that the coefficient of variation for force exhibited by the young adults (Fig. 4 A and C) was greater during the double‐action tasks than the single‐action tasks at both target forces for wrist extension (10%: P = 0.04, Cohen's d = 0.18; 20%: P = 0.002, Cohen's d = 0.23) and pinch (10%: P = 0.004, Cohen's d = 0.48; 20%: P = 0.001, Cohen's d = 0.41). In older adults (Fig. 4 B and D), the coefficient of variation for force was greater during the double‐action task compared to the single‐action task for wrist extension at both target forces (10%: P = 0.004, Cohen's d = 0.45; 20%: P = 0.002, Cohen's d = 0.44) and for the pinch at the lower target force only (P = 0.03, Cohen's d = 0.42).
Figure 4. Results of force steadiness tasks.
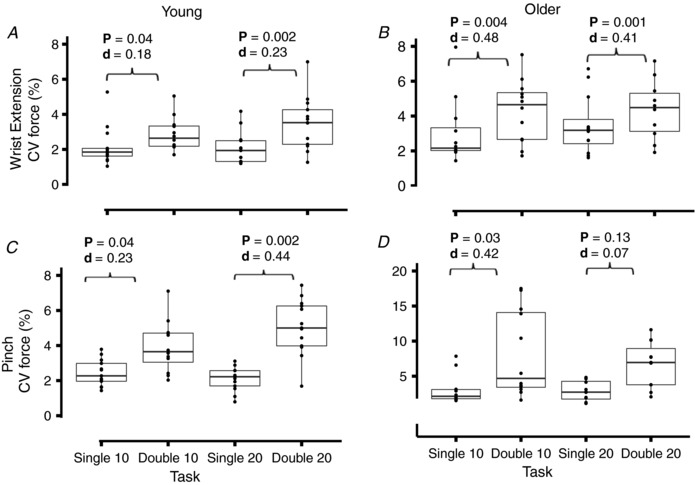
Coefficient of variation (CV) for force from the steadiest 10 s during the steadiness tasks in young (A and C) and older (B and D) adults during wrist extension (A and B) and pinch (C and D). Boxes display the median with hinges representing the 25% and 75% quartile and the whiskers extending to the minimum and maximum values. The filled circles indicate the data for each subject. There was a significant effect of task (action and target force) on force steadiness for both groups of subjects during wrist extension and pinch. A pairwise t test with a Bonferroni post hoc correction was applied between all tasks and adjusted P values (P < 0.05) and effect size (Cohen's d) are indicated.
EMG and motor unit discharge characteristics
We assessed the influence of target force and action (single or double) on EMG and motor unit discharge characteristics. Root mean square EMG amplitude during the steady isometric contractions differed between target forces for young and older adults (Table 2). A repeated‐measures ANOVA revealed a main effect for target force on EMG amplitude for both young (P = 6.2 × 10⁻⁸, F = 20.6, η2 = 0.29) and older adults (P = 2.8 × 10⁻⁷, F = 18.7, η2 = 0.25). EMG amplitude was greater for the 20% target forces for single‐action wrist extension and pinch (P = 0.002, Cohen's d = 0.85). Similarly, EMG amplitude was greater during double‐action tasks at 20% compared to double‐action tasks at 10% target force (P = 0.001, Cohen's d = 1.1).
Table 2.
Discharge characteristics of motor units in the wrist extensors for the two groups of participants during the four force steadiness tasks
| Young | Older | |||||||
|---|---|---|---|---|---|---|---|---|
| Action | Single | Double | Single | Double | ||||
| Number of motor units | 141 | 134 | 149 | 156 | ||||
| Target force | 10% | 20% | 10% | 20% | 10% | 20% | 10% | 20% |
| EMG amplitude (mV) | 4.3 ± 1.5 | 5.8 ± 1.7* | 4.6 ± 1.3 | 6.8 ± 2.0* | 3.8 ± 1.3 | 5.1 ± 1.6* | 5.0 ± 1.8 | 6.4 ± 2.3* , † |
| Mean ISI (ms) | 72.7 ± 8.2 | 71.6 ± 9.3 | 74.9 ± 11.2 | 62.8 ± 11.1 | 72.1 ± 9.0 | 70.2 ± 11.6 | 65.9 ± 12.6 | 67.7 ± 19.9 |
| CV for ISI (%) | 33.5 ± 6.0 | 33.3 ± 7.9 | 31.3 ± 4.8 | 38.8 ± 7.6 | 31.7 ± 5.4 | 33.8 ± 7.6 | 32.7 ± 9.7 | 34.7 ± 5.0 |
CV, coefficient of variation.
* P < 0.05 between target forces.
† P < 0.05 between actions. Data are the mean ± SD. EMG amplitude is the average (over 10 s with a 1 s bind width) of the sum of the root mean square of the rectified monopolar recordings from the 32 recording sites on the high‐density electrode.
By contrast to the differences in EMG amplitude for the two target forces, there were no statistically significant differences in discharge characteristics for the 275 motor units in young adults and 305 motor units in older adults recorded in the wrist extensors across actions and target forces (Table 2). We accepted an average of 5.5 ± 2.6 motor units in young and 6.2 ± 2.5 in older adults across the steadiness tasks. There was no difference in the number of motor units accepted per group (P = 0.41). Moreover, there were no significant effects for age on either mean ISI (P = 0.31) or coefficient of variation for ISI (P = 0.13) across actions and target forces. Additionally, there were no significant effects of action or target force on either mean ISI for young (P = 0.54) or older (P = 0.49) adults or the coefficient of variation for ISI for young (P = 0.72) or older adults (P = 0.49).
Variance in common input
The main purpose of the present study was to assess how variance in common synaptic input would differ between age groups, at different force targets, and between single and double‐action tasks. A three‐way (age × force level × action) ANOVA indicated a main effect for action with young and older adults having greater values for the estimated variance in common synaptic input during double‐action tasks than single‐action tasks (P = 0.002, F = 5.5, η2 = 0.15) (Fig. 5). By contrast, there was no significant main effect for age on Q (P = 0.15, F = 1.7, η2 = 0.02) or target force (P = 0.02, F = 0.11, η2 = 0.01).
Figure 5. Estimated variability in the common synaptic input to motor neurons (Q).
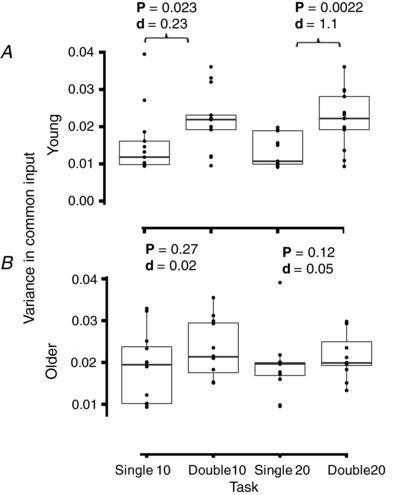
The estimate was derived from the discharge times of motor units in the wrist extensors during the force steadiness tasks in young (A) and older (B) adults. Boxes display the median with hinges representing the 25% and 75% quartile and the whiskers extending to the minimum and maximum values. The filled circles indicate the data for each subject. There was a significant effect of task on Q for the wrist extensors in young adults (P = 3.5 × 10⁻⁴, F = 7.9, η2 = 0.25) but not older adults. A pairwise t test with a Bonferroni post hoc correction was applied between all tasks and significant P values (P < 0.05) and effect sizes (Cohen's d) are indicated.
Within age groups, there was a significant effect of task (type of action and target force) on variance in common input in young adults only (P = 3.5 × 10⁻⁴, F = 7.9, η2 = 0.25). Variance in common input was greater in the double‐action task than the single‐action task for young adults (Fig. 5 A) at both target forces (10%: P = 0.023, Cohen's d = 0.23, 20%: P = 0.0022, Cohen's d = 1.1). Additionally, variance in common input was greater during the 10% double‐action task than the 20% single‐action task for young adults (P = 0.009, Cohen's d = 1.2). There was no significant effect of task on variance in common input for the older adults (P = 0.32, F = 1.2, η2 = 0.06) (Fig. 5 B).
There was a significant association between the estimated variance in common input and the coefficient of variation for force collapsed across age for all four conditions: single‐action 10% (Fig. 6 A), double‐action 10% (Fig. 6 B), single‐action 20% (Fig. 6 C) and double‐action 20% (Fig. 6 D). When broken into age groups, a linear regression model revealed a significant correlation between variance in common input and the coefficient of variation for force for young (r 2 = 0.31, F = 16.1, P = 0.003) and older adults (r 2 = 0.39, F = 33.2, P = 4.5 × 10⁻⁷). Each 0.01 unit increase in variance in common input was associated with estimated increases of 1.1% and 1.3% in the coefficient of variation for force for young and older adults, respectively. There were no statistically significant relations between coefficient of variation for force and mean ISI (r 2 = 0.006, P = 0.4) or coefficient of variation for ISI (r 2 = 0.008, P = 0.4).
Figure 6. Relationship between Q and the coefficient of variation (CV) for force collapsed across groups.
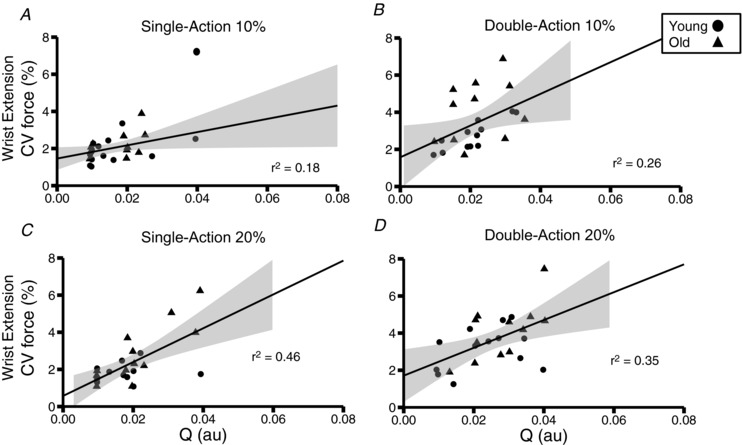
(A) single‐action 10%. (B) double‐action 10%. (C) single‐action 20%. (D) double‐action 20%. Significant relations were found for all tasks: single‐action 10% (r 2 = 0.17, F = 4.6, P = 0.04) and double‐action 10% (r 2 = 0.26, F = 8.19, P = 0.008), single‐action 20% (r 2 = 0.47, F = 20, P = 0.0002) and double‐action 20% (r 2 = 0.35, F = 12.4, P = 0.002). The shaded area represents the standard error of the regression for each group.
To compare our findings with the previous literature, we calculated the peak cross‐correlation and time lag between force and common synaptic input. The peak cross‐correlation of force and common synaptic input occurred at an average time lag of 180 ± 45 ms with the common input preceding force.
Associations with grooved pegboard test
To assess the relationship between variance in common input with manual dexterity, we created regression models to predict grooved pegboard time based on force steadiness, variance common input and age. Older adults took longer than young adults to complete the grooved pegboard test (P = 3.5 × 10⁻¹⁵, Cohen's d = 1.2) (Table 2). To examine the relationship between pegboard times, coefficient of variation for force and estimated variance in the common input signal, we created multiple‐regression models for both groups of subjects combined and the two groups separately (Fig. 7 A–C). A multiple‐regression model for all subjects explained 58% of the variance in grooved pegboard times and comprised two explanatory variables: age (partial r = 0.67, intercept = 0.36) and the coefficient of variation for force at the 20% target during the double‐action pinch task (partial r = 0.55, intercept = 2.3). Within this model, a 1 year increase in age when holding all other variables constant predicted an increase of 0.36 s in grooved pegboard time. Additionally, a 1% increase in the coefficient of variation for force during the double‐action pinch task at the 20% target, when holding age constant, was associated with a 2.3 s increase in grooved pegboard time. The regression model for young adults explained 47% of the variance in grooved pegboard performance with one variable: coefficient of variation for force during wrist extension at the 10% target (r 2 = 0.47, F = 10.1, P = 0.009). The regression model for older adults explained 45% of the variance in grooved pegboard time with one variable: variance in common input during wrist extension at the 20% target (r 2 = 0.45, F = 7.4, P = 0.02).
Figure 7. Models of grooved pegboard performance.
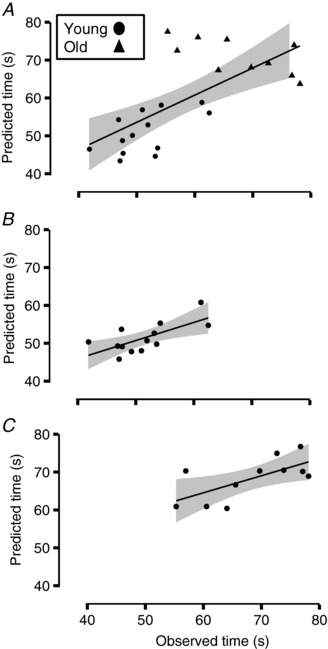
(A) multiple‐regression model for grooved pegboard time for both young (filled circles) and older (filled triangles) adults (r 2 = 0.58, F = 15.22, P = 6.5 × 10⁻⁵). The explanatory variables were age (partial r = 0.67, estimate = 2.3) and the coefficient of variation for force during the double‐action pinch at the 20% target (partial r = 0.55, estimate = 0.35). (B) regression model for the pegboard times of young adults (r 2 = 0.47, F = 10.06, P = 0.009). The single explanatory variable was the coefficient of variation for force during the single‐action wrist extension task at the 10% target. C, regression model for the pegboard times of older adults (r 2 = 0.45, F = 7.37, P = 0.02). The sole explanatory variable in this model was Q derived from motor unit discharge times during the double‐action task at the 20% target. The grey areas represent the standard error for the regression models.
Discussion
We investigated the associations between grooved pegboard time, the coefficient of variation for force and the estimated variability in common synaptic input to motor neurons during steady isometric contractions in young and older adults. The main findings were that the estimated variance in common synaptic input (Q in the state‐space model) was significantly related to the coefficient of variation for force during steady, submaximal contractions for both age groups, and that variability in the common input was directly correlated with grooved pegboard times for older adults. Moreover, despite a consistent and significant increase in EMG amplitude of between 10% and 20% MVC for both young and older adults, there were no statistically significant differences in either the mean or the coefficient of variation for motor unit ISI during the four steadiness tasks (two actions and two target forces). Nonetheless, the estimated variance in common synaptic input was greater during the double‐action tasks, although only for the young adults.
Force steadiness tasks
Consistent with previous studies, the coefficient of variation for force was significantly greater for older adults (Galganski et al. 1993; Laidlaw et al. 2000; Tracy, 2007) and was greater during the double‐action tasks than the single‐action tasks (Almuklass et al. 2016; Hamilton et al. 2017). Also, as found in other studies that used high‐density electrodes to quantify EMG activity (Vila‐Cha et al. 2010; Martinez‐Valdez et al. 2017), the root mean square EMG amplitude was significantly greater at 20% MVC force for both young and older adults. Despite the increases in EMG amplitude, differences in the coefficient of variation for force were not associated with either the mean or the coefficient of variation for ISI. However, the high‐density EMG signals were decomposed to identify the discharge times of many concurrently active motor units (Merletti et al. 2001; Holobar and Zazula, 2004; Negro et al. 2016b) and to derive meaningful estimates of the population dynamics of the motor units involved in each task, such as estimates of the variability in common synaptic input received by motor neurons (Farina et al. 2014, 2016; Feeney et al. 2017).
The results of the present study are consistent with previous reports suggesting that single motor unit characteristics do not explain differences in force steadiness (Barry et al. 2007). This is probably a result of the non‐linear input–output relationship of individual motor neurons (Farina et al. 2014; Powers and Heckman, 2017), the insensitivity of force fluctuations above 10% MVC to synaptic noise (Dideriksen et al. 2012), the relatively small amount of force contributed by a single motor unit to the cumulative sum of the motor output (Fuglevand et al. 1993), and the low‐pass filtering effect of muscles (Partridge, 1965; Baldissera, 1998) and motor neurons themselves (Farina et al. 2014). Force fluctuations, however, are strongly associated with the common, low‐frequency components in motor unit discharge rates when many units are recorded concurrently (Negro et al. 2009; Dideriksen et al. 2012). Because it is not possible to infer the population dynamics of a motor pool from single motor units, contemporary methods, such as state‐space models (Feeney et al. 2017) and the cumulative spike train approach (Farina et al. 2014), estimate the common synaptic input to all motor neurons from the discharge times of multiple concurrently active units. With this approach, the estimate of variance in common input provides information that is obscured when analysing single motor unit characteristics, such as the mean or coefficient of variation for ISI.
Variability in common synaptic input (not individual motor unit discharge characteristics) is responsible for a significant portion of the force fluctuations observed during steady isometric contractions. Variability in common synaptic input was significantly greater during double‐ than single‐action tasks for young adults in the present study, which was associated with differences in the coefficient of variation for force between the two actions. Although differences in common synaptic input in older adults did not reach statistical significance between actions, the coefficient of variation for force in both age groups was significantly related to the estimated variability in common synaptic input. Our results are consistent with the hypothesis of Farina et al. (2014) suggesting that only the low‐frequency oscillations in common synaptic input influence the net force (Farina et al. 2014; Negro et al. 2016a). Although we did not find a main effect of target force on the variability in common synaptic input, we only tested two target forces (10% or 20%), whereas Castronovo et al. (2015) found that the proportion of common synaptic input relative to common noise decreased with greater target forces (up to 70% MVC).
A critical feature of the present study is the use of a state‐space model to estimate common synaptic input, which does not assume linearity of the motor unit pool (Boonstra et al. 2016; Powers and Heckman, 2017) and does not apply principal component analysis to point processes, such as instantaneous discharge rates (Kuhn et al. 2003). We validated this model in previous work (Feeney et al. 2017) using both computational simulations and experimental data. The present study extends the theoretical framework to examine its utility in quantifying variability in common synaptic input during steadiness tasks. Therefore, we extend the findings of previous studies (Farina et al. 2014; Negro et al. 2016a) with a robust mathematical model of common synaptic input to the motor pool (Feeney et al. 2017).
In addition, we found that the estimated variance in common synaptic input to motor neurons innervating the wrist extensor muscles was greater during the double‐action task relative to the single action task, although only for young adults. Although the wrist‐extension target force was the same for both actions and there were no differences in the mean and coefficient of variation for ISI across actions, the estimated variance in common synaptic input was greater at the 20% target force relative to the 10% target force, which is consistent with a difference in the control strategy for the two actions (Dideriksen et al. 2017). The absence of an effect for the older adults was presumably a result of the greater difficulty that they had with these novel tasks, as indicated by their more variable force trajectories, especially during the double‐action tasks. Although additional practice of the double‐action tasks may have lessened the variability, we were concerned that the adjustments would compromise our evaluation of the relationship between the coefficient of variation for force during the double‐action tasks and pegboard times as measured in a single trial. Alternatively, the present study may not be sufficiently powered to detect the changes in common synaptic input to older adults during these tasks.
Grooved pegboard test
Significant amounts of the variance in the time to complete the grooved pegboard test was be explained by an expanded set of steadiness tasks (Almuklass et al. 2016; Hamilton et al. 2017) and the variability in common synaptic input (Feeney et al. 2017) during these tasks. A multiple‐regression model explained 57% of the variance in pegboard times for all participants, which included age and the coefficient of variation for force during the double‐action pinch at the 20% target force as the primary explanatory variables. These predictor variables are similar to those reported by Marmon et al. (2011a) in which 36% of the variance in pegboard times of the participants (18–89 years) was explained by the coefficient of variation for force during index finger abduction at a 5% target force and handgrip strength. In the present study, young and older adults form two distinct groups (Fig. 7 A), which limits the sensitivity of a single model for predicting pegboard times across age groups. Regardless, the parameters of our combined age‐group model compare well with those of others; namely, force steadiness and age are routinely associated with time to complete the pegboard test (Marmon et al. 2011a; Hamilton et al. 2017).
A subsequent multiple‐regression model for the data obtained from older adults (n = 25) by Marmon et al. (2011a), however, explained 59% of the variance in pegboard times with three predictor variables: age (partial r = 0.66), the coefficient of variation for force during index finger abduction at a 5% target force (partial r = –0.31) and pinch‐grip strength (partial r = 0.20). In the present study, 45% of the variance in pegboard times of older adults was explained by the estimated variance in common synaptic input derived from the discharge times of motor units in the wrist extensor muscles during the double‐action task at the 20% target force. Moreover, there was a strong association between the estimated variance in common synaptic input (Q) and the coefficient of variation for force during wrist extension at 20% MVC (r 2 = 0.6). Our results are consistent with those of Marmon et al. (2011a) who demonstrated that the ability to exert a steady submaximal force during an isometric contraction involves a control strategy critical to the time that it takes to complete the grooved pegboard test, although we provide a neural substrate (variability in common synaptic input) responsible for the differences in force steadiness.
The results obtained for young adults indicated that 47% of the variance in grooved pegboard time could be explained by a single variable: coefficient of variation for force during single‐action wrist extension at the 10% target force. Similarly, Almuklass et al. (2016) found that one of the predictor variables in a multiple‐regression model (r 2 = 0.70) for the pegboard times of young adults (n = 30) was also the coefficient of variation for force during single‐action wrist extension at 10% target force. However, the directionality of this relationship differed between the two studies; it was positive in our study (r = 0.69) and negative (partial r = –0.48) in the study by Almuklass et al. (2016). Thus, young adults in the present study with faster pegboard times had lower values for the coefficient of variation for force during the wrist‐extension task, whereas the converse relation was reported by Almuklass et al. (2016).
A major difference between the two studies was the instructions given to the subject for the steady contractions. In the present study, subjects were asked to match the target line displayed on the monitor and to maintain a steady contraction. Although Almuklass et al. (2016) used a similar instruction, their subjects were also required to reach the target force as quickly as possible. In their regression model, time to match the target force was the stronger of the two predictor variables (partial r = 0.78), which indicates that the rapid force‐matching task explains more of the variance in pegboard times for young adults. Consistent with our hypothesis, Q did not emerge as a significant predictor of pegboard times in young adults (r 2 = 0.09 for Q during 10% wrist extension), probably as a result of their pegboard times depending more on decision‐making strategies than rather than being constrained by neuromuscular capabilities (Almuklass et al. 2016; Hamilton et al. 2017).
Limitations
Our investigation of variance in common synaptic input and force variability suffered from some limitations that should be considered for future work. It was necessary to use a reduced SIL value to obtain a sufficient number of motor units to estimate population dynamics. We attributed this difficulty to the recording conditions of the test muscle (extensor digitorum communis) and the opposing actions of concurrently active muscles that contribute to wrist flexion. A second limitation is the use of a different number of motor units from each subject to estimate the variance in common input. As a result of our low yield of motor unit numbers from some subjects, it was not possible to import the same number of motor units from each subject into the model.
Conclusions
Force steadiness (coefficient of variation for force) was worse for older adults than young adults, as well as during the double‐action tasks for both age groups. The estimated variability of the common synaptic input to motor neurons innervating the wrist extensor muscles was significantly associated with the coefficient of variation for force, whereas the discharge characteristics of single motor unit was not. Variability in common synaptic input during the steadiness tasks was also significantly associated with grooved pegboard time, although only for the older adults. Our findings indicate that age‐associated differences in grooved pegboard time and force steadiness result from changes in a state‐space model estimate of the variance in the common synaptic input to motor neurons that innervate muscles engaged during the task.
Additional information
Competing interests
The authors declare that they have no competing interests.
Author contributions
DF, DM and RME designed the study. DF and DM acquired and analysed the results. DF, DM and RME interpreted the results, as well as wrote and revised the manuscript. All authors have approved the final version of the manuscript submitted for publication and are accountable for all aspects of the work. All persons designated as authors qualify for authorship and all those who qualify are listed.
Funding
The present study was partially supported by an American Society for Biomechanics graduate student grant‐in‐aid awarded to Daniel Feeney and a graduate student grant from the Rocky Mountain American Society for Sports Medicine awarded to Diba Mani.
Acknowledgements
The authors thank Melissa Mazzo for help with the figures, as well as Professor Evangelos Christou for comments on an earlier draft of the manuscript.
Biography
Daniel Feeney is a PhD candidate in Integrative Physiology in Roger Enoka's Neurophysiology of Movement Laboratory at the University of Colorado Boulder and anticipates to graduate in May 2018. Daniel received a 2017 graduate student grant‐in‐aid from the American Society for Biomechanics. Prior to his doctoral studies, he received a master's degree in Biomechanics and Movement Science and a bachelor's degree in Exercise Science from the University of Delaware. His interests include mathematical models of motor neuron function and the co‐ordination of musculoskeletal systems.

Edited by: Janet Taylor and Dario Farina
References
- Almuklass AM, Price RC, Gould JR & Enoka RM (2016). Force steadiness as a predictor of time to complete a pegboard test of dexterity in young men and women. J Appl Physiol 120, 1410–1417. [DOI] [PubMed] [Google Scholar]
- Ambike SS, Paclet F, Latash ML & Zatsiorsky VM (2013). Grip‐force modulation in multi‐finger prehension during wrist flexion and extension. Exp Brain Res 227, 509–522. [DOI] [PMC free article] [PubMed] [Google Scholar]
- Baldissera F, Cavallari P & Cerri G (1998). Motoneuronal pre‐compensation for the low‐pass filter characteristics of muscle. A quantitative appraisal in cat muscle units. J Physiol 511, 611–627. [DOI] [PMC free article] [PubMed] [Google Scholar]
- Barry BK, Pascoe MA, Jesunathadas M & Enoka RM (2007). Rate coding is compressed but variability is unaltered for motor units in a hand muscle of old adults. J Neurophysiol 97, 3206–3218. [DOI] [PubMed] [Google Scholar]
- Boonstra TW, Farmer S & Breakspear M (2016). Using computational neuroscience to define common input to spinal motor neurons. Front Hum Neurosci 10, 313. [DOI] [PMC free article] [PubMed] [Google Scholar]
- Buesing L, Macke JH & Sahani, M (2012). Spectral learning of linear dynamics from generalised‐linear observations with application to neural population data. NIPS 25, 1691–1699. [Google Scholar]
- Castronovo AM, Negro F, Conforto S & Farina D (2015). The proportion of common synaptic input to motor neurons increases with an increase in net excitatory input. J Appl Physiol 119, 1337–1346. [DOI] [PubMed] [Google Scholar]
- Christou E (2013). Aging and variability of voluntary contractions. Exerc Sport Sci Rev 39, 77–84. [DOI] [PMC free article] [PubMed] [Google Scholar]
- Del Vecchio A, Negro F, Felici F, Farina D (2017). Association between motor unit action potential parameters and surface EMG features. J Appl Physiol 123, 835–843. [DOI] [PubMed] [Google Scholar]
- Dideriksen JL, Negro F, Enoka RM, Farina D (2012). Motor unit recruitment strategies and muscle properties determine the influence of synaptic noise on force steadiness. J Neurophysiol 107, 3357–3369. [DOI] [PMC free article] [PubMed] [Google Scholar]
- Dideriksen JL, Feeney DF, Almuklass AW & Enoka RM (2017). Control of force during rapid visuomotor force‐matching tasks can be described by discrete time PID control algorithms. Exp Brain Res 235, 2561–2573. [DOI] [PubMed] [Google Scholar]
- Farina D, Negro F & Dideriksen JL (2014). The effective neural drive to muscles is the common synaptic input to motor neurons. J Physiol 49, 1–37. [DOI] [PMC free article] [PubMed] [Google Scholar]
- Farina D, Negro F, Muceli S & Enoka RM (2016). Principles of motor unit physiology evolve with advances in technology. Physiology 31, 83–94. [DOI] [PubMed] [Google Scholar]
- Feeney DF, Meyer FG, Noone N, Enoka RM (2017). A latent low‐dimensional common input drives a pool of motor neurons: a probabilistic latent state‐space model. J Neurophysiol 118, 2238–2250. [DOI] [PMC free article] [PubMed] [Google Scholar]
- Fuglevand AJ, Winter DA & Patla AE (1993). Models of recruitment and rate coding organization in motor‐unit pools. J Neurophysiol 70, 2470–2486. [DOI] [PubMed] [Google Scholar]
- Galganski ME, Fuglevand AJ & Enoka RM (1993). Reduced control of motor output in a human hand muscle of elderly subjects during submaximal contractions. J Neurophysiol 69, 2108–2115. [DOI] [PubMed] [Google Scholar]
- Gershon RC, Cella D, Fox NA, Havlik RJ, Hendrie HJ & Wagster MV (2010). Assessment of neurological and behavioural function: the NIH Toolbox. Lancet 9, 138–139. [DOI] [PubMed] [Google Scholar]
- Hamilton LD, Thomas E, Almuklass AM & Enoka RM (2017). A framework for identifying the adaptations responsible for differences in pegboard times between middle‐aged and older adults. Exp Gerontol 97, 9–16. [DOI] [PMC free article] [PubMed] [Google Scholar]
- Heckman CJ, Johnson M, Mottram C & Schuster J (2008). Persistent inward currents in spinal motoneurons and their influence on human motoneuron firing patterns. Neuroscientist 14, 264–275. [DOI] [PMC free article] [PubMed] [Google Scholar]
- Holobar A & Zazula D (2004). Correlation‐based decomposition of surface electromyograms at low contraction forces. Med Biol Eng Comput 42, 487–495. [DOI] [PubMed] [Google Scholar]
- Johnson MD, Thompson CK, Tysseling VM, Powers RK & Heckman CJ (2017). The potential for understanding the synaptic organization of human motor commands via the firing patterns of motoneurons. J Neurophysiol 118, 520–531. [DOI] [PMC free article] [PubMed] [Google Scholar]
- Katz B & Miledi R (1970). Membrane noise produced by acetylcholine Nature 226, 962‐963. [DOI] [PubMed] [Google Scholar]
- Kirkwood PA, Sears TA & Westgaard RH (1981). Recurrent inhibition of intercostal motoneurones in the cat. J Physiol 319, 111–130. [DOI] [PMC free article] [PubMed] [Google Scholar]
- Kuhn A, Aertsen A & Rotter S (2003). Higher‐order statistics of input ensembles and the response of simple model neurons. Neural Comput 15, 67–101. [DOI] [PubMed] [Google Scholar]
- Laidlaw DH, Bilodeau M & Enoka RM (2000). Steadiness is reduced and motor unit discharge is more variable in old adults. Muscle Nerve 23, 600–612. [DOI] [PubMed] [Google Scholar]
- Macke JH, Buesing L, Cunningham JP, Byron MY, Shenoy KV & Sahani M (2011). Empirical models of spiking in neural populations. NIPS 24, 1350–1358. [Google Scholar]
- Marmon AR, Pascoe MA, Schwartz RS & Enoka RM (2011a). Associations among strength, steadiness, and hand function across the adult life span. Med Sci Sports Exerc 43, 560–567. [DOI] [PubMed] [Google Scholar]
- Marmon AR, Pascoe MA, Schwartz RS & Enoka RM (2011b). Practicing a functional task improves steadiness with hand muscles in older adults. Med Sci Sports Exerc 43, 1531–1537. [DOI] [PubMed] [Google Scholar]
- Martinez‐Valdez E, Negro F, Laine CM, Falla D, Mayer F & Farina D (2017). Tracking motor units longitudinally across experimental sessions with high‐density surface electromyography. J Physiol 595, 1479–1496. [DOI] [PMC free article] [PubMed] [Google Scholar]
- Merletti R, Rainoldi A & Farina D (2001). Surface electromyography for noninvasive characterization of muscle. Exerc Sport Sci Rev 2, 20–25. [DOI] [PubMed] [Google Scholar]
- Moritz CT, Barry BK, Pascoe MA & Enoka RM (2005). Discharge rate variability influences the variation in force fluctuations across the working range of a hand muscle. J Neurophysiol 93, 2449–2459. [DOI] [PubMed] [Google Scholar]
- Negro F, Holobar A & Farina D (2009). Fluctuations in isometric muscle force can be described by one linear projection of low‐frequency components of motor unit discharge rates. J Physiol 527, 5925–5938. [DOI] [PMC free article] [PubMed] [Google Scholar]
- Negro F, Yavuz US & Farina D (2016a). The human motor neuron pools receive a dominant slow‐varying common synaptic input. J Physiol 594, 5491–5505. [DOI] [PMC free article] [PubMed] [Google Scholar]
- Negro F, Muceli S, Castronovo AM, Holobar A & Farina D (2016b). Multi‐channel intramuscular and surface EMG decomposition by convolutive blind source separation. J Neural Eng 13, 1741–1758. [DOI] [PubMed] [Google Scholar]
- Partridge LD (1965). Modification of neural output signals by muscles: a frequency response study. J Appl Physiol 20, 150‐156. [DOI] [PubMed] [Google Scholar]
- Powers RK, Heckman CJ (2017). Synaptic control of the shape of the motorneuron input‐output function. J Neurophysiol 117, 1171–1184. [DOI] [PMC free article] [PubMed] [Google Scholar]
- Ruff RM & Parker SB (1993). Gender‐ and age‐specific changes in motor speed and eye‐hand coordination in adults: normative values for the finger tapping and grooved pegboard tests. Percept Mot Skills 76, 1219–1230. [DOI] [PubMed] [Google Scholar]
- Tracy BL (2007). Force control is impaired in the ankle plantarflexors of elderly adults. Eur J Appl Physiol 101, 629–636. [DOI] [PubMed] [Google Scholar]
- Vila‐Cha C, Falla D & Farina D (2010). Motor unit behavior during submaximal contractions following six weeks of either endurance or strength training. J Appl Physiol 109, 1455‐1466. [DOI] [PubMed] [Google Scholar]
- Wang YC, Magasi SR, Bohannon RW, Reuben DB, McCreath HE, Bubela DJ, Gershon RC & Rymer, ZW (2011). Assessing dexterity function: a comparison of two alternatives for the NIH Toolbox. J Hand Ther 24, 313–321. [DOI] [PMC free article] [PubMed] [Google Scholar]
- Werremeyer MM & Cole KJ (1997). Wrist action affects precision grip force. J Neurophysiol 78, 271–280. [DOI] [PubMed] [Google Scholar]
- Windhorst U (1989). Do Renshaw cells tell spinal neurones how to interpret muscle spindle signals? Prog Brain Res 80, 283–294. [DOI] [PubMed] [Google Scholar]
- Yu WS, van Duinen H & Gandevia SC (2010). Limits to the control of human thumb and fingers in flexion and extension. J Neurophysiol 103, 278–289. [DOI] [PubMed] [Google Scholar]