Abstract
Here we present ecophysiological studies of the anaerobic sulfide oxidizers considered critical to cryptic sulfur cycling in oceanic oxygen minimum zones (OMZs). We find that HS− oxidation rates by microorganisms in the Chilean OMZ offshore from Dichato are sufficiently rapid (18 nM h−1), even at HS− concentrations well below 100 nM, to oxidize all sulfide produced during sulfate reduction in OMZs. Even at 100 nM, HS− is well below published half-saturation concentrations and we conclude that the sulfide-oxidizing bacteria in OMZs (likely the SUP05/ARTIC96BD lineage of the gammaproteobacteria) have high-affinity (>105 g−1 wet cells h−1) sulfur uptake systems. These specific affinities for sulfide are higher than those recorded for any other organism on any other substrate. Such high affinities likely allow anaerobic sulfide oxidizers to maintain vanishingly low sulfide concentrations in OMZs driving marine cryptic sulfur cycling. If more broadly distributed, such high-affinity sulfur biochemistry could facilitate sulfide-based metabolisms and prominent S-cycles in many other ostensibly sulfide-free environments.
Introduction
Sulfur cycling has classically been overlooked as an important component of global ocean water column biogeochemistry. Discovery of cryptic anaerobic sulfur cycling in the Chilean upwelling system [1], however, suggests that pelagic sulfate reduction and oxidation contribute to global marine carbon and nitrogen cycles. Here, up to 33% of carbon mineralization is channeled through sulfate reduction liberating up to 22% of the ammonium that fuels fixed nitrogen loss from the ocean [1]. This sulfur cycle is cryptic because the sulfide produced fails to accumulate to levels detectable (>0.5 µM) using routinely employed analytical techniques [2]. This lack of sulfide accumulation under anoxic conditions has been attributed to its rapid anaerobic re-oxidation by nitrate-reducing bacteria [1]. Sulfur-oxidizing, nitrate-reducing bacteria are indeed ubiquitous and abundant members of oxygen minimum zone (OMZ) microbial communities [1, 3–6]. Although sulfide oxidation has been detected at relatively high sulfide concentrations, and with long incubation times [1], it has yet to be measured under the low nM sulfide concentrations that likely prevail in most OMZs and that have been detected more broadly throughout the well-oxygenated global ocean [7, 8]. Such sulfide concentrations are well below those tractable through previous laboratory studies of aerobic and phototrophic sulfide oxidation [9] and thus threshold sulfide concentrations needed for microbial sulfide oxidation remain entirely unknown.
We therefore measured bacterial sulfide oxidation at concentrations relevant to cryptic sulfur cycling, formulated predictive rate equations, and tested the physiological thresholds for microbial sulfide oxidation. We collected water from the OMZ offshore of Dichato, Chile, and amended it with sulfide to sub-µM concentrations. We leveraged the high sensitivity and rapid analysis time of Au/Hg amalgam microelectrodes and analytical voltammetry to track sulfide oxidation kinetics down to low nM concentrations in real-time revealing that OMZ microorganisms exhibit extremely high affinities for sulfide.
Materials and methods
Sample collection and hydrographic profiles
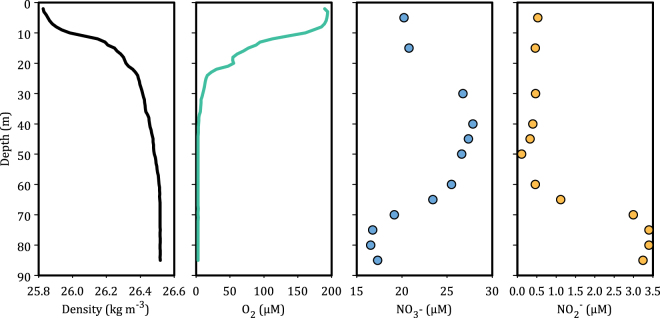
We determined sulfide consumption kinetics in two samples of water collected from 55 m depth and one sample of water collected from 85 m depth in the Chilean OMZ, 18 kilometers offshore from Dichato (36°30.85′S–73°07.75′W), during the MOOMZ-4 cruise in March 2012 (Fig. 1). Samples for all incubations and chemical analyses were collected from the R/V Kay Kay (II) using a pump-cast system. We overflowed 500 ml glass bottles (5×) with water directly from the pump tubing for subsequent amendment with sulfide and incubation experiments. Profiles of temperature, salinity, and oxygen concentrations were generated using a Seabird CTD (SeaBird SBE 25 CTD (conductivity, temperature and depth measuring device), SBE 43 oxygen sensor) (Fig. 1). Nitrate and nitrite concentrations (Fig. 1) were determined as previously described [10]. Water column sulfide concentrations were determined by voltammetry, as described below, using a flow through electrochemical cell constructed of PEEK [11]. Sulfide concentrations were below our sea-based detection limit of 40 nM —this relatively high detection limit at sea resulted from electrical noise from the pump-cast system.
Fig. 1.
Physical–chemical profiles of the water column (March 2012) at St. 18, 18 kilometers offshore of Dichato Chile. S uptake experiments were conducted using water recovered from 55 m and 85 m depths
Voltammetry
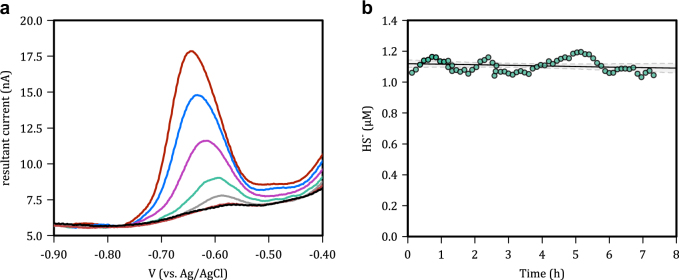
To determine sulfide consumption rates in real-time, at environmentally relevant sulfide concentrations, we used analytical voltammetry with a Au/Hg amalgam microelectrode as the working electrode [12]. Voltammetry was conducted in a three-electrode configuration using a Pt wire as the counter and an in house built Ag/AgCl electrode as the reference. All potentials discussed hereafter are referenced to this Ag/AgCl electrode. The working electrode was held at a potential of −0.9 V for 60 s between scans in order to remove any residual sulfide that may have accumulated during the previous scan and to prevent the accumulation of sulfide in the electrode between scans. To enhance sensitivity, HS- was deposited in the Hg amalgam by holding the working electrode at a potential of −0.1 V for 60 s under vigorously stirred conditions. Following this deposition period, the working electrode was scanned using a square-wave function from −0.1 V to −1.7 V with a pulse height of 16 mV, a step width of 4 ms yielding a scan rate of 200 mV s−1, and a total measurement cycle time of 128 s including the deposition step and the time between scans. Quantification was achieved by calculating the height of peaks in the resultant (forward-reverse currents) current, at potentials characteristic for the reduction of HgS to ∑H2S, which are between −0.6 and −0.7 V, depending on concentration (Fig. 2a). Our detection limit for ∑H2S in a well-stirred reaction vessel is < 5–10 nM, as defined by 3 × the amplitude of electrical noise between −0.6 and −0.7 V. Oxygen concentrations were also determined by linear sweep voltammetry with a detection limit of ~ 1 µM . Electrodes were calibrated using the addition of known volumes of a Na2S stock solution that was measured independently by spectrophotometry [2]. The stability of the electrochemical cell and incubation vessel (see description below) was evaluated by monitoring sulfide concentrations (nominally 1 µM) over an 8-h period (Fig. 2b). Linear regression has a slope of −0.002 ± 0.004 µM h−1 and is thus not significantly different than zero demonstrating stability.
Fig. 2.
a Raw voltammetric scans demonstrating the sensitivity and robust nature of the sulfide signals generated in our experiments. Black trace = 0 nM, red trace (bottom) = 2.5 nM −1, gray trace = 30 nM , green trace = 60 nM , pink trace = 120 nM , blue trace = 210 nM , red trace (top) = 300 nM . Scan direction was from positive to negative. b Control experiment demonstrating the stability of sulfide in filtered seawater in the incubation vessel. Linear regression has a slope of -0.002 ± 0.004 µM h−1 and is thus not significantly different than zero demonstrating stability
Incubations
Incubations were conducted in a 250 ml stirred glass incubation vessel, which housed our electrochemical cell. Importantly, the incubation vessel was metal free to preclude any reaction of sulfide with metallic surfaces. The incubation vessel was equipped with a PEEK coated magnetic stir-bar fixed to a screw top lid to permit vigorous stirring during the incubation period. Seawater was transferred anoxically and aseptically from our 500 ml sampling bottles to the incubation vessel using gas-tight tubing with a positive pressure of N2 gas. A 5 mL headspace was left in the incubation vessel for 1 h following transfer, during which time the seawater was bubbled with N2 gas to remove any residual oxygen. Voltammetric analyses were conducted after this 1-h period to confirm that oxygen concentrations were below 1 µM, and the 5 ml headspace was filled with additional anoxic seawater. In order to maximize microbial sulfide uptake rates, the temperature of the seawater was allowed to rise to the ambient room temperature of 21.5 °C. The reaction vessel was kept dark during incubations. Incubations were initiated by injecting 15 µl from a nominally 3.5 mM NaS2 solution into the incubation vessel. Parallel incubations were killed with formalin (final concentration of 2%). ∑H2S concentrations in these killed controls, as well as initial and final ∑H2S concentrations in the live incubations were determined by spectrophotometry [2] with a 10 cm path length spectrometric cell (detection limit of 0.1 µM) following preservation of subsamples with Zn acetate (0.1% final concentrations). Although we did not measure corresponding accumulation of oxidized sulfur, we assumed that sulfide consumed was oxidized to elemental sulfur or sulfate, as previously suggested [1].
Microscopy and flow cytometry
Seawater was fixed with paraformaldehyde (final concentration, 2%) for Catalyzed Reporter Deposition Fluorescence In Situ Hybridization (CARD-FISH) microscopy and filtered through 0.2 µm polycarbonate filters. Filter sections were hybridized as described by Pernthaler and Pernthaler [13]; with horseradish peroxidase-labelled oligonucleotide probes GSO477 (5′-CTAAAGTTAACGTCAAGG-3′), designed specifically for detection of bacteria of the GSO cluster [3]; Gam42a (5′-GCCTTCCCACATCGTTT-3′) and nonlabeled competitor Bet42a-none were used to broadly hybridize and estimate the abundance of γ-proteobacteria; and EubI + II + III (5′-GCTGCCTCCCGTAGGAGT-3′, 5′-GCAGCCACCCGTAGGTGT-3′, 5′-GCTGCCACCCGTAGGTGT-3′, respectively), designed to hybridize with bacteria generally and exclude Archaea. Total cell counts were determined by flow cytometry [14].
Calculation of rates and rate constants
We calculated rates of sulfide consumption by taking the first derivative of sulfide concentrations as a function of incubation time. The raw data were first smoothed with a 6th order polynomial using 20-point (55 m) or 6-point (85 m) intervals. A non-linear regression was then used to fit a standard Michaelis–Menten model to the resulting rate data as a function of sulfide concentrations:
where R is the reaction rate (nM h-1), Vmax is the maximum reaction rate (nM h-1), [S] is the sulfide concentration (nM) and Km is the sulfide concentration (nM) at half the maximum rate (Table 1). The data range used was varied to evaluate sensitivity to lower quality data at high sulfide concentrations near the beginning of the incubations and low sulfide concentrations toward the end of the incubations. In addition to the regression analyses, kinetic constants for 55 m were estimated using the Hanes–Woolf linearization, although the linearization could only be performed with rate data collected between 100 and 300 nM due to strongly non-linear behavior below 100 nM indicating departure from a Michaelis–Menten model. We also explored the fit of an allosteric sigmoidal model to data from 55 m. Allosteric models generally describe the kinetics of enzymes possessing cooperative subunits according to:
Where R is the reaction rate (nM h−1), Vmax is maximum reaction rate (nM h−1), [S] is the substrate concentration (nM), K’ is the substrate concentration at half the maximum reaction rate (nM) (K0.5, analogous to Km) to the power of h, and h is the hill slope, an empirical measure of the steepness of the curve and enzyme binding by an effector.
Table 1.
Kinetic parameters for models of sulfide oxidation
| K m(0.5) | Km(0.5) SE | V max | Vmax SE | R 2 | x min | x max | y max | Affinity-l | Affinity-h | |
|---|---|---|---|---|---|---|---|---|---|---|
| 55 m | ||||||||||
| Fit 1 | 170 | 10 | 160 | 10 | 0.94 | 0 | – | – | 60,000 | 150,000 |
| Fit 2 | 140 | 10 | 150 | 5 | 0.94 | 20 | – | – | 68,000 | 171,000 |
| Fit 3 | 340 | 50 | 270 | 30 | 0.95 | 0 | 210 | – | 51,000 | 130,000 |
| Fit 4 | 130 | 10 | 140 | – | 0.94 | 0 | – | 140 | 69,000 | 170,000 |
| Fit 5 | 85 | – | 120 | 2 | 0.9 | 0 | – | – | 90,000 | 220,000 |
| Hanes-Woolf | 25 | 2 | 100 | 1 | 0.99 | 100 | 300 | – | 60,000 | 150,000 |
| Allosterica | 6 | 0.6 | 95 | 0.5 | 0.99 | 0 | – | – | 68,000 | 171,000 |
| 85 m | ||||||||||
| Fit 1 | 210 | 20 | 90 | 5 | 0.83 | 0 | – | – | 12,000 | 24,000 |
Km half-saturation constant (nM ), Vmax maximum rate (nM h−1), xmin minimum sulfide concentration considered (nM ), xmax maximum sulfide concentration considered (nM ), ymax maximum rate considered (nM h−1), Affinity-l based on 27,500 cells mL−1 (L g−1 wet cells h−1), Affinity-h based on 11,000 cells mL−1 (L g−1 wet cells h−1)
aFor allosteric, the hill slope was h = 2.252(±0.03)
Specific affinities were calculated by dividing Vmax by Km [15]. Cell-specific maximum rates were determined by dividing our measured volume specific Vmax by cellular biomass. Wet biomass was estimated assuming a cell radius of 0.5 µm [16], which translates to a cell volume of 0.52 µm3, although we also consider cell volumes as low as 0.06 µm3 [17]. With typical cell densities of 1.09 g cm−3 (range for E. Coli from 1.08 to 1.10 g cm−3) [18] a volume of 0.52 µm3 translates to wet mass of 0.57 pg cell−1. At 11,000–27,500 cells mL−1 (GSO cluster and γ-proteobacteria, respectively), we calculate 6–16 µg L−l wet cellular biomass in our incubations and with, for example data from 55 m fit 1 (Table 1), a volume-specific Vmax of 140 nM h−1 yields a biomass-specific Vmax of 0.8 to 0.3 g S g−1 wet cells h−1. Dividing these values by Km (170 nM ) yields specific affinities of 150,000 to 60,000 l g−1 wet cells h−1, depending on whether we consider the SUP05/ARTIC96BD as the exclusive S oxidizers, or the γ-proteobacteria more generally.
Results and discussion
S-oxidation rates
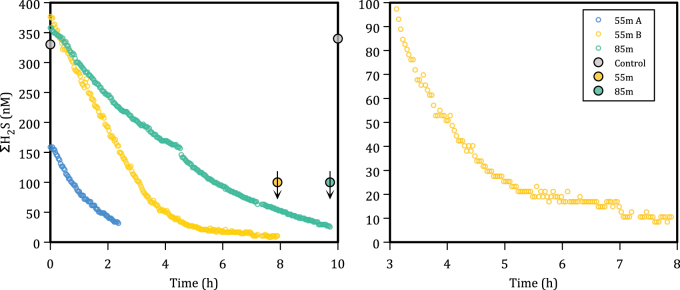
Sulfide concentrations decreased with time in both incubations of water from 55 m depth, and water from 85 m depth. Sulfide concentrations in water from 55 m depth decreased linearly to below 100 nM (Fig. 3a). Below 100 nM , sulfide continued to decrease, but at a slower rate, and eventually reached our detection limit of <5 nM after about 8 h (Fig. 3b). Sulfide concentrations in water from 85 m depth also decreased, but at a lower rate than water from 55 m depth. There was no detectable decrease in sulfide concentrations in killed controls of water from 55 m depth over the duration of our incubations (Fig. 3a), or over an extended 72-h incubation period (data not shown) implying that sulfide oxidation in our incubations was biologically catalyzed. Importantly, microbial sulfide oxidation in water from 55 m proceeded at measurable rates at sulfide concentrations down to at least 5 nM with no indication for a threshold concentration below which sulfide was not oxidized.
Fig. 3.
a Sulfide concentrations in incubations of water from 55 m (yellow and blue open symbols) and 85 m (green open symbols) depths in the Chilean OMZ near Dichato as a function of time incubated. Closed symbols depict discrete samples measured by spectrophotometry. Closed gray symbols demonstrate lack of sulfide oxidation in formalin killed controls. b Shows the last 5 h of incubation from 55 m depth demonstrating sulfide uptake to below 10 nM . Arrows indicate that these data points represent the spectrophotometric limit of detection (0.1 µM), whereas the measured values are below the limit of detection
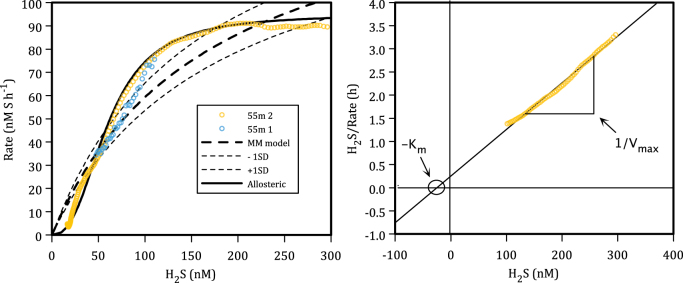
Sulfide oxidation kinetics at 55 m could reasonably (R2 = 0.9–0.99) be fit with a Michaelis–Menten model with Vmax values of between 95 and 270 nM h−1, and Km values of between 25 and 340 nM (Fig. 4, Table 1) depending on the model fit and the data range used. Kinetic parameters estimated through a Hanes–Woolf linearization were comparable to those estimated using non-linear regression (Fig. 4b, Table 1). The range of Vmax values from all fits is well in line with sulfide oxidation rates (160 nM h−1) calculated from previous measurements of N2 and N2O production rates from station 18 water at 90 m depth following amendment with 5 µM sulfide [10]. Sulfide oxidation kinetics at 55 m depth were best fit with an allosteric model implying that the responsible enzymes may have multiple interacting components and that the presence of at least low concentrations of sulfide enhances rates of sulfide oxidation (Fig. 4, Table 1). Sulfide oxidation kinetics at 85 m depth were fit with lower Vmax and higher Km than 55 m depth. Little information is available in existing literature for comparison with our Km values. Previous analyses of growth kinetics through phototrophic sulfide oxidization were described using Monod models with half-saturation constants down to about 800 nM [9]. Phototrophic sulfide oxidizers thus appear to become sulfide limited at sulfide concentrations much higher than the OMZ microorganisms studied here and thus likely have a lower affinity for sulfide (see below). Sulfide uptake kinetics by Thiobacillus neapolitanus in chemostats imply half-saturation constants for growth below 6000 nM [9], which is much higher than the Km values we determined. More data are thus needed to test whether the low Km values measured for sulfide oxidation are more broadly representative of microbial sulfide oxidation in general.
Fig. 4.
a Data from Fig. 3 (55 m) converted to rates. Dashed lines show Michaelis–Menten model kinetics (fit 1 from table 2) with Vmax of 160nM h−1, and Km of 170 nM and ±1 SD on the Km value. The solid line shows the fit of the allosteric model to the data. b Hanes–Woolf linearization of rate data from 55 m
Ecophysiology of sulfide-oxidizing community
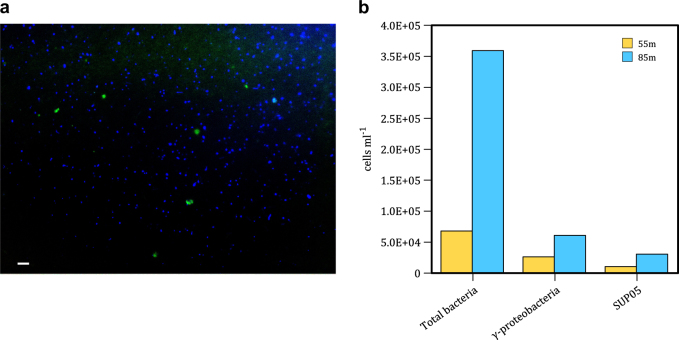
Bacteria of the SUP05 and ARTIC96BD clades are recognized as important contributors to sulfur oxidation in many OMZs [1, 3, 4, 6, 19–21] including our study site offshore of Dichato [22]. A single representative of this group has been isolated (Candidatus Thioglobus autotrophica Strain EF1) [16, 23], and experiments confirm its capacity to oxidize reduced sulphur compounds. At 11 ± 3 × 10³ and 31 ± 10 × 103 cells mL−1 the SUP05/ARTIC96BD bacteria represented 16 and 9 % of the total bacterial community in our incubations from 55 and 85 m, respectively (Fig. 5). Maximum sulfide oxidation rates at 55 m translate to cell-specific oxidation at rates of 9 fmol cell h−1, if sulfide oxidation is accomplished exclusively by SUP05/ARTIC96BD bacteria. The γ-proteobacteria in general represented 40% of the total bacterial community at 55 m (Fig. 5) (i.e., cells that hybridized to the eubacterial FISH probes) and if we assume all γ-proteobacteria are sulfide oxidizers then their cell density of 4 × 10⁴ cells mL−1 translates to maximum sulfide oxidation rates of 4 fmol cell h−1. We note, however, that our estimates of γ-proteobacteria based on hybridization to GAM42a may not capture some uncultured taxa and may thus underestimate total γ-proteobacteria and by extension overstate cell specific rates if all γ-proteobacteria oxidize sulfide [24].
Fig. 5.
a Representative fluorescence micrograph of microorganisms from 55 m stained with DAPI (blue) and probe GSO477 (green). b Cell counts from 55 and 85 m. Total counts determined by flow cytometry as well as numbers of cells belonging to the γ-proteobacteria clade and the SUP05 clade enumerated by microscopy after staining with the Gam42a, GSO477 and EubI + II + III probes to obtain relative abundances, which were translated to absolute abundances using flow cytometry
Specific substrate affinities (a = Vmax/Km) provide a basis for comparing substrate utilization by microorganisms. Sulfide oxidizers in the Chilean OMZ exhibit specific affinities for sulfide of between 51,000 and 220,000 L g−1 wet cells h−1 (Table 1, Fig. 6), depending on the fit used and whether sulfide oxidation is accomplished by all γ-proteobacteria or by the SUP05/ARTIC96BD exclusively (at 55 m depth), respectively. Note that the lower estimates for biovolumes of 0.06 µm3 [17] would lead to specific affinities up to two orders of magnitude higher than what we report here. When compared with other organisms recognized to have high specific affinities for their substrates, for example, the 68,700 L g−1 wet cells h−1 of nitrifying Archaea, Nitrosopumilus maritimus SCM1 [25] and the 2290 L g−1 wet cells h−1 of oligotrophic diatoms, Thalassiosira pseudonana [26] for ammonium, or the 120,000 L g−1 wet cells h−1 of oligotrophic organotrophs, Cycloclasticus oligotrophus for their carbon substrates [15], it becomes apparent that the sulfide-oxidizing microorganisms in the Chilean OMZ waters have a remarkable capacity for sulfide utilization at low concentrations. They have an affinity for sulfide that may be unmatched by any organism for any other substrate measured to date. There are, however, very few kinetic analyses of environmental communities in the existing literature, and such high-affinity metabolisms may be much more common than we currently appreciate. Further evidence for this comes from observations of oxygen uptake at low nM concentrations by a diversity of marine microorganisms [27–29] and the distribution of such high-affinity metabolisms should be tested across a broader array of substrates and environments.
Fig. 6.
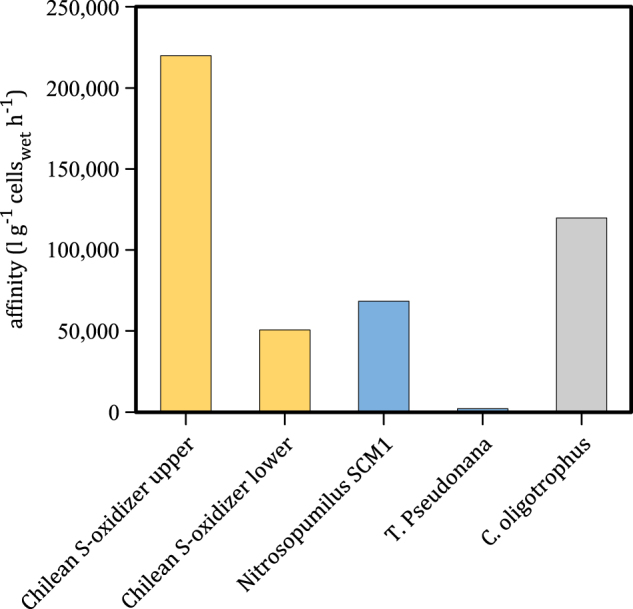
Specific affinities (a = Vmax/Km) calculated for sulfide-oxidizing bacteria of the Chilean OMZ in comparison to nitrifying Archaea Nitrosopumilus maritimus SCM1 [25] and oligotrophic diatoms Thalassiosira pseudonana [26] for ammonium, and the highest specific affinity organotrophs, Cycloclasticus oligotrophus for carbon [15]
Cryptic S-cycling
Parallel incubations conducted with radioactive 35S-sulfate failed to detect microbial sulfate reduction in the water column during our sampling season. Sulfide must then be supplied by transient pelagic sulfate reduction, or transient sulfide fluxes from the sediment, or some combination of the two. Capacity for sulfide oxidation is thus retained for some period in the absence of direct, contemporaneous sulfide production. Volume-specific sulfate reduction rates up to 1 nM h−1 have, however, been measured in the Chilean OMZ offshore from Iquique [1]. At these rates of sulfate reduction, and considering a possible sulfide concentration as low as 10 nM, a sulfide-oxidizing population with a density as low as 2 × 10³ cells mL−1 would keep pace with sulfate reduction, preventing sulfide accumulation and leading to a cryptic sulfur cycle. High-affinity sulfide uptake systems thus likely play an important role in OMZ biogeochemistry and by extension global biogeochemical cycles. Such high-affinity sulfide uptake systems may exist beyond the γ-proteobacteria, as suggested by measurements of sulfide uptake at low sulfide concentrations in anoxygenic photosynthetic sulfide-oxidizing Chlorobi [30]. If more broadly distributed, high-affinity sulfide uptake could support cryptic sulfur cycling in other low sulfide environments like animal hosts [31], or in the iron-rich oceans of the early Earth [32].
Acknowledgements
We thank the crew of the RV Kay Kay II for help collecting samples, Gadiel Alarcón for help with logistics and Joe Jennings for nutrient analysis. This study was supported by the Danish National Research Foundation (grant DNRF53), the Danish Council of Independent Research, European Research Council (“Oxygen” grant 267233) and the Agouron Institute and the Millennium Science Initiative (Grant IC 120019).
Compliance with ethical standards
Conflict of interest
The authors declare that they have no conflict of interest.
References
- 1.Canfield DE, Stewart FJ, Thamdrup B, De Brabandere L, Dalsgaard T, Delong EF, et al. A cryptic sulfur cycle in oxygen-minimum-zone waters off the Chilean coast. Science. 2010;330:1375–8. doi: 10.1126/science.1196889. [DOI] [PubMed] [Google Scholar]
- 2.Cline JD. Spectrophotometric determination of hydrogen sulfide in natural waters. Limnol Oceanogr. 1969;14:454. doi: 10.4319/lo.1969.14.3.0454. [DOI] [Google Scholar]
- 3.Lavik G, Stuhrmann T, Bruchert V, Van der Plas A, Mohrholz V, Lam P, et al. Detoxification of sulphidic African shelf waters by blooming chemolithotrophs. Nature. 2009;457:581–U586. doi: 10.1038/nature07588. [DOI] [PubMed] [Google Scholar]
- 4.Stevens H, Ulloa O. Bacterial diversity in the oxygen minimum zone of the eastern tropical South Pacific. Environ Microbiol. 2008;10:1244–59. doi: 10.1111/j.1462-2920.2007.01539.x. [DOI] [PubMed] [Google Scholar]
- 5.Walsh DA, Zaikova E, Howes CG, Song YC, Wright JJ, Tringe SG, et al. Metagenome of a versatile chemolithoautotroph from expanding oceanic dead zones. Science. 2009;326:578–82. doi: 10.1126/science.1175309. [DOI] [PubMed] [Google Scholar]
- 6.Wright JJ, Konwar KM, Hallam SJ. Microbial ecology of expanding oxygen minimum zones. Nat Rev Microbiol. 2012;10:381–94. doi: 10.1038/nrmicro2778. [DOI] [PubMed] [Google Scholar]
- 7.Luther GW, Tsamakis E. Concentration and form of dissolved sulfide in the oxic water column of the ocean. Mar Chem. 1989;27:165–77. doi: 10.1016/0304-4203(89)90046-7. [DOI] [Google Scholar]
- 8.Cutter GA, Krahforst CF. Sulfide in surface waters of the western Atlantic Ocean. Geophys Res Lett. 1988;15:1393–6. doi: 10.1029/GL015i012p01393. [DOI] [Google Scholar]
- 9.Vangemerden H. The sulfide affinity of phototrophic bacteria in relation to the location of elemental sulfur. Arch Microbiol. 1984;139:289–94. doi: 10.1007/BF00408368. [DOI] [Google Scholar]
- 10.Galán A, Faúndez J, Thamdrup B, Santibáñez JF, Farías L. Temporal dynamics of nitrogen loss in the coastal upwelling ecosystem off central Chile: evidence of autotrophic denitrification through sulfide oxidation. Limnol Oceanogr. 2014;59:1865–78. doi: 10.4319/lo.2014.59.6.1865. [DOI] [Google Scholar]
- 11.Luther GW, Glazer BT, Ma SF, Trouwborst RE, Moore TS, Metzger E, et al. Use of voltammetric solid-state (micro)electrodes for studying biogeochemical processes: laboratory measurements to real time measurements with an in situ electrochemical analyzer (ISEA) Mar Chem. 2008;108:221–35. doi: 10.1016/j.marchem.2007.03.002. [DOI] [Google Scholar]
- 12.Brendel PJ, Luther GW. Development of a gold amalgam voltammetric microelectrode for the determination of dissolved Fe, Mn, O-2, and S(-Ii) in porewaters of marine and fresh-water sediments. Environ Sci Technol. 1995;29:751–61. doi: 10.1021/es00003a024. [DOI] [PubMed] [Google Scholar]
- 13.Pernthaler A, Pernthaler J. Fluorescence in situ hybridization for the identification of environmental microbes. Methods Mol Biol. 2007;353:153–64. doi: 10.1385/1-59745-229-7:153. [DOI] [PubMed] [Google Scholar]
- 14.Marie D, Partensky F, Jacquet S, Vaulot D. Enumeration and cell analysis of natural populations of marine picoplanktonby flow citometry using the nucleic acid strain SYBRGreen I. Appl Environ Microb. 1997;63:186–93. doi: 10.1128/aem.63.1.186-193.1997. [DOI] [PMC free article] [PubMed] [Google Scholar]
- 15.Button DK. Nutrient uptake by microorganisms according to kinetic parameters from theory as related to cytoarchitecture. Microbiol Mol Biol R. 1998;62:636. doi: 10.1128/mmbr.62.3.636-645.1998. [DOI] [PMC free article] [PubMed] [Google Scholar]
- 16.Marshall KT, Morris RM. Isolation of an aerobic sulfur oxidizer from the SUP05/Arctic96BD-19 clade. ISME J. 2013;7:452–5. doi: 10.1038/ismej.2012.78. [DOI] [PMC free article] [PubMed] [Google Scholar]
- 17.Rogge A, Vogts A, Voss M, Jürgens K, Jost G, Labrenz M. Success of chemolithoautotrophic SUP05 and Sulfurimonas GD17 cells in pelagic Baltic Sea redox zones is facilitated by their lifestyles as K‐and r‐strategists. Environ Microbiol. 2017;19:2495–506. doi: 10.1111/1462-2920.13783. [DOI] [PubMed] [Google Scholar]
- 18.Woldringh C, Binnerts J, Mans A. Variation in Escherichia coli buoyant density measured in Percoll gradients. J Bacteriol. 1981;148:58–63. doi: 10.1128/jb.148.1.58-63.1981. [DOI] [PMC free article] [PubMed] [Google Scholar]
- 19.Glaubitz S, Kießlich K, Meeske C, Labrenz M, Jürgens K. SUP05 dominates the gammaproteobacterial sulfur oxidizer assemblages in pelagic redoxclines of the central Baltic and Black Seas. Appl Environ Microbiol. 2013;79:2767–76. doi: 10.1128/AEM.03777-12. [DOI] [PMC free article] [PubMed] [Google Scholar]
- 20.Stewart FJ, Ulloa O, DeLong EF. Microbial metatranscriptomics in a permanent marine oxygen minimum zone. Environ Microbiol. 2012;14:23–40. doi: 10.1111/j.1462-2920.2010.02400.x. [DOI] [PubMed] [Google Scholar]
- 21.Fuchs BM, Woebken D, Zubkov MV, Burkill P, Amann R. Molecular identification of picoplankton populations in contrasting waters of the Arabian Sea. Aquat Microb Ecol. 2005;39:145–57. doi: 10.3354/ame039145. [DOI] [Google Scholar]
- 22.Murillo AA, Ramírez-Flandes S, DeLong EF, Ulloa O. Enhanced metabolic versatility of planktonic sulfur-oxidizing γ-proteobacteria in an oxygen-deficient coastal ecosystem. Front Mar Sci. 2014;1:18. doi: 10.3389/fmars.2014.00018. [DOI] [Google Scholar]
- 23.Shah V, Morris RM. Genome sequence of “Candidatus Thioglobus autotrophica” strain EF1, a chemoautotroph from the SUP05 clade of marine gammaproteobacteria. Genome Announc. 2015;3:e01156–01115. doi: 10.1128/genomeA.01156-15. [DOI] [PMC free article] [PubMed] [Google Scholar]
- 24.Martens-Habbena W, Yeates C, Saunders AM, Crocetti GR, Blackall LL. Limitations of the widely used GAM42a and BET42a probes targeting bacteria in the Gammaproteobacteria radiation. Microbiology. 2003;149:1239–1247. doi: 10.1099/mic.0.26112-0. [DOI] [PubMed] [Google Scholar]
- 25.Martens-Habbena W, Berube PM, Urakawa H, de la Torre JR, Stahl DA. Ammonia oxidation kinetics determine niche separation of nitrifying Archaea and Bacteria. Nature. 2009;461:976–U234. doi: 10.1038/nature08465. [DOI] [PubMed] [Google Scholar]
- 26.Eppley RW, Rogers JN, Mccarthy JJ. Half-saturation constants for uptake of nitrate and ammonium by marine phytoplankton. Limnol Oceanogr. 1969;14:912–&. doi: 10.4319/lo.1969.14.6.0912. [DOI] [Google Scholar]
- 27.Garcia-Robledo CC, Aldunate M, Stewart FJ, Ulloa O, Paulmier A, et al. Cryptic oxygen cycling in anoxic marine zones. Proc Natl Acad Sci USA. 2016;114:8319–8324. doi: 10.1073/pnas.1619844114. [DOI] [PMC free article] [PubMed] [Google Scholar]
- 28.Bristow LA, Dalsgaard T, Tiano L, Mills DB, Bertagnolli AD, Wright JJ, et al. Ammonium and nitrite oxidation at nanomolar oxygen concentrations in oxygen minimum zone waters. Proc Natl Acad Sci USA. 2016;113:10601–6. doi: 10.1073/pnas.1600359113. [DOI] [PMC free article] [PubMed] [Google Scholar]
- 29.Revsbech NP, Larsen LH, Gundersen J, Dalsgaard T, Ulloa O, Thamdrup B. Determination of ultra‐low oxygen concentrations in oxygen minimum zones by the STOX sensor. Limnol Oceanogr: Methods. 2009;7:371–81. doi: 10.4319/lom.2009.7.371. [DOI] [Google Scholar]
- 30.Crowe SA, Maresca JA, Jones C, Sturm A, Henny C, Fowle DA, et al. Deep-water anoxygenic photosythesis in a ferruginous chemocline. Geobiology. 2014;12:322–39. doi: 10.1111/gbi.12089. [DOI] [PubMed] [Google Scholar]
- 31.Newton ILG, Woyke T, Auchtung TA, Dilly GF, Dutton RJ, Fisher MC, et al. The <em> Calyptogena magnifica </em> chemoautotrophic symbiont genome. Science. 2007;315:998–1000. doi: 10.1126/science.1138438. [DOI] [PubMed] [Google Scholar]
- 32.Poulton SW, Canfield DE. Ferruginous conditions: a dominant feature of the ocean through Earth’s history. Elements. 2011;7:107–12. doi: 10.2113/gselements.7.2.107. [DOI] [Google Scholar]


