

Summary
The cerebral cortex underwent rapid expansion and increased complexity during recent hominid evolution. Gene duplications constitute a major evolutionary force, but their impact on human brain development remains unclear. Using tailored RNA sequencing (RNA-seq), we profiled the spatial and temporal expression of hominid-specific duplicated (HS) genes in the human fetal cortex and identified a repertoire of 35 HS genes displaying robust and dynamic patterns during cortical neurogenesis. Among them NOTCH2NL, human-specific paralogs of the NOTCH2 receptor, stood out for their ability to promote cortical progenitor maintenance. NOTCH2NL promote the clonal expansion of human cortical progenitors, ultimately leading to higher neuronal output. At the molecular level, NOTCH2NL function by activating the Notch pathway through inhibition of cis Delta/Notch interactions. Our study uncovers a large repertoire of recently evolved genes active during human corticogenesis and reveals how human-specific NOTCH paralogs may have contributed to the expansion of the human cortex.
Keywords: brain development, human evolution, neurogenesis, Notch, cerebral cortex
Graphical Abstract
Highlights
-
•
Identification of >35 HS protein-coding genes expressed during human corticogenesis
-
•
NOTCH2NL human-specific paralogs of NOTCH2 expressed in human cortical progenitors
-
•
NOTCH2NL genes expand human cortical progenitors and their neuronal output
-
•
NOTCH2NL promotes Notch signaling through cis-inhibition of Delta/Notch interactions
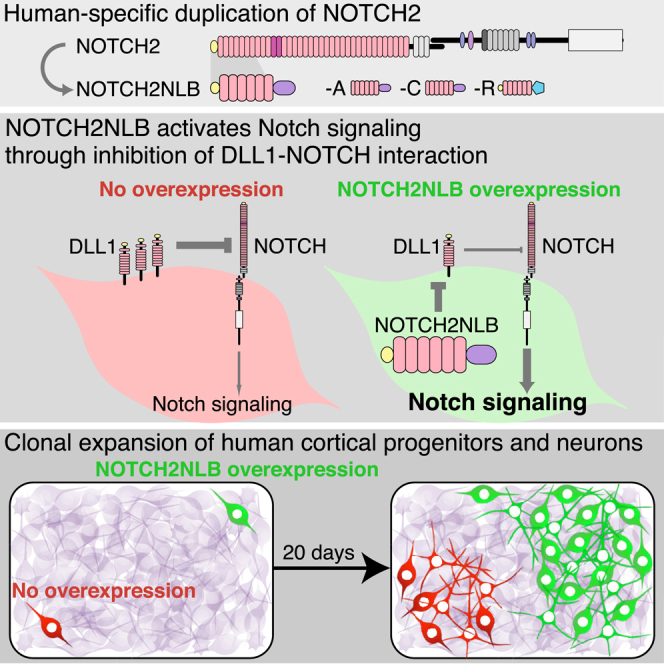
Human-specific NOTCH2NL expands cortical progenitors and neuronal output and thus may have contributed to the expansion of the human cortex.
Introduction
The cerebral cortex underwent a considerable increase in size and complexity over the last millions of years of hominid evolution, with significant impact on the acquisition of cognitive functions in the human species (Hill and Walsh, 2005, Lui et al., 2011, Rakic, 2009, Sousa et al., 2017). As the enlargement of the human cortex is largely due to an increased number of cortical neurons (Amadio and Walsh, 2006, Rakic, 2009, Sousa et al., 2017), it is likely caused by species-specific mechanisms of cortical neurogenesis (Borrell and Reillo, 2012, Geschwind and Rakic, 2013, Lui et al., 2011, Molnár et al., 2006, Taverna et al., 2014).
Cortical neurogenesis is well conserved among mammals, but a number of divergent features have been identified that are linked to expansion of cortical progenitors and thereby to a higher neuronal production in the human (Borrell and Reillo, 2012, Geschwind and Rakic, 2013, Lui et al., 2011, Molnár et al., 2006, Taverna et al., 2014). Radial glial (RG) cells, located in the ventricular zone (VZ), constitute the major subtype of neurogenic cortical progenitors (Kriegstein and Alvarez-Buylla, 2009, Pinto and Götz, 2007). They undergo multiple cycles of regenerative, mostly asymmetric, cell divisions, leading to the generation of diverse types of neurons while maintaining a pool of progenitors (Miyata et al., 2004, Noctor et al., 2004). In humans, RG cells go through an increased number of such cycles when compared with non human-primate or mouse (Geschwind and Rakic, 2013, Lukaszewicz et al., 2005). Timing of neurogenesis is likely linked to species-specific properties intrinsic to RG cells, as it is conserved during in vitro corticogenesis from human, non-human primate, or mouse pluripotent stem cells (Espuny-Camacho et al., 2013, Otani et al., 2016, Suzuki and Vanderhaeghen, 2015). Species differences in cortical neurogenic output are also linked to the expansion of specific classes of progenitors in the primate and human cortex, in particular the “outer” radial glial (oRG) cells, located in the outer-subventricular zone (oSVZ) (Fietz et al., 2010, Hansen et al., 2010, Reillo et al., 2011). The oRG cells emerge from RG cells later in embryogenesis, and their progeny tend to undergo multiple rounds of divisions, thus providing an additional key mechanism of increased neuronal output.
Many highly conserved signaling pathways are required for the control of cortical neurogenesis (Tiberi et al., 2012b), which display species-specific properties that likely contribute to divergence of cortical neurogenesis (Boyd et al., 2015, Lui et al., 2014, Rani et al., 2016, Wang et al., 2016), but overall the molecular basis of species-specific mechanisms of human corticogenesis remain unknown. Comparative analyses of mammalian genomes led to the identification of many human-specific signatures of divergence, which might underlie some aspects of human brain evolution (Enard, 2016, Hill and Walsh, 2005, O’Bleness et al., 2012, Varki et al., 2008). One major driver of phenotypic evolution relates to changes in the mechanisms controlling gene expression (Carroll, 2003). Indeed, transcriptome analyses have revealed divergent gene expression patterns in the developing human brain (Johnson et al., 2009, Khaitovich et al., 2006, Lambert et al., 2011, Mora-Bermúdez et al., 2016, Nord et al., 2015, Sun et al., 2005). Studies focused on the evolution of non-coding regulatory elements have revealed structural changes that could lead to human brain-specific patterns of gene expression (Ataman et al., 2016, Boyd et al., 2015, Doan et al., 2016, Pollard et al., 2006, Prabhakar et al., 2006, Reilly et al., 2015), and changes at the level of coding sequences have also been proposed to contribute to human brain evolution (Enard et al., 2002).
Another important driver of evolution is the emergence of novel genes (Ohno, 1999). Gene duplication (Kaessmann, 2010) is one of the primary forces by which novel gene function can arise, where an “ancestral” gene is duplicated into related “paralog” genes (Dennis and Eichler, 2016, O’Bleness et al., 2012, Varki et al., 2008). Particularly interesting are hominid-specific duplicated (HS) genes, which arose from segmental DNA-mediated gene duplications specifically in the hominid and/or human genomes (Fortna et al., 2004, Goidts et al., 2006, Marques-Bonet et al., 2009, Sudmant et al., 2010). Most of them have emerged recently in the human lineage after its separation from the common ancestor to great apes, during the period of rapid expansion of the cerebral cortex. They could inherently lead to considerable gene diversification and modification and thereby may have contributed to the rapid emergence of human-specific neural traits. The role of the vast majority of the HS genes remains unknown, and many could be non-functional or redundant with their ancestral form. Recent segmental duplications are enriched for gene families with potential roles in neural development (Fortna et al., 2004, Sudmant et al., 2010, Zhang et al., 2011), and many are found in recombination “hotspots” displaying copy-number variation (CNV) linked to neurodevelopmental disorders (Coe et al., 2012, Mefford and Eichler, 2009, Nuttle et al., 2016, Varki et al., 2008). Finally, recent studies have started to provide more direct evidence for the functional importance of HS gene duplications, including SRGAP2, ARHGAP11, and TBC1D3 (Charrier et al., 2012, Florio et al., 2015, Ju et al., 2016). These provide the first examples of HS gene duplications that may be linked to human cortex evolution, but it remains unclear how many and which HS genes are actually involved in human corticogenesis. One of the roadblocks in identifying candidate HS genes is the difficulty in distinguishing the expression of mRNA expressed from the ancestral gene or the HS paralogs, as their degree of conservation is usually extremely high (Sudmant et al., 2010).
Here, we used tailored RNA sequencing (RNA-seq) analysis aimed at specific and sensitive detection of HS gene expression and thus identified a specific repertoire of dozens of HS duplicated genes that display robust and dynamic expression during human fetal corticogenesis. Among them we discovered NOTCH2NL, human-specific paralogs of the NOTCH2 receptor, which stood out for their ability to promote cortical progenitor maintenance. Functional analyses revealed that NOTCH2NL can expand human cortical progenitors and increase their neuronal output at the clonal level through cell-autonomous activation of the Notch pathway.
Results
A Repertoire of HS Gene Duplications Expressed during Human Corticogenesis
Previous work has identified dozens of HS gene families containing genes duplicated in the hominid and human lineage (Dennis et al., 2017, Dumas et al., 2007, Fortna et al., 2004, Sudmant et al., 2010), but very little information is available on their expression patterns. This is due to the difficulty to determine their expression level with conventional methods, given the high sequence similarity between HS paralogs of the same family. We first sought to determine, for each HS gene family, whether and how ancestral and paralog genes are expressed in the human developing cortex. We performed deep sequencing of RNA extracted from human fetal cortex at key stages of cortical neurogenesis (from 7 to 21 gestational weeks [GW]). For the later-stage samples, we performed microdissection to discriminate specific regions of the cortex (frontal to occipital). For the parietal area, we further microdissected the cortical plate (CP) and underlying domains of the cortical wall (non-CP, containing mostly oSVZ and VZ germinal zones) to isolate compartments enriched in neural progenitors versus postmitotic neurons.
To maximize the sensitivity and specificity of HS gene detection, we selected the libraries for cDNA fragments of 350–700 bp and sequenced them with a 2 × 151 bp paired-ends protocol (Figure S1A). Since HS duplications are recent evolutionary events, paralogs within each family are highly similar, potentially confusing the mapping of reads originating from individual paralogs and estimates of their levels of expression (Figure S1B). Standard annotations on reference genomes are also discordant for HS genes. We therefore manually curated gene structures for these genes whenever possible (Table S1) and developed a computational pipeline correcting the expression estimates of closely related paralogs for mapping errors (Figures S1C and S1D; STAR Methods). We focused on gene duplications previously described in the human genome (Sudmant et al., 2010) followed by homology searches at the genomic and transcript levels (Table S2).
Figure S1.

Transcriptome Analysis: Correcting for Loss of Multimapping Loss, Related to Figure 1
(A) The mappability of a gene is defined as the number of reads uniquely mapped on this gene divided by the number of reads originating from its transcripts. It is computed from simulated transcriptomes, as explained above and depicted in panel C. Most reads originating from single copy genes are uniquely mapped on the reference genome regardless of sequencing length, hence they have a mappability of one. HS genes show lower mappability values. As expected, their mappability is inversely related to read length.
(B) When setting simulated read length to 2x 151bp, which is the length used for transcriptome sequencing in this study, only half of the HS genes show mappability values above 90%.
(C) Computational correction of expression for human specific paralogs. Paralogs within each HS gene families are highly similar; potentially confusing the mapping of reads originating from individual paralogs. As a result, some reads are discarded because they map to multiple paralogs, leading to expression under-estimation. To estimate this loss quantitatively, an alignment of simulated reads (BAM file) is generated for each gene (gray alignment) at a defined coverage (see methods). This simulated alignment is ideal as it assumes a uniform coverage of the genes, and importantly the reads are manufactured and placed on reference genome, i.e., no read mapping procedure is involved, hence there is no mapping ambiguity. These simulated reads are then extracted and aligned with the same alignment procedure as used for in vivo experimental data (see methods; orange alignment, crosses on the gene structures denote unique sequence features allowing unambiguous mapping). Many reads are lost in the process due to multimapping, but we can estimate how many, since we initially generated them in known quantity (i.e., gray alignment). Finally, when aligning reads from in vivo experiments (green alignment), these estimates are used to inject in the alignments the near-exact number of additional reads to compensate for the loss of multimapping reads (purple alignment).
(D) Example of correction: FPKM values computed without (light gray) and with the simulation-based correction (dark gray) for 5 paralogous genes of the NOTCH2 family and HES1 as an example of single copy gene.
The distribution of gene expression values for HS genes was similar to that of all genes in the human reference genome (Figure 1A). We selected HS genes based on their absolute levels of expression above a defined threshold, 5 fragments per kilobase million (FPKM), corresponding to the minimal level of a set of 60 well-defined marker genes of corticogenesis (Figure 1A). We then selected the gene families where at least two paralogs, typically the ancestor and at least one HS paralog, were expressed above the threshold (Figure 1B).
Figure 1.

Transcriptome Profiling of HS Genes during Human Corticogenesis
(A) Distribution of expression levels of HS genes and all human genes in fetal cortex. Expression level of selected cortical marker genes is higher than FPKM5.
(B) 24 families of HS genes identified; red intensities represent the peak expression during human corticogenesis. For HS gene families with mouse ortholog, the ancestor is tagged with a green star and HS paralogs with a green circle. HS genes without any detectable mouse orthologs are tagged with a green square. HS genes with no detectable ORF are tagged with a white circle.
(C) Cluster analysis of HS and cortical marker gene expression. Samples are displayed as columns. At GW21, specific subdomains were isolated: non-cortical plate (non CP), cortical plate (CP), frontal (F), temporal (T), occipital (O), and parietal (P). Colors identify HS genes (gray) and marker genes for apical radial glia (aRG), outer radial glia (oRG), all radial glia (panRG) and basal progenitors (BP). HS genes without an ORF are displayed in gray/black, and protein-coding HS family genes are tagged as in (B). Heatmap colors were scaled for each individual row, scale of expression for each HS gene corresponds to (B).
This selection led to a short list of 68 genes distributed among 24 gene families, displaying robust and dynamic expression during human corticogenesis (Figure 1B; Table S2). About half of the genes were preferentially expressed in progenitors and/or early stages, and fewer of them in neuronal compartment and/or late stages of corticogenesis (Figure 1C). Analysis of predicted coding sequences revealed that 51 HS genes (including 18 potential ancestor genes and 35 potentially unique to hominid and human genomes) display an open reading frame (ORF) that was overall conserved but distinct between paralogs of the same family. For 17 HS genes, no reliable ORF could be detected, indicating potential pseudogenization or function as non-coding RNA (Table S2). Among the HS genes that have been studied so far in the context of cortical development, the screen identified SRGAP2 family genes, but neither ARHGAP11 nor TBC1D3 as the expression of ARHGAP11B was below our threshold and annotation for TBC1D3 family genes was unreliable at the time of our analysis.
The spatial specificity of expression patterns was confirmed by in situ hybridization (ISH) in human fetal cortex samples for 21 out of 24 HS gene families (Figure 2). Specific ISH probes for paralogs were used whenever possible, but in most cases probes recognized more than one paralog. Specific expression in human fetal cortex was detected for 19 out of 21 families and revealed selective patterns at the tissue and cellular levels (Figure 2).
Figure 2.

In Situ Analysis of HS Gene Expression in the Human Fetal Cortex
(A and B) Cresyl violet staining of coronal sections of GW12 human fetal cortex delineating ventricular zone (VZ), subventricular zone (SVZ), intermediate zone (IZ), and cortical plate (CP).
(C and D) Adjacent sections immunostained for PAX6 and TBR2.
(E–Y) In situ hybridization of HS gene families in GW12 human fetal cortex.
(Z) Sense probes.
Scale bars, 500 μm (A) and 100 μm (B–Z). See also Table S3.
We thus identify a specific repertoire of 35 protein-encoding genes potentially unique to hominid and human genomes and dynamically expressed during human corticogenesis. Their patterns of expression suggest involvement in multiple processes, from neurogenesis to neural circuit formation.
NOTCH2NL are NOTCH2 Paralogs Expressed during Corticogenesis
We next focused on HS genes expressed in cortical progenitors at the time of active neurogenesis, i.e., HS paralogs of the CROCC, GOLGA6/8, LRRC37A/B, NBPF, NOTCH2NL, NPIP, PDE4DIP, PMS2, and WASH gene families (Table S1). For each HS paralog of interest, we performed in vivo gain of function in the mouse embryonic cortex using in utero electroporation, looking at the distribution of electroporated cells between the VZ containing progenitors and CP containing differentiated neurons. While changes in cell distribution and/or morphology outside the VZ were noted for some of the genes (data not shown), one particular family member, NOTCH2 N-terminal like B (NOTCH2NLB), a NOTCH2 paralog, stood out because of its ability to maintain cells in the VZ compartment and in the progenitor state (Figures 3A–3D). NOTCH2NL was therefore studied further for potential function during human corticogenesis.
Figure 3.

NOTCH2NL Identification, Structure, and Expression during Corticogenesis
(A–D) In utero electroporation of NOTCH2NLB (N2NLB) or EGFP alone (control) in E13.5 (A and B) and E15.5 mouse cortex (C and D), analyzed 3 days later. The distribution of electroporated cells in distinct regions and the percentage of PAX6-expressing cells were quantified (B and D). Error bars depict mean ± SEM, p values = Student’s t test.
(E) Structure of NOTCH2 gene and HS paralogs. Protein-coding and non-protein-coding exons are depicted in magenta and gray, respectively.
(F) Predicted protein structure of NOTCH2NL genes. Signal peptide (SP), yellow; EGF repeats, pink; and C-terminal ends, purple and light blue.
(G) RNA-seq profile of NOTCH2-family paralogs during human corticogenesis.
(H–L) RNA in situ hybridization using probes specific for NOTCH2 and NOTCH2NL at GW9 (H and I) and GW21 (K and L).
VZ, ventricular zone; oSVZ, outer subventricular zone; IZ, intermediate zone; SP, subplate; CP, cortical plate.
Scale bars, 100 μm (A, C, I”, J, and J’), 500 μm (I”), and 1 mm (I). See also Figure S2.
Detailed inspection of the reference genome revealed that, in addition to NOTCH2, which is conserved in all sequenced mammalian genomes, four additional NOTCH2 paralogs are present in the human genome in two loci of chromosome 1 (Figure S2A). Among these four putative genes, only one has a gene annotation in GRCh38/hg38, corresponding to the NOTCH2NL transcript (NM_203458) identified in a previous study (Duan et al., 2004). We named the annotated NOTCH2NL locus as NOTCH2NLA and the other three paralogs NOTCH2NLB, C, and R (Figures 3E and S2A). Analysis of the genomic regions revealed that all four NOTCH2NL paralogs correspond to the first four exons and introns of NOTCH2, as the result of segmental duplications of the NOTCH2 ancestral gene (Figure 3E). In addition, they contained a fifth exon unique to NOTCH2NL, corresponding to an intronic region of NOTCH2. Three of the NOTCH2NL paralogs (A–C), as well as several other HS genes identified here during corticogenesis (NBPF11, NBPF12, NBPF14, and LINC01138), are found within the 1q21.1-2 region (Figure S2A), very close to a CNV locus associated with microcephaly and macrocephaly (Brunetti-Pierri et al., 2008, Mefford et al., 2008). Moreover and importantly, inspection of publicly available non-human genome sequences revealed that three in four NOTCH2NL were detected exclusively in the human genome, while one was detectable in the chimpanzee genome, suggesting that NOTCH2NL duplications emerged very recently during hominid evolution.
Figure S2.

Genomic Organization and Structure of NOTCH2NL Family Gene Members, Related to Figure 3
(A) Genomic organization of 1p12 and 1q21.1-2, where NOTCH2-family genes are located. Genes located in these regions are depicted as arrows (HS genes in magenta and other single copy genes in gray) according to the human reference genome (GRCh38/hg38).
(B) Gene structure of NOTCH2-family members. Protein coding region is indicated by arrows and different colors indicate the protein domains. Amino acid substitutions among the members are indicated above the arrows.
(C) Alignment of amino acid sequences of 5 NOTCH2-family gene products. Protein motifs indicated above the alignment is derived from the prediction for human NOTCH2 (Uniprot; Q04721). The variable amino acid residues, except for those in the C terminus, are indicated by asterisks.
All NOTCH2NL paralogs are predicted to contain an ORF encoding a protein homologous to NOTCH2 but truncated and including the N-terminal region of NOTCH2 extracellular domain (Figures 3F, S2B, and S2C). Each of the four NOTCH2NLA/B/C/R proteins encodes the six first epidermal growth factor (EGF) repeats of NOTCH2, followed by a specific C terminus domain and preceded by a predicted signal peptide for two of them.
RNA-seq analyses of NOTCH2 and its paralogs revealed similar but distinct patterns of expression (Figure 3G). NOTCH2 was highly expressed throughout corticogenesis, with a peak at 9 GW. NOTCH2NLB was expressed at lower levels at 7–9 GW and then increased at later stages, including in the non-CP region at GW21, containing the oSVZ. A similar trend was observed for NOTCH2NLA, although its levels were overall lower. NOTCH2NLC and R displayed very low (<1 FPKM) levels of expression throughout corticogenesis. The relative amount of expression of each paralog (B > A ≫ C > R) was confirmed by qRT-PCR with NOTCH2NL-specific primers followed by direct sequencing (data not shown). Expression of NOTCH2 and NOTCH2NL paralogs was examined in more detail by ISH (Figures 3H–3L), using a probe recognizing all four NOTCH2NL paralogs but not the ancestral NOTCH2 and another probe specific to the ancestral NOTCH2 mRNA (Figure S2B). This revealed similar but distinct patterns of expression in VZ at early stages, with NOTCH2 expressed mostly along the apical part of the VZ, while NOTCH2NL genes were detected throughout the VZ in a salt and pepper pattern at GW9 (Figures 3H and 3I) and GW12 (Figures 2P and 2Q). At later stages (GW21), both NOTCH2 and NOTCH2NL genes were expressed throughout the oSVZ containing oRG cells (Figures 3J–3L).
NOTCH2NLB Leads to Clonal Expansion of Human Cortical Progenitors
As Notch signaling has a prominent influence on neural cell fate (Kageyama et al., 2009, Kopan and Ilagan, 2009), NOTCH2NL genes could act as human-specific modifiers of cortical neurogenesis. Given the high levels of expression of NOTCH2NLB and its impact detected on mouse cortical progenitors, we analyzed this specific paralog in more detail.
To characterize the role of NOTCH2NLB in human cortical progenitors, we used an in vitro model of cortical neurogenesis from human embryonic stem cells (ESC), in which the species-specific temporal dynamics of cortical neurogenesis observed in vivo is recapitulated in vitro (Espuny-Camacho et al., 2013). In this system, NOTCH2 was highly expressed throughout in vitro corticogenesis, while NOTCH2NL gene expression steadily increased until 2 months of differentiation (data not shown).
We first tested the impact of NOTCH2NLB on cortical neurogenesis using a gain-of-function approach, focusing on the early stages where it is not yet expressed at peak levels. To achieve maximal sensitivity and specificity, we used a lentiviral-based clonal analysis (Otani et al., 2016) to measure the potential effect of NOTCH2NL on clonal amplification and differentiation from single cortical progenitors (Figures 4A and 4B).
Figure 4.

NOTCH2NLB Overexpression Leads to Clonal Expansion of Human Cortical Progenitors
(A and B) Schematic illustration (A) and representative case (B) of the clonal analysis. Human ESC were first differentiated into cortical cells for 30 days, followed by low-titer lentivirus (mCherry control or NOTCH2NLB-IRES-EGFP) infection.
(C–H) Representative cases of control (C–E) or NOTCH2NLB (F–H) clones.
(I) Quantification of clonal size: dotplots and boxplots indicate the number of cells per clone over time (N = number of clones analyzed). Mean ± SEM of clonal size is indicated in the inset.
(J–O) Expression of cortical progenitor marker SOX2 in control mCherry and NOTCH2NLB clones.
(P–R) Quantification of βIII tubulin-positive neurons and SOX2-positive progenitors.
Mean ± SEM and p value by Student’s t test. Scale bars, 100 μm (B) and 50 μm (C–H and J–O).
In control conditions, cortical progenitors amplified gradually to lead to a doubling of the clone size after 20 days of culture (Figures 4C–4I), while during the same period, the number of SOX2-positive progenitors per clone diminished (Figures 4J–4R). Remarkably, NOTCH2NLB-expressing clones almost tripled in size during the same period (Figure 4I), and the proportion of SOX2-positive progenitors kept increasing (Figures 4Q and 4R), thus reflecting an increased capacity of NOTCH2NLB-expressing progenitors to expand clonally. Moreover, quantification of the number of neurons in each clone revealed that NOTCH2NLB clones gave a larger neuronal output than controls (Figure 4P). These data indicate that NOTCH2NLB expression in cortical progenitors leads to larger clone size, slower exhaustion of progenitor pool, and ultimately, a higher number of neurons generated.
NOTCH2NLB Promotes Progenitor Cell-Cycle Re-entry, Mainly through Its EGF Repeats
The effects of NOTCH2NLB on clonal amplification could be due to increased progenitor self-renewal or proliferative rate. To distinguish between these possibilities, we examined cell cycle and fate following 7 days of NOTCH2NL overexpression (Figures 5A–5F). This revealed an increase of progenitor fate (PAX6 expression) at the expense of neuronal fate (βIII tubulin expression). Moreover, cell-cycle kinetics assessed by short term (1 hr) DNA labeling of the cells in S-G2 phase, as well as M phase marker phospho-Histone H3 staining, revealed no difference following NOTCH2NLB overexpression, suggesting no overt effect on cell-cycle progression (Figures S3A–S3C). However, cumulative (24 hr) DNA labeling combined with staining for all cycling cells (Ki67) revealed a decrease in cell-cycle exit and conversely an increase in cell-cycle re-entry following expression of NOTCH2NLB (Figures S3D and S3E). These data indicate that NOTCH2NLB increases clonal expansion through increased self-renewal and/or symmetric proliferative divisions but without overt effect on proliferative rate per se.
Figure 5.

NOTCH2NLB Increases Human Cortical Progenitor Maintenance through Its EGF Repeats
(A–F) Immunostaining for GFP (green), PAX6 (red), and βIII tubulin (blue) in control ([A], GFP alone) and NOTCH2NLB-expressing human cortical cells (B–D) 7 days post-lentiviral infection at 30 days of differentiation and quantification of proportion of marker expression among GFP-positive cells (E and F).
(G) Structures of NOTCH2NL full-length (FL) and deletion mutants.
(H–O) Immunostaining for GFP (green), PAX6 (red), and βIII tubulin (blue) in control, NOTCH2NL FL and mutants, or NICD expressing cortical cells 7 days following lentiviral infection and quantification of proportion of marker expression among GFP-positive cells (O).
Data are represented as mean ± SEM and p value: one-way ANOVA and Bonferroni correction. Scale bars, 50 μm (A and H) and 10 μm (C, D, M, and N). See also Figure S3.
Figure S3.

NOTCH2NLB Promotes Cell-Cycle Re-entry and Maintenance pf Cortical Progenitors, Related to Figure 5
(A–C) The percentage of mitotic cells and the cells in G2/S phase are quantified using anti-phospho Histone H3 and EdU labeling Cell cycle exit in the human cortical progenitors derived from ESC; NOTCH2NLB introduced by lentiviral infection at day 30 of differentiation, EdU incorporated 24 hours before fixation at day 7 of overexpression.
(F–S) In utero electroporation of NOTCH2NLB full length (N2NL-FL), NOTCH2NL-EGF repeats deletion (ΔEGF) and mouse NOTCH1 intracellular domain (NICD) in E13.5 mouse cortex, followed by analysis at E15.5. Bin analysis of fractions of mCherry+ electroporated cells in four regions, the CP, IZ, SVZ and VZ (F and G) PAX6 immunoreactivility was examined to quantify the proportion of apical and basal RG progenitors following NOTCH2NL overexpression (H-M). Proportions of PAX6-positive cells in the VZ (L) and SVZ (M) among all electroporated cells in whole cortical thickness are quantified. TBR2 immunoreactivility is examined to quantify the proportion of basal/intermediate progenitors in these four conditions (N-S). Proportion of TBR2-positive cells in the VZ (R) and SVZ (S) among all electroporated cells in whole cortical thickness are quantified.
Data are represented as mean ± sem and p values by Student’s t test (B, C and E) one-way ANOVA and bonferroni post hoc test (H, I, P, Q, X and Y). Scale bars; 100μm (A, D, F, L, R and T) and 20μm (A1, A2, D1, D2, J, K and S).
We next examined the molecular mechanisms underlying NOTCH2NLB function by comparing the effect of NOTCH2NL mutants devoid of specific domains of the protein (Figures 5G–5O). This revealed that the EGF repeats of NOTCH2NL are critical for their function, while the C-terminal domain appears to be dispensable. The effects of NOTCH2NL were further confirmed in the mouse embryonic cortex in vivo (Figures S3F–S3S). Detailed analysis of cell-fate markers indicated that the effect of NOTCH2NL was specifically targeting PAX6-positive apical RG cells in the VZ (Figures S3H–S3L), while no overt effect was detected on PAX6-positive progenitors in more basal compartments (that may correspond to oRG progenitors [Wang et al., 2011]) (Figure S3M) or on TBR2-positive basal progenitors (Figures S3N–S3S).
NOTCH2NLB Directly Promotes Activation of the Notch Pathway
As Notch signaling promotes self-renewal and blocks differentiation in mouse and human cortical progenitors (Kageyama et al., 2009, Lui et al., 2011), the effects of NOTCH2NL could be linked to Notch activation. We tested this by examining, in the same in vitro paradigm on human cortical progenitors, the effect of Notch1 intracellular domain (NICD) that acts as an activator of the Notch pathway. This led to a similar effect as NOTCH2NLB, where progenitor number increased and the number of differentiated neurons decreased (Figures 5L and 5O).
To test the impact of NOTCH2NLB on Notch signaling more directly, we examined the expression of Hes1, a direct downstream effector of the Notch pathway that promotes cortical progenitor self-renewal (Kageyama et al., 2008), in response to NOTCH2NLB and NICD expression (Figure S4). This revealed that overexpression of NOTCH2NLB, similarly to NICD, leads to upregulation of Hes1 and that this effect is dependent upon the presence of EGF repeats.
Figure S4.

NOTCH2NL Activates Notch Signaling in Human Cortical Progenitors In Vitro, Related to Figure 6
(A–E) Notch signaling activity was examined by HES1 immunoreactivity as a positive readout of NOTCH signaling in human cortical cells, 3 days following lentiviral infection with control vector (GFP only) or leading to overexpression of NOTCH2NL full length (N2NL-FL), NOTCH2NL-EGF repeats deletion (ΔEGF) or NICD.
(F) Quantification of HES1-immunoreactive cells among GFP labeled cells in each condition.
Data are represented as mean ± sem and p values by one-way ANOVA and bonferroni post hoc test. Scale bars; 100μm (A) and 20μm (B).
We next tested for an interaction of NOTCH2NLB with the Notch pathway in the mouse cortex in vivo, using a Notch activity transcriptional reporter (CBFRE-EFGP) (Mizutani et al., 2007) (Figure 6A). This revealed that NOTCH2NLB overexpression in mouse cortical progenitors increases Notch reporter activity (Figures 6C and 6G), with an amplitude comparable to that induced by NICD (Figures 6C and 6I), while no effect was obtained with NOTCH2NL mutants devoid of EGF repeats (Figures 6C and 6H).
Figure 6.

NOTCH2NLB Upregulates Notch Signaling In Vivo
In utero electroporation in mouse cortex (E13.5, analysis at E15.5) of a NOTCH reporter construct (CBFRE-EGFP) together with ubiquitous CAG-mCherry alone (control) or with NOTCH2NL.
(A) A NOTCH reporter containing CBF responsible element (CBFRE) drives expression of EGFP.
(B) Cells in which Notch is activated can be identified as EGFP+/mCherry+, while those where Notch is inactive are only mCherry+.
(C–I) In utero electroporation of NOTCH2NLB full length (N2NL-FL) and NICD increase NOTCH activation compared with control or NOTCH2NL mutant without EGF repeats (ΔEGF).
Data are represented as mean ± SEM. p values: one-way ANOVA and Bonferroni post hoc test. Scale bars, 100 μm (A and F) and 20 μm (D and E). See also Figure S4.
NOTCH2NLB Acts through Cell-Autonomous Inhibition of Delta/Notch Interactions
Our data indicate that NOTCH2NL act mainly through activation of the Notch pathway, raising the question of the molecular mechanism involved. Since the EGF repeat domains of NOTCH receptors are thought to bind to Notch ligands, we first tested whether NOTCH2NLB could interact with Notch ligand Delta-like 1 (DLL1), previously involved in cortical neurogenesis (Kageyama et al., 2008, Kawaguchi et al., 2008, Nelson et al., 2013, Shimojo et al., 2008).
We performed co-immunoprecipitation experiments of NOTCH2NLB and DLL1 proteins, which revealed that both proteins are found in the same complex (Figures 7A, 7B and S5). We then hypothesized that NOTCH2NLB could directly affect DLL1 function and/or trafficking. To test this, we used a cell system in which expression of DLL1 is transcriptionally independent of Notch signaling (LeBon et al., 2014, Sprinzak et al., 2010) and measured the amount of functional DLL1 protein present at the plasma membrane and available for binding to soluble Notch1 extracellular domain added to the culture medium (Figure 7C). In these conditions, the amount of DLL1 functionally available at the plasma membrane was directly proportional to the total amount of DLL1 present throughout the cell, as expected (LeBon et al., 2014) (Figure 7D). Remarkably, the cells expressing both NOTCH2NLB and DLL1 displayed a strong reduction of the amount of Notch binding at the plasma membrane compared to control (Figures 7C–7E), revealing a reduction of functionally available DLL1 protein at the cell surface. Importantly, overexpression of the NOTCH2NLB mutant devoid of EGF repeats or of NICD showed no such effect (Figures 7D and 7E).
Figure 7.

Cell-Autonomous Suppression of DLL1 Function by NOTCH2NLB
(A and B) Co-immunoprecipitation of NOTCH2NLB-myc (N2NL-FL-myc) and DLL1-GFP in HEK293T cells, using anti-GFP (A) and anti-Myc antibody (B).
(C) CHO cell line expressing DLL1 was transfected with a NOTCH2NLB expression plasmid. DLL1 protein at the plasma membrane was detected by NOTCH1-Fc (green in [C] and white arrows) and total DLL1 protein using DLL1 antibody (red in [C]). Anti-Myc antibody was used to identify NOTCH2NL-expressing cells (blue in [C], white arrowhead) among non-expressing cells (open arrowheads).
(D and E) The fluorescent intensities of NOTCH1-Fc (revealing DLL1 protein at the cell plasmic membrane) and of DLL1 antibody (revealing DLL1 protein in the whole cell) were measured in NOTCH2NLB-expressing cells and non-expressing cells (plots of three independent experiments). Compared to the non-expressing cells, NOTCH2NLB full-length-expressing cells show lower level of NOTCH-Fc signal, while NOTCH2NL-ΔEGF or NICD expressing cells display same levels as control cells (D). The ratio of signals for NOTCH1-Fc over DLL1 was quantified for each individual experiment (E).
(F–L) NOTCH2NLB suppresses DLL1 function in vivo. Mouse cortex in utero electroporation (E13.5, analysis at E15.5) was performed with DLL1 alone or together with N2NL-FL or N2NL-ΔEGF. Bin analysis reveals that the proportion of electroporated cells is decreased in VZ (J) and increased in CP (K) following DLL1 overexpression, which is blocked by NOTCH2NL-FL but not by NOTCH2NL-ΔEGF (F–K). The same results were obtained when examining the proportion of PAX6 progenitors in electroporated cells (F–I and L).
Data are presented as mean ± SEM and p values by Student’s t test (B and C) and one-way ANOVA and Bonferroni post-hoc test (H, I, and N). Scale bars, 10 μm (B) and 100 μm (E and K). See also Figure S5.
Figure S5.

Functional Interaction of DLL1 and NOTCH2NL during Mouse Corticogenesis In Vivo, Related to Figure 7
(A and B) Original pictures of the result of co-immunoprecipitation of overexpressed NOTCH2NLB-full length-myc (N2NLFL-myc) and DLL1-GFP. The regions in the magenta rectangles are cropped for Figures 7A and 7B.
(C) Bin analysis of the regional distribution of electroporated cells in the mouse cortex 2 days after in utero electroporation at E13.5. The fraction of electroporated cells in the VZ and CP are highlighted in Figures 7J and 7K. Four conditions, Control mCherry alone, DLL1, DLL1 + NOTCH2NLB full length (DLL1+N2NL-FL), DLL1 + NOTCH2NL EGF repeats deletion (DLL1+ΔEGF), were tested.
Ventricular zone (VZ), the subventricular zone (SVZ), the intermediate zone (IZ), and the cortical plate (CP).
Data are represented as mean ± sem and p values by one-way ANOVA and bonferroni post hoc test.
These data indicate that NOTCH2NLB directly impacts cell-autonomously the amount of DLL1 functionally available at the plasma membrane. This, in turn, could lead to a reduction of DLL1 function in the NOTCH2NL-expressing cell. We tested this by examining whether NOTCH2NLB expression could result in inhibition of DLL1 function during cortical neurogenesis. DLL1 expression was previously shown to exert a cell-autonomous promotion of neuronal fate and decreased progenitor self-renewal in the mouse cortex in vivo (Kawaguchi et al., 2008). We therefore examined the functional interactions between NOTCH2NLB and DLL1, by comparing the effect of DLL1 expression during mouse corticogenesis in vivo, alone or in combination with NOTCH2NLB (Figures 7F–7L and S5). As predicted (Kawaguchi et al., 2008), DLL1 overexpression led to a decreased proportion of progenitor cells in the VZ (Figures 7F, 7G, 7J, and 7L), with a corresponding increase in neurons in the CP (Figures 7F, 7G, and 7K). Remarkably, this effect was completely blocked by NOTCH2NLB co-expression (Figures 7F, 7H, and 7J–7L), while the EGF repeat deletion mutant could not counteract the DLL1 effects (Figures 7F, 7I, and 7J–7L). Overall, these data demonstrate that NOTCH2NLB can directly inhibit DLL1 function cell-autonomously, thereby leading to cortical progenitor expansion.
Discussion
Gene duplication is a major evolutionary driving force (Ohno, 1999), but it remains unclear whether and how many HS duplicated genes may have contributed to human brain evolution.
Here, we used tailored RNA-seq analyses to detect HS duplicated gene expression with great sensitivity and specificity in the human fetal cerebral cortex. We thus identified a repertoire of 35 protein-encoding HS paralogs characterized by robust and dynamic expression patterns during human corticogenesis. These data constitute a rich resource of candidate HS modifiers of cortical neurogenesis, neuronal maturation, and neural circuit formation. On the other hand, the vast majority of HS genes are expressed at low or undetectable levels in the human fetal cortex, in line with the predicted outcome of most gene duplications. While some may be of functional interest, such as ARHGAP11B (Florio et al., 2015), most of them are unlikely to be involved in human corticogenesis and may be in the process of pseudogenization.
Among the HS genes identified, we discovered one important family of paralogs of NOTCH2, NOTCH2NL, which act through the Notch pathway to promote self-renewal and ultimately increase neuronal output of human cortical progenitors. The recent evolutionary emergence of NOTCH2NL paralogs makes them attractive candidates to be involved in the latest aspects of human brain evolution, including increased size and complexity of the cerebral cortex.
Functionally, we demonstrate that NOTCH2NLB has a critical impact on the clonal expansion of human cortical progenitors through a direct effect on their pool self-renewal. This effect is strikingly in line with the expected pattern of human cortical neurogenesis compared with non-human primates: human cortical RG cells are expected to go through an increased number of self-renewing and/or proliferative cycles compared with non-human primates (Dehay and Kennedy, 2007, Geschwind and Rakic, 2013, Lukaszewicz et al., 2005, Otani et al., 2016). Importantly, the capacity to generate neurons for a prolonged period is likely linked to species-specific self-renewal properties intrinsic to RG cells, since ESC-derived RG cells from mouse, macaque, and human follow a species-specific temporal pattern of neurogenesis similar to that observed in vivo (Espuny-Camacho et al., 2013, Otani et al., 2016). NOTCH2NL act as species-specific regulators of neurogenesis by increasing the level of self-renewal and/or expansion of RG cells and could thereby facilitate an extended period of neurogenesis and the larger neuronal output that is characteristic of human corticogenesis. NOTCH2NLA/B appear to be also expressed at high levels in oRG cells, which have been linked to the evolutionary increase of cortical size (Fietz et al., 2010, Hansen et al., 2010, Reillo et al., 2011). Although we have not looked at the impact of NOTCH2NL in oRG cells, our data strongly suggest that NOTCH2NL could contribute to their increased expansion capacity, inasmuch that their self-renewal is dependent on Notch signaling (Hansen et al., 2010). Noteworthy, we do not observe increased number of oRG cells or basal progenitors overexpression of NOTCH2NLB in the mouse cortex, implying that it mostly acts by increasing the self-renewal capacity of apical RG cells and not by promoting the generation of basal progenitors. NOTCH2NL function is thus distinct from the one proposed for HS genes ARHGAP11B and TBC1D3, i.e., to promote generation of basal progenitors (Florio et al., 2015, Ju et al., 2016). However, importantly, our data do not exclude that NOTCH2NLB acts not only by increasing self-renewal but also transient amplification of cortical progenitors.
At the molecular level, we found that NOTCH2NL act mostly through the activation of Notch signaling, the most conserved developmental pathway controlling cell fate (Kageyama et al., 2009, Kopan and Ilagan, 2009). Given the paramount importance of the Notch pathway during neurogenesis (Bray and Bernard, 2010, Kageyama et al., 2009, Pierfelice et al., 2011), NOTCH2NL may be one of many species-specific regulators of the Notch pathway in the developing brain (Rani et al., 2016).
NOTCH2NL act, at least in part, through the inhibition of a Notch ligand in cis, in a cell-autonomous fashion. Future work should aim to test whether NOTCH2NLB impacts on DLL1 within the cell, regulating trafficking of DLL1, or at the level of the plasma membrane, where it could interfere with DLL1-binding sites available to Notch in cis. It will be also important to determine the exact mechanism by which this leads to Notch activation: it could act through trans-signaling from neighboring cells, as predicted by lateral inhibition models, or by blockade of Notch cis-inhibition. Cis-inhibition is well described in several systems (de Celis and Bray, 1997, del Álamo et al., 2011, Klein et al., 1997, Sprinzak et al., 2010), where a ligand acts as a direct inhibitor of the Notch receptor in the cells where they are co-expressed, thus in cis. As NOTCH2NLB can block DLL1 function when co-expressed in the same cell, it could prevent DLL1-mediated cis-inhibition, thereby leading tor a higher tone of Notch signaling and progenitor self-renewal cell-autonomously. NOTCH2NL may also act non-autonomousluy through lateral inhibition or another direct mechanism, as it is predicted to be secreted, and it could also bind to other Notch ligands or receptors. The inhibition of the ability of DLL1 to signal in trans could result in opposite proneurogenic effects in progenitors. However, data from a companion manuscript (Fiddes et al., 2018) indicate that NOTCH2NL can also directly activate Notch receptors in trans. Altogether, this suggests that both non-autonomous (through activation of Notch receptors) and autonomous (through blockade of Notch ligands) effects of NOTCH2NL could converge to increase Notch signaling and neural progenitor expansion.
In any case, the mechanism of action of NOTCH2NL, acting as a positive regulator of Notch receptors including its ancestor NOTCH2, is notably distinct from the mechanisms proposed for SRGAP2 and ARHGAP11, for which HS paralogs also encode a truncated form of the ancestral form. For SRGAP2, the HS paralogs have been shown to act as inhibitors of the ancestor (Charrier et al., 2012), while ARHGAP11B is proposed to work independently of its ancestor (Florio et al., 2015).
Our data strongly suggest that NOTCH2NL paralogs could act as species-specific modifiers of cortical size. In line with this hypothesis, NOTCH2NLA/B/C paralogs are located in the 1q21.1 genomic region, within the interval of CNV associated with pathological changes of brain size, where microdeletions can lead to microcephaly, while microduplications can lead to macrocephaly (Brunetti-Pierri et al., 2008, Mefford et al., 2008). Given the ability of NOTCH2NL to promote expansion of human cortical progenitors, a change in their gene dosage following such CNV could lead to the corresponding changes in brain size. In striking convergence with this model, the companion manuscript (Fiddes et al., 2018) has precisely mapped NOTCH2NLA/B at the level of microdeletions and duplications in patients presenting microcephaly and macrocephaly, respectively.
In conclusion, our study reveals a selective repertoire of human and hominid-specific gene duplications with a potentially significant impact for human brain developmental evolution. It includes NOTCH2NL paralogs that act as human-specific modifiers of Notch signaling and neurogenesis, linking human corticogenesis with recent genomic evolution and with neurodevelopmental diseases that may strike HS genes responsible for the distinctive size and complexity of the human cerebral cortex.
STAR★Methods
Key Resources Table
| REAGENT or RESOURCE | SOURCE | IDENTIFIER |
|---|---|---|
| Antibodies | ||
| Mouse monoclonal anti-βIII-Tubulin (Tuj1) | Covance | Cat# MMS-435P |
| Rat monoclonal anti-Hes1 | MBL | Cat# D134-3 |
| Rabbit polyclonal anti-Pax6 | Covance | Cat# PRB-278P |
| Rat monoclonal anti-phosphor-Histone H3 (p-Histone H3) | Abcam | Cat# Ab10543 |
| Goat polyclonal anti-Sox2 | Santa Cruz | Cat# sc-17320 |
| Mouse monoclonal anti-MAP2 | SIGMA | Cat# M1406 |
| Rabbit polyclonal anti-RFP | Rockland | Cat# 600-401-379 |
| Rabbit polyclonal anti-Tbr2 (Eomes) for mouse | abcam | Cat# ab183991 |
| Rabbit polyclonal anti-Tbr2 (Eomes) for human | abcam | Cat# Ab23345 |
| Chicken polyclonal anti-EGFP for IF | abcam | Cat# ab13970 |
| Rabbit polyclonal anti-DLL1 (Delta H-265) | Santa Cruz | Cat# sc-9102 |
| Goat polyclonal anti-Myc | abcam | Cat# ab9132 |
| Rabbit polyclonal anti-Ki67 | abcam | Cat# ab15580 |
| Rabbit polyclonal anti-GFP for WB | abcam | Cat# ab290 |
| Sheep polyclonal anti-DIG conjugated with alkaline phosphatase | Merck | Cat# 000000011093274910 |
| AlexaFluor488 donkey anti-mouse | Thermo Fisher Scientific | Cat# A-21202 |
| AlexaFluor488 donkey anti-rabbit | Thermo Fisher Scientific | Cat# A-21206 |
| AlexaFluor488 donkey anti-goat | Thermo Fisher Scientific | Cat# A-11055 |
| AlexaFluor488 donkey anti-rat | Thermo Fisher Scientific | Cat# A-21208 |
| AlexaFluor405 donkey anti-rabbit | abcam | Cat# ab175651 |
| AlexaFluor647 donkey anti-goat | Jackson ImmunoResearch | Cat# 705-605-147 |
| AlexaFluor647 donkey anti-mouse | Jackson ImmunoResearch | Cat# 715-605-150 |
| Cyanin3 donkey anti-mouse | Jackson ImmunoResearch | Cat# 715-165-150 |
| Cyanin3 donkey anti-rabbit | Jackson ImmunoResearch | Cat# 711-165-152 |
| Cyanin3 donley anti-rat | Jackson ImmunoResearch | Cat# 712-165-150 |
| Alkaline phosphatase goat anti-rabbit | Jackson ImmunoResearch | Cat# 111-055-003 |
| Anti-Mouse IgG, HRP-Linked Whole Ab Sheep | GE healthcare Life Sciences | Cat# NA931-1ML |
| Anti-Rabbit IgG, HRP-Linked Whole Ab Sheep | GE healthcare Life Sciences | Cat# NA934-1ML |
| Bacterial and Virus Strains | ||
| Lenti-CAG-mCherry | This study | N/A |
| Lenti-CAG-empty-ires-EGFP | This study | N/A |
| Lenti-CAG-NOTCH2NLB-ires-EGFP | This study | N/A |
| Lenti-CAG-NOTCH2NL-ΔEGF repeats-ires-EGFP | This study | N/A |
| Lenti-CAG-NOTCH2NL-ΔC terminus-ires-EGFP | This study | N/A |
| Lenti-CAG-Notch1 introcellular domain (NICD)-ires-EGFP | This study | N/A |
| Biological Samples | ||
| Human fetal brains | This study | N/A |
| Chemicals, Peptides, and Recombinant Proteins | ||
| ROCK inhibitor (Y-27632) | Merck | Cat# 688000 |
| Recombinant human Noggin | R&D systems | Cat# 1967-NG |
| 5-ethynyl-2′-deoxyuridine (EdU) | Thermo Fisher Scientific | Cat# E10187 |
| Doxycycline hydrochloride | Merck | Cat# D3447 |
| Recombinant chimeric protein of Notch1 extracellular domain fused with mouse Fc fragment of IgG (Notch1-Fc) | R&D systems | Cat# 5267-TK-050 |
| Knockout DMEM | Thermo Fisher Scientific | Cat# 10829018 |
| Knockout Serum Replacer | Thermo Fisher Scientific | Cat# 10828028 |
| Non-essential Amino Acids | Thermo Fisher Scientific | Cat# 11140050 |
| Penicillin/Streptomycin | Thermo Fisher Scientific | Cat# 15070063 |
| 2-Mercaptoenthanol | Merck | Cat# M6250 |
| L-glutamine | Thermo Fisher Scientific | Cat# 25030081 |
| PluriSTEM Dispase-II Solution | Merck | Cat# SCM133 |
| Stem-Pro Accutase | Thermo Fisher Scientific | Cat# A1110501 |
| Matrigel hES qualified | BD | Cat# 354277 |
| B27 | Thermo Fisher Scientific | Cat# 17504044 |
| X-tremeGENE HP DNA Transfection Reagent | Merck | Cat# 6366244001 |
| Myc-trap magnetic beads | ChromoTek | Cat# yta-10 |
| GFP-trap magnetic beads | ChromoTek | Cat# gta-10 |
| NuPAGE 4-12% Bis-Tris Protein Gel | ThermoFisher Scientific | Cat# NP0321BOX |
| Nitrocellulose Blotting Membrane (Amersham Protran 0.1um NC) | GE Healthcare Life Sciences | Cat# 10600000 |
| Pierce ECL Western Blotting Substrate | ThermoFisher Scientific | Cat# 32106 |
| Alpha MEM Earle’s Salts | Thermo Fisher Scientific | Cat# 41061037 |
| Critical Commercial Assays | ||
| E.Z.N.A. Total RNA Kit I | Omega | Cat# R6834-00 |
| TruSeq stranded mRNA library prep | illumine | Cat# RS-122-2101 |
| Click-iT EdU Alexa Fluor 647 Imaging Kit | Thermo Fisher Scientific | Cat# C10340 |
| Click-iT EdU Alexa Fluor 488 Imaging Kit | Thermo Fisher Scientific | Cat# C10337 |
| Deposited Data | ||
| Processed RNaseq data | This study | ArrayExpress: E-MTAB-6232 |
| Raw sequences of RANseq | This study | European Genome-phenome Archive: EGAD00001003915 |
| GTF file of currated gene annotation model | This study | Available upon requests |
| Experimental Models: Cell Lines | ||
| Hamster CHO cells – tetracyclin dependent expression of DLL1 | M. Elowitz lab | (Sprinzak et al., 2010) |
| Human embryonic stem cell H9 | WiCell | Cat# NIHhESC-10-0062 |
| Experimental Models: Organisms/Strains | ||
| Mouse: ICR (CD1) | Charles River laboratory | Strain code 022 |
| Oligonucleotides | ||
| Primers for in situ hybridization probe preparation | This study | Table S3 |
| Recombinant DNA | ||
| pMX-DLL1-GFP | Y. Gotoh lab | (Kawaguchi et al., 2008) |
| CBFRE-EGFP | (Mizutani et al., 2007) | Addgene:17705 |
| pMD2.G | Didier Trono | Addgene:112259 |
| psPAX2 | Didier Trono | Addgene:112260 |
| pCAGGS-NICD | (Dang et al., 2006) | Addgene:126891 |
| 3xflagNICD1 | (Ong et al., 2006) | Addgene:20183 |
| pLenti-CAG-NOTCH2NLB (N2NL-FL)-ires-EGFP | This study | N/A |
| pLenti-CAG-NOTCH2NL-ΔEGF repeats-ires-EGFP | This study | N/A |
| pLenti-CAG-NOTCH2NL-ΔC terminus -ires-EGFP | This study | N/A |
| pLenti-CAG-DLL1-HA | This study | N/A |
| pLenti-CAG-mCherry | This study | N/A |
| pLenti-CAG-NOTCH2NLB (N2NL-FL)-ires-mCherry | This study | N/A |
| pLenti-CAG-NOTCH2NL-ΔEGF repeats (N2NL-ΔEGF)-ires-mCherry | This study | N/A |
| pLenti-CAG-NOTCH2NL-ΔC terminus (N2NL-ΔC)-ires-mCherry | This study | N/A |
| pLenti-CAG-Notch1 intracellularv domain (NICD)-ires-EGFP | This study | N/A |
| lentiviral plasmid backbone | C. Charrier lab | N/A |
| Software and Algorithms | ||
| Fiji/ImageJ (Version 1.0) | (Schindelin et al., 2012) | https://fiji.sc/ |
| R (version 3.4.1 (2017-06-30)) | R Core Team | https://www.r-project.org/ |
| Cufflinks (version 2.2.1) | (Trapnell et al., 2012) | http://cole-trapnell-lab.github.io/cufflinks/ |
| HTSeq-count (version 0.6.1p1) | (Anders et al., 2015) | https://htseq.readthedocs.io/en/release_0.9.1/ |
| STAR program (version 2.4.0f1) | (Dobin et al., 2013) | https://github.com/alexdobin/STAR/releases |
| Other | ||
| Zeiss Axioplan2 fluorescent microscope | Zeiss | N/A |
| Zeiss LSM780 confocal microscope | Zeiss | N/A |
Contact for Reagent and Resource Sharing
Further information and requests for resources and reagents should be directed to the Lead Contact, Pierre Vanderhaeghen (pierre.vanderhaeghen@kuleuven.vib.be).
Experimental Model and Subject Details
Human fetal tissue collection and preparation
The study was approved by three relevant Ethics Committees (Erasme Hospital, Université Libre de Bruxelles, and Belgian National Fund for Scientific Research FRS/FNRS) on research involving human subjects. Written informed consent was given by the parents in each case.
Human fetuses were obtained following medical pregnancy termination. Fetuses aged 7 gestational weeks (GW) (2 males), 9 GW (1 male, 1 undetermined), 12 GW (1 female, 1 undetermined), 15 GW (1 male), and 21 GW (1 male) were used for the RNA sequencing and in situ hybridization of cortical tissue. All cases were examined with standard feto-pathological procedures and none displayed clinical or neuropathological evidence of brain malformation. As soon as possible after expulsion (less than 6 hours), the brain was removed using standard fetal autopsy procedure (Valdés-Dapena and Huff, 1983), frozen in liquid nitrogen for RNA extraction and embedded as a whole in OCT compound (Tissue-Tek Sakura, VWR Cat# 4583), then snap-frozen in a 2-methylbutane on dry ice bath for histological studies. The non-cortical plate and cortical plate regions of the parietal cortex of GW21 human fetal sample are manually dissected from the 4-5 frozen sections. Sex of the samples was confirmed by the presence of RNA sequencing reads mapped on the genes on Y chromosome. No analysis on influence or association of sex was performed because of small sample number.
Mice
All mouse experiments were performed with the approval of the Université Libre de Bruxelles Committee for animal welfare. Mouse housing, breeding and exeprimental handling were performed according to the ethical guidelines of the Belgian Ministry of Agriculture in agreement with European community Laboratory Animal Care and Use Regulations (86/609/CEE, Journal Officiel des Communautees Europeennes, L358, 18 December 1986), protocols 421N and 600N. Embryos (aged E12.5 – E18.5) of the mouse strain ICR (CD1, Charles River Laboratory) were used for in utero electroporation. The plug date was defined as embryonic day (E)0.5, and the day of birth was defined as P0. The data obtained from all embryos were pooled without discrimination of sexes for the analysis of in utero electroporation, given the difficulty to determine sex identity at embryonic stages.
Cell lines
Human embryonic stem cell line (H9; WiCell Cat # NIHhESC-10-0062 ; female donor) was grown on mitotically inactivated mouse embryonic fibroblasts (MEF) in the ES cell medium, which is Knockout DMEM (Thermo Fisher Scientific, Cat#10829018,) supplemented with 20% Knockout Serum Replacement (Thermo Fisher Scientific, Cat#10828028), 1X Non-essential Amino Acids (Thermo Fisher Scientific, Cat#11140050), 1X Penicillin/Streptomycin (Thermo Fisher Scientific, Cat#15070063), 1X 2-Mercaptoenthanol (Merck, Cat#M6250), 2mM L-glutamine (Thermo Fisher Scientific, Cat#25030081). No authentication procedure was performed.
CHO cell line (female) with tetracyclin dependent expression of DLL1 was obtained from M. Elowitz lab (Sprinzak et al., 2010) and grown in Alpha MEM Earle’s Salts (Thermo Fisher Scientific, Cat# 41061037), supplemented with 10% Tet System Approved FBS (ClonTech Cat# 631106), 1X Penicillin/Streptomycin (Thermo Fisher Scientific, Cat#15070063), 2mM L-glutamine (Thermo Fisher Scientific, Cat#25030081). No authentication procedure was performed.
Method Details
RNA sequencing
Total RNA was prepared from fetal brain tissues using the total RNA kit I (Omega, Cat# R6834-00). Poly-A tailed RNA was selected and converted to cDNA using TruSeq standard mRNA library prep kit (TruSeq stranded mRNA library prep, illumine, Cat# Cat. No. RS-122-2101). cDNA fragments of 350-700bp size were selected for sequencing (Blue pippin, Sage Science). 150bp of cDNA fragments were sequenced from both ends using HiSeq 2500 with Rapid mode v3 (illumina).
Transcriptome analysis
Defining HS genes
All genes potentially duplicated in the hominid lineage (Sudmant et al., 2010) were first used as queries in BLAST search for NCBI human reference genome and cDNA databases, and BLAT search on UCSC human reference genome (GRCh38/hg38) to find additional possible duplicated sister genes. This analysis identified 434 putative genes belonging to 126 gene families in total.
Annotation of human specific duplicated genes
To obtain a curated annotation file, we first downloaded the RefSeq annotation from the UCSC website. As human specific duplicated (HS) genes are often poorly annotated, we designed a custom Perl script to detect the following conflicting annotations:
-
•
same gene identifier appearing at multiple genomic loci
-
•
multiple gene identifiers for the same genomic loci
Conflicting annotations were then manually corrected by comparing, in the UCSC Genome Browser, UCSC genes, Gencode genes and RefSeq genes tracks. This manual curation led to a total of 342 human specific duplicated genes for which expression was estimated by transcriptome sequencing. The corresponding GTF file was used in all subsequent analysis.
Expression bias of human specific duplicated genes
Prior to gene expression analysis, we estimated how Cufflinks multi-read correction (-u option, (Trapnell et al., 2012)) was able to deal with human specific duplicated genes, where the fraction of multi-mappers can be excessive. To this end, we simulated RNA-seq reads with a custom Perl script. Given a reference genome and gene annotation in GTF format, this script produces both a set of paired fastq files and the matching ‘reference’ SAM alignment in which all read pairs are perfectly and uniquely mapped. Simulated reads were aligned on the human reference genome hg38 with the STAR program (Dobin et al., 2013). Gene annotation used to build the reference index was the manually curated Refseq genes previously described.
We then compared Cufflinks expression estimates obtained on the reference alignment and the STAR alignment. As expected, Cufflinks estimates were similar for unique genes without a known paralog, but underestimated for HS genes that were closely related.
To accurately quantify HS gene expression, we performed an alignment correction based on HS gene mappability. This methodology was inspired from the mappability tracks available on the UCSC Genome Browser, but applied directly to transcripts instead on whole genome sequence. For each of the 342 curated HS genes, we simulated 1000 read pairs and mapped them back on the reference genome with the STAR program. We then counted the number of read pairs that could be uniquely remapped on each of these genes to estimate their mappability.
Mappability values were further used to correct alignment before estimating expression with Cufflinks. First, we used HTSeq-count (Anders et al., 2015) to count reads uniquely mapped on every HS gene. Based on their respective mappability value, we estimated the number of reads that were lost due to multi-mapper removal and generated a BAM file with synthetic reads in numbers appropriate to compensate for the loss of multi-mappers. STAR alignment was merged with this compensatory alignment using samtools merge, and this corrected alignment was used as input for Cufflinks. The whole methodology is illustrated in Supplementary figure S1.
Sofware and parameters
Reads were aligned with the STAR program (version 2.4.0f1):
STAR–genomeDir STAR_index–readFilesIn R1.fastq.gz R2.fastq.gz–readFilesCommand zcat–runThreadN 5–outFilterMultimapNmax 30–outFilterIntronMotifs RemoveNoncanonical–outFilterType BySJout–alignSJoverhangMin 10000–alignSJDBoverhangMin 1–outFileNamePrefix output–scoreGenomicLengthLog2scale 0–scoreStitchSJshift 0–outFilterMultimapScoreRange 0–sjdbScore 0–outFilterMatchNminOverLread 0.3–outFilterScoreMinOverLread 0.3 alignSJoverhangMin was set to 10000 to prevent STAR from inferring novel splice junctions. We noticed that for the specific case of HS genes located close to each other, STAR produces many false splice junctions linking together paralogs of the same family (e.g., multiple genes of the NBPF family). Also, some default parameters were modified to make sure that spliced reads do not receive any bonus in terms of alignment score. This way, multi-mappers can be better identified based on their sequence identity. Multi-mappers were further removed and only concordant read pairs were kept for further analysis.
Read counts for HS genes were obtained with HTSeq-count (version 0.6.1p1):
htseq-count -f bam -r pos -s reverse -a 0 alignement.bam genes.gtf > count.out.txt
Cufflinks (version 2.2.1) was used for gene expression and invoked with the following command:
cufflinks -o output_dir -p 5 -G genes.gtf -u -b hg38.fa–library-type fr-firststrand aln.corrected.bam
In situ hybridization
In situ hybridization using digoxigenin (DIG)-labeled RNA probes was performed as described previously using PCR amplified or plasmid templates (Lambert et al., 2011, Lambot et al., 2005). Alternate sections were processed together in order to allow comparison of the obtained staining. Cryosections of human fetal tissue were fixed in 4% paraformaldehyde (PFA) in PBS for 15min at room temperature and washed with PBST (0.1% Tween20 in PBS) three times. Sections were soaked in 6%H2O2 in PBST for 2 minutes at room temperature and washed three times with PBST. Subsequently sections were incubated in 1μg/ml Proteinase K in PBST for 1 minute and the reaction stopped by incubation in 2mg/ml Glycine in PBST. After washing in PBST, they were fixed again in 4% PFA and 0.2% glutaraldehyde in PBST for 15 minutes at room temperature. For prehybridization, sections are incubated in hybridization solution for one hour at 70C°. The hybridization solution contains 50% formamide, 5xSSC pH4.5, 1% SDS, 50 mg/mL yeast tRNA, and 50 mg/mL heparin. 1.5μg/ml RNA probes in the hybridization buffer were applied to sections and incubated for 16-18 hours at 70C°. The next day, sections were washed in solution ‘1‘(50% formamide, 5xSSC pH4.5, 1% SDS) for 15 minutes three times at 70C° and then in solution ‘2′ (50% formamide, 2xSSC pH4.5, 0.11% Tween-20) for 1 minute, three times, at 70C°. After TBST (0.1% Tween20 in TBS) washing, sections were blocked in 5% sheep serum in TBST for a hour at room temperature, followed by overnight incubation in 1/2000 anti-DIG antibody (Merck, Cat#000000011093274910) in TBST at 4C°. On the final day, anti-DIG antibody was washed out by TBST and followed by washing with NTMT (Tris pH 9.5 100 mM, NaCl 100 mM, MgCl2 50 mM, 0.1% Tween-20). Signals were revealed by incubation in NBT/BCIP solution (33μl NBT and 33μl BCIP in 5ml NTMT) at room temperature. Once signal intensity reached to the optimal level, reaction was terminated by postfixation in 4% PFA in PBS for 20 minutes at room temperature. Sections were dehydrated with ethanol series (70%, 90% and 100% for 2 minutes for each) and mounted with the mounting reagent (DPX Mounting Media, Merck Cat#100579). Imaging was performed using a Zeiss Axioplan 2 and the intensity and contrast of images were modified using Fiji/ImageJ software where necessary. A sense probe was used as a negative control in each case and revealed no specific staining.
Digoxigenin-labeled riboprobe preparation
Partial cDNA fragments of target genes are amplified by PCR using the primers designed carefully to achieve the specificity to desired target paralogs (Table S3) and subcloned into the cloning vectors (Promega, Cat# A1360).
In vitro transcription was performed using linearized plasmids as templates, digoxigenin (DIG)-labeling mix (Roche, Cat#11585550910) and the T3, T7 or Sp6 RNA polymerases (Roche, Cat#11031163001, Cat#10881767001, and Cat#10810274001). Template DNA was degraded using DNase1 (Roche Cat#10104159001) and RNA was precipitated by ethanol precipitation with LiCl. RNA Probes were analyzed on agarose gel to confirm the purity and the size. All the probes used in this study are summarized in Table S3.
Cortical differentiation of human ESC
Human ESC H9 (Thomson et al., 1998) cells were cultured on mitotically inactivated mouse embryonic fibroblasts (MEF) in the ES medium until starting cortical differentiation. Cortical differentiation from human ESC was performed as described previously (Espuny-Camacho et al., 2013). On day 2, cells were dissociated using Stem-Pro Accutase (Thermo Fisher Scientific, Cat#A1110501) and plated on matrigel (hES qualified matrigel BD, Cat#354277) coated dishes at low confluency (5,000–10,000 cells/cm2) in MEF-conditioned hES medium supplemented with 10 mM ROCK inhibitor (Y-27632; Merck, Cat#688000). On day 0 of the differentiation, the medium was changed to DDM (Gaspard et al., 2008), supplemented with B27 devoid of Vitamin A (Thermo Fisher Scientific, Cat#12587010) and 100 ng/ml Noggin (R&D systems, Cat#1967-NG), and the medium was replenished every 2 days. After day 16 of differentiation, the medium was changed to DDM, supplemented with B27 (DDM/B27), and changed every 2 days. At day 24, the progenitors were dissociated using Accutase and cells were resuspended in DDM supplemented with B27 and ROCK inhibitor (10 mM) and plated onto matrigel coated coverslips. Cells are amplified until day 30 in DDM supplemented with B27 for overexpression analysis.
Lentiviral preparation
HEK293T cells were transfected by packaging plasmids, psPAX2 (Addgene Cat#12260) and pMD2.G (Addgene Cat#12259), and a plasmid of gene of interest in lentiviral backbone (pLenti-CAG-mCherry, pLenti-CAG-NOTCh2NLB-ires-EGFP, pLenti-CAG-NOTCH2NL-ΔEGF-ires-EGFP, pLenti-CAG-NOTCH2NL-ΔC-ires-EGFP and pLenti-CAG-NICD-ires-EGFP). 2 days after transfection, culture medium was collected and viral particles were enriched by filter device (Amicon Ultra-15 Centrifuge Filters, Merck, Cat#UFC910008). Titer check was performed on HEK293T cell culture for every batch of lentiviral preparation.
Clonal analysis
Clonal analysis was performed as described in the previous study with some modifications (Otani et al., 2016). Cortical cells derived from human ESC were grown on Matrigel-coated coverslips in DDM supplemented with B27 until day 28 in 24 well plate and the coverslips are transferred to 6 well plate (3 coverslips per well). At day 30, the mixture of viruses of Lenti-CAG-mCherry and Lenti-CAG-NOTCH2NLB-ires-EGFP was applied to cells at optimized concentration (which is defined every batch of viral preparation). The medium was changed to fresh DDM supplemented with B27 to wash lentiviruses out one day after intitial infection and the medium subsequently changed every 2-3 days. Each coverslip in a culture well was fixed and immunostained at day 35 (5 days of lentiviral overexpression), day 40 (10 days of lentiviral overexpression) or day 50 (20 days of lentiviral overexpression). The cells with lentiviral overexpression were detected by anti-mCherry and anti-GFP antibodies and the cell types were determined by anti-SOX2 and anti-βIII tubulin antibodies for the cortical progenitors and the differentiated neurons, respectively. The clonal size was defined as a number of cells per cluster, in which cells are located in close proximity from each other and are spatially isolated from the neighboring cell clusters in a distance longer than 100μm.
Acute overexpression in human cortical cells
Lentiviral constructs were used to infect at day 30 cortical cells differentiated from human ESC. Cortical cells are prepared as described in the section of clonal analysis. One day after infection, culture medium was changed to wash viruses out. Phenotypes were analyzed 3 and 7 days after infection for Hes1 immunoreactivility and neurogenesis assay by PAX6, SOX2 and βIII tubulin antibodies, respectively.
Cell cycle labeling assay
A nucleotide analog 5-ethynyl-2′-deoxyuridine (EdU; Merck, Cat#T511285) was incorporated to human cortical cells 24 hours before fixation for cell cycle exit analysis and 1 hour before fixation for G2/S phase labeling. Detection of EdU was performed using Click-iT EdU Alexa Fluor 488/647 Imaging Kit (Thermo Fisher Scientific, Cat# C10337 and Cat#C10340,). For the cell cycle exit analysis, the percentage of cells with EdU-positive and a proliferative cell marker Ki67-negative was examined.
In utero electroporation
In utero electroporation was performed as described previously (Dimidschstein et al., 2013, Tiberi et al., 2012a). Briefly, timed-pregnant mice were anesthesized with a mixture of ketamine (Ketalar, 50mg/ml solution injectable, Pfizer) and xylazine (Rompun, 2% solution injectable, Bayer) at E13.5, and each uterus was exposed under sterile conditions. Plasmid solutions containing 1-1.5 mg/ml of DNA were injected into the lateral ventricles of the embryos using a heat-pulled capillary. Electroporation was performed using tweezer electrodes (Nepa Gene, Cat#CUY650P5) connected to a BTX830 electroporator (five pulses of 25 V for 100 ms with an interval of 1 s). Embryos were placed back into the abdominal cavity, and mice were sutured and placed on a heating plate until recovery.
DNA constructs
Coding sequence of NOTCH2NLB was amplified by PCR from the cDNA library derived from GW9 human fetal cortex using the primers designed on the basis of the sequence of reference genome. The size of PCR fragment was confirmed and PCR fragment was subcloned into the multicloning site before myc tag of a CAG promoter driven expression plasmid (pCAG-IRES-GFP (Dimidschstein et al., 2013, Tiberi et al., 2012a)) by In Fusion cloning (Clontech, Cat#638909). DNA fragment of CAG-NOTCH2NLB-ires-EGFP was transferred to lentiviral plasmid backbone (gift from Cecile Charrier) by restriction digestion and ligation to obtain a lentiviral overexpression construct of NOTCH2NLB (pLenti-CAG-NOTCH2NLB-myc-ires-EGFP). NOTCH2NL deletion constructs (NOTCH2NL-ΔEGF repeats and NOTCH2NL-ΔC terminus) were prepared by PCR amplification using the primers recognizing the desired part of NOTCH2NLB and insertion into the lentiviral vector by In Fusion cloning (pLenti-CAG-NOTCH2NL-ΔEGF-myc-ires-EGFP and pLenti-CAG-NOTCH2NL-ΔC terminus-myc-ires-EGFP). These lentiviral NOTCH2NL plasmids were further modified by replacing EGFP to mCherry for some experiments. Lentiviral overexpression construct of mouse Notch1 intracellular domain (NICD) was prepared by insertion of 3xflag tagged NICD PCR amplified from the plasmid purchased from Addgene (#20183, (Ong et al., 2006)) into pLenti-CAG-ires-EGFP plasmid. Retroviral overexpression construct of rat Delta like-1 (pMX-rDll1-iG) was a gift from Dr. Gotoh (Kawaguchi et al., 2008). The coding sequence of DLL1 C-terminally tagged with HA was amplified by PCR to obtain DNA fragment of DLL1-HA and inserted into lentiviral CAG promoter driven overexpression plasmid (pLenti-CAG-DLL1-HA). CBFRE-EGFP was originally developed in a previous study (Mizutani et al., 2007) and obtained from Addgene (#17705). pCAGGS-NICD (Addgene #126891, (Dang et al., 2006)) was used for in utero electroporation.
Immunofluorescence staining
Mouse embryos were collected 2 days after electroporation and perfused transcardiacally with ice-cold 4% PFA in PBS. Brains were dissected and soaked in 4% PFA solution overnight at 4°C and then sectioned in 100μm thickness using vibrosector (Leica, Cat#VT1000S). Slices were washed with PBST three times and transferred into the blocking solution, which is PBS containing 0.3% Triton X-100 and 3% horse serum, and incubate for 1 hour. Brain slices were incubated overnight at 4°C with the primary antibodies. After three PBST washes, slices were incubated in PBST during 2 hours at room temperature with the secondary antibodies. After washing in PBST, brain sections are amounted on a slide glass with the mounting reagent (DAKO glycerol mounting medium, Cat#C0563). For the human cortical cells, the cells on coverslips were fixed in ice cold 4% PFA in PBS for 15 minutes at room temperature, washed three times with PBST and blocked for 1 hour in the same blocking solution used for mouse brain sections. Then coverslips were incubated in the blocking solution containing primary antibodies overnight at 4°C. Coverslips were washed three times in PBST and incubated in PBST containing the secondary antibodies. Coverslips were mounted on a slide glass with the mounting reagent. Imaging was performed using a confocal microscope Zeiss LSM780 and Images are processed by Fiji/ImageJ software (Schindelin et al., 2012).
Detection of DLL1 protein on the plasma membrane
Engineered CHO cell lines, which expresses Delta like-1 C-terminally fused with mCherry under the tetracyclin-dependent promoter (Sprinzak et al., 2010), were used for this analysis. Experimental scheme was modified from the preceding studies (LeBon et al., 2014, Sprinzak et al., 2010). Cells were transfected with the overexpression plasmid of either C-terminally myc-tagged NOTCH2NLB, C-terminally myc-tagged NOTCH2NL deletion mutant of EGF repeats or NICD, using the X-tremeGENE HP DNA Transfection Reagent (Merck, Cat#6366244001). Then cells were passaged and grown in low confluency (20,000 cells/cm2) in CHO cell medium (alpha MEM supplemented with 10% FBS, 1X Penicillin/Streptomycin, and L-Glutamine) containing 100ng/ml Doxycycline hydrochloride (Merck, D3447). Recombinant chimeric protein of Notch1 extracellular domain fused with mouse Fc fragment of IgG (Notch1-Fc, R&D systems, Cat#5267-TK-050) was applied to the culture medium and incubated on ice for 1 hour. Cells were acutely fixed in 4% PFA in PBS for 15 minutes on ice and washed with PBST three times. Then cells were permeabilized and blocked in the blocking solution containing 0.3% Triton X-100, and followed by the incubation in the blocking solution containing primary antibodies overnight; anti-DLL1 (rabbit, Santa Cruz, Cat#sc9102) and anti-Myc (goat, abcam, Cat#ab9132) antibodies. On the next day, cells were washed and labeled with the secondary antibodies; anti-Mouse IgG antibody conjugated with Alexa488 for the detection of Notch1-Fc, anti-Rabbit IgG antibody conjugated with Alexa405 for the detection of DLL1 and anti-Goat IgG antibody conjugated with Alexa647 for the detection of Myc. Images containing three channels were obtained using a confocal microscopy Zeiss LSM780. Myc-positive NOTCH2NL-expressing cells and Myc-negative control cells were imaged in whole Z axis with the interval of 0.6μm.
Confocal microscopy
Confocal images were obtained with Zeiss LSM 780 driven by ZEN 2012 software and equipped with 10x 0.30, 20x 0.8 and 40x 1.1W objectives. Microscope disposed of argon, helium-neon and 405 nm diode lasers.
Co-immunoprecipitation and western blot
36 hours after transfection of NOTCH2NLB-myc and DLL1-GFP in HEK293T cell, cells were lysed in lysis buffer (20mM Tris-HCl pH7.4, 120mM NaCl, 1% Triton X-100, 1mM EDTA, 10% Glycerol, Protease inhibitor and 1mM PMSF) on ice. Samples were incubated with Myc-trap (yta-10, ChromoTek) or GFP-trap (gta-10, CHromoTek) magnetic beads Overnight with rotation at 4°C. Beads were washed by the wash buffer (50mM Tris-HCl pH 8.00, 150mM NaCl, 1% NP-40, 0.5% Sodium deoxycholate and 10% Glycerol) four times. Subsequently, samples were eluted in 2x Laemuli’s buffer at 55°C. The input and immunoprecipitated samples were run in NuPAGE 4%–12% Bis-Tris Protein Gel (NP0321BOX, ThermoFisher Scientific) at the voltage of 100V for 2.5 hours and then transferred to Nitrocellulose Blotting Membrane (Cat. # 10600000, Amersham Protran 0.1um NC) at the voltage of 100V for 100 minutes. The membrane was blocked in the buffer (5% skim milk and 0.1% Tween20 in TBS) for 1 hour at 4°C and subsequently incubated in the blocking buffer containing anti-GFP (rabbit anti-GFP polyclonal antibody, ab290, abcam) or anti-Myc (mouse anti-Myc monoclonal antibody 9E10, M4439-100UL SIGMA) antibodies overnight at 4°C, followed by the incubation in the blocking solution containing secondary antibody anti-Rabbit or Mouse IgG antibody conjugated with HRP (NA931-1ML, GE healthcare) at room temperature for 1 hour. Pierce ECL Western Blotting Substrate (Cat. #32106, ThermoFisher Scientific) was used for signal detection.
Quantification and Statistical Analysis
Statistical analysis
Data in figure panels reflect 3 or more independent experiments performed on different days. An estimate of variation within each group of data is indicated using standard error of the mean (SEM).
We performed unpaired Student’s t test for assessing the significance of differences in the analyses containing two conditions and one-way ANOVA and Bonferroni correction in the analyses containing more than three conditions using the R language and environment for statistical computing. See each figure for details.
In utero electroporation in mouse
For quantification of the results of in utero electroporation experiments, we obtained the image of whole cortical thickness in the columnar imaging window with a 300μm width at the center of electroporation. In every experiment, we obtained multichannel images of fluorescent marker EGFP or mCherry to identify electroporated cells and immunostaining of one or two antibodies in addition to Hoechst33342 counter staining. We counted the numbers of electroporated cells by fluorescent markers EGFP or mCherry in the cortical regions from the most apical ventricular zone to the most basal cortical plate (CP). For E15.5 and E16.5 samples, four regions (VZ, SVZ, IZ and CP) were determined by the cellular density revealed by Hoechst 33342 and by the VZ marker PAX6 (VZ; dense/PAX6-positive, SVZ; dense/PAX6-negative, IZ; sparse, and CP; dense). For E18.5 samples, six regions (VZ, SVZ, IZ, SP, lower and upper CP) were determined by cellular density and the PAX6 and MAP2 immunostainings (VZ: dense/PAX6-positive, SVZ; dense/PAX6-negative, IZ; sparse, SP; sparse/MAP2-strongly positive, CP; dense/MAP2-weakly positive). The CP was further subdivided equally into the lower and upper parts.
For all analyses, 10-20 embryos were used from at least 3 litters for each condition and time-point considered, in which 100-300 cells were counted in a coronal section of electroporated cortex at an equivalent rostrocaudal level. The percentage of electroporated cells in each region is determined as the number of electroporated cells in a given region divided by the total number of electroporated cells in whole cortical wall. The percentage of PAX6 or TBR2-positive cells are defined as the number of PAX6/TBR2 immunopositive electroporated cells in the regions the VZ or SVZ over total number of electroporated cells in whole cortical wall. Similarly, the percentage of NOTCH reporter-positive cells are defined as the number of NOTCH reporter-positive electroporated cells over the total number of electroporated cells in whole cortical wall.
Clonal analysis
The number of cells with lentiviral overexpression per clonal cluster was counted for 25-30 clusters of each condition (control-mCherry and NOTCH2NLB-ires-EGFP) in each experiment. By repeating and pooling the data of three independent experiments, we obtained the clonal size for 80-100 clones for each tested condition.
Detection of DLL1 protein on the plasma membrane
Under the culture condition that 2-10 cells are making an isolated cluster with a significant distance from neighboring one, we selected clusters of solely Myc-positive (NOTCH2NLB-overexpression) or Myc-negative cells (non overexpression as control) to avoid the mixed cellular cluster. For each cluster of cells, a series of confocal images were obtained along the Z axis with a 0.6μm interval, in which each image contains three channels of NOTCH1-Fc (Alexa488), DLL1 (Alexa405) and NOTCH2NLB-overexpression by Myc immunofluorescence (Alexa647). The signal intensities of NOTCH1-Fc and DLL1 were measured in every optical section for a cell cluster and pooled to quantify total NOTCH1-Fc signal and total DLL1 signal for a given cluster of cells. These values from 20-30 clusters per experiment were plotted in two-dimensional scatterplot we then drew regression lines for each signals using R. Then the ratio of NOTCH1-Fc signal over DLL1 signal was calculated for all clusters analyzed. Data are represented as mean ± sem, p-values were determined from Student’s t tests performed for each one of the three independent experiments.
Data and Software Availability
The processed RNaseq data presented in this article are stored in ArrayExpress: E-MTAB-6232. The corresponding raw sequences are available from the European Genome-phenome Archive with accession number EGAD00001003915.
Acknowledgments
We thank Philippe Thibaudeau for initiation of this project, members of the lab and IRIBHM for helpful feedback, and Jean-Marie Vanderwinden of the Light Microscopy Facility (LiMiF) for support with imaging. We thank Dr. Lambot and the clinics of obstetrics and gynecology of Erasme hospital for help with collection of fetal material. We thank Drs. Evan Eichler and Mirko Schmidt for insightful advice and Drs. Michael Elowitz, Yukiko Gotoh, and Franz Van Roy for providing crucial reagents. This work was funded by the Belgian FRS/FNRS, the European Research Council (ERC Adv Grant GENDEVOCORTEX), the FMRE, the Interuniversity Attraction Poles Program (IUAP), the WELBIO Program of the Walloon Region, the AXA Research Fund, the Foundation ULB, the ERA-net “Microkin,” and the Vlaams Instituut voor Biotechnologie (VIB) (to P.V.). I.K.S. and D.K. were supported by EMBO Fellowships. I.K.S. was a postdoctoral Fellow of the FNRS, R.V.H. is an Aspirant of the FNRS and supported by a L’Oréal-Unesco for Women in Sciences fellowship, and M.W. is a PhD Fellow of the FRIA.
Author Contributions
I.K.S. performed all experiments, with the help of R.V.H., D.K., M.W., N.L., J.C., A.B. and A.H. D.G. and V.D. designed and performed computational analyses. I.K.S. and P.V. designed and analyzed all experiments and wrote the manuscript, together with D.G., V.D., and F.P.
Declaration of Interests
The authors declare no competing interests.
Published: May 31, 2018
Footnotes
Supplemental Information includes five figures and three tables and can be found with this article online at https://doi.org/10.1016/j.cell.2018.03.067.
Supplemental Information
References
- Amadio J.P., Walsh C.A. Brain evolution and uniqueness in the human genome. Cell. 2006;126:1033–1035. doi: 10.1016/j.cell.2006.09.007. [DOI] [PubMed] [Google Scholar]
- Anders S., Pyl P.T., Huber W. HTSeq--a Python framework to work with high-throughput sequencing data. Bioinformatics. 2015;31:166–169. doi: 10.1093/bioinformatics/btu638. [DOI] [PMC free article] [PubMed] [Google Scholar]
- Ataman B., Boulting G.L., Harmin D.A., Yang M.G., Baker-Salisbury M., Yap E.L., Malik A.N., Mei K., Rubin A.A., Spiegel I. Evolution of Osteocrin as an activity-regulated factor in the primate brain. Nature. 2016;539:242–247. doi: 10.1038/nature20111. [DOI] [PMC free article] [PubMed] [Google Scholar]
- Borrell V., Reillo I. Emerging roles of neural stem cells in cerebral cortex development and evolution. Dev. Neurobiol. 2012;72:955–971. doi: 10.1002/dneu.22013. [DOI] [PubMed] [Google Scholar]
- Boyd J.L., Skove S.L., Rouanet J.P., Pilaz L.J., Bepler T., Gordân R., Wray G.A., Silver D.L. Human-chimpanzee differences in a FZD8 enhancer alter cell-cycle dynamics in the developing neocortex. Curr. Biol. 2015;25:772–779. doi: 10.1016/j.cub.2015.01.041. [DOI] [PMC free article] [PubMed] [Google Scholar]
- de Celis J.F., Bray S. Feed-back mechanisms affecting Notch activation at the dorsoventral boundary in the Drosophila wing. Development. 1997;124:3241–3251. doi: 10.1242/dev.124.17.3241. [DOI] [PubMed] [Google Scholar]
- Bray S., Bernard F. Notch targets and their regulation. Curr. Top. Dev. Biol. 2010;92:253–275. doi: 10.1016/S0070-2153(10)92008-5. [DOI] [PubMed] [Google Scholar]
- Brunetti-Pierri N., Berg J.S., Scaglia F., Belmont J., Bacino C.A., Sahoo T., Lalani S.R., Graham B., Lee B., Shinawi M. Recurrent reciprocal 1q21.1 deletions and duplications associated with microcephaly or macrocephaly and developmental and behavioral abnormalities. Nat. Genet. 2008;40:1466–1471. doi: 10.1038/ng.279. [DOI] [PMC free article] [PubMed] [Google Scholar]
- Carroll S.B. Genetics and the making of Homo sapiens. Nature. 2003;422:849–857. doi: 10.1038/nature01495. [DOI] [PubMed] [Google Scholar]
- Charrier C., Joshi K., Coutinho-Budd J., Kim J.E., Lambert N., de Marchena J., Jin W.L., Vanderhaeghen P., Ghosh A., Sassa T., Polleux F. Inhibition of SRGAP2 function by its human-specific paralogs induces neoteny during spine maturation. Cell. 2012;149:923–935. doi: 10.1016/j.cell.2012.03.034. [DOI] [PMC free article] [PubMed] [Google Scholar]
- Coe B.P., Girirajan S., Eichler E.E. The genetic variability and commonality of neurodevelopmental disease. Am. J. Med. Genet. C. Semin. Med. Genet. 2012;160C:118–129. doi: 10.1002/ajmg.c.31327. [DOI] [PMC free article] [PubMed] [Google Scholar]
- Dang L., Yoon K., Wang M., Gaiano N. Notch3 signaling promotes radial glial/progenitor character in the mammalian telencephalon. Dev. Neurosci. 2006;28:58–69. doi: 10.1159/000090753. [DOI] [PubMed] [Google Scholar]
- Dehay C., Kennedy H. Cell-cycle control and cortical development. Nat. Rev. Neurosci. 2007;8:438–450. doi: 10.1038/nrn2097. [DOI] [PubMed] [Google Scholar]
- del Álamo D., Rouault H., Schweisguth F. Mechanism and significance of cis-inhibition in Notch signalling. Curr. Biol. 2011;21:R40–R47. doi: 10.1016/j.cub.2010.10.034. [DOI] [PubMed] [Google Scholar]
- Dennis M.Y., Eichler E.E. Human adaptation and evolution by segmental duplication. Curr. Opin. Genet. Dev. 2016;41:44–52. doi: 10.1016/j.gde.2016.08.001. [DOI] [PMC free article] [PubMed] [Google Scholar]
- Dennis M.Y., Harshman L., Nelson B.J., Penn O., Cantsilieris S., Huddleston J., Antonacci F., Penewit K., Denman L., Raja A. The evolution and population diversity of human-specific segmental duplications. Nature Ecology & Evolution. 2017;1 doi: 10.1038/s41559-016-0069. [DOI] [PMC free article] [PubMed] [Google Scholar]
- Dimidschstein J., Passante L., Dufour A., van den Ameele J., Tiberi L., Hrechdakian T., Adams R., Klein R., Lie D.C., Jossin Y., Vanderhaeghen P. Ephrin-B1 controls the columnar distribution of cortical pyramidal neurons by restricting their tangential migration. Neuron. 2013;79:1123–1135. doi: 10.1016/j.neuron.2013.07.015. [DOI] [PubMed] [Google Scholar]
- Doan R.N., Bae B.I., Cubelos B., Chang C., Hossain A.A., Al-Saad S., Mukaddes N.M., Oner O., Al-Saffar M., Balkhy S., Homozygosity Mapping Consortium for Autism Mutations in Human Accelerated Regions Disrupt Cognition and Social Behavior. Cell. 2016;167:341–354.e12. doi: 10.1016/j.cell.2016.08.071. [DOI] [PMC free article] [PubMed] [Google Scholar]
- Dobin A., Davis C.A., Schlesinger F., Drenkow J., Zaleski C., Jha S., Batut P., Chaisson M., Gingeras T.R. STAR: ultrafast universal RNA-seq aligner. Bioinformatics. 2013;29:15–21. doi: 10.1093/bioinformatics/bts635. [DOI] [PMC free article] [PubMed] [Google Scholar]
- Duan Z., Li F.-Q., Wechsler J., Meade-White K., Williams K., Benson K.F., Horwitz M. A novel notch protein, N2N, targeted by neutrophil elastase and implicated in hereditary neutropenia. Mol. Cell. Biol. 2004;24:58–70. doi: 10.1128/MCB.24.1.58-70.2004. [DOI] [PMC free article] [PubMed] [Google Scholar]
- Dumas L., Kim Y.H., Karimpour-Fard A., Cox M., Hopkins J., Pollack J.R., Sikela J.M. Gene copy number variation spanning 60 million years of human and primate evolution. Genome Res. 2007;17:1266–1277. doi: 10.1101/gr.6557307. [DOI] [PMC free article] [PubMed] [Google Scholar]
- Enard W. The Molecular Basis of Human Brain Evolution. Curr. Biol. 2016;26:R1109–R1117. doi: 10.1016/j.cub.2016.09.030. [DOI] [PubMed] [Google Scholar]
- Enard W., Przeworski M., Fisher S.E., Lai C.S., Wiebe V., Kitano T., Monaco A.P., Pääbo S. Molecular evolution of FOXP2, a gene involved in speech and language. Nature. 2002;418:869–872. doi: 10.1038/nature01025. [DOI] [PubMed] [Google Scholar]
- Espuny-Camacho I., Michelsen K.A., Gall D., Linaro D., Hasche A., Bonnefont J., Bali C., Orduz D., Bilheu A., Herpoel A. Pyramidal neurons derived from human pluripotent stem cells integrate efficiently into mouse brain circuits in vivo. Neuron. 2013;77:440–456. doi: 10.1016/j.neuron.2012.12.011. [DOI] [PubMed] [Google Scholar]
- Fiddes I.T., Lodewijk G.A., Mooring M., Bosworth C.M., Ewing A.D., Mantalas G.L., Novak A.M., van den Bout A., Bishara A., Rosenkrantz J.L. Human-specific NOTCH2NL genes affect Notch signaling and cortical neurogenesis. Cell. 2018;173:1356–1369. doi: 10.1016/j.cell.2018.03.051. this issue. [DOI] [PMC free article] [PubMed] [Google Scholar]
- Fietz S.A., Kelava I., Vogt J., Wilsch-Bräuninger M., Stenzel D., Fish J.L., Corbeil D., Riehn A., Distler W., Nitsch R., Huttner W.B. OSVZ progenitors of human and ferret neocortex are epithelial-like and expand by integrin signaling. Nat. Neurosci. 2010;13:690–699. doi: 10.1038/nn.2553. [DOI] [PubMed] [Google Scholar]
- Florio M., Albert M., Taverna E., Namba T., Brandl H., Lewitus E., Haffner C., Sykes A., Wong F.K., Peters J. Human-specific gene ARHGAP11B promotes basal progenitor amplification and neocortex expansion. Science. 2015;347:1465–1470. doi: 10.1126/science.aaa1975. [DOI] [PubMed] [Google Scholar]
- Fortna A., Kim Y., MacLaren E., Marshall K., Hahn G., Meltesen L., Brenton M., Hink R., Burgers S., Hernandez-Boussard T. Lineage-specific gene duplication and loss in human and great ape evolution. PLoS Biol. 2004;2:E207. doi: 10.1371/journal.pbio.0020207. [DOI] [PMC free article] [PubMed] [Google Scholar]
- Gaspard N., Bouschet T., Hourez R., Dimidschstein J., Naeije G., van den Ameele J., Espuny-Camacho I., Herpoel A., Passante L., Schiffmann S.N. An intrinsic mechanism of corticogenesis from embryonic stem cells. Nature. 2008;455:351–357. doi: 10.1038/nature07287. [DOI] [PubMed] [Google Scholar]
- Geschwind D.H., Rakic P. Cortical evolution: judge the brain by its cover. Neuron. 2013;80:633–647. doi: 10.1016/j.neuron.2013.10.045. [DOI] [PMC free article] [PubMed] [Google Scholar]
- Goidts V., Cooper D.N., Armengol L., Schempp W., Conroy J., Estivill X., Nowak N., Hameister H., Kehrer-Sawatzki H. Complex patterns of copy number variation at sites of segmental duplications: an important category of structural variation in the human genome. Hum. Genet. 2006;120:270–284. doi: 10.1007/s00439-006-0217-y. [DOI] [PubMed] [Google Scholar]
- Hansen D.V., Lui J.H., Parker P.R., Kriegstein A.R. Neurogenic radial glia in the outer subventricular zone of human neocortex. Nature. 2010;464:554–561. doi: 10.1038/nature08845. [DOI] [PubMed] [Google Scholar]
- Hill R.S., Walsh C.A. Molecular insights into human brain evolution. Nature. 2005;437:64–67. doi: 10.1038/nature04103. [DOI] [PubMed] [Google Scholar]
- Johnson M.B., Kawasawa Y.I., Mason C.E., Krsnik Z., Coppola G., Bogdanović D., Geschwind D.H., Mane S.M., State M.W., Sestan N. Functional and evolutionary insights into human brain development through global transcriptome analysis. Neuron. 2009;62:494–509. doi: 10.1016/j.neuron.2009.03.027. [DOI] [PMC free article] [PubMed] [Google Scholar]
- Ju X.C., Hou Q.Q., Sheng A.L., Wu K.Y., Zhou Y., Jin Y., Wen T., Yang Z., Wang X., Luo Z.G. The hominoid-specific gene TBC1D3 promotes generation of basal neural progenitors and induces cortical folding in mice. eLife. 2016;5:e18197. doi: 10.7554/eLife.18197. [DOI] [PMC free article] [PubMed] [Google Scholar]
- Kaessmann H. Origins, evolution, and phenotypic impact of new genes. Genome Res. 2010;20:1313–1326. doi: 10.1101/gr.101386.109. [DOI] [PMC free article] [PubMed] [Google Scholar]
- Kageyama R., Ohtsuka T., Shimojo H., Imayoshi I. Dynamic Notch signaling in neural progenitor cells and a revised view of lateral inhibition. Nat. Neurosci. 2008;11:1247–1251. doi: 10.1038/nn.2208. [DOI] [PubMed] [Google Scholar]
- Kageyama R., Ohtsuka T., Shimojo H., Imayoshi I. Dynamic regulation of Notch signaling in neural progenitor cells. Curr. Opin. Cell Biol. 2009;21:733–740. doi: 10.1016/j.ceb.2009.08.009. [DOI] [PubMed] [Google Scholar]
- Kawaguchi D., Yoshimatsu T., Hozumi K., Gotoh Y. Selection of differentiating cells by different levels of delta-like 1 among neural precursor cells in the developing mouse telencephalon. Development. 2008;135:3849–3858. doi: 10.1242/dev.024570. [DOI] [PubMed] [Google Scholar]
- Khaitovich P., Enard W., Lachmann M., Pääbo S. Evolution of primate gene expression. Nat. Rev. Genet. 2006;7:693–702. doi: 10.1038/nrg1940. [DOI] [PubMed] [Google Scholar]
- Klein T., Brennan K., Arias A.M. An intrinsic dominant negative activity of serrate that is modulated during wing development in Drosophila. Dev. Biol. 1997;189:123–134. doi: 10.1006/dbio.1997.8564. [DOI] [PubMed] [Google Scholar]
- Kopan R., Ilagan M.X. The canonical Notch signaling pathway: unfolding the activation mechanism. Cell. 2009;137:216–233. doi: 10.1016/j.cell.2009.03.045. [DOI] [PMC free article] [PubMed] [Google Scholar]
- Kriegstein A., Alvarez-Buylla A. The glial nature of embryonic and adult neural stem cells. Annu. Rev. Neurosci. 2009;32:149–184. doi: 10.1146/annurev.neuro.051508.135600. [DOI] [PMC free article] [PubMed] [Google Scholar]
- Lambert N., Lambot M.A., Bilheu A., Albert V., Englert Y., Libert F., Noel J.C., Sotiriou C., Holloway A.K., Pollard K.S. Genes expressed in specific areas of the human fetal cerebral cortex display distinct patterns of evolution. PLoS ONE. 2011;6:e17753. doi: 10.1371/journal.pone.0017753. [DOI] [PMC free article] [PubMed] [Google Scholar]
- Lambot M.-A., Depasse F., Noel J.-C., Vanderhaeghen P. Mapping labels in the human developing visual system and the evolution of binocular vision. J. Neurosci. 2005;25:7232–7237. doi: 10.1523/JNEUROSCI.0802-05.2005. [DOI] [PMC free article] [PubMed] [Google Scholar]
- LeBon L., Lee T.V., Sprinzak D., Jafar-Nejad H., Elowitz M.B. Fringe proteins modulate Notch-ligand cis and trans interactions to specify signaling states. eLife. 2014;3:e02950. doi: 10.7554/eLife.02950. [DOI] [PMC free article] [PubMed] [Google Scholar]
- Lui J.H., Hansen D.V., Kriegstein A.R. Development and evolution of the human neocortex. Cell. 2011;146:18–36. doi: 10.1016/j.cell.2011.06.030. [DOI] [PMC free article] [PubMed] [Google Scholar]
- Lui J.H., Nowakowski T.J., Pollen A.A., Javaherian A., Kriegstein A.R., Oldham M.C. Radial glia require PDGFD-PDGFRβ signalling in human but not mouse neocortex. Nature. 2014;515:264–268. doi: 10.1038/nature13973. [DOI] [PMC free article] [PubMed] [Google Scholar]
- Lukaszewicz A., Savatier P., Cortay V., Giroud P., Huissoud C., Berland M., Kennedy H., Dehay C. G1 phase regulation, area-specific cell cycle control, and cytoarchitectonics in the primate cortex. Neuron. 2005;47:353–364. doi: 10.1016/j.neuron.2005.06.032. [DOI] [PMC free article] [PubMed] [Google Scholar]
- Marques-Bonet T., Kidd J.M., Ventura M., Graves T.A., Cheng Z., Hillier L.W., Jiang Z., Baker C., Malfavon-Borja R., Fulton L.A. A burst of segmental duplications in the genome of the African great ape ancestor. Nature. 2009;457:877–881. doi: 10.1038/nature07744. [DOI] [PMC free article] [PubMed] [Google Scholar]
- Mefford H.C., Eichler E.E. Duplication hotspots, rare genomic disorders, and common disease. Curr. Opin. Genet. Dev. 2009;19:196–204. doi: 10.1016/j.gde.2009.04.003. [DOI] [PMC free article] [PubMed] [Google Scholar]
- Mefford H.C., Sharp A.J., Baker C., Itsara A., Jiang Z., Buysse K., Huang S., Maloney V.K., Crolla J.A., Baralle D. Recurrent rearrangements of chromosome 1q21.1 and variable pediatric phenotypes. N. Engl. J. Med. 2008;359:1685–1699. doi: 10.1056/NEJMoa0805384. [DOI] [PMC free article] [PubMed] [Google Scholar]
- Miyata T., Kawaguchi A., Saito K., Kawano M., Muto T., Ogawa M. Asymmetric production of surface-dividing and non-surface-dividing cortical progenitor cells. Development. 2004;131:3133–3145. doi: 10.1242/dev.01173. [DOI] [PubMed] [Google Scholar]
- Mizutani K., Yoon K., Dang L., Tokunaga A., Gaiano N. Differential Notch signalling distinguishes neural stem cells from intermediate progenitors. Nature. 2007;449:351–355. doi: 10.1038/nature06090. [DOI] [PubMed] [Google Scholar]
- Molnár Z., Métin C., Stoykova A., Tarabykin V., Price D.J., Francis F., Meyer G., Dehay C., Kennedy H. Comparative aspects of cerebral cortical development. Eur. J. Neurosci. 2006;23:921–934. doi: 10.1111/j.1460-9568.2006.04611.x. [DOI] [PMC free article] [PubMed] [Google Scholar]
- Mora-Bermúdez F., Badsha F., Kanton S., Camp J.G., Vernot B., Köhler K., Voigt B., Okita K., Maricic T., He Z. Differences and similarities between human and chimpanzee neural progenitors during cerebral cortex development. eLife. 2016;5:e18683. doi: 10.7554/eLife.18683. [DOI] [PMC free article] [PubMed] [Google Scholar]
- Nelson B.R., Hodge R.D., Bedogni F., Hevner R.F. Dynamic interactions between intermediate neurogenic progenitors and radial glia in embryonic mouse neocortex: potential role in Dll1-Notch signaling. J. Neurosci. 2013;33:9122–9139. doi: 10.1523/JNEUROSCI.0791-13.2013. [DOI] [PMC free article] [PubMed] [Google Scholar]
- Noctor S.C., Martínez-Cerdeño V., Ivic L., Kriegstein A.R. Cortical neurons arise in symmetric and asymmetric division zones and migrate through specific phases. Nat. Neurosci. 2004;7:136–144. doi: 10.1038/nn1172. [DOI] [PubMed] [Google Scholar]
- Nord A.S., Pattabiraman K., Visel A., Rubenstein J.L.R. Genomic perspectives of transcriptional regulation in forebrain development. Neuron. 2015;85:27–47. doi: 10.1016/j.neuron.2014.11.011. [DOI] [PMC free article] [PubMed] [Google Scholar]
- Nuttle X., Giannuzzi G., Duyzend M.H., Schraiber J.G., Narvaiza I., Sudmant P.H., Penn O., Chiatante G., Malig M., Huddleston J. Emergence of a Homo sapiens-specific gene family and chromosome 16p11.2 CNV susceptibility. Nature. 2016;536:205–209. doi: 10.1038/nature19075. [DOI] [PMC free article] [PubMed] [Google Scholar]
- O’Bleness M., Searles V.B., Varki A., Gagneux P., Sikela J.M. Evolution of genetic and genomic features unique to the human lineage. Nat. Rev. Genet. 2012;13:853–866. doi: 10.1038/nrg3336. [DOI] [PMC free article] [PubMed] [Google Scholar]
- Ohno S. Gene duplication and the uniqueness of vertebrate genomes circa 1970-1999. Semin. Cell Dev. Biol. 1999;10:517–522. doi: 10.1006/scdb.1999.0332. [DOI] [PubMed] [Google Scholar]
- Ong C.-T., Cheng H.-T., Chang L.-W., Ohtsuka T., Kageyama R., Stormo G.D., Kopan R. Target selectivity of vertebrate notch proteins. Collaboration between discrete domains and CSL-binding site architecture determines activation probability. J. Biol. Chem. 2006;281:5106–5119. doi: 10.1074/jbc.M506108200. [DOI] [PubMed] [Google Scholar]
- Otani T., Marchetto M.C., Gage F.H., Simons B.D., Livesey F.J. 2D and 3D Stem Cell Models of Primate Cortical Development Identify Species-Specific Differences in Progenitor Behavior Contributing to Brain Size. Cell Stem Cell. 2016;18:467–480. doi: 10.1016/j.stem.2016.03.003. [DOI] [PMC free article] [PubMed] [Google Scholar]
- Pierfelice T., Alberi L., Gaiano N. Notch in the vertebrate nervous system: an old dog with new tricks. Neuron. 2011;69:840–855. doi: 10.1016/j.neuron.2011.02.031. [DOI] [PubMed] [Google Scholar]
- Pinto L., Götz M. Radial glial cell heterogeneity--the source of diverse progeny in the CNS. Prog. Neurobiol. 2007;83:2–23. doi: 10.1016/j.pneurobio.2007.02.010. [DOI] [PubMed] [Google Scholar]
- Pollard K.S., Salama S.R., Lambert N., Lambot M.A., Coppens S., Pedersen J.S., Katzman S., King B., Onodera C., Siepel A. An RNA gene expressed during cortical development evolved rapidly in humans. Nature. 2006;443:167–172. doi: 10.1038/nature05113. [DOI] [PubMed] [Google Scholar]
- Prabhakar S., Noonan J.P., Pääbo S., Rubin E.M. Accelerated evolution of conserved noncoding sequences in humans. Science. 2006;314:786. doi: 10.1126/science.1130738. [DOI] [PubMed] [Google Scholar]
- Rakic P. Evolution of the neocortex: a perspective from developmental biology. Nat. Rev. Neurosci. 2009;10:724–735. doi: 10.1038/nrn2719. [DOI] [PMC free article] [PubMed] [Google Scholar]
- Rani N., Nowakowski T.J., Zhou H., Godshalk S.E., Lisi V., Kriegstein A.R., Kosik K.S. A Primate lncRNA Mediates Notch Signaling during Neuronal Development by Sequestering miRNA. Neuron. 2016;90:1174–1188. doi: 10.1016/j.neuron.2016.05.005. [DOI] [PMC free article] [PubMed] [Google Scholar]
- Reillo I., de Juan Romero C., García-Cabezas M.A., Borrell V. A role for intermediate radial glia in the tangential expansion of the mammalian cerebral cortex. Cereb. Cortex. 2011;21:1674–1694. doi: 10.1093/cercor/bhq238. [DOI] [PubMed] [Google Scholar]
- Reilly S.K., Yin J., Ayoub A.E., Emera D., Leng J., Cotney J., Sarro R., Rakic P., Noonan J.P. Evolutionary genomics. Evolutionary changes in promoter and enhancer activity during human corticogenesis. Science. 2015;347:1155–1159. doi: 10.1126/science.1260943. [DOI] [PMC free article] [PubMed] [Google Scholar]
- Schindelin J., Arganda-Carreras I., Frise E., Kaynig V., Longair M., Pietzsch T., Preibisch S., Rueden C., Saalfeld S., Schmid B. Fiji: an open-source platform for biological-image analysis. Nat. Methods. 2012;9:676–682. doi: 10.1038/nmeth.2019. [DOI] [PMC free article] [PubMed] [Google Scholar]
- Shimojo H., Ohtsuka T., Kageyama R. Oscillations in notch signaling regulate maintenance of neural progenitors. Neuron. 2008;58:52–64. doi: 10.1016/j.neuron.2008.02.014. [DOI] [PubMed] [Google Scholar]
- Sousa A.M.M., Meyer K.A., Santpere G., Gulden F.O., Sestan N. Evolution of the Human Nervous System Function, Structure, and Development. Cell. 2017;170:226–247. doi: 10.1016/j.cell.2017.06.036. [DOI] [PMC free article] [PubMed] [Google Scholar]
- Sprinzak D., Lakhanpal A., Lebon L., Santat L.A., Fontes M.E., Anderson G.A., Garcia-Ojalvo J., Elowitz M.B. Cis-interactions between Notch and Delta generate mutually exclusive signalling states. Nature. 2010;465:86–90. doi: 10.1038/nature08959. [DOI] [PMC free article] [PubMed] [Google Scholar]
- Sudmant P.H., Kitzman J.O., Antonacci F., Alkan C., Malig M., Tsalenko A., Sampas N., Bruhn L., Shendure J., Eichler E.E., 1000 Genomes Project Diversity of human copy number variation and multicopy genes. Science. 2010;330:641–646. doi: 10.1126/science.1197005. [DOI] [PMC free article] [PubMed] [Google Scholar]
- Sun T., Patoine C., Abu-Khalil A., Visvader J., Sum E., Cherry T.J., Orkin S.H., Geschwind D.H., Walsh C.A. Early asymmetry of gene transcription in embryonic human left and right cerebral cortex. Science. 2005;308:1794–1798. doi: 10.1126/science.1110324. [DOI] [PMC free article] [PubMed] [Google Scholar]
- Suzuki I.K., Vanderhaeghen P. Is this a brain which I see before me? Modeling human neural development with pluripotent stem cells. Development. 2015;142:3138–3150. doi: 10.1242/dev.120568. [DOI] [PubMed] [Google Scholar]
- Taverna E., Götz M., Huttner W.B. The cell biology of neurogenesis: toward an understanding of the development and evolution of the neocortex. Annu. Rev. Cell Dev. Biol. 2014;30:465–502. doi: 10.1146/annurev-cellbio-101011-155801. [DOI] [PubMed] [Google Scholar]
- Thomson J.A., Itskovitz-Eldor J., Shapiro S.S., Waknitz M.A., Swiergiel J.J., Marshall V.S., Jones J.M. Embryonic stem cell lines derived from human blastocysts. Science. 1998;282:1145–1147. doi: 10.1126/science.282.5391.1145. [DOI] [PubMed] [Google Scholar]
- Tiberi L., van den Ameele J., Dimidschstein J., Piccirilli J., Gall D., Herpoel A., Bilheu A., Bonnefont J., Iacovino M., Kyba M. BCL6 controls neurogenesis through Sirt1-dependent epigenetic repression of selective Notch targets. Nat. Neurosci. 2012;15:1627–1635. doi: 10.1038/nn.3264. [DOI] [PubMed] [Google Scholar]
- Tiberi L., Vanderhaeghen P., van den Ameele J. Cortical neurogenesis and morphogens: diversity of cues, sources and functions. Curr. Opin. Cell Biol. 2012;24:269–276. doi: 10.1016/j.ceb.2012.01.010. [DOI] [PubMed] [Google Scholar]
- Trapnell C., Roberts A., Goff L., Pertea G., Kim D., Kelley D.R., Pimentel H., Salzberg S.L., Rinn J.L., Pachter L. Differential gene and transcript expression analysis of RNA-seq experiments with TopHat and Cufflinks. Nat. Protoc. 2012;7:562–578. doi: 10.1038/nprot.2012.016. [DOI] [PMC free article] [PubMed] [Google Scholar]
- Valdés-Dapena M.A., Huff D.S. The Institute; 1983. Perinatal autopsy manual. [Google Scholar]
- Varki A., Geschwind D.H., Eichler E.E. Explaining human uniqueness: genome interactions with environment, behaviour and culture. Nat. Rev. Genet. 2008;9:749–763. doi: 10.1038/nrg2428. [DOI] [PMC free article] [PubMed] [Google Scholar]
- Wang L., Hou S., Han Y.G. Hedgehog signaling promotes basal progenitor expansion and the growth and folding of the neocortex. Nat. Neurosci. 2016;19:888–896. doi: 10.1038/nn.4307. [DOI] [PMC free article] [PubMed] [Google Scholar]
- Wang X., Tsai J.W., LaMonica B., Kriegstein A.R. A new subtype of progenitor cell in the mouse embryonic neocortex. Nat. Neurosci. 2011;14:555–561. doi: 10.1038/nn.2807. [DOI] [PMC free article] [PubMed] [Google Scholar]
- Zhang Y.E., Landback P., Vibranovski M.D., Long M. Accelerated recruitment of new brain development genes into the human genome. PLoS Biol. 2011;9:e1001179. doi: 10.1371/journal.pbio.1001179. [DOI] [PMC free article] [PubMed] [Google Scholar]
Associated Data
This section collects any data citations, data availability statements, or supplementary materials included in this article.