Abstract
In multicellular systems, the control of cell size is fundamental in regulating the development and growth of the different organs and of the whole organism. In most systems, major changes in cell size can be observed during differentiation processes where cells change their volume to adapt their shape to their final function. How relevant changes in cell volume are in driving the differentiation program is a long‐standing fundamental question in developmental biology. In the Arabidopsis root meristem, characteristic changes in the size of the distal meristematic cells identify cells that initiated the differentiation program. Here, we show that changes in cell size are essential for the initial steps of cell differentiation and that these changes depend on the concomitant activation by the plant hormone cytokinin of the EXPAs proteins and the AHA1 and AHA2 proton pumps. These findings identify a growth module that builds on a synergy between cytokinin‐dependent pH modification and wall remodeling to drive differentiation through the mechanical control of cell walls.
Keywords: cell differentiation, cell wall acidification, cell wall expansion, cytokinin, root meristem
Subject Categories: Development & Differentiation, Plant Biology, Signal Transduction
Introduction
Cell differentiation is a complex process through which cells acquire distinct identities and specialized functions. In most systems, initiation of cell differentiation is accompanied by characteristic post‐mitotic changes in volume necessary for the cell to reach its final size and to adapt its shape to its function (Marshall et al, 2012). The significance of these changes in size and whether they can affect cell differentiation is still unclear. We used the Arabidopsis root, where the development of each tissue can be easily followed in time and space, to provide an answer to this long‐standing fundamental question. In this system, each tissue arises from a single stem cell (Benfey & Scheres, 2000). Stem cells self‐renew and produce daughter cells which undergo subsequent cycles of cell division, generating the meristematic zone (Benfey & Scheres, 2000). Characteristic changes in the size of the distal meristematic cells identify the position of the transition zone (TZ) a developmental boundary where cells lose their capacity to divide and start to differentiate (Fig 1A).
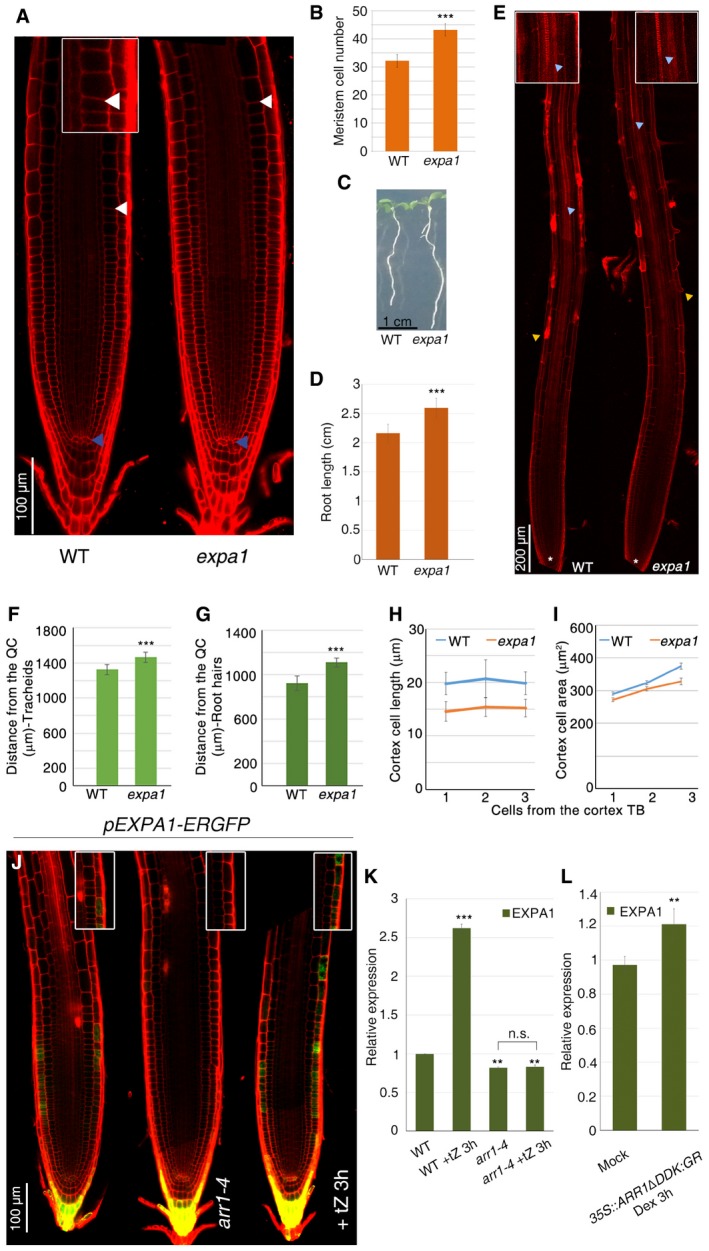
Figure 1. EXPA1 positively controls the initiation of meristematic cell differentiation.
-
AConfocal microscopy images of WT and expa1 root tips. Changes in cell size at the cortex transition boundary (TB) in WT root are shown in the insert. The TB is a tissue‐specific boundary where divisions cease and cells start to differentiate. The zone encompassing the TB of the different cell tissues represents the TZ. Blue and white arrowheads indicate the QC and the cortex TB, respectively.
-
BRoot meristem cell number of WT and expa1 mutant (n = 60. ***P < 0.001; Student's t‐test).
-
CSeedling of WT and expa1 mutant.
-
DRoot length quantification of WT and expa1 mutant (n = 15. ***P < 0.001; Student's t‐test).
-
EConfocal images of WT and expa1 root tip. White asterisk indicates the QC, yellow arrowheads indicate the first detectable root hair, and light blue arrowheads mark the first appearance of differentiated tracheids.
-
F, GMeasurements of tracheids (F) and root hair (G) distance from the QC in WT and expa1 root tips (n = 10. ***P < 0.001; Student's t‐test).
-
HMeasurement of cell length of newly differentiated cortex cells of WT and expa1 roots (n = 15).
-
IMeasurement of cell area of newly differentiated cortex cells of WT and expa1 roots (n = 15).
-
JConfocal microscopy images of roots expressing the pEXPA1::ER‐GFP construct in WT (n = 20), in arr1‐4 (n = 15) mutant backgrounds and of pEXPA1::ER‐GFP root upon cytokinin treatments (n = 15), respectively. pEXPA1::ER‐GFP‐specific expression at the epidermis TB is shown in the insert.
-
KqRT–PCR analysis of EXPA1 mRNA levels in the root tip of WT, arr1‐4, and cytokinin‐treated WT and arr1‐4 roots (**P < 0.01, ***P < 0.001, n.s. corresponds to not significant; Student's t‐test; three technical replicates performed on two independent RNA batches).
-
LqRT–PCR analysis of EXPA1 mRNA levels in the root tip of 35S::ARR1ΔDDK:GR plants upon dexamethasone (Dex) treatments. The value for the control mock‐treated WT was set to 1, and the relative values are reported (**P < 0.01; Student's t‐test; three technical replicates performed on two independent RNA batches).
The positioning and maintenance of the TZ are important events during root organogenesis, as they ultimately determine the size of the root (Pacifici et al, 2015; Di Mambro et al, 2017). We have previously shown that the position of the TZ depends on the antagonistic activities of two plant hormones: cytokinin and auxin (Dello Ioio et al, 2008b; Di Mambro et al, 2017). Cytokinin activates the transcription factor ARABIDOPSIS RESPONSE REGULATOR 1 (ARR1), which in turn activates the SHORT HYPOCOTYL 2 (SHY2) and the GRETCHEN HAGEN 3.17 (GH3.17) genes involved in controlling, respectively, polar auxin transport and degradation (Dello Ioio et al, 2008b; Di Mambro et al, 2017). In this way, cytokinin shapes the graded distribution of auxin, positioning an auxin minimum in the topmost root meristematic cells, which acts as a positional signal that triggers cell differentiation (Di Mambro et al, 2017). Upon sensing this auxin minimum, cells start to differentiate, expanding in one direction (elongate) increasing their size (Di Mambro et al, 2017). Here, we set to understand the significance of these changes in size and whether they can affect the cell differentiation program.
In plants, cell expansion necessitates loosening of the cell wall structure (Cosgrove, 2005), a process mediated by proteins named α‐expansins (EXPAs) that are located in the cell wall and activated by low apoplastic pH (Cosgrove, 2005). EXPAs disrupt non‐covalent bonds between cell wall components thus allowing turgor‐driven cell expansion (Cosgrove, 2005), but their role in plant organ development is only poorly understood (Cho & Cosgrove, 2000).
We set to demonstrate whether cell wall extensibility induced by EXPA genes is necessary for root cell elongation at the root TZ and, most importantly, whether this EXPA‐controlled elongation affects cell differentiation thus controlling the position of the TZ and, consequently, root and root meristem size.
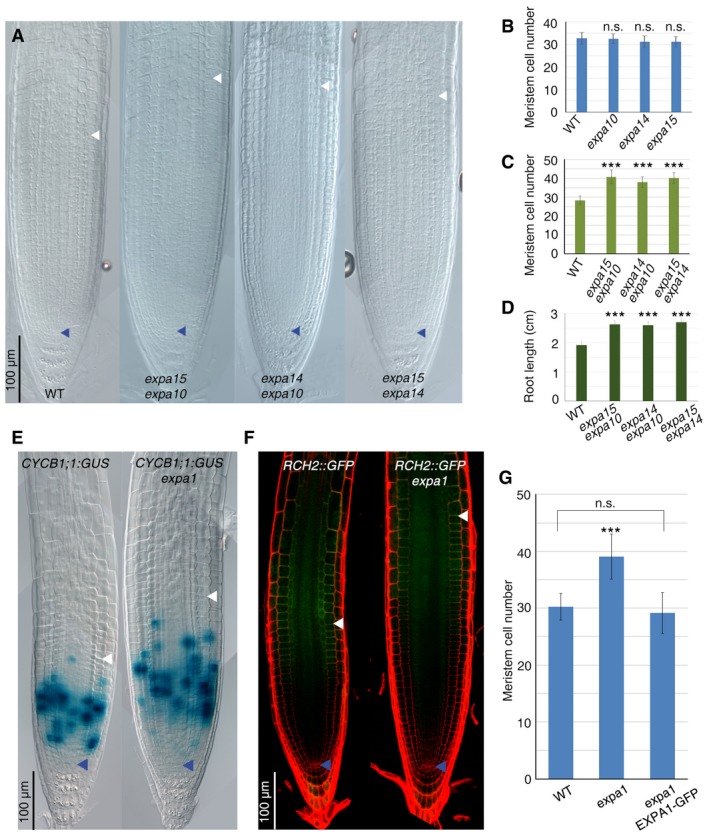
It was previously reported that four members of the α‐expansin subfamily, EXPA1, EXPA10, EXPA14, and EXPA15, are induced by cytokinin in the root (Bhargava et al, 2013). Since in the root cytokinin is involved in controlling cell differentiation initiation (Pacifici et al, 2015), we focused on these four genes. We first analyzed the root meristem phenotype of the loss‐of‐function mutants expa1, expa10, expa14, and expa15. Interestingly, while the expa1 mutant displays a larger meristem and a longer root than the wild type (WT), no root phenotype could be detected in the expa10, expa14, and expa15 single mutants (Figs 1A–E and EV1B). However, enlarged meristems and longer roots could be observed in the double mutants, expa15;expa10, expa14;expa10, and expa14;expa15, suggesting that, except for EXPA1, these expansins act redundantly (Fig EV1A–C and D). To confirm that the change in root meristem size observed in the expa1 mutant is the result of a change in TZ position, we analyzed the CYCB1;1:GUS cell cycle reporter (highlighting meristematic zone) and the RCH2 marker line (highlighting cell at the elongation/differentiation zone; Dello Ioio et al, 2008a). This analysis revealed that distal meristematic cell that in wild‐type roots expresses the RCH2 marker line now expresses the CYCB1;1:GUS cell cycle reporter causing a shootward shift of the TZ in expa1 as is the case of cytokinin signaling mutants (Fig EV1E and F; Dello Ioio et al, 2008a,b). Most importantly, measurements of length and area of root cells above the TZ in the expa1 mutant revealed that these cells are considerably shorter and smaller than in wild‐type roots (Fig 1H and I). Furthermore, the development of vascular xylem elements and root hairs was delayed in the expa1 mutant, confirming a setback in cell differentiation (Fig 1E–G). These evidences suggest that the impairment in cell wall loosening and the resulting impairment in cell elongation, due to the lack of EXPA proteins activity, hamper cell differentiation.
Figure EV1. EXPA1,EXPA10,EXPA14, and EXPA15 control cell differentiation initiation at the TZ .
-
ADIC microscopy images of WT, expa15;expa10, expa14;expa10, and expa15;expa14 root tips.
-
BRoot meristem cell number of the WT, expa10, expa14, and expa15 single mutants (n = 50. n.s. corresponds to not significant; Student's t‐test).
-
C, DMeasurement of root meristem cell number (n = 50) (C) and root length (n = 15) (D) of expa15;expa10, expa14;expa10, and expa15;expa14 double mutants (***P < 0.001; Student's t‐test).
-
EDIC microscopy images of CYCB1;1:GUS (n = 20) and CYCB1;1:GUS;expa1 (n = 20) roots.
-
FConfocal microscopy images of RCH2::GFP (n = 10) and RCH2::GFP;expa1 (n = 30) roots. Note changes in TZ position in the expa1 mutant correspond to changes in CYCB1;1:GUS and RCH2::GFP domains.
-
GMeasurement of root meristem cell number of WT, expa1, and expa1;EXPA1‐GFP (n = 50. ***P < 0.001, n.s. corresponds to not significant; Student's t‐test)
To corroborate the notion that EXPA genes control cell differentiation, we analyzed their expression in the root. No signal was detected from Green Fluorescent Protein (GFP) translational fusions under the control of EXPA promoters although, for example, the pEXPA1:EXPA1:GFP was shown to be functional as it was capable of complementing the root meristem phenotype of the expa1 mutant (Fig EV1G). In contrast, transcriptional fusions—pEXPA1‐GFP and pEXPA10‐GUS, pEXPA14‐GUS and pEXPA15‐GUS—revealed that EXPA genes are all expressed at the TZ, although in different tissues, but not in the meristem (Figs 1J and EV2B–D). Interestingly, EXPA1 is the only one expressed in the epidermis TZ (and in the columella; Fig 1J), in agreement with the reported relevance of this tissue in coordinating cell expansion during root growth (Hacham et al, 2011; Fridman et al, 2014) and in being the source of instructive scaling and positional input in controlling organ size (Gruel et al, 2016). Altogether, these data indicate that EXPA genes are expressed at the TZ and that their activity in this root district is necessary to drive cell differentiation.
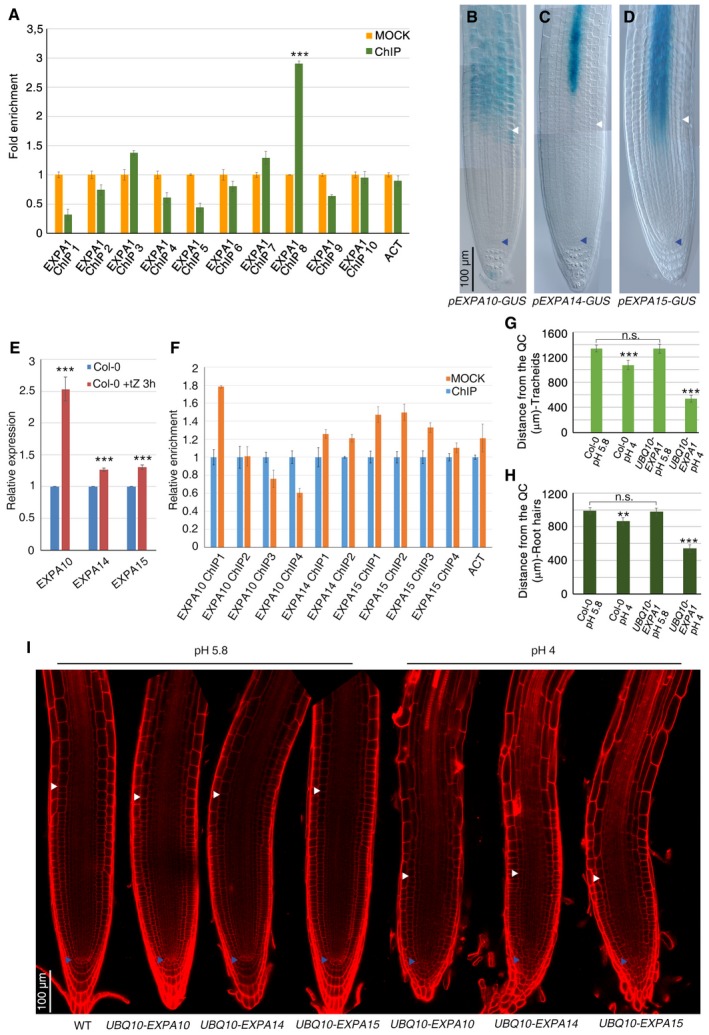
Figure EV2. Low pH‐activated EXPA10, EXPA14, and EXPA15 proteins are expressed at the TZ and control cell differentiation.
-
AEXPA1 fold enrichment deriving from ChIP‐qPCR analysis performed on immunoprecipitated chromatin of pARR1::ARR1:GFP roots (***P < 0.001; Student's t‐test; two technical replicates performed on two independent DNA batches).
-
B–DDIC microscopy images of WT roots expressing pEXPA10‐GUS (B), pEXPA14‐GUS (C), and pEXPA15‐GUS (D) constructs, respectively.
-
EqRT–PCR analysis of EXPA10, EXPA14, and EXPA15 mRNA levels in the root tip of WT plants upon cytokinin treatment (***P < 0.001; Student's t‐test; three technical replicates performed on two independent RNA batches).
-
FEXPA10, EXPA14, and EXPA15 fold enrichment deriving from ChIP‐qPCR analysis performed on immunoprecipitated chromatin of pARR1::ARR1:GFP roots. (Two technical replicates performed on two independent DNA batches)
-
G, HMeasurements of tracheids (G) and root hairs (H) distance from the QC in WT and UBQ10‐EXPA1 root tips grown on standard (5.8) or acidic (4.0) pH. (n = 10. **P < 0.01, ***P < 0.001; Student's t‐test).
-
IConfocal microscopy images of WT (n = 10) root tips grown on standard (5.8) pH and of UBQ10‐EXPA10 (n = 15), UBQ10‐EXPA14 (n = 20), and UBQ10‐EXPA15 (n = 15) root tips grown on standard (5.8) or acidic (4.0) pH.
We next confirmed that, as previously reported (Bhargava et al, 2013), the EXPA1, EXPA10, EXPA14, and EXPA15 genes are under the control of cytokinin (Figs 1K and EV2E). We have previously shown that the cytokinin‐dependent ARR1 transcription factor is necessary and sufficient to control cytokinin‐dependent cell differentiation initiation (Dello Ioio et al, 2008a; Di Mambro et al, 2017). Thus, we set to assess whether ARR1 has a direct control of the EXPA1, EXPA10, EXPA14, and EXPA15 genes. Interestingly, ChIP‐qPCR assay revealed that ARR1 directly binds the EXPA1 promoter, while no enrichment could be detected for the EXPA10, EXPA14, and EXPA15 promoters (Fig EV2A and F). Furthermore, no cytokinin induction of the EXPA1 gene could be detected in the arr1‐4 mutant background (Fig 1K). ARR1 positively regulates EXPA1 expression, as the transcript level of this gene was lower in the arr1‐4 mutant, while ARR1 overexpression resulted in activation of EXPA1 (Fig 1K and L). ARR1 control on EXPA1 expression is limited to the epidermis transition boundary, as no changes in EXPA1 expression in the columella could be detected upon cytokinin treatments or in the arr1‐4 mutant background (Fig 1J). Thus, ARR1 directly and positively controls expression of the EXPA1 gene, which in turn is necessary to control the position of the TZ, and root and root meristem size. In contrast, the EXPA10, EXPA14, and EXPA15 genes act redundantly and their activities might be under the control of other cytokinin‐dependent transcription factors.
To assess whether the EXPA1 protein is not only necessary but also sufficient to control cell differentiation, we ubiquitously expressed the EXPA1 gene by means of the UBQ10 promoter (UBQ10‐EXPA1). As no root phenotype could be observed in UBQ10‐EXPA1 plants (Fig 2A and C), we hypothesized that in these plants the ectopic EXPA1 protein is not functional because it needs low apoplastic pH to be activated (Sampedro & Cosgrove, 2005). To verify this hypothesis, we germinated UBQ10‐EXPA1 plants on a medium adjusted to pH 4. These are the optimal acidic conditions for EXPA proteins activation (Sampedro & Cosgrove, 2005) and have little effects on WT root meristematic activities (Gujas et al, 2012; Fig 2A and C). Indeed, in these conditions, the root of UBQ10‐EXPA1 plants stopped growing and the root meristem was dramatically reduced compared to wild‐type roots, due to premature cell differentiation (Figs 2A and C, and EV2G and H). In the root meristem of these plants, the stem cell niche was very disorganized. Analysis of QC‐specific markers revealed loss of QC and stem cell function as cells immediately below the QC, at the position of columella stem cell, acquired differentiation markers such as amyloplasts (Fig 2B). Furthermore, the length and area of newly differentiated cells were increased (Fig 2D and E). The same results were obtained overexpressing EXPA10, EXPA14, and EXPA15 in plants grown in acidic medium (Fig EV2I). These data confirm that low apoplastic pH activates the EXPA proteins and that probably by loosening the cell wall these proteins cause a change in the shape of the cell thus inducing stem cell and meristematic cell differentiation.
Figure 2. Activated EXPA1 protein induces cell differentiation revealing its function in vivo .
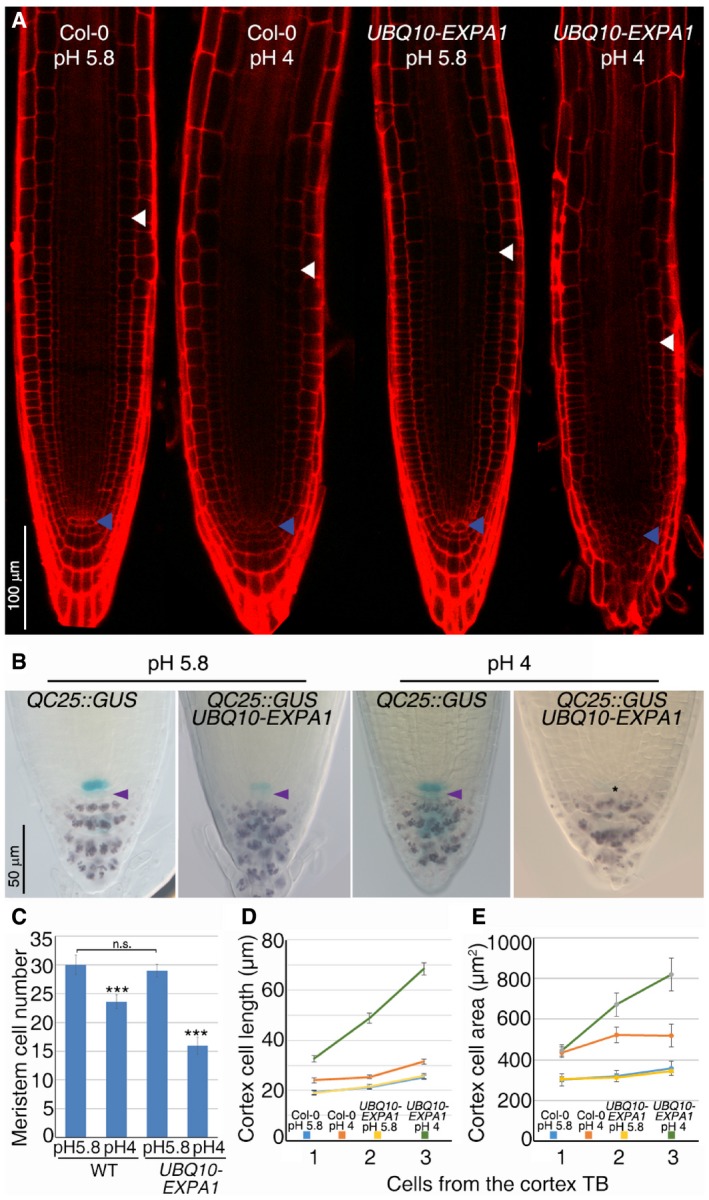
- Confocal microscopy images of WT and UBQ10‐EXPA1 root tips grown on standard (5.8) or acidic (4.0) pH. Blue and white arrowheads indicate the QC and the cortex TB, respectively.
- Stem cell niche expressing the QC‐specific marker (QC25) of WT and UBQ10‐EXPA1 root tips grown on standard (5.8) or acidic (4.0) pH. Lugol staining highlights differentiated columella cells. Violet arrowheads indicate columella stem cells. Asterisk indicates the presumptive position of QC cells in UBQ10‐EXPA1 root grown on pH 4.
- Meristem cell number of WT and UBQ10‐EXPA1 grown on standard and acidic pH (n = 30. ***P < 0.001, n.s. corresponds to not significant; Student's t‐test).
- Measurement of cell length of newly differentiated cortex cells of WT and UBQ10‐EXPA1 root tips grown on standard or acidic pH (n = 15; three replicates).
- Measurement of cell area of newly differentiated cortex cells of WT and UBQ10‐EXPA1 root tips grown on standard or acidic pH (n = 15; three replicates).
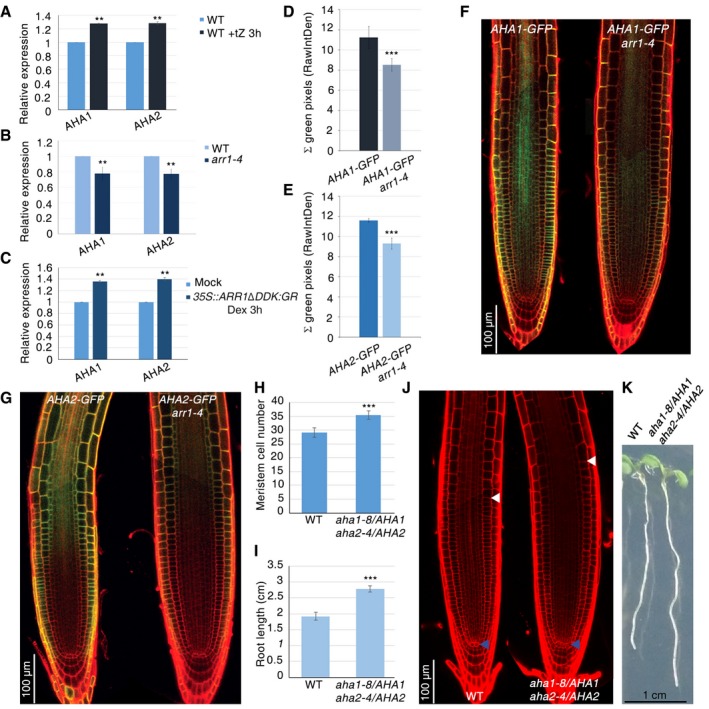
In plants, acidification of the apoplast is guaranteed by the plasma membrane H+‐ATPases (HA), electrogenic enzymes that transport protons (H+) out of the cell, thus regulating cellular pH homeostasis (Haruta et al, 2015). In Arabidopsis, AHA1 and AHA2 (Arabidopsis HA 1 and 2) are active in the primary root (Baxter et al, 2003). We thus wondered whether to induce cell differentiation via the EXPA genes cytokinin also controls the expression of the AHA1 and AHA2 genes. Indeed, exposure of WT roots to exogenous cytokinin resulted in induction of AHA1 and AHA2 expression as shown by RT–PCR (Fig 3A). In accordance, ChIP‐qPCR assay revealed that ARR1 binds intronic regions of both AHA1 and AHA2 (Fig EV3A). Furthermore, AHA1 and AHA2 are down‐regulated in the arr1‐4 mutant background (Fig 3B and D–G), while overexpression of ARR1 results in AHA1 and AHA2 induction (Fig 3C). Thus, cytokinin, via ARR1, directly controls expression of the EXPA1 gene and of the AHA1 and AHA2 genes.
Figure 3. AHA1 and AHA2 control meristematic cell differentiation initiation.
-
A–CqRT–PCR analysis of AHA1 and AHA2 mRNA levels in WT root tip upon cytokinin treatment (A) in the root tip of arr1‐4 mutant (B) and in the root tip of 35S::ARR1ΔDDK:GR plants upon Dex induction (C) (**P < 0.001; Student's t‐test; three technical replicates performed on two independent RNA batches).
-
D, ERelative fluorescence quantification of roots depicted in (F) and (G), respectively (n = 10. ***P < 0.001; Student's t‐test).
-
F, GConfocal microscopy images of WT (n = 20) and arr1‐4 (n = 20) roots expressing the AHA1‐GFP construct (F) and the AHA2‐GFP construct (G).
-
H, IRoot meristem cell number (n = 60) (H) and root length (n = 20) (I) of WT and aha1‐8/AHA1;aha2‐4/AHA2 mutant (***P < 0.001; Student's t‐test).
-
JConfocal microscopy images of WT and aha1‐8/AHA1;aha2‐4/AHA2 roots meristem. Blue and white arrowheads indicate the QC and the cortex TB, respectively.
-
KSeedlings of WT and the aha1‐8/AHA1;aha2‐4/AHA2 mutant.
Figure EV3. AHA1‐ and AHA2‐dependent apoplastic acidification at the TZ induces cell differentiation.
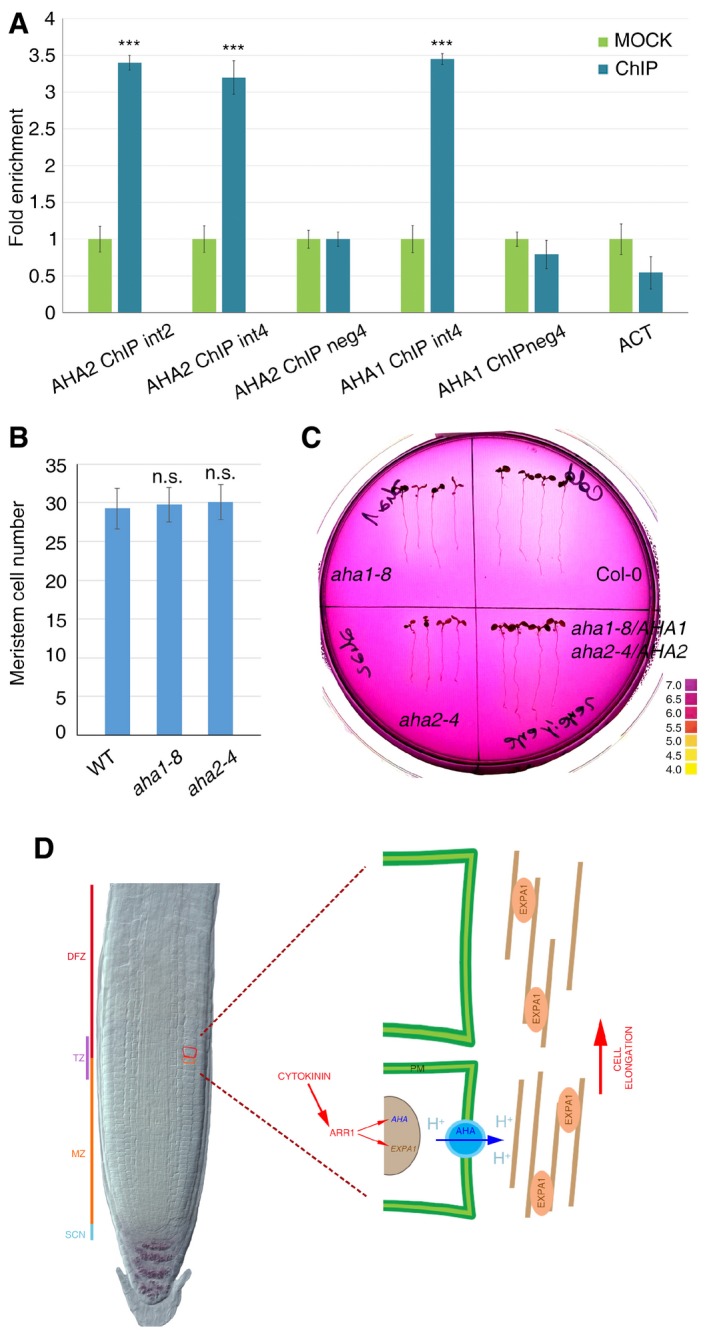
- AHA1 and AHA2 fold enrichment deriving from ChIP‐qPCR analysis performed on immunoprecipitated chromatin of pARR1::ARR1:GFP roots. (***P < 0.001; Student's t‐test; two technical replicates performed on two independent DNA batches). Error bars indicate SD.
- Measurements of meristem cell number of aha1‐8 and aha2‐4 mutants. (n = 15. n.s. corresponds to not significant; Student's t‐test). Error bars indicate SD.
- Medium acidification through proton extrusion from WT, aha1‐8, aha2‐4, and aha1‐8/AHA1;aha2‐4/AHA2 seedlings, 16 h after transfer onto fresh medium containing pH indicator. (n = 4; three replicates). Colored bar indicates pH values.
- Proposed model: cytokinin, via ARR1, controls both apoplastic acidification (via positive regulation of AHA1 and AHA2) and cell wall (brown lines) loosening (via positive regulation of EXPA1). As a result, at the TZ, cells expand and initiate the differentiation program.
In order to establish whether the AHA1 and AHA2 proton pumps mediate apoplast acidification in the same domain of EXPA proteins activity, we set to analyze the expression pattern of the AHA1 and AHA2 genes in the root by generating GFP translational fusions (AHA1‐GFP and AHA2‐GFP plants). Analysis of these plants revealed that both genes are expressed at the TZ, with AHA1 showing a broad expression domain across the meristematic region, while AHA2 is more specifically localized at the TZ (Fig 3F and G). This expression is in accordance with the pH drop observed at the TZ in the Arabidopsis root (Staal et al, 2011).
We reasoned that, if (by mediating apoplastic acidification) the AHA1 and AHA2 proteins activate expansins, mutation in these genes would result in altered cell differentiation initiation and thus TZ position and root and root meristem size. However, analysis of the aha1‐8 and aha2‐4 loss‐of‐function mutants revealed no root phenotype (Fig EV3B). It was previously reported that the double homozygous aha1,aha2 mutant causes embryo lethality (Haruta et al, 2010). We thus analyzed the double heterozygous mutant, aha1‐8/AHA1;aha2‐4/AHA2, hypothesizing that these genes would act together in a dose‐dependent fashion. Indeed, as predicted, the aha1‐8/AHA1;aha2‐4/AHA2 double heterozygous mutants displayed larger meristems and longer roots compared to WT (Fig 3H–K). To verify whether this change in root meristem size is accompanied by changes in root apoplastic pH, we measured the capability of the aha1‐8/AHA1;aha2‐4/AHA2 mutant roots to acidify the medium. To this end, we transferred aha1‐8/AHA1;aha2‐4/AHA2 mutant seedlings onto medium containing a pH indicator. As expected, in this mutant, the acidification capability of the roots is decreased compared to the wild type and to the single aha1‐8 and aha2‐4 mutants, implying that H+ proton export in the medium (and in the apoplast) is decreased (Fig EV3C). This confirms that the AHA1 and AHA2 proton pumps are necessary to mediate apoplastic pH acidification and suggests that they are involved in controlling root meristem cell differentiation. To further establish the role of the AHA1 and AHA2 in root meristem size determination, we generated plants ubiquitously expressing these genes (UBQ10‐AHA1 and UBQ10‐AHA2 plants). These plants failed to complete their development and died (data not shown). We thus created an inducible version of the pUBQ10‐AHA2 construct (pUBQ10::AHA2:GR). Interestingly, upon 20 h of dexamethasone (Dex) treatment, pUBQ10::AHA2:GR plants showed a drastic reduction in root meristem size compared to WT (Fig 4A and B). Moreover, the length and area of newly differentiated cells were increased as in the case of UBQ10‐EXPA1 plants grown on acidic medium (Fig 4C and D). Thus, apoplastic acidification of the root mediated by the AHA1 and AHA2 proton pumps is necessary to control initiation of cell differentiation, to position the TZ and thus define root and root meristem size.
Figure 4. AHA1‐ and AHA2‐dependent apoplast acidification activates EXPA1 and induces cell differentiation.
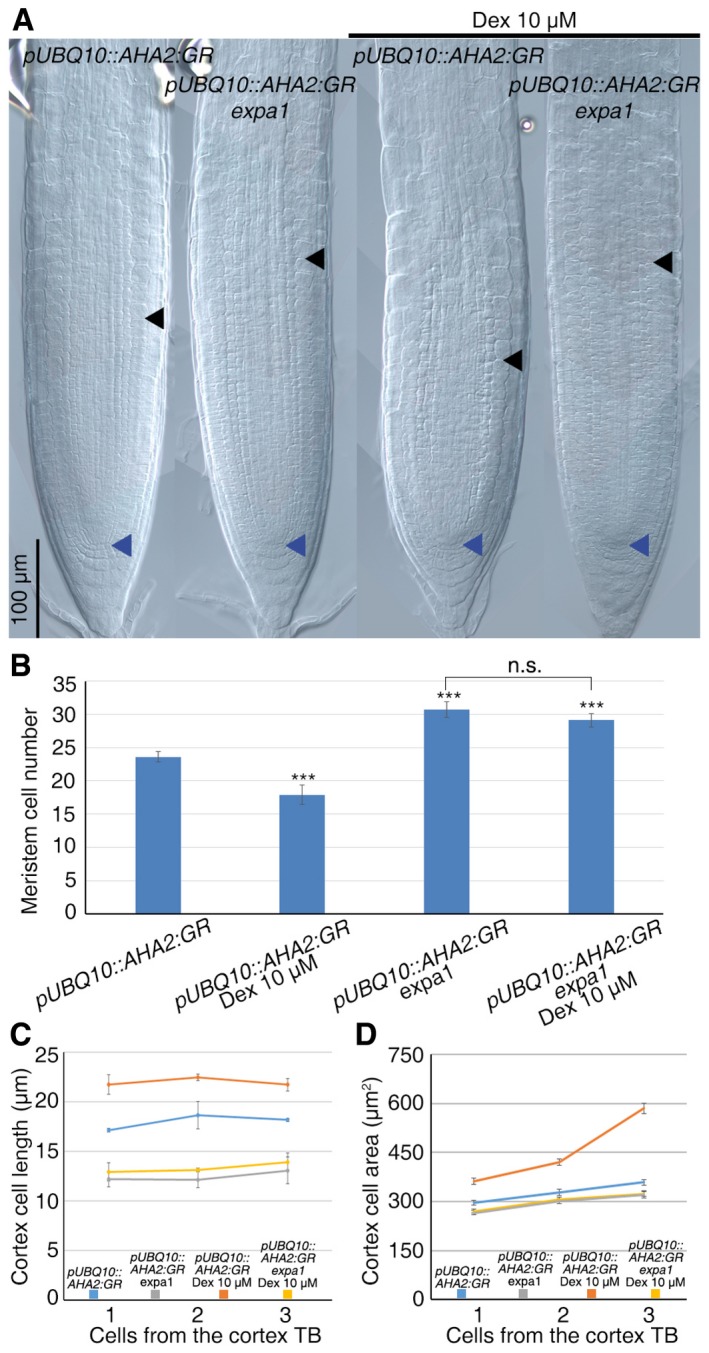
- DIC microscopy images of WT and expa1 roots expressing the pUBQ10::AHA2:GR construct treated and untreated with Dex. Blue and black arrowheads indicate the QC and the cortex TB, respectively.
- Measurement of meristem cell number of roots depicted in a (n = 30. For statistical analysis, untreated pUBQ10::AHA2:GR was set as reference. ***P < 0.001, n.s. corresponds to not significant; Student's t‐test).
- Measurement of cell length of newly differentiated cortex cells of root depicted in (A) (n = 15).
- Measurement of cell area of newly differentiated cortex cells of root depicted in (A) (n = 15).
We next asked whether the apoplastic acidification caused by the AHAs drives cell differentiation by activating EXPA activity. To this aim, we crossed plants harboring the pUBQ10::AHA2:GR construct with the expa1 mutant. Interestingly, while a 20‐h Dex treatment of pUBQ10::AHA2:GR plants resulted in a reduction in meristem size, no changes in meristem and cell size were observed in pUBQ10::AHA2:GR;expa1 plants (Fig 4A and C). Thus, acidification of the apoplast mediated by AHA2 activates the EXPA1 protein that, in turn, likely by loosening the cell wall, allows cell expansion and promotes cell differentiation.
In conclusion, we show here that cytokinin directly controls, via ARR1, the activity of the EXPA1 gene and, at the same time, of the AHA1 and AHA2 genes. This creates the pH conditions at the TZ for the EXPA1 protein to induce cell wall loosening and consequently cell elongation, thus driving cell differentiation; this controls the position of the TZ and consequently root and root meristem size. We have previously shown that cytokinin determines the position of the TZ by positioning an auxin minimum in the topmost meristematic cell and that cytokinin treatment moves this auxin minimum into the meristem before cell elongation can be observed (Di Mambro et al, 2017). It is thus tempting to propose a model where in the Arabidopsis root cytokinin first establishes the position of the auxin minimum, which provides to the topmost meristematic cell of each tissue the competence to differentiate; in these competent cells, the activities of both EXPA and AHA proteins result in a sudden change in volume (elongation) that is the functional trigger of differentiation (Fig EV3D). Accordingly, if the pH conditions are not optimal, and/or the cell wall loosening capacities are impaired, cell differentiation is delayed.
Our results provide clear evidence that cell wall remodeling due to acidification and expansin‐dependent loosening brings about a change in cell shape (dimensions) that has an important role in controlling the cell differentiation program.
Materials and Methods
Data reporting
No statistical methods were used to predetermine sample size. The experiments were not randomized, and the investigators were not blinded to allocation during experiments and outcome assessment.
Plant material and growth conditions
All mutants are in the Arabidopsis thaliana Col‐0 ecotype. arr1‐4 allele was previously described in Dello Ioio et al, 2007, and aha1‐8 and aha2‐4 alleles were previously described in Haruta et al (2010). expa1‐1, expa10‐1, expa14‐1, and expa15‐1 alleles were obtained from the Nottingham Arabidopsis Stock Centre collection (SALK_010506, SALK_053326, SALK_089449, and SALK_107975, respectively). Homozygous mutants from the Salk T‐DNA were identified by PCR as described (http://signal.salk.edu/).
For growth conditions, Arabidopsis seeds were surface sterilized, and seedlings were grown on one‐half‐strength Murashige and Skoog (MS) medium containing 0.8% agar at 22°C in long‐day conditions (16‐h‐light/8‐h‐dark cycle) as previously described in Perilli and Sabatini (2010).
In the experiments involving pH variation, the pH of the medium was adjusted using HCl before adding agar and autoclaving (Gujas et al, 2012).
Root length and meristem size analysis
Root meristem size for each plant was measured based on the number of cortex cells in a file extending from the quiescent center to the first elongated cortex cell excluded, as described previously (Perilli and Sabatini, 2010). The cortex is the most suitable tissue to count meristematic cells, as its single cell type composition shows a conserved number of cells among different roots. The boundary between dividing and differentiating cells for each tissue is called transition boundary (TB), while the region including the different transition boundaries is called transition zone (TZ; Di Mambro et al, 2017). Cell‐o‐Tape (French et al, 2012), a Fiji (http://fiji.sc/Fiji) macro, was used to confirm the position of the last cortical cell at the TB. Images were obtained using a confocal laser scanning microscope (Zeiss LSM 780). Student's t‐test was used to determine statistical significance of these data (http://graphpad.com/quickcalcs/ttest2.cfm).
Lugol staining
Starch granules in the root tips were stained with Lugol's solution (Carlo Erba Reagenti) for few seconds and then immediately observed and photographed at microscopy as previously described (Sabatini et al, 2003).
RNA isolation and RT–qPCR
Total RNA was extracted from 5 days post‐germination roots using the NucleoSpin RNA Plus (Macherey‐Nagel), and the first‐strand cDNA was synthesized using the Superscript® III First‐Strand Synthesis System (Invitrogen). Quantitative RT–PCR analysis was conducted using gene‐specific oligonucleotides primers (Appendix Table S1). PCR amplification was carried out in the presence of the double‐strand DNA‐specific dye SsoAdvanced Universal SYBR Green Supermix (Bio‐Rad). Amplification was monitored in real time with the 7500 Fast Real‐Time PCR System (Applied Biosystems) according to the manufacturer's instructions. Experiments were performed in triplicates from two independent RNA extractions. Data were analyzed using the ΔΔC t (cycle threshold) method and normalized with the expression of the reference gene ACTIN2 (ACT2). Student's t‐test was used to determine statistical significance of these data (http://graphpad.com/quickcalcs/ttest2.cfm).
ChIP‐qPCR
The enrichment of the EXPA1 target promoter regions DNA and the AHA1 and AHA2 intronic regions DNA in the immunoprecipitated pARR1:ARR1:GFP DNA (Di Mambro et al, 2017) was confirmed using RT–qPCR. A qPCR efficiency of twofold amplifications per cycle was assumed, and a sequence from ACT2 was used to normalize the results between samples. PCR amplification was carried out in the presence of the double‐strand DNA‐specific dye SsoAdvanced Universal SYBR Green Supermix (Bio‐Rad). Amplification was monitored in real time with the 7500 Fast Real‐Time PCR System (Applied Biosystems). Experiments were performed in duplicate from two independent immunoprecipitated chromatin batches. This analysis was done using sets of adjacent specific amplified regions (Appendix Table S1). Student's t‐test was used to determine statistical significance of these data (http://graphpad.com/quickcalcs/ttest2.cfm).
Transgenic lines generation
Genomic DNA from Arabidopsis ecotype Columbia (Col‐0) was used as the template for amplification. pEXPA1:ER‐GFP transcriptional fusion was generated utilizing the Gateway system (Invitrogen). The 1,886 base pairs (bp) region upstream of the EXPA1 ATG was amplified using the pEXPA1 primers (Appendix Table S1), and the PCR product was then cloned in pENTR5’‐TOPO TA vector. Subsequently, pENTR5′‐TOPO TA‐pEXPA1 and pDONOR221‐ER‐GFP were recombined with pDONR P2R_P3‐NOS into a pBm43GW destination vector via LR reaction (Invitrogen). pEXPA10‐GUS, pEXPA14‐GUS, and pEXPA15‐GUS transcriptional fusion were generated utilizing the Gateway system (Invitrogen). The 2,040 bp region upstream of the EXPA10 ATG, the 2,001 bp region upstream of the EXPA14 ATG, and the 2,003 bp region upstream of the EXPA15 ATG were amplified using the pEXPA10, pEXPA14, and pEXPA15 primers (Appendix Table S1), respectively. pENTR5′‐TOPO TA‐pEXPA10, pENTR5′‐TOPO TA‐pEXPA14, pENTR5′‐TOPO TA‐pEXPA15, and a pDONOR221‐GUS vector were recombined with pDONR P2R_P3‐NOS into a pBm43GW destination vector via LR reaction (Invitrogen). UBQ10‐EXPA1, UBQ10‐EXPA10, UBQ10‐EXPA14, and UBQ10‐EXPA15 constructs were obtained as follows. The EXPA1, EXPA10, EXPA14, and EXPA15 sequences were amplified using the gEXPA1, gEXPA10, gEXPA14, and gEXPA15 primers (Appendix Table S1) and cloned in pDONR221 Gateway vector by BP recombination (Invitrogen). Subsequently, pDONR221‐EXPA1, pDONR221‐EXPA10, pDONR221‐EXPA14, and pDONR221‐EXPA15, respectively, were recombined with a pDONRP4_P1R‐pUBQ10 vector and pDONRP2R_P3‐NOS into a pBm43GW destination vector via LR reaction (Invitrogen). To generate AHA1‐GFP and AHA2‐GFP constructs, the 1,930 bp region upstream of the AHA1 ATG and the 1,819 bp region upstream of the AHA2 ATG were amplified using the pAHA1 and pAHA2 primers (Appendix Table S1), respectively, and the PCR product was then cloned in pENTR5′‐TOPO TA vector. The AHA1 and AHA2 sequences were amplified using the gAHA1 and gAHA2 primers (Appendix Table S1) and cloned in pDONR221 Gateway vector by BP recombination (Invitrogen). Subsequently, pDONRP4_P1R‐pAHA1 and pDONR221‐AHA1 and pDONRP4_P1R‐pAHA2 and pDONR221‐AHA2 were recombined with pDONR P2R_P3‐C‐term GFP into a pBm43GW destination vector via LR reaction (Invitrogen). pUBQ10::AHA2:GR construct was obtained as follows. The pDONRP4_P1R‐pUBQ10 vector and pDONR221‐AHA2 vector were recombined with pDONRP2R_P3‐GR into a pB7m34GW destination vector via LR reaction (Invitrogen). Plasmids were transformed into Col‐0 plants by floral dipping (Clough & Bent, 1998). For each T3 generation, four independent homozygous lines of transgenic plants were analyzed. AHA1‐GFP and AHA2‐GFP translational fusions rescue the AHA1/aha1;AHA2/aha2 mutant phenotype.
GUS histochemical assay
GUS histochemical assay was performed as described in Perilli and Sabatini (2010). Five‐day‐old seedlings were incubated for 16 h at 37°C in the dark and imaged using the Axio Imager.A2 (Zeiss) microscope.
Fluorescence quantification
The fluorescence intensity of plants carrying AHA1‐GFP and AHA2‐GFP was quantified by the plugin MeasureRGB of the software ImageJ on confocal laser scanning microscope images taking as ROI the expression domain of AHA1 and AHA2, respectively. Student's t‐test was used to determine statistical significance of these data (http://graphpad.com/quickcalcs/ttest2.cfm).
Hormonal treatments
Five‐day‐old seedlings were transferred to solid one‐half MS medium containing mock conditions or a suitable concentration of hormone. For cytokinin treatment, we used trans‐zeatin (tZ, Duchefa) at a final concentration of 5 μM. For dexamethasone (Dex, Sigma) treatment, a final concentration of 10 μM was used. For DEX treatments, mock represents the MS media supplemented with ethanol. For tZ treatments, mock signifies MS media supplemented with dimethyl sulfoxide.
Rhizosphere acidification assays
To visualize rhizosphere acidification, 5‐day‐old seedlings were transferred to one‐half‐strength MS‐agar plates supplemented with 0.003% bromocresol purple (Sigma‐Aldrich) (sensitivity range pH 5.2–6.8). The plates were incubated in the same culture chamber and scanned after 16 h. Comparisons were made with a color bar generated by documenting the color change of bromocresol purple in the same medium at specific pH values.
Author contributions
EP planned and performed experiments. RDM and RDI performed experiments. EP, SS, and PC discussed and interpreted all results and wrote the manuscript. SS conceived the research.
Conflict of interest
The authors declare that they have no conflict of interest.
Supporting information
Appendix
Expanded View Figures PDF
Review Process File
Acknowledgements
We thank Elena Salvi, Emanuela Pierdonati, and Laura Polverari for critical reading of the manuscript. We thank GrassRoots Biotechnology, Inc. for providing the pDONORP4P1‐pUBQ10 vector, pub. no. WO/2012/006426. We thank Philip N. Benfey and Renze Heidstra for providing materials. This work was supported by The European Research Council (to S.S. and E.P.), FIRB (Futuro in Ricerca 2013) (to R.D.I. and E.P.), and by grant from Sapienza University (to P.C.).
The EMBO Journal (2018) 37: e99134
References
- Baxter I, Tchieu J, Sussman MR, Boutry M, Palmgren MG, Gribskov M, Harper JF, Axelsen KB (2003) Genomic comparison of P‐type ATPase ion pumps in Arabidopsis and rice. Plant Physiol 132: 618–628 [DOI] [PMC free article] [PubMed] [Google Scholar]
- Benfey PN, Scheres B (2000) Root development. Curr Biol 10: R813–R815 [DOI] [PubMed] [Google Scholar]
- Bhargava A, Clabaugh I, To JP, Maxwell BB, Chiang Y‐H, Schaller GE, Loraine A, Kieber JJ (2013) Identification of cytokinin‐responsive genes using microarray meta‐analysis and RNA‐Seq in Arabidopsis . Plant Physiol 162: 272–294 [DOI] [PMC free article] [PubMed] [Google Scholar]
- Cho H‐T, Cosgrove DJ (2000) Altered expression of expansin modulates leaf growth and pedicel abscission in Arabidopsis thaliana . Proc Natl Acad Sci 97: 9783–9788 [DOI] [PMC free article] [PubMed] [Google Scholar]
- Clough SJ, Bent A (1998) Floral dip: a simplified method for Agrobacterium‐mediated transformation of Arabidopsis thaliana . Plant J 16: 735–743 [DOI] [PubMed] [Google Scholar]
- Cosgrove DJ (2005) Growth of the plant cell wall. Nat Rev Mol Cell Biol 6: 850–861 [DOI] [PubMed] [Google Scholar]
- Dello Ioio R, Linhares FS, Sabatini S (2008a) Emerging role of cytokinin as a regulator of cellular differentiation. Curr Opin Plant Biol 11: 23–27 [DOI] [PubMed] [Google Scholar]
- Dello Ioio R, Linhares FS, Scacchi E, Casamitjana‐Martinez E, Heidstra R, Costantino P, Sabatini S (2007) Cytokinins determine Arabidopsis root‐meristem size by controlling cell differentiation. Curr Biol 17: 678–682 [DOI] [PubMed] [Google Scholar]
- Dello Ioio R, Nakamura K, Moubayidin L, Perilli S, Taniguchi M, Morita MT, Aoyama T, Costantino P, Sabatini S (2008b) A genetic framework for the control of cell division and differentiation in the root meristem. Science 322: 1380–1384 [DOI] [PubMed] [Google Scholar]
- Di Mambro R, De Ruvo M, Pacifici E, Salvi E, Sozzani R, Benfey PN, Busch W, Novak O, Ljung K, Di Paola L, Marée AFM, Costantino P, Grieneisen VA, Sabatini S (2017) Auxin minimum triggers the developmental switch from cell division to cell differentiation in the Arabidopsis root. Proc Natl Acad Sci 114: E7641–E7649 [DOI] [PMC free article] [PubMed] [Google Scholar]
- French AP, Wilson MH, Kenobi K, Dietrich D, Voß U, Ubeda‐Tomás S, Pridmore TP, Wells DM (2012) Identifying biological landmarks using a novel cell measuring image analysis tool: cell‐o‐Tape. Plant Methods 8: 7 [DOI] [PMC free article] [PubMed] [Google Scholar]
- Fridman Y, Elkouby L, Holland N, Vragović K, Elbaum R, Savaldi‐Goldstein S (2014) Root growth is modulated by differential hormonal sensitivity in neighboring cells. Genes Dev 28: 912–920 [DOI] [PMC free article] [PubMed] [Google Scholar]
- Gruel J, Landrein B, Tarr P, Schuster C, Refahi Y, Sampathkumar A, Hamant O, Meyerowitz EM, Jönsson H (2016) An epidermis‐driven mechanism positions and scales stem cell niches in plants. Sci Adv 2: e1500989 [DOI] [PMC free article] [PubMed] [Google Scholar]
- Gujas B, Alonso‐Blanco C, Hardtke CS (2012) Natural Arabidopsis brx loss‐of‐function alleles confer root adaptation to acidic soil. Curr Biol 22: 1962–1968 [DOI] [PubMed] [Google Scholar]
- Hacham Y, Holland N, Butterfield C, Ubeda‐Tomas S, Bennett MJ, Chory J, Savaldi‐Goldstein S (2011) Brassinosteroid perception in the epidermis controls root meristem size. Development 138: 839–848 [DOI] [PMC free article] [PubMed] [Google Scholar]
- Haruta M, Burch HL, Nelson RB, Barrett‐Wilt G, Kline KG, Mohsin SB, Young JC, Otegui MS, Sussman MR (2010) Molecular characterization of mutant Arabidopsis plants with reduced plasma membrane proton pump activity. J Biol Chem 285: 17918–17929 [DOI] [PMC free article] [PubMed] [Google Scholar]
- Haruta M, Gray WM, Sussman MR (2015) Regulation of the plasma membrane proton pump (H + ‐ATPase) by phosphorylation. Curr Opin Plant Biol 28: 68–75 [DOI] [PMC free article] [PubMed] [Google Scholar]
- Marshall WF, Young KD, Swaffer M, Wood E, Nurse P, Kimura A, Frankel J, Wallingford J, Walbot V, Qu X, Roeder AHK (2012) What determines cell size? BMC Biol 10: 101 [DOI] [PMC free article] [PubMed] [Google Scholar]
- Pacifici E, Polverari L, Sabatini S (2015) Plant hormone cross‐talk: the pivot of root growth. J Exp Bot 66: 1113–1121 [DOI] [PubMed] [Google Scholar]
- Perilli S, Sabatini S (2010) Analysis of root meristem size development. Methods Mol Biol 655: 177–187 [DOI] [PubMed] [Google Scholar]
- Sabatini S, Heidstra R, Wildwater M, Scheres B (2003) SCARECROW is involved in positioning the stem cell niche in the Arabidopsis root meristem. Genes Dev 17: 354–358 [DOI] [PMC free article] [PubMed] [Google Scholar]
- Sampedro J, Cosgrove DJ (2005) The expansin superfamily. Genome Biol 6: 242 [DOI] [PMC free article] [PubMed] [Google Scholar]
- Staal M, De Cnodder T, Simon D, Vandenbussche F, Van der Straeten D, Verbelen J‐P, Elzenga T, Vissenberg K (2011) Apoplastic alkalinization is instrumental for the inhibition of cell elongation in the Arabidopsis root by the ethylene precursor 1‐aminocyclopropane‐1‐carboxylic acid. Plant Physiol 155: 2049–2055 [DOI] [PMC free article] [PubMed] [Google Scholar]
Associated Data
This section collects any data citations, data availability statements, or supplementary materials included in this article.
Supplementary Materials
Appendix
Expanded View Figures PDF
Review Process File


