Abstract
T helper (Th)17 cells represent a unique subset of CD4+ T cells and are vital for clearance of extracellular pathogens including bacteria and fungi. However, Th17 cells are also involved in orchestrating autoimmunity. By employing quantitative surface proteomics, we found that the evolutionarily conserved prohibitins (PHB1/2) are highly expressed on the surface of both murine and human Th17 cells. Increased expression of PHBs at the cell surface contributed to enhanced CRAF/MAPK activation in Th17 cells. Targeting surface‐expressed PHBs on Th17 cells with ligands such as Vi polysaccharide (Typhim vaccine) inhibited CRAF‐MAPK pathway, reduced interleukin (IL)‐17 expression and ameliorated disease pathology with an increase in FOXP3+‐expressing Tregs in an animal model for multiple sclerosis (MS). Interestingly, we detected a CD4+ T cell population with high PHB1 surface expression in blood samples from MS patients in comparison with age‐ and sex‐matched healthy subjects. Our observations suggest a pivotal role for the PHB‐CRAF‐MAPK signalling axis in regulating the polarization and pathogenicity of Th17 cells and unveil druggable targets in autoimmune disorders such as MS.
Keywords: CRAF, FOXP3, MAPK, multiple sclerosis, prohibitins
Subject Categories: Immunology
Introduction
Among the different subsets of CD4+ T cells, T helper (Th)17 cells have gained enormous attention recently due to their established role in the aetiology of autoimmune disorders (Singh et al, 2014; Yang et al, 2014; Patel & Kuchroo, 2015). Th17 cells are primarily recognized by their ability to produce interleukin (IL)‐17, mostly IL‐17A and IL‐17F (Harrington et al, 2005). In addition to IL‐17, Th17 cells coproduce IL‐21, IL‐22, granulocyte–macrophage colony‐stimulating factor (GM‐CSF) and chemokine receptor CCR6, which coordinates Th17‐mediated tissue inflammation. Other cytokines such as IL‐6, IL‐1β, IL‐21, IL‐23 and transforming growth factor (TGF)‐β contribute to the differentiation of Th17 cells from naïve CD4+ T cells (Bettelli et al, 2006; Mangan et al, 2006; Veldhoen et al, 2006). While naïve CD4+ T cells lack IL‐23 receptor (IL‐23R), the IL‐6‐STAT3 signalling axis leads to the expression of IL‐23R; IL‐23 is required for Th17‐mediated autoimmune responses (Ciofani et al, 2012). The repertoire of Th17‐associated factors is primarily controlled through the activation of transcription factors RORα, RORγt and STAT3 (Yang et al, 2007, 2008). While the contribution of Th17 cells towards the manifestation of autoimmune disorders is well established, the molecular signalling pathways that control the polarization and pathogenicity of Th17 cells have been intensively studied (Gaffen et al, 2014).
Multiple sclerosis (MS) is a neuroinflammatory disease which affects more than two million people worldwide, women more than twice as often as men, and may lead to devastating disability in young adults. Experimental autoimmune encephalomyelitis (EAE) is a well‐established essential animal model for understanding the pathology of MS (Luchtman et al, 2014). While the critical role of IL‐17‐producing Th17 cells in the pathology of EAE animal models is established, their role in the aetiology of MS remains controversial. Nevertheless, it could be shown recently that IL‐17‐producing T cells in the periphery correlate with T1 hypointense lesions in the brain of highly active MS patients (Buehler et al, 2016). Moreover, antibodies against IL‐17 or IL‐17 receptors showed promising results in EAE animal models, and furthermore, these effects could also be detected in a human phase II clinical trial (Luchtman et al, 2014). IL‐17 antibodies are already approved for treatment of autoimmune disorders such as psoriasis (Waisman, 2012). Apart from protein‐based biologics targeting inflammatory cytokines or their cognate receptors, drugs targeting the “druggable genome” in autoimmune disorders are rare. Thus far, the FDA has approved tofacitinib, an inhibitor of Janus kinases (JAKs), for treatment of rheumatoid arthritis; several other small molecule inhibitors targeting JAKs are in clinical development (van Vollenhoven, 2013). Here, we demonstrate that targeting the PHB‐CRAF axis and the CRAF‐MAPK cascade could possibly be a strategy to combat autoimmune disorders such as MS.
Prohibitins (PHB1/2) are flagship members of the SPFH superfamily of proteins (named after stomatin, prohibitin, flotillin and Hflk/C) that carry an evolutionarily conserved PHB domain (Browman et al, 2007). PHB1/2 function as stable heteromers and a large fraction of the PHB1/2 proteins are present in the mitochondrial inner membrane where they form large multimeric ring‐like complexes which are critical for the functional and structural integrity of the mitochondria (Merkwirth & Langer, 2009). Loss of PHBs leads to abnormal cristae morphology due to accelerated processing of the dynamin‐like GTPase OPA1 (Merkwirth et al, 2008). Recent studies revealed an emerging role for the plasma membrane (PM)‐associated fraction of PHB1 in mediating signal transduction (Mishra et al, 2010). More than a decade ago, we showed that the PM‐associated fraction of PHB1 is required for the activation of CRAF kinase by oncogenic RAS (Rajalingam et al, 2005).
CRAF is the central member of the RAS‐RAF‐MAPK cascade that controls fundamental cellular processes. RAF kinases are serine/threonine kinases and comprise three isoforms (ARAF, BRAF and CRAF) (Matallanas et al, 2011). RAS are small GTPases comprising three isoforms HRAS, NRAS and KRAS. Upon activation, RAS binds to CRAF and recruits CRAF to the PM, a critical event in the activation of the CRAF kinase. At the PM, association with PHB1 is required for the full activation of this kinase. Recent studies have identified PHB1/2 as a direct target of rocaglamides (RocA) which are natural anti‐tumour drugs. Further, binding of rocaglamides to the PHB1/2 complex directly disrupts the interaction between CRAF and PHB1, leading to inactivation of CRAF kinase (Polier et al, 2012). Vi polysaccharide of Salmonella Typhi has been shown to target the PHB1/2 complex at the cell surface to modulate MAPK and IL‐8 signalling in human intestinal epithelial cells (Sharma & Qadri, 2004). Furthermore, Vi polysaccharide is a WHO‐recommended vaccine (Typhim) that can be administered to healthy individuals to protect them from Salmonella enterica (serovar Typhi) infections.
In T cells, where PHBs are found to be surface‐expressed upon activation, Siglec‐9 expressed on antigen‐presenting cells (APC) was identified to be a natural, physiological ligand of surface‐exposed PHB1 (Yurugi et al, 2013). Siglec‐9 binding to PHBs led to inhibition of MAPK signalling and IL‐2 production. Notably, in all these examples, the ligands target surface‐exposed PHB1. Indeed, the PM‐associated fraction of PHB1 has been associated with several distinct functions. For example, translocation of PHB1 to the PM is required for the activation of mast cells (Kim et al, 2013). Moreover, the PM‐associated fraction of PHB1 has been shown to contribute to paclitaxel resistance in tumour cells, as well as enhanced metastases in cervical carcinomas due to high CRAF‐MAPK activation (Patel et al, 2010; Chiu et al, 2013). In this study, we found that PHB1 is highly expressed on the surface of Th17 cells, contributing to their pathogenicity. Targeting surface‐expressed PHB1/2 led to inhibition of the CRAF‐MAPK cascade that controls the plasticity of Th17 cells.
Results
With an aim to provide novel insights into mechanisms driving the differentiation of Th17 cells, we performed label‐free quantitative surface proteomics of Th2 versus Th17 cells as described in the methods section. In short, cells were biotinylated and surface‐expressed proteins were isolated by streptavidin beads post‐lysis and subjected to liquid chromatography–mass spectrometry (LC‐MS) analysis. After confirming the purity of the fractions, label‐free quantitative analysis of the mass spectrometry data led to identification of several factors which were specifically expressed in the different subsets of CD4+ T cells (Table EV1). More than 100 proteins were found to be differentially regulated in Th17 cells in comparison with Th2 cells which were identified in all three biological replicates from three healthy human donors (Fig 1A and Table EV1). We then focussed primarily on the signalling factors that were found to be surface‐expressed in Th17 cells (Table EV1). Prohibitins (PHB1/2) were consistently upregulated on the surface of Th17 cells in all the screens with an average fold‐change of 3.20 ± 1.34 for PHB1 and 2.57 ± 0.79 for PHB2 (Fig 1B and Table EV1). To validate the mass spectrometry‐based results, we repeated the surface biotinylation of Th17 and Th2 cells and confirmed by Western blotting that PHBs are indeed highly surface expressed in Th17 cells (Fig 1C). We then tested whether PHBs were specifically surface expressed in Th17 cells derived from murine CD4+ T cells. As expected, we detected an increase in PHB1 exposure in Th17 cells in comparison with Th1, Th2 and Tregs from mice (Fig 1D). These results were further confirmed by employing a specific PHB1 binding peptide (CKGGRAKDC) coupled to rhodamine (Kolonin et al, 2004; (Fig EV1A). Immunofluorescence analysis also confirmed that PHB1 is surface expressed in plasma membrane microdomains as revealed by a dotted, granular staining pattern exhibited throughout the surface of Th17 cells (Fig 1E). PHBs were also highly expressed at both the mRNA and protein levels in Th17 cells (Figs 1F–H and EV1B–D). Finally, we detected high PHB1 levels on the cell surface of Th17 but not Th1 or Th2 cells in ex vivo cultures both on day 1 and on day 7 of differentiation (Fig EV1E). Taken together, these data suggest that PHBs are highly expressed at the cellular level as well as on the surface of Th17 cells.
Figure 1. Prohibitins are surface exposed and highly expressed in Th17 cells.
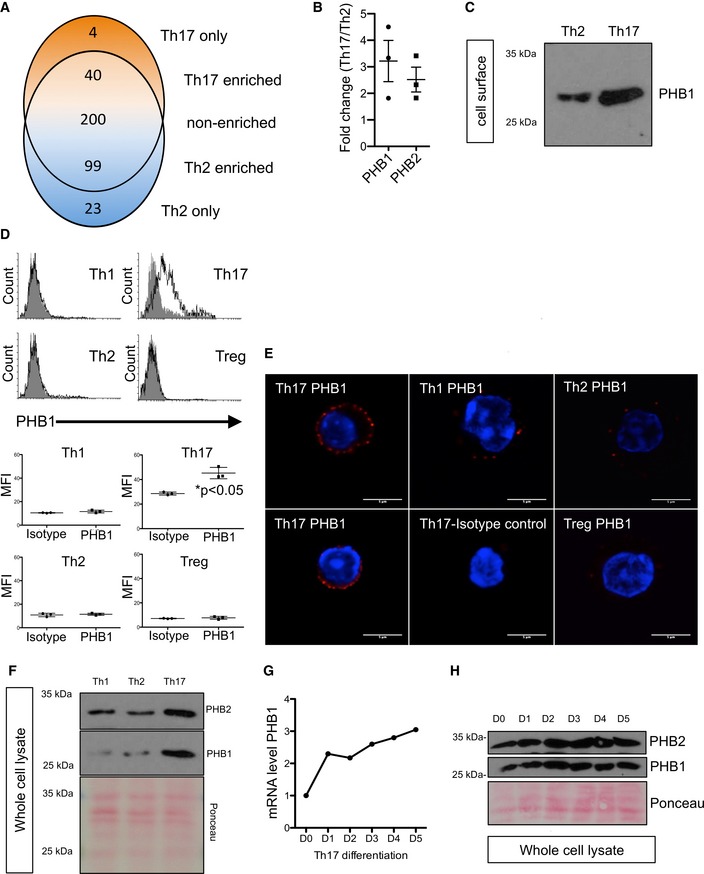
- Venn diagram showing overlap between proteins identified in the surface biotinylation experiments. Shown are short listed factors that are consistently detected in three biological replicates (n = 3 healthy human donors). The 366 proteins identified in both cell types are split into proteins showing at least twofold higher abundance in Th17 cells, proteins with a log2 ratio between −1 and 1 (considered as non‐cell type specific) and proteins with at least twofold higher abundance in Th2 cells.
- Graphical presentation of the calculated fold‐change values for prohibitin‐1 (PHB1) and prohibitin‐2 (PHB2) based on label‐free quantification results from three biological replicates, shown as mean (± SEM).
- Surface biotinylation of murine Th2 and Th17 cells was performed, and the surface expression of PHB1 was checked by immunoblots.
- Th1, Th2, Th17 and Treg cells were stained for PHB1 expression. Isotype antibody was used as a control (filled histogram). MFI (mean fluorescence intensity) is shown as mean (± SEM); n = 3 animals per group.
- Cells were treated and stained with Alexa594‐conjugated secondary antibody. Red signal indicates surface expression of PHB1 in Th17, Th1 and Th2 cells; the nucleus was stained (blue) with Hoechst. Scale bar = 5 μm.
- The expression levels of PHB1 and PHB2 in the murine whole‐cell lysates were analysed by immunoblots. PHB1 and PHB2 are highly expressed in Th17 cells.
- The expression analysis of PHB1 mRNA levels reveals a steady increase during the course of Th17 cell differentiation. Shown are the data from a single representative experiment.
- CD4+ T cells subjected to Th17 differentiation were lysed on indicated days, and the levels of PHB1 and PHB2 total protein were monitored by immunoblots.
Figure EV1. PHB1 is highly surface expressed in Th17 cells.
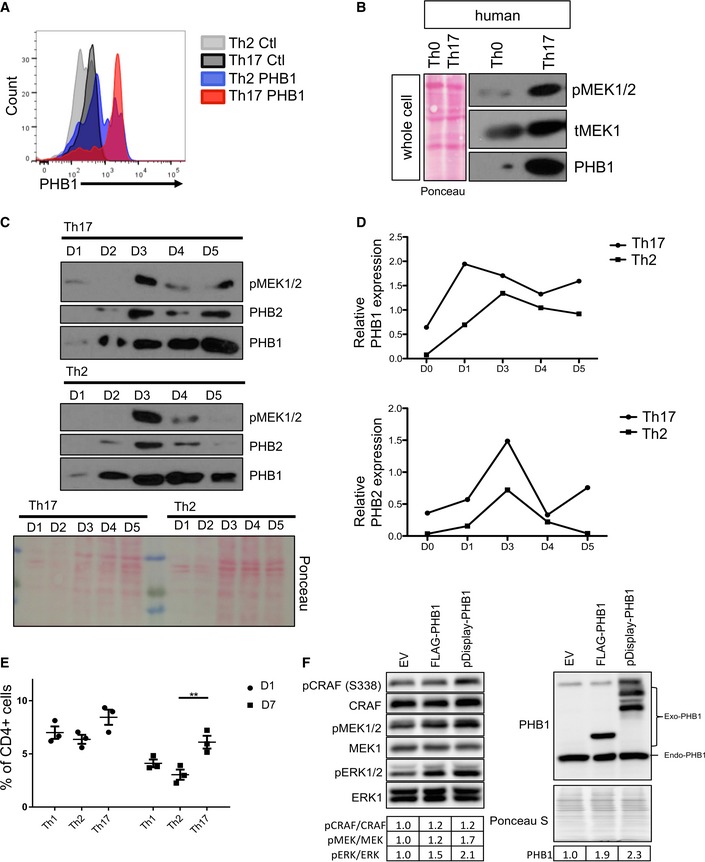
- The surface expression of PHBs was monitored by FACS analysis by employing a PHB‐binding peptide and a scrambled control peptide coupled to rhodamine. Shown are data from a representative experiment.
- The activation of MEK1 (a downstream substrate of CRAF kinase) was monitored by immunoblots in Th0 and Th17 cells isolated from a healthy human donor. Shown are the data from a representative experiment.
- Kinetics of total PHB1 and PHB2 protein levels during the differentiation Th17 and Th2 cells was analysed by Western blots.
- The protein levels of PHB1/2 shown in (C) were quantified by ImageJ. Ponceau staining of the entire membrane (in B and C) was employed for total protein levels.
- Naïve T cells were treated with corresponding cytokines to obtain Th1, Th2 or Th17 cells. The surface expression of PHB1 was measured by FACS analysis on Day 1 and Day 7. Shown are data from three independent experiments. Error bars represent the standard error of the mean (± SEM). P‐values were calculated using a two‐way ANOVA test with a SIDAK multiple comparisons test; **P < 0.01.
- HeLa cells were transfected with empty vector (EV), CMV‐PHB1 or pDISPLY‐PHB1. The cells were lysed, and the proteins were separated in an SDS–PAGE. Western blot analysis was performed to measure the activation of CRAF, MEK1/2 and ERK1/2. The quantification of the bands was performed by ImageJ and presented as a table.
Source data are available online for this figure.
As the PM‐associated fraction of PHB1 is shown to contribute to CRAF activation in other cell types, we hypothesized that enhanced PHB1 expression at the cell surface might contribute to increased CRAF‐MAPK activation in Th17 cells. In fact, artificial targeting of PHB1 to the cell surface enhanced CRAF‐MEK1 activation in HeLa cells (Fig EV1F). As expected, we detected high levels of active CRAF serine 338 phosphorylation in the steady‐state Th17 cells isolated from healthy human blood samples (Fig 2A). In turn, we also detected an increase in the activation of MEK1/2 and ERK1/2 kinases in Th17 cells (Figs 2A and EV1B and C). As PHB1 is required for the activation of CRAF, we tested whether interfering with the PHB‐CRAF interface using established ligands of PHBs could influence the activation dynamics of MAPK activation in Th17 cells.
Figure 2. CRAF‐MAPK is activated in Th17 cells; targeting of PHB1/2 complex with specific ligands leads to the inhibition of this pathway.
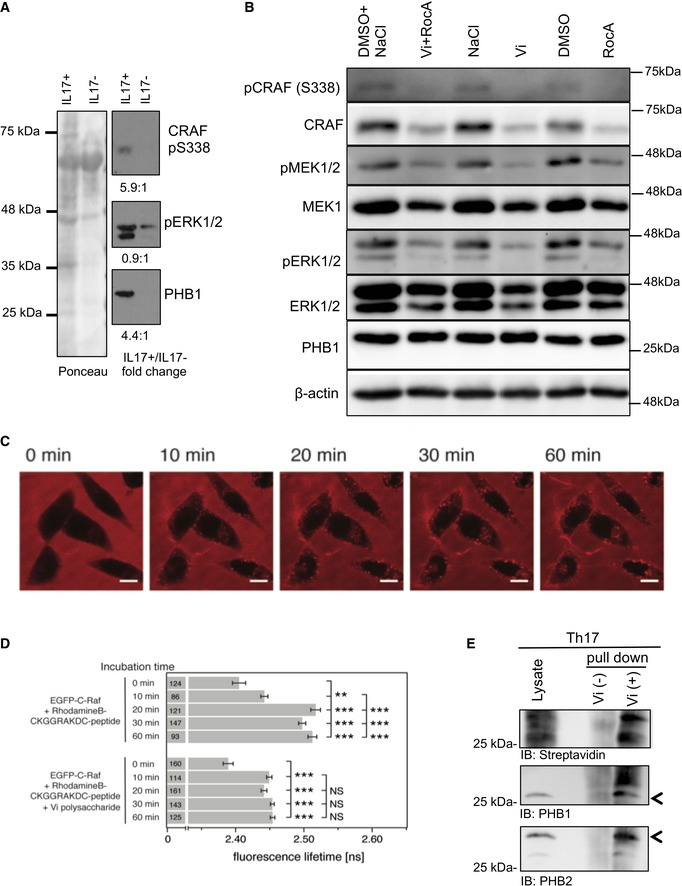
- Th17 cells were isolated from the blood of healthy donors and protein lysates were prepared. Immunoblot analysis was performed to monitor the activation status of CRAF and ERK1/2 kinases. PHB1 levels were also monitored. Ponceau staining of the entire membrane was performed; quantification of each band was normalized to the total protein levels. Representative of n = 3 healthy donors.
- Murine Th17 cells were differentiated in vitro in the presence of Vi polysaccharide and/or RocA; the activation dynamics of CRAF, MEK1/2 and ERK1/2 kinases were monitored with phospho‐specific antibodies.
- HeLa cells were incubated with PHB‐binding peptide (CKGGRAKDC coupled to rhodamine) for various time periods and monitored under a confocal microscope for localization studies. Scale bar = 10 μm.
- Acceptor in‐growth FLIM‐FRET measurements in HeLa cells expressing EGFP‐C‐RAF and incubated with CKGGRAKDC‐rhodamine B peptide (20 μM) for 0, 10, 20, 30 or 60 min to labelled plasma membrane PHB. The effect of the 100 μg/ml Vi polysaccharide treatment was examined. Numbers in bars indicate the number of analysed cells from two biological replicates. Analysis of variance (ANOVA) complemented by Tukey's honestly significant difference test (Tukey's HSD) performed in the software R version 2.15.2 was used to determine the statistical differences. Statistical significance levels are annotated as NS = non‐significant P > 0.05, *P < 0.05, **P > 0.01, ***P < 0.001. Error bars represent ± SEM.
- The surface proteins on Th17 cells bound to immobilized‐Vi polysaccharide were isolated; the presence of PHB1/2 complex was monitored by immunoblots.
Source data are available online for this figure.
We employed Vi polysaccharide which has been shown to interact directly with surface‐expressed PHB1/2 complex in epithelial cells (Sharma & Qadri, 2004). As expected, Vi polysaccharide treatment of Th17 cell cultures differentiated in vitro from mice led to a striking reduction in the activation of the CRAF and MEK1 kinases (Fig 2B). To further corroborate these observations, we treated Th17 cell culture with rocaglamide (RocA), a natural anti‐tumour drug that has been shown to disrupt CRAF‐PHB interaction in tumour cells (Polier et al, 2012). Interestingly, treatment with RocA led to a strong reduction in the activation of CRAF–MAPK kinase cascade in Th17 cells (Fig 2B). While treatment with Vi polysaccharide did not affect cell viability in CD4+ T cells, RocA treatment led to a reduction in the proliferation of CD4+ T cells (Fig EV2A–C). Furthermore, RocA has also been shown to influence protein translational machinery by directly targeting eIF4a (Iwasaki et al, 2016). As most PHBs are localized to the mitochondrial inner membrane, we tested whether binding of Vi polysaccharide or RocA under these settings altered mitochondrial viability and function in Th17 cells. Neither treatment disturbed the mitochondrial membrane potential nor Opa 1 processing, a frequent event observed during PHB1/2‐depleted and/or knockout conditions (Fig EV2D and E). To further confirm that Vi polysaccharide treatment led to disruption of PHB1‐CRAF at the plasma membrane, we performed FLIM‐FRET experiments in the acceptor in‐growth mode (Harpur et al, 2001). We employed a fluorescently labelled PHB‐binding peptide and EGFP‐tagged CRAF in HeLa cells. Time‐lapse imaging experiments confirmed that PHB‐specific peptide decorated the plasma membrane of epithelial cells (Fig 2C) as described earlier (Chiu et al, 2013). Furthermore, we could determine that Vi polysaccharide treatment successfully led to the disruption of PHB1‐CRAF interaction at the plasma membrane (Fig 2D). To verify that Vi polysaccharide directly bound to PHB1/2 complex at the surface of Th17 cells, we employed a Vi‐trap approach, where surface biotinylated proteins bound to immobilized Vi polysaccharide beads were analysed as described in the methods section. These results indeed confirmed that Vi polysaccharide bound to PHB1/2 complex exposed in the cell surface of Th17 cells (Fig 2E). We then tested whether intervention of PHB‐CRAF‐MAPK signalling has any influence on the generation and/or pathogenicity of Th17 cells.
Figure EV2. Effects of PHB ligands on cell viability.
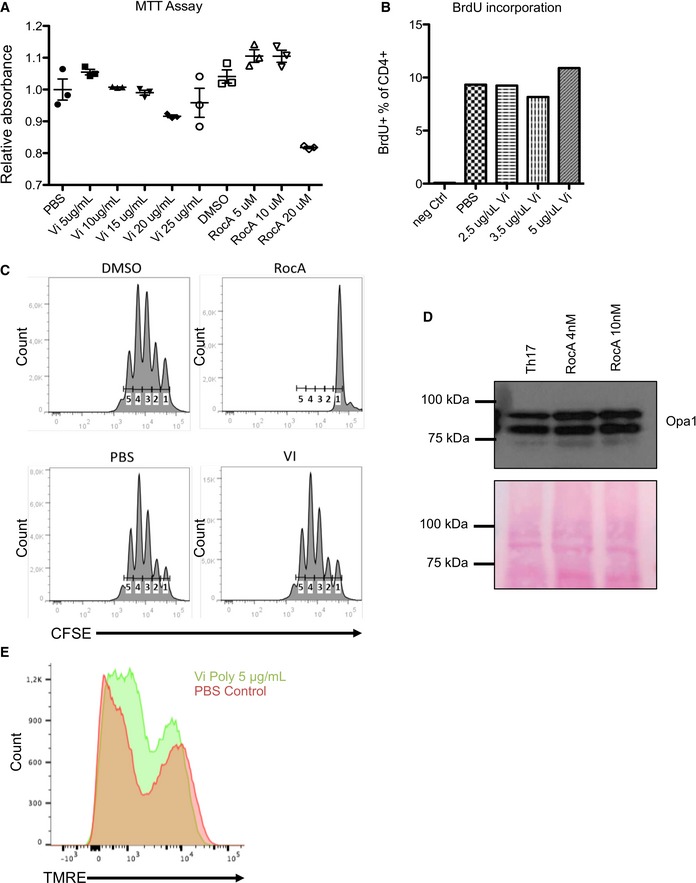
- Th17 cells from mice were treated with various concentrations of either Vi polysaccharide or RocA for 3 days, and the viability of the cells was measured by MTT assays. Shown are data from three independent experiments (n = 3). Error bars represent standard error of the mean (± SEM).
- The proliferation of Vi polysaccharide‐treated CD4+ T cells was monitored by incorporation of Alexa421‐labelled BrdU. The CD4+ T cells were treated with various concentrations of Vi polysaccharide for 48 h. Shown are FACS analysis data from a single representative experiment.
- CFSE staining of Th17 cells incubated for 72 h with Vi polysaccharide or RocA was performed, and the samples were analysed by FACS. Shown are data from a single representative experiment.
- The processing of Opa1 in RocA‐treated Th17 cells was monitored by immunoblot analysis. Ponceau staining of the entire membrane was performed to control the total protein levels.
- The mitochondrial membrane potential of Th17 cells incubated with Vi polysaccharide for 72 h was monitored by FACS analysis. Shown are histograms from a representative experiment.
Source data are available online for this figure.
Recent studies employing single‐cell genomics identified a unique set of pathogenicity factors that contribute to disease pathology in Th17 cells (Gaublomme et al, 2015). We checked whether any of the key factors are altered in Th17‐polarized cells treated with PHB ligands. Interestingly, pathogenic factors including IL‐17A, IL‐17F and RORγt were downregulated at the mRNA level in Th17 cells treated with PHB ligands (Vi polysaccharide and RocA) (Fig 3A). Surprisingly, we detected a strong upregulation of FOXP3 both on the mRNA and on protein levels in the same population, suggesting that interfering with CRAF activation led to a switch towards a more regulatory Treg population in these cultures (Fig 3A and B).
Figure 3. Interfering with PHB‐CRAF signalling axis ameliorates Th17‐mediated pathogenicity.
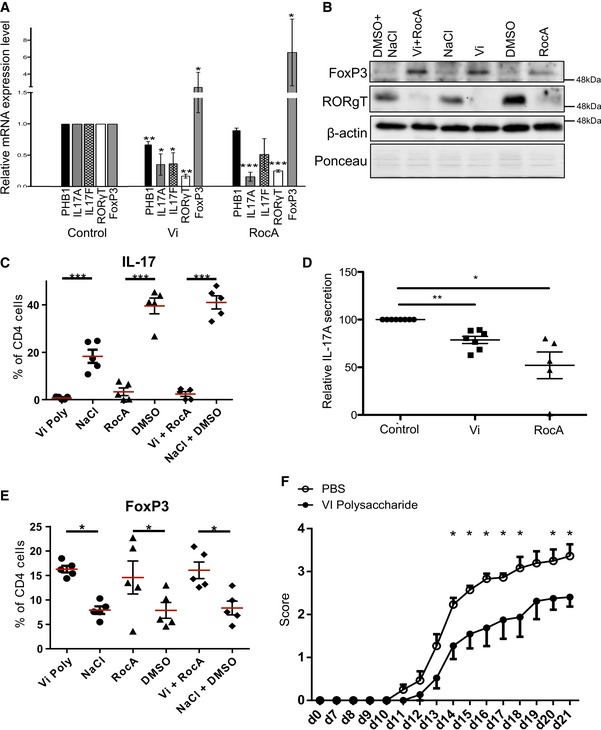
- Murine Th17 cells were differentiated in the presence of either Vi polysaccharide or RocA, and the mRNA levels of IL‐17A, IL‐17F, RORγt and FOXP3 were monitored by real‐time PCR analysis. Shown are data from three independent experiments (n = 3).
- Murine Th17 cells were treated with either solvent (PBS) or Vi polysaccharide or RocA or both; the cell lysates were subjected to immunoblot analysis for the protein levels of RORγt, FOXP3 and actin. Ponceau staining (PS) of the entire membrane was performed to monitor total protein levels.
- The effects of RocA and Vi polysaccharide on IL‐17 during polarization of CD4+ T cells to Th17 cells were monitored by FACS (n = 5).
- The relative secretion of IL‐17A during culture and treatment with either RocA or Vi polysaccharide was monitored by ELISA (control, n = 8 and Vi polysaccharide treatment n = 7 each; RocA treatment n = 5).
- The effects of RocA and Vi polysaccharide on FOXP3 during the polarization of CD4+ T cells to Th17 cells were monitored by FACS (n = 5).
- Mice undergoing active EAE were treated with either placebo PBS control (n = 15) or Vi polysaccharide (n = 12) and monitored for disease pathology.
Consistent with these observations, we detected a strong decrease in the protein levels of RORγt in Th17 cells treated with Vi polysaccharide (Fig 3B). Vi polysaccharide or RocA treatment led to a significant reduction both in the intracellular and in secreted IL‐17 levels as revealed by both FACS analysis and ELISA (Fig 3C and D); however, the treatment significantly induced FOXP3 expression (Fig 3E). Similar results were obtained with IL‐17, RORγt and FOXP3 when the Th17 cultures were treated with MEK1 inhibitor U0126 or with RAF/multikinase inhibitor sorafenib (Fig EV3A). Moreover, Vi polysaccharide treatment did not influence the differentiation of Th1 cells ex vivo (Fig EV3B).
Figure EV3. Effects of CRAF‐MAPK inhibitors on the expression of Th17‐associated factors.
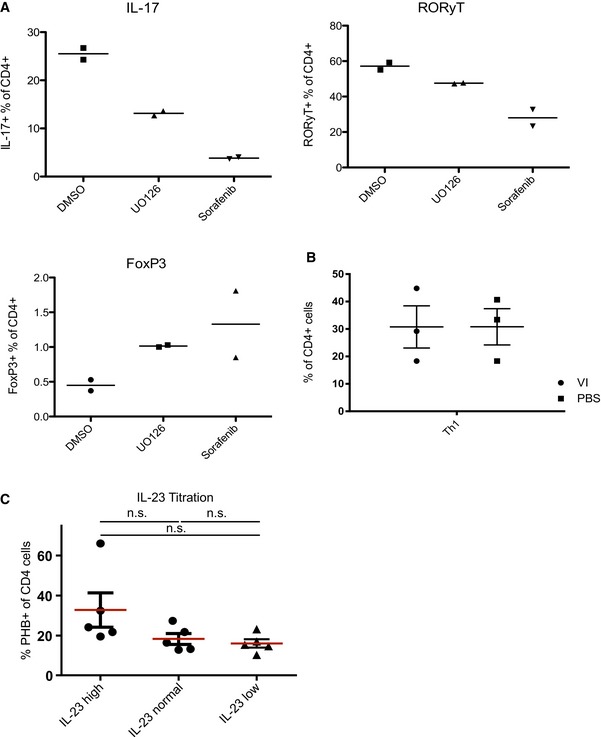
- Th17 cells were treated with U0126 5 μM or sorafenib 10 μM, and the intracellular protein levels of IL‐17, RORγt and FOXP3 were monitored by FACS analyses. Shown are data from two independent experiments.
- Naïve T cells were differentiated over 6 days into Th1 cells. The cells were treated for the last 3 days with 20 μg/ml Vi polysaccharide and CD4+ IFN‐γ+ levels were compared to PBS‐treated cells. Data shown are from three independent experiments.
- The murine cells were initially supplemented with 40 ng/ml IL‐23 (high); 20 ng/ml IL‐23 (normal) or 10 ng/ml IL‐23 (low) and then routinely supplemented with either 20 ng/ml; 10 ng/ml or 5 ng/ml IL‐23 during the culture. The surface PHB expression was analysed via flow cytometry. Shown here are data from five independent experiments. Significance levels were calculated by using Bayesian statistics. Statistical significance levels are annotated as NS = not significant P > 0.05.
As IL‐23 is a major driver for pathogenic T cells (Langrish et al, 2005), we tested whether PHB1 levels are influenced by this cytokine. We could not detect any significant difference in the levels of surface‐exposed PHB1 in CD4+ T cells when they were treated with various concentrations of IL‐23 (Fig EV3C).
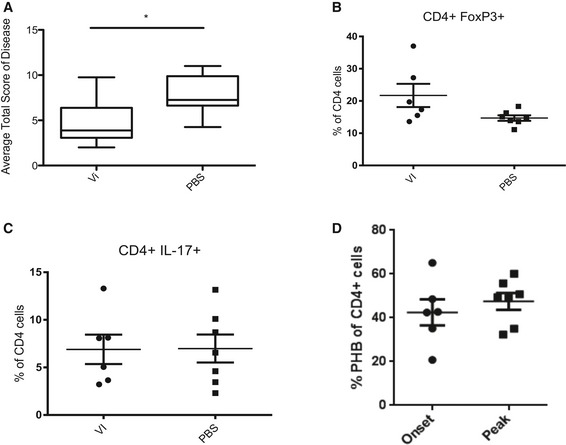
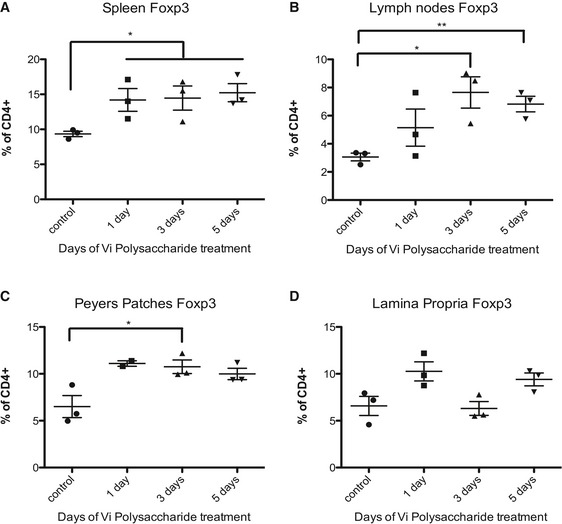
Since treatment with Vi polysaccharide did not influence the proliferation of Th cells (Fig EV2A–C), yet influenced the expression of pathogenic factors in Th17 cells, we performed in vivo experiments with Vi polysaccharide. Treatment of mice undergoing active EAE with Vi polysaccharide led to a significant decrease in disease pathology (Figs 3F and EV4A). By analysing the CNS compartment of the animals during the peak of the disease, we detected an upregulation of the transcription factor FOXP3 in CD4+ T cells of Vi polysaccharide‐treated animals, which is characteristic for Tregs (Fig EV4B). IL‐17‐positive CD4 T cell levels remained the same as in untreated animals (Fig EV4C). These data suggest that the PHB‐CRAF‐MAPK axis primarily contributed to the inhibition of FOXP3 expression under these settings. By analysing the CD4+ cells in the CNS compartment of mice undergoing EAE, we detected that the levels of surface PHB1 tend to increase, albeit not significantly, during the course of the disease suggesting that increased expression of PHB1 could possibly contribute to the pathogenicity of these cells (Fig EV4D). Finally, we also tested whether systemic administration of Vi polysaccharide led to any increase in FOXP3+ cells in various immune privileged sites. An enhanced FOXP3+CD4+ T cell population was detected in spleen, lymph nodes and Peyer's patches after 1 or 3 days of treatment (Fig 4). These results confirmed that in vivo administration of surface PHB1/2 ligand Vi polysaccharide could ameliorate disease pathology in animal models of MS.
Figure EV4. Treatment with Vi polysaccharide reduces disease pathology in EAE animal models.
-
AThe average total EAE disease score of Vi polysaccharide‐treated mice shows a significant reduction in disease severity.
-
B, CMice from the EAE experiment depicted (A) and in Fig 3F were sacrificed on day 15 of EAE and the brains were worked up to check for (B) FOXP3 and (C) IL‐17 levels. Vi polysaccharide treatment showed no effect on CD4+IL‐17+ cell numbers in the brain. Vi polysaccharide‐treated mice showed higher FOXP3 expression in CD4+ cells in the brain.
-
DMice undergoing EAE were worked up either at the onset of the disease (score 0.5) or at the peak of the disease (score 3). The expression of surface PHB1 was monitored in CD4+ cells from the CNS.
Figure 4. Effects of Vi polysaccharide treatment on FOXP3+CD4+ T cells at steady state.
-
A–DMice were treated for 1, 3 or 5 days with Vi polysaccharide to assess the effect on steady‐state FOXP3+CD4+ T cell counts in the spleen, lymph nodes, Peyer's patches and the lamina propria.
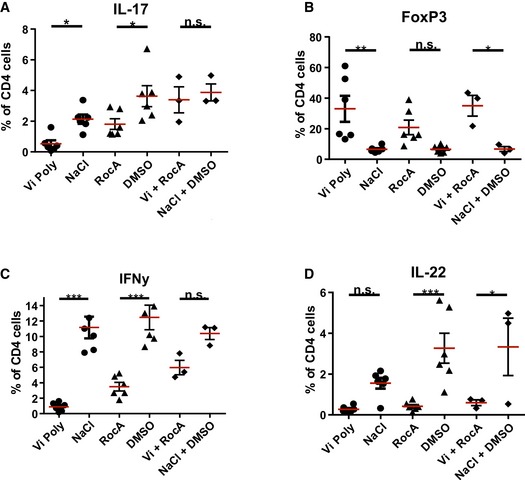
To further explore the pathological relevance of these observations in human subjects, we tested for surface expression of PHB1 in peripheral blood mononuclear cells (PBMCs) isolated from untreated patients suffering from relapsing–remitting MS. Interestingly, we detected a population of CD4+ T cells with high PHB1/2 surface expression in comparison with age‐ and sex‐matched control subjects (Fig 5A). To confirm whether the effects we detected in mice could be verified in human cells, we treated ex vivo differentiated human Th17 cultures with Vi polysaccharide or RocA. As expected, treatment led to a reduction in IL‐17, IL‐22, RORγt and IFN‐γ and an increase in FOXP3 levels (Figs 6 and EV5). Taken together, these results indeed confirm that targeting of surface‐expressed PHBs led to reduced pathogenicity of Th17 cells by regulating the activation of CRAF‐MAPK cascade in these cells.
Figure 5. Prohibitins are surface expressed in CD4+ T cells in MS patients.
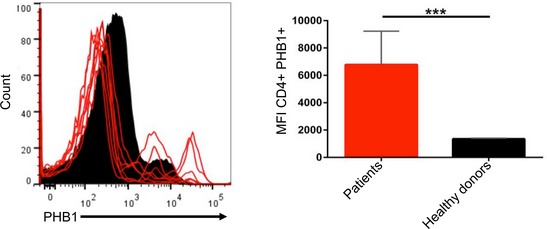
CD4+ T cells were isolated from PBMCs of six MS patients, and the surface expression of PHB1 complex was monitored by FACS analysis in comparison with age‐ and sex‐matched controls (six subjects).
Figure 6. Targeting PHBs in human Th17‐polarized cells.
-
A–DHuman CD4+ T cells isolated from the blood of healthy donors were cultured for 6 days together with CD14+ antigen‐presenting cells and treated with Vi polysaccharide, rocaglamide A or both substances combined or the corresponding solvents at the beginning of the culture. The cells were then assessed for their characteristic factors (A) IL‐17, (B) FOXP3, (C) IFN‐γ and (D) IL‐22 by FACS analysis.
Figure EV5. Inhibition of CRAF activation in human Th17 cells upon Vi polysaccharide treatment.
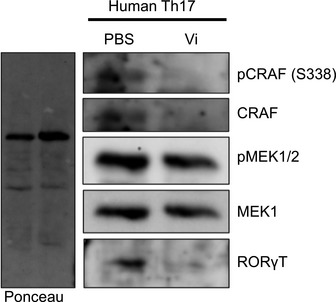
Human Th17 cell cultures treated with Vi polysaccharide (50 μg/ml) were lysed and the activation of CRAF‐MEK1/2 and the levels of total RORγt were monitored by immunoblot analysis.
Discussion
Protein kinases constitute a major component of the druggable genome; nearly 400 human diseases are either directly or indirectly linked to kinases (Melnikova & Golden, 2004). Targeted therapeutics against the deregulated members of the human kinome have garnered significant clinical success in treating patients suffering from a limited number of cancers (Hopkins & Groom, 2002). Along these lines, understanding the role of kinases in the pathophysiology of immune disorders for therapeutic exploitation is rapidly emerging. Here, we present evidence that targeting the PHB‐CRAF‐MAPK signalling axis could potentially be exploited in treating Th17‐mediated autoimmune disorders (Fig 7). Th17 cells highly express PHB1/2 complex in their cell surface, which in turn contributes to the hyperactivation of CRAF kinase.
Figure 7. Schematic representation of the proposed molecular signalling cascade controlling the expression of FOXP3 and RORγT.
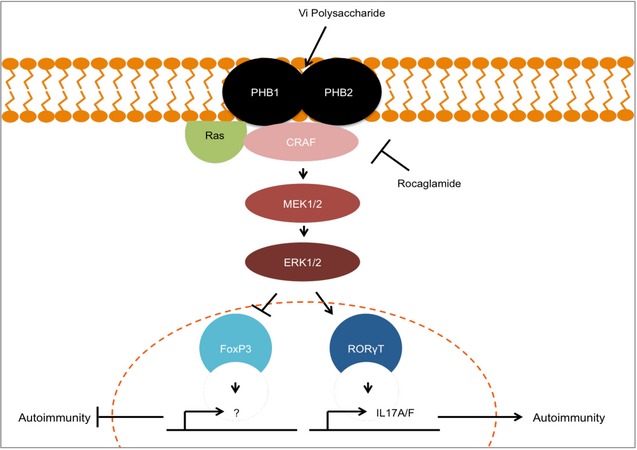
PHB1/2 complex is highly surface expressed in Th17 cells which contributed to CRAF‐MAPK activation. Activation of this pathway contributes to the fine balance between inhibition of FOXP3 or expression of RORγt. Targeting surface‐exposed PHB1/2 with Vi polysaccharide led to inhibition of CRAF activation which in turn shifts the balance towards FOXP3‐expressing Tregs and inhibits production of Th17‐associated pathogenic factors.
PHBs are localized to various subcellular compartments, and the PM‐associated fraction is highly implicated in cell signalling. In particular, interaction with PHB1 at the cell membrane is critical for the activation of the CRAF kinase that triggers the “classical” mitogenic cascade. Consistently, high expression of PHB1 at the cell surface of Th17 cells in comparison with Th1/Th2 and TREGs led to augmented CRAF‐MAPK activation. However, the exact molecular mechanisms driving the expression of PHBs in Th17 cells are currently unclear. In addition, the role of the CRAF‐MAPK signalling pathway in regulating the promoter activity of IL‐17A/F and FOXP3 needs to be investigated.
PHBs are essential proteins that contribute to mitochondrial integrity and cristae morphogenesis during development. Thus, loss of PHBs either by knockdown or knockout often led to the processing of OPA1 and mitochondrial fragmentation as shown before in various cell lines (Kasashima et al, 2006; Merkwirth et al, 2008). Our attempts to deplete or knockout PHB1 in T cells compromised the survival of the cells (KR, HY unpublished observations). Therefore, we primarily employed chemical (RocA and derivatives) and biological ligands (Vi polysaccharide) to disrupt the interaction between PHB1 and CRAF kinase specifically at the plasma membrane. Importantly, treatment with RocA and Vi polysaccharide did not lead to a decrease in the protein levels of PHB1. PHBs have been shown to underdo several post‐translational modifications including phosphorylation, glycosylation and palmitoylation; the exact modification responsible for targeting PHBs to the surface in T cells remains to be identified.
Targeting of PHBs at the plasma membrane has been demonstrated to inhibit CRAF‐MAPK activation in tumour cells as well as in T cells. Inhibition of CRAF‐MAPK pathway components with small molecule inhibitors targeting the kinase domain replicated the results obtained with the PHB ligands Vi polysaccharide or RocA. Due to high‐sequence conservation of catalytic kinase domains, it is a tremendous challenge to achieve target specificity and to minimize side effects. Our study suggests that targeting a protein–protein interface (PHB1‐CRAF interaction) specifically with a well‐tolerated FDA/WHO‐approved agent could potentially provide an avenue of inhibiting CRAF‐MAPK signalling and treating Th17‐mediated autoimmune disorders. Furthermore, PHBs are highly expressed in Th17 cells and thus specificity could also be established by biologics targeting PHBs. Whether Vi polysaccharide functions as an allosteric or orthosteric inhibitor of CRAF‐PHB complex is currently unclear and further biochemical–structural studies are clearly warranted. Ultimately, our observations reveal a key role for the PHB1/2‐CRAF signalling axis in maintaining the stability and pathogenicity of Th17 cells, which could be therapeutically modulated to fine tune the plasticity of these cells to a more regulatory phenotype, thus resolving inflammation.
Materials and Methods
Antibodies, cytokines, cells and chemicals
All antibodies, cytokines and fine chemicals including the inhibitors employed in this study are summarized in Table EV2. Biotinylated anti‐CD4, IL‐4, anti‐IL‐4, anti‐IFN‐γ, anti‐CD3 and anti‐CD28 were from TB's laboratory and were affinity purified with protein G Sepharose or antibodies from respective hybridoma cells.
HeLa cells were purchased from DSMZ and authenticated by Eurofins Genomics.
Surface biotinylation and Vi pull‐down experiments
Cells were collected and washed twice with ice‐cold PBS at 400xg for 5 min. Pellets were resuspended in 100 μg/ml sulpho‐NHS‐biotin dissolved in PBS and incubated at 4°C while rotating for 30–60 min. After incubation, cells were washed twice with 0.1 M glycine in PBS. The biotinylated cell pellet was lysed in complete RIPA buffer supplemented with 1 mM Na3VO4, 1 mM NaF, 1 mM DTT and 1 × protease inhibitor for 60 min at 4°C while rotating. For Western blots and mass spectrometry, the samples were cleared with a short centrifugation at 400 × g at 4°C for 3 min after lysis and the supernatants were incubated with agarose beads which were previously washed three times in lysis buffer. Cell lysates and the beads were incubated for 60 min at 4°C while rotating. After incubation, samples were centrifuged and pellets were washed three times with complete lysis buffer at 400 × g at 4°C for 5 min. Pellets were then frozen at −80°C for further mass spectrometry analysis or denatured in 5× Lämmli buffer for Western blotting. For Vi polysaccharide pull‐down, lysates were incubated with 10 μg of Vi polysaccharide and 5 μl of anti‐Vi polysaccharide serum and incubated overnight at 4°C while rotating. 5 μl of protein A/G magnetic beads was added, and samples were incubated for 2 h at 4°C. Beads and bound proteins were washed twice with lysis buffer and denatured in 5× Lämmli buffer for Western blotting. The biotinylated proteins bound to Vi were identified by streptavidin HRP.
Cell viability assays
For measuring the mitochondrial membrane potential and viability, cells were incubated with 100 nM TMRE for 15 min at 37°C. Cells were washed with cold PBS and subjected to FACS staining. CFSE staining was performed by washing cells twice with prewarmed RPMI + 1% HEPES and resuspending the pellet in 2.5 μM CFSE diluted in RPMI + 1% HEPES. Cells were incubated at 37°C for 10 min and washed twice in cold Iscove's modified Dulbecco's medium supplemented with 5% heat‐inactivated FCS, 1% penicillin/streptomycin, 2 mM l‐glutamine and 1 mM sodium pyruvate. Inhibitors were added and cells incubated for 72 h prior to FACS analysis. MTT Assays (Roche) and ErdU Flow Cytometry Assays (Invitrogen) were performed according to the manufacturer's instructions.
Cell isolation and purification
Spleens from mice were mechanically disrupted and filtered through a 40‐μm cell strainer. Using Gey's lysis buffer, erythrocytes were removed and viable cells were counted by trypan blue staining. The primary antibody anti‐CD4 (H129.19) was used at a concentration of 1:4 × 10⁷ cells. The secondary magnetic streptavidin beads were used at a concentration of 1:4 × 10⁶ cells. Each was incubated for 15 min, and cells were washed three times before, in between and afterwards with cold MACS buffer (PBS + 0.5% BSA + 5 mM EDTA). CD4+ T cells were isolated by positive selection with MACS separation columns (Miltenyi Biotec) according to the manufacturer's instructions. The CD4+ cell cultures with a purity > 98% (measured with FACS) were used.
In vitro differentiation and stimulation
CD4+ T cells (1 × 10⁶ cells/ml) were cultured in Iscove's modified Dulbecco's medium supplemented with 5% heat‐inactivated FCS, penicillin/streptomycin (100 U/ml), 2 mM l‐glutamine and 1 mM sodium pyruvate. Th17 polarization was achieved by addition of 20 ng/ml IL‐23, 10 ng/ml IL‐1β, 10 ng/ml IL‐6, 5 μg/ml anti‐IL‐4 and 5 μg/ml anti‐IFN‐γ. For Th2 polarization, 20 μg/ml anti‐IFN‐γ, 1,000 U/ml mIL‐4 and 100 U/ml macrophage‐derived (BMMC) IL‐6 was added to the medium. Th1 cells were polarized by adding 10 ng/ml IL‐12, 1,000 U/ml Proleukin and 10 μg/ml anti‐IL‐4. Cells were stimulated initially for 3 days with plate‐bound anti‐CD3 mAb (3 μg/ml) and anti‐CD28 (4 μg/ml). Cells were then counted and split to a density of 1 × 10⁶ cells/ml, and new medium was added. Th2 cells needed an additional supplementation on day 3 of 100 U/ml IL‐6, 200 U/ml IL‐4 and 100 U/ml Proleukin. Th1 cells needed 100 U/ml Proleukin supplement on day 3. Efficiency of T‐cell differentiation and cytokine production was analysed via FACS 5 days after cytokine addition and 4 h of 1 μM ionomycin, 20 ng/ml PMA stimulation in the presence of monensin or brefeldin A. For RNA, ELISA and immunoblot analysis, the cells were stimulated with plate‐bound anti‐CD3 (3 μg/ml) for an additional 24 h.
Active EAE experiments
All animals were raised and kept during experiments under specified pathogen‐free (SPF) conditions in individually ventilated cages. All animal experiments were approved by local authorities and conducted according to the German Animal Protection Law. Active EAE and tissue processing at the peak of the disease was performed as previously described (Siffrin et al, 2010; Hoppmann et al, 2015). Briefly, male, 8‐ to 10‐week‐old C57B6/J mice (Jackson Laboratories and Janvier) were immunized subcutaneously with 150 μg of MOG35–55 emulsified in incomplete Freund's adjuvant and Mycobacterium tuberculosis (H37 RA). Mice received 200 ng pertussis toxin (PTX) intraperitoneally (i.p.) at the time of immunization and 48 h later. The mice (minimum n = 10 per group, randomly selected) were treated i.p. with either 25 μg/mouse Vi polysaccharide or PBS as a control from d0 for 5 days, and then, the dose was reduced to 12.5 μg/mouse per day. Treatments were performed for at least 14 days unblinded. At the peak of the disease, CNS and spinal cord were extracted and the resident cells of these compartments were analysed.
Flow cytometry
Flow cytometry data were acquired on a BD LSR II or FACS Canto II flow cytometer and were analysed with BD FACSDiva software (version 6.0) or FlowJo software (version: vX.0.6). For surface staining, cells were washed and stained for 10–30 min at 4°C with antibodies to the appropriate cell surface markers (Table EV2) and Fixable Viability Dye 780. In the case of PHB surface staining, the anti‐PHB1 antibody (Genetex 1:200 dilution) was incubated for 20 min and the secondary anti‐Rabbit‐Alexa 488 (1:400 dilution) was added for another 10 min at 4°C. For intracellular staining, cells were fixed in 2% PFA for 10 min at room temperature and afterwards permeabilized using 0.1% saponin buffer, or fixed and permeabilized using the anti‐mouse/rat FOXP3 PE staining set. For analysis of cytokine production, Th17 cells were finally stimulated for 4 h with 1 μM ionomycin, 20 ng/ml PMA and monensin or brefeldin A. After stimulation, surface staining was performed as described above.
Enzyme‐linked immunosorbent assay (ELISA)
IL‐17 cytokine secretion by restimulated Th17 cells was measured by ELISA, which was performed according to the manufacturer's instructions (BD Bioscience).
mRNA isolation, cDNA synthesis and qPCR
RNA was isolated by employing either an RNA isolation kit (Roche and Thermo Scientific) following the manufacturer's instructions or TRIzol. For the TRIzol RNA extraction, the cells were washed twice with ice‐cold PBS and the pellet was resuspended in 500 μl TRIzol/1 million cells. 100 μl chloroform was added, and samples were vortexed for 15 s, incubated for 2 min at room temperature and then centrifuged at 20,817 g for 15 min at 4°C. The upper aqueous phase was transferred to a tube containing 0.5 ml isopropanol and incubated for 10 min at room temperature followed by another centrifugation step of 15 min at 20,817 g at 4°C. Isolated RNA was washed once with 75% ethanol and centrifuged at 10,621 g for 5 min at 4°C. Pellets were air‐dried and resuspended in dH2O. cDNA was synthesized with a kit as stated in the supplier's protocol (Fermentas) using random hexamer primers. For cDNA synthesis, 300 ng RNA with a 260/280 absorbance of 2.0 ± 0.2 was used.
Real‐time PCR was performed using primers listed in Table EV2. All real‐time PCRs were performed at least in triplicate on an iCycler using EvaGreen. The housekeeping gene hprt mRNA levels were used for normalization, and relative expression levels were calculated as ∆∆Ct.
Acceptor in‐growth FLIM‐FRET
HeLa cells (50,000 cells) grown in Dulbecco's modified Eagle's medium (DMEM) supplemented with 2% FBS, l‐glutamine, penicillin (100 U/ml) and streptomycin (100 μg/ml) were split to a 4‐well Lab‐Tek™ II Chambered Coverglass. After 24 h, cells were transfected with EGFP‐C‐Raf plasmid using JetPrime transfection reagent (Polyplus transfection). If cells were compound treated, Vi polysaccharide (100 μg/ml in water) was added 4 h after transfection. After 24 h of treatment, PHB‐binding CKGGRAKDC‐peptide labelled with rhodamine B (20 μM) was added to the media and cells were fixed with 4% PFA after 0, 10, 20, 30 or 60 min of incubation and mounted with Mowiol 4‐88.
FRET measurements were taken using a fluorescence lifetime imaging attachment on an inverted microscope using a 63× NA 1.4 oil objective. Samples were excited using sinusoidally modulated (40 MHz) epi‐illumination at 470 nm using a 3W, temperature stabilized multi‐LED system. For excitation, a GFP filter (BP 475/40) and beam splitter (FT 500) were used, while for emission an RFP filter (BP 605/70) was used. Using the RFP filter, emission signal coming from the FRET population and a part of the donor population is collected. Acceptor excitation was negligible. The observed lifetime was therefore a combination of the lifetimes coming from the donor and FRET population. The observed lifetime is increased because of the increased population of the excited state of the acceptor due to the FRET process. The phase and modulation lifetimes were determined using the manufacturer's software from images acquired at 12 phase settings. As a lifetime reference, fluorescein at 0.01 mM, pH 9 was used (lifetime 4.0 ns). Two biological repeats were performed and the fluorescence lifetimes were calculated from at least 86 cells per condition.
Immunocytochemistry and confocal imaging
HeLa cells were seeded at a density of 105 cells per well of a 4‐well Lab‐Tek™ II Chambered Coverglass, and after 24 h, media was changed to Ringers buffer (10 mM HEPES, 10 mM glucose, 2 mM NaH2PO4·H2O, 1 mM MgCl2·6H2O, 2 mM CaCl2, 5 mM KCl, 155 mM NaCl, pH 7.2) containing 20 μM prohibitin‐binding CKGGRAKDC‐peptide labelled with rhodamine B. Rhodamine B‐CKGGRAKDC‐peptide internalization by the cells was then followed by confocal imaging using a Zeiss LSM 780 confocal microscope (40×, NA 1.2 water immersion objective, rhodamine B excitation at 543 nm). Cells were kept at 37°C. Images were contrast corrected using the ImageJ 1.48v software.
For surface PHB staining, Th17 and Th2 cells were washed and blocked with 0.5% BSA in PBS. Cells were incubated with primary anti‐PHB1 (5 μg/ml ABGENT) or IgG control in blocking buffer for 1 h at 4°C. Secondary anti‐rabbit IgG‐Alexa 594 (5 μg/ml) was added for an additional hour at 4°C while rotating. After washing twice, cells were fixed in Roti‐HistoFix (Roth) and stained with 2 μg/ml of Hoechst for 30 min at room temperature. Samples were washed with blocking buffer, and cells were mounted with Mowiol (+DABCO) on cover slides. Cells were imaged using a Leica SP8 confocal microscope (63×, oil immersion objective, Alexa 594, excitation at 552 nm).
SDS–PAGE and Western blot
For SDS–PAGE, cells were lysed in 5× Lämmli buffer and boiled at 100°C for 5 min before loading onto polyacrylamide gels. The proteins were then transferred to nitrocellulose membranes by Western blotting. After transfer, membranes were stained with Ponceau. For immunoblot analysis, membranes were blocked with 3% BSA in PBS with 1% Triton X‐100 for 1 h at room temperature or overnight at 4°C and then incubated with various primary antibodies for 2 h at room temperature or overnight at 4°C. Antigen–antibody complexes were detected by horseradish peroxidase‐coupled secondary antibodies followed by enhanced chemiluminescence (Amersham Biosciences, Millipore, Thermo Scientific). Quantification of Western blots was performed by densitometry (ImageJ software, NIH).
Liquid chromatography–mass spectrometry (LC‐MS) and protein identification
To the proteins on beads, 50 μl 6 M urea and 100 mM ammonium bicarbonate, pH 7.8 was added. For reduction and alkylation of cysteines, 2.5 μl of 200 mM DTT in 100 mM Tris–HCl, pH 8 was added, and the samples were incubated at 37°C for 1 h followed by addition of 7.5 μl 200 mM iodoacetamide for 1 h at room temperature in the dark. The alkylation reaction was quenched by adding 10 μl 200 mM DTT at 37°C for 1 h. Subsequently, the proteins were digested with 2 μg trypsin for 16 h at 37°C. The digestion was stopped by adding 5 μl 50% formic acid; the generated peptides were purified using a ZipTip C18 and dried using a Speed Vac concentrator. The tryptic peptides were dissolved in 10 μl 0.1% formic acid/2% acetonitrile, and 5 μl of samples was analysed using an Ultimate 3000 RSLCnano‐UHPLC system connected to a Q Exactive mass spectrometer equipped with a nano‐electrospray ion source. For liquid chromatography separation, an Acclaim PepMap 100 column (C18, 3 μm beads, 100 Å, 75 μm inner diameter, 50 cm length) was used. Solvent A was 0.1% formic acid, and solvent B was 0.1% formic acid/90% acetonitrile. A flow rate of 300 nl/min was employed with a solvent gradient of 4–35% B in 47 min, to 50% B in 20 min and then to 80% B in 2 min. The mass spectrometers were operated in the data‐dependent mode to automatically switch between MS and MS/MS acquisition. Survey full scan MS spectra (from m/z 300 to 2,000) were acquired with the resolution R = 70,000 at m/z 200 (Q Exactive) after accumulation to a target of 1e6. The maximum allowed ion accumulation time was 60 ms. This method allowed sequential isolation of up to the ten (Q Exactive) most intense ions, depending on signal intensity (intensity threshold 1.7e4), for fragmentation using higher‐energy collisional induced dissociation (HCD) at a target value of 10,000 charges and a resolution R = 17,500. Target ions already selected for MS/MS were dynamically excluded for 60 s. For accurate mass measurements, the lock mass option was enabled in MS mode.
Data were acquired using Xcalibur v2.5.5 and raw files were processed to generate peak lists in Mascot generic format (*.mgf) using ProteoWizard release version 3.0.331. Database searches were performed using Mascot in‐house version 2.4.0 to search the SwissProt database (mouse, 16,761 proteins) assuming the digestion enzyme trypsin, at maximum one missed cleavage site, fragment ion mass tolerance of 0.05 Da (Q Exactive), parent ion tolerance of 10 ppm, carbamidomethylation of cysteines as fixed modification, and oxidation of methionines, and acetylation of the protein N‐terminus as variable modifications. Scaffold (version Scaffold_4.4, Proteome Software Inc., Portland, OR) was used to validate MS/MS‐based peptide and protein identification. Peptide identifications were accepted if they could be established at > 95.0% probability by the Peptide Prophet with Scaffold delta‐mass correction. Protein identifications were accepted if they could be established at > 99.0% probability as assigned by the Protein Prophet algorithm. The entire MS2 total ion current (TIC) across all biological replicates was calculated with normalization for label‐free quantification and enabled the determination of the fold changes of each protein between Th17 and Th2.
Human T cell cultures
Blood samples were collected from healthy donors [n = 7, 4 females, median age 34.5 years (range 26–51)] and recently diagnosed untreated relapsing–remitting MS patients [n = 7, 5 females, 35.3 years (23–50)] who gave their written informed consent to examinations before participating in this study, which was approved by the local ethics committee and adhered to institutional guidelines in accordance with the Declaration of Helsinki. Blood was drawn in EDTA‐coated tubes. PBMCs were isolated as described earlier (Buehler et al, 2016); CD14+ cells were isolated via MACS‐positive sort according to the manufacturer's protocol. Afterwards, CD4+CD45RO+ cells were isolated from the CD14‐depleted fraction via MACS‐negative sort following manufacturer's instructions. The antigen‐presenting CD14+ cells were then plated with a density of 600,000 cells/ml on a 6‐well culture plate in XVIVO medium supplemented with penicillin/streptomycin and L‐glutamine and incubated for 15 min at 37°C, 5% CO2. The CD4+ cells were then plated with a density of 2 × 10⁶ cells/ml in 500 μl/well and added to the CD14+ cells. Another 500 μl/well medium was prepared with the following cytokines: 10 ng/ml IL‐23, 5 μg/ml α‐IFN‐γ, 5 μg/ml α‐IL‐4, 2.5 μg/ml human αCD3 and also added to the 6‐well plate. The cells were then treated with either Vi polysaccharide (50 μg/ml) or PBS, anti‐PHB antibody, IgG control, rocaglamide A (10 ng/ml) or DMSO and cultured for 6 days (37°C, 5% CO2). The cells were supplemented after 3 days of culture with IL‐23 and the individual treatment.
After 6 days of culture, the cells were harvested, plated on a 96‐well V‐bottom plate with a density of 1 × 10⁶ cells/well and stimulated with PMA, ionomycin and brefeldin A overnight. The cells were then used for Western blot or FACS analysis.
For analysis of PHB1 on CD4+ T cells of MS patients, informed consent was obtained and the isolation of cells was performed as described earlier. All included patients suffer from recently diagnosed relapsing–remitting multiple sclerosis (RRMS) and were untreated.
Statistics
No statistical methods were used to predetermine sample sizes but our sample sizes are similar to those reported in previous publications (e.g., Paterka et al, 2016). No samples or animals were excluded from the analysis. Data are presented as mean ± standard error of the mean (SEM). EAE course statistics were performed using multiple t‐tests, and workup results were tested using Mann–Whitney U‐test. Analysis of variance (ANOVA) complemented by Tukey's honest significant difference test (Tukey's HSD) performed in the software R (version 2.15.2) or GraphPad Prism software (version 6) was used to determine the statistical differences. For fold‐change analysis, Bayesian statistics were used. Statistical significance levels are annotated as NS = not significant P > 0.05, *P < 0.05, **P < 0.01, ***P < 0.001.
Data availability
The data that support the findings of this study are available from the corresponding authors upon request.
Author contributions
UB contributed to in vivo and in vitro animal experiments, performed ex vivo human cultures, analysed/interpreted data and prepared figures. KS performed cellular and biochemical assays and contributed to the analysis, interpretation of data and preparation of figures. HY established the surface biotinylation procedure, identified proteins bound to Vi and performed supporting experiments. MS and DA performed FLIM‐FRET experiments. BT contributed to mass spectrometry analysis and ST performed bioinformatic analysis. AU and TB assisted with Th17 cultures and contributed to the analysis. KR and FZ contributed to the conception and design, analysed/interpreted data and cosupervised the study. KR, KS, UB and FZ wrote the manuscript with input from all authors.
Conflict of interest
The authors declare that they have no conflict of interest.
Supporting information
Expanded View Figures PDF
Table EV1
Table EV2
Source Data for Expanded View
Review Process File
Source Data for Figure 1
Source Data for Figure 2
Source Data for Figure 3
Acknowledgements
The authors are thankful to the voluntary donors and patients who have generously donated their blood for various experiments described in this study. We are thankful to Sanofi–Pasteur for their generous support with Vi polysaccharide and anti‐Vi serum. We thank Kristian Schuetze for FACS sorting, Beatrice Wasser for help with analysing PHB1 in brain‐derived CD4+ T cells and Dr. Cheryl Ernest for proofreading the manuscript. KR and FZ acknowledge support from the German Research Foundation (DFG) CRC‐TR128. KR is supported through a Heisenberg professorship of the DFG (RA1739/4‐1). KR is a BIS–PLUS3 fellow and a GFK fellow.
The EMBO Journal (2018) 37: e99429
Contributor Information
Frauke Zipp, Email: frauke.zipp@unimedizin-mainz.de.
Krishnaraj Rajalingam, Email: krishna@uni-mainz.de.
References
- Bettelli E, Carrier Y, Gao W, Korn T, Strom TB, Oukka M, Weiner HL, Kuchroo VK (2006) Reciprocal developmental pathways for the generation of pathogenic effector TH17 and regulatory T cells. Nature 441: 235–238 [DOI] [PubMed] [Google Scholar]
- Browman DT, Hoegg MB, Robbins SM (2007) The SPFH domain‐containing proteins: more than lipid raft markers. Trends Cell Biol 17: 394–402 [DOI] [PubMed] [Google Scholar]
- Buehler U, Fleischer V, Luessi F, Rezk A, Belikan P, Graetz C, Gollan R, Wolf C, Lutz J, Bar‐Or A, Siffrin V, Zipp F (2016) Role of IL‐17‐producing lymphocytes in severity of multiple sclerosis upon natalizumab treatment. Mult Scler 23: 567–576 [DOI] [PubMed] [Google Scholar]
- Chiu CF, Ho MY, Peng JM, Hung SW, Lee WH, Liang CM, Liang SM (2013) Raf activation by Ras and promotion of cellular metastasis require phosphorylation of prohibitin in the raft domain of the plasma membrane. Oncogene 32: 777–787 [DOI] [PubMed] [Google Scholar]
- Ciofani M, Madar A, Galan C, Sellars M, Mace K, Pauli F, Agarwal A, Huang W, Parkhurst CN, Muratet M, Newberry KM, Meadows S, Greenfield A, Yang Y, Jain P, Kirigin FK, Birchmeier C, Wagner EF, Murphy KM, Myers RM et al (2012) A validated regulatory network for Th17 cell specification. Cell 151: 289–303 [DOI] [PMC free article] [PubMed] [Google Scholar]
- Gaffen SL, Jain R, Garg AV, Cua DJ (2014) The IL‐23‐IL‐17 immune axis: from mechanisms to therapeutic testing. Nat Rev Immunol 14: 585–600 [DOI] [PMC free article] [PubMed] [Google Scholar]
- Gaublomme JT, Yosef N, Lee Y, Gertner RS, Yang LV, Wu C, Pandolfi PP, Mak T, Satija R, Shalek AK, Kuchroo VK, Park H, Regev A (2015) Single‐cell genomics unveils critical regulators of Th17 cell pathogenicity. Cell 163: 1400–1412 [DOI] [PMC free article] [PubMed] [Google Scholar]
- Harpur AG, Wouters FS, Bastiaens PI (2001) Imaging FRET between spectrally similar GFP molecules in single cells. Nat Biotechnol 19: 167–169 [DOI] [PubMed] [Google Scholar]
- Harrington LE, Hatton RD, Mangan PR, Turner H, Murphy TL, Murphy KM, Weaver CT (2005) Interleukin 17‐producing CD4+ effector T cells develop via a lineage distinct from the T helper type 1 and 2 lineages. Nat Immunol 6: 1123–1132 [DOI] [PubMed] [Google Scholar]
- Hopkins AL, Groom CR (2002) The druggable genome. Nat Rev Drug Discov 1: 727–730 [DOI] [PubMed] [Google Scholar]
- Hoppmann N, Graetz C, Paterka M, Poisa‐Beiro L, Larochelle C, Hasan M, Lill CM, Zipp F, Siffrin V (2015) New candidates for CD4 T cell pathogenicity in experimental neuroinflammation and multiple sclerosis. Brain 138: 902–917 [DOI] [PubMed] [Google Scholar]
- Iwasaki S, Floor SN, Ingolia NT (2016) Rocaglates convert DEAD‐box protein eIF4A into a sequence‐selective translational repressor. Nature 534: 558–561 [DOI] [PMC free article] [PubMed] [Google Scholar]
- Kasashima K, Ohta E, Kagawa Y, Endo H (2006) Mitochondrial functions and estrogen receptor‐dependent nuclear translocation of pleiotropic human prohibitin 2. J Biol Chem 281: 36401–36410 [DOI] [PubMed] [Google Scholar]
- Kim DK, Kim HS, Kim AR, Jang GH, Kim HW, Park YH, Kim B, Park YM, Beaven MA, Kim YM, Choi WS (2013) The scaffold protein prohibitin is required for antigen‐stimulated signaling in mast cells. Sci Signal 6: ra80 [DOI] [PubMed] [Google Scholar]
- Kolonin MG, Saha PK, Chan L, Pasqualini R, Arap W (2004) Reversal of obesity by targeted ablation of adipose tissue. Nat Med 10: 625–632 [DOI] [PubMed] [Google Scholar]
- Langrish CL, Chen Y, Blumenschein WM, Mattson J, Basham B, Sedgwick JD, McClanahan T, Kastelein RA, Cua DJ (2005) IL‐23 drives a pathogenic T cell population that induces autoimmune inflammation. J Exp Med 201: 233–240 [DOI] [PMC free article] [PubMed] [Google Scholar]
- Luchtman DW, Ellwardt E, Larochelle C, Zipp F (2014) IL‐17 and related cytokines involved in the pathology and immunotherapy of multiple sclerosis: current and future developments. Cytokine Growth Factor Rev 25: 403–413 [DOI] [PubMed] [Google Scholar]
- Mangan PR, Harrington LE, O'Quinn DB, Helms WS, Bullard DC, Elson CO, Hatton RD, Wahl SM, Schoeb TR, Weaver CT (2006) Transforming growth factor‐beta induces development of the T(H)17 lineage. Nature 441: 231–234 [DOI] [PubMed] [Google Scholar]
- Matallanas D, Birtwistle M, Romano D, Zebisch A, Rauch J, von Kriegsheim A, Kolch W (2011) Raf family kinases: old dogs have learned new tricks. Genes Cancer 2: 232–260 [DOI] [PMC free article] [PubMed] [Google Scholar]
- Melnikova I, Golden J (2004) Targeting protein kinases. Nat Rev Drug Discov 3: 993–994 [DOI] [PubMed] [Google Scholar]
- Merkwirth C, Dargazanli S, Tatsuta T, Geimer S, Lower B, Wunderlich FT, von Kleist‐Retzow JC, Waisman A, Westermann B, Langer T (2008) Prohibitins control cell proliferation and apoptosis by regulating OPA1‐dependent cristae morphogenesis in mitochondria. Genes Dev 22: 476–488 [DOI] [PMC free article] [PubMed] [Google Scholar]
- Merkwirth C, Langer T (2009) Prohibitin function within mitochondria: essential roles for cell proliferation and cristae morphogenesis. Biochim Biophys Acta 1793: 27–32 [DOI] [PubMed] [Google Scholar]
- Mishra S, Ande SR, Nyomba BL (2010) The role of prohibitin in cell signaling. FEBS J 277: 3937–3946 [DOI] [PubMed] [Google Scholar]
- Patel N, Chatterjee SK, Vrbanac V, Chung I, Mu CJ, Olsen RR, Waghorne C, Zetter BR (2010) Rescue of paclitaxel sensitivity by repression of prohibitin 1 in drug‐resistant cancer cells. Proc Natl Acad Sci USA 107: 2503–2508 [DOI] [PMC free article] [PubMed] [Google Scholar]
- Patel DD, Kuchroo VK (2015) Th17 cell pathway in human immunity: lessons from genetics and therapeutic interventions. Immunity 43: 1040–1051 [DOI] [PubMed] [Google Scholar]
- Paterka M, Siffrin V, Voss JO, Werr J, Hoppmann N, Gollan R, Belikan P, Bruttger J, Birkenstock J, Jung S, Esplugues E, Yogev N, Flavell RA, Bopp T, Zipp F (2016) Gatekeeper role of brain antigen‐presenting CD11c+ cells in neuroinflammation. EMBO J 35: 89–101 [DOI] [PMC free article] [PubMed] [Google Scholar]
- Polier G, Neumann J, Thuaud F, Ribeiro N, Gelhaus C, Schmidt H, Giaisi M, Kohler R, Muller WW, Proksch P, Leippe M, Janssen O, Desaubry L, Krammer PH, Li‐Weber M (2012) The natural anticancer compounds rocaglamides inhibit the Raf‐MEK‐ERK pathway by targeting prohibitin 1 and 2. Chem Biol 19: 1093–1104 [DOI] [PubMed] [Google Scholar]
- Rajalingam K, Wunder C, Brinkmann V, Churin Y, Hekman M, Sievers C, Rapp UR, Rudel T (2005) Prohibitin is required for Ras‐induced Raf‐MEK‐ERK activation and epithelial cell migration. Nat Cell Biol 7: 837–843 [DOI] [PubMed] [Google Scholar]
- Sharma A, Qadri A (2004) Vi polysaccharide of Salmonella typhi targets the prohibitin family of molecules in intestinal epithelial cells and suppresses early inflammatory responses. Proc Natl Acad Sci USA 101: 17492–17497 [DOI] [PMC free article] [PubMed] [Google Scholar]
- Siffrin V, Radbruch H, Glumm R, Niesner R, Paterka M, Herz J, Leuenberger T, Lehmann SM, Luenstedt S, Rinnenthal JL, Laube G, Luche H, Lehnardt S, Fehling HJ, Griesbeck O, Zipp F (2010) In vivo imaging of partially reversible th17 cell‐induced neuronal dysfunction in the course of encephalomyelitis. Immunity 33: 424–436 [DOI] [PubMed] [Google Scholar]
- Singh RP, Hasan S, Sharma S, Nagra S, Yamaguchi DT, Wong DT, Hahn BH, Hossain A (2014) Th17 cells in inflammation and autoimmunity. Autoimmun Rev 13: 1174–1181 [DOI] [PubMed] [Google Scholar]
- Veldhoen M, Hocking RJ, Atkins CJ, Locksley RM, Stockinger B (2006) TGFbeta in the context of an inflammatory cytokine milieu supports de novo differentiation of IL‐17‐producing T cells. Immunity 24: 179–189 [DOI] [PubMed] [Google Scholar]
- van Vollenhoven RF (2013) Small molecular compounds in development for rheumatoid arthritis. Curr Opin Rheumatol 25: 391–397 [DOI] [PubMed] [Google Scholar]
- Waisman A (2012) To be 17 again–anti‐interleukin‐17 treatment for psoriasis. N Engl J Med 366: 1251–1252 [DOI] [PubMed] [Google Scholar]
- Yang XO, Panopoulos AD, Nurieva R, Chang SH, Wang D, Watowich SS, Dong C (2007) STAT3 regulates cytokine‐mediated generation of inflammatory helper T cells. J Biol Chem 282: 9358–9363 [DOI] [PubMed] [Google Scholar]
- Yang XO, Pappu BP, Nurieva R, Akimzhanov A, Kang HS, Chung Y, Ma L, Shah B, Panopoulos AD, Schluns KS, Watowich SS, Tian Q, Jetten AM, Dong C (2008) T helper 17 lineage differentiation is programmed by orphan nuclear receptors ROR alpha and ROR gamma. Immunity 28: 29–39 [DOI] [PMC free article] [PubMed] [Google Scholar]
- Yang J, Sundrud MS, Skepner J, Yamagata T (2014) Targeting Th17 cells in autoimmune diseases. Trends Pharmacol Sci 35: 493–500 [DOI] [PubMed] [Google Scholar]
- Yurugi H, Tanida S, Akita K, Ishida A, Toda M, Nakada H (2013) Prohibitins function as endogenous ligands for Siglec‐9 and negatively regulate TCR signaling upon ligation. Biochem Biophys Res Commun 434: 376–381 [DOI] [PubMed] [Google Scholar]
Associated Data
This section collects any data citations, data availability statements, or supplementary materials included in this article.
Supplementary Materials
Expanded View Figures PDF
Table EV1
Table EV2
Source Data for Expanded View
Review Process File
Source Data for Figure 1
Source Data for Figure 2
Source Data for Figure 3
Data Availability Statement
The data that support the findings of this study are available from the corresponding authors upon request.


