Abstract
Biological membranes organize their proteins and lipids into nano‐ and microscale patterns. In the yeast plasma membrane (PM), constituents segregate into a large number of distinct domains. However, whether and how this intricate patchwork contributes to biological functions at the PM is still poorly understood. Here, we reveal an elaborate interplay between PM compartmentalization, physiological function, and endocytic turnover. Using the methionine permease Mup1 as model system, we demonstrate that this transporter segregates into PM clusters. Clustering requires sphingolipids, the tetraspanner protein Nce102, and signaling through TORC2. Importantly, we show that during substrate transport, a simple conformational change in Mup1 mediates rapid relocation into a unique disperse network at the PM. Clustered Mup1 is protected from turnover, whereas relocated Mup1 actively recruits the endocytic machinery thereby initiating its own turnover. Our findings suggest that lateral compartmentalization provides an important regulatory link between function and turnover of PM proteins.
Keywords: amino acid permease, endocytosis, lateral membrane segregation, patchwork membrane, plasma membrane
Subject Categories: Membrane & Intracellular Transport; Post-translational Modifications, Proteolysis & Proteomics
Introduction
The plasma membrane (PM) is an essential barrier, which protects cells from the external environment, orchestrates the exchange of nutrients and metabolites, and serves as a regulatory hub for signaling processes. Lateral segregation of protein and lipid constituents into distinct nano‐ or microdomains has frequently been observed, and many different models have been proposed to explain the mechanisms for heterogeneous distribution of lipids and proteins within cellular membranes. Prominent examples include the picket‐fence model (Kusumi et al, 2012), the lipid‐raft hypothesis (Simons & Sampaio, 2011), and hydrophobic mismatch (Jensen & Mouritsen, 2004). However, the extent to which lateral segregation depends on and contributes to specific biological functions at the PM is not clear.
A systematic study of integral membrane proteins in the budding yeast Saccharomyces cerevisiae has demonstrated segregation of the yeast PM into a patchwork of many coexisting domains (Spira et al, 2012). The observed patterns were proposed to arise through weak protein–lipid interactions (Mueller et al, 2012). In addition, several distinct PM domains have been previously defined. The stable “membrane compartment occupied by (the arginine permease) Can1” (MCC; Malinska et al, 2003) is associated with so‐called eisosomes—short furrow‐like invaginations that are stabilized by BAR‐domain proteins (Walther et al, 2006). The MCC and eisosomes have been proposed to play a role in membrane organization, cell‐wall morphogenesis, and sphingolipid homeostasis (Douglas & Konopka, 2014). Several tetraspanner proteins such as Sur7 and Nce102, and amino acid transporters including Can1, are recruited to the MCC, where they are thought to be protected from endocytosis (Grossmann et al, 2008). The network‐like membrane compartment occupied by Pma1 (MCP), on the other hand, is enriched in the H+‐ATPase Pma1, which is essential for pH homeostasis and maintenance of the PM potential. Additional domains have been proposed that contain the sterol transporters Lct3/4 (Murley et al, 2017), the sensor of cell‐wall integrity Wsc1 (Kock et al, 2016) or the target of rapamycin kinase complex 2 (TORC2; Berchtold & Walther, 2009). TORC2 has a wide range of targets and regulates actin polymerization, endocytosis, and sphingolipid synthesis (Gaubitz et al, 2016).
Yeast cells are constantly exposed to fluctuating nutrient levels and environmental stimuli. A large set of cell‐surface receptors and nutrient transporters inserted in the PM must therefore be dynamically modulated. Endocytic downregulation of selected proteins is frequently initiated by ubiquitination of cytosolic lysines via the E3 ubiquitin ligase Rsp5 (Lauwers et al, 2010), followed by actin‐dependent internalization and degradation within lysosomes (Piper et al, 2014). To recognize its targets, Rsp5 requires arrestin‐related trafficking adaptors, including Art1 (Nikko & Pelham, 2009). Mup1 is a high‐affinity, methionine (Met)‐specific permease that is ubiquitinated and endocytosed via the Art1/Rsp5 complex in response to substrate excess (Lin et al, 2008). More specifically, Met transport by Mup1 has been proposed to induce a conformational change that exposes an N‐terminal binding site for Art1 (Ghaddar et al, 2014b; Guiney et al, 2016). However, while necessary for ubiquitination, this binding site is not sufficient for Art1 recruitment, implying that an additional Art1 interaction site is present in a separate region of Mup1 (Guiney et al, 2016). While ubiquitin‐based turnover of plasma membrane proteins is a widespread and well‐studied process, it is not clear whether and how lateral segregation impacts on endocytic recycling.
In this study, we investigated the functional and mechanistic links between PM compartmentalization and membrane protein turnover. Using Mup1 as a model, we show that catalytic activity, ubiquitination, and endocytosis of the permease occur within distinct lateral PM domains. In the absence of its substrate, Mup1 localizes to distinct clusters at the PM. This clustering depends on a combination of sphingolipids, the tetraspanner Nce102, and TORC2 signaling. Upon Met addition, a conformational switch induces rapid relocalization of Mup1 from the clusters into a disperse network that can be clearly distinguished from other established PM domains. Lateral relocation is accompanied by ubiquitination and endocytic internalization. Importantly, we find that PM clusters provide an environment that protects Mup1 from internalization, while upon relocation, Mup1 actively recruits and redirects the endocytic machinery.
Results
Turnover and PM segregation of the methionine permease Mup1
To investigate a possible connection between PM compartmentalization and protein turnover, we selected the tightly regulated high‐affinity methionine permease Mup1 as a model. Upon Met depletion, Mup1 expression was rapidly induced (Fig 1A). The protein then remained upregulated for several hours but increasingly appeared in internal organelles at later time points (Fig 1A). To ensure maximal sensitivity for PM localization experiments, we performed all subsequent experiments after 2.5 h of growth in Met‐free medium. At this point, Mup1 is one of the most abundant proteins at the PM (Fig 1B). Substrate addition has been shown to induce ubiquitination of Mup1 near its N terminus, mediated by the arrestin Art1 and the E3 ligase Rsp5 (Lin et al, 2008). Accordingly, we found that, under our culture conditions, addition of Met induced rapid ubiquitination and degradation of the permease (Fig 1C). Ubiquitination was followed by endocytosis with dose‐dependent kinetics. Maximal rates of internalization were observed at Met concentrations exceeding 100 μM (Fig 1D). Deletion of ART1, truncation of the Mup1 N terminus (Δ1–52aa = ΔN), or mutation of the ubiquitinated lysine residues (Guiney et al, 2016; K27 and K28, designated 2KR from now on) inhibited Mup1 ubiquitination (Fig 1E) and completely blocked internalization (Fig 1F).
Figure 1. Mup1 is a tightly regulated transporter, which lends itself to the study of the link between PM compartmentalization and protein turnover.
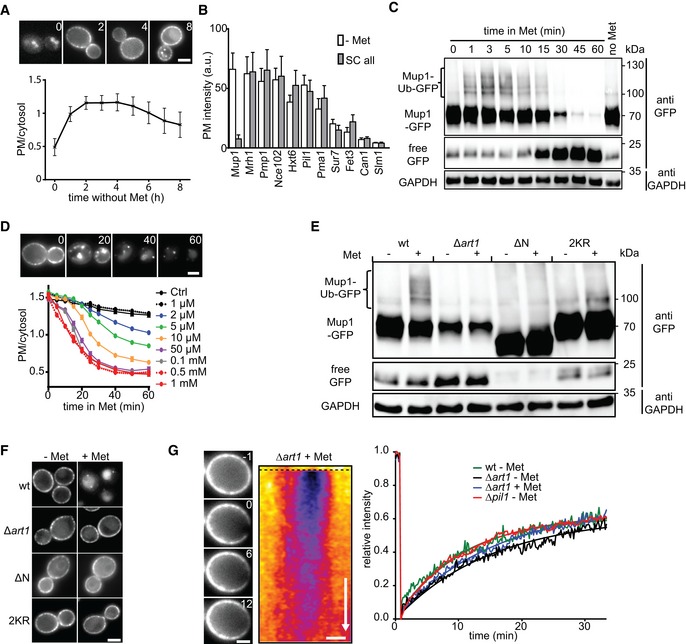
- Expression and localization of Mup1‐GFP to the PM upon Met starvation (timestamps in hours). Values are means ± SD, n > 60 cells.
- PM expression of various GFP‐fusion proteins in cells grown on complete and Met‐deficient media. Values are means ± SD, n = 20–300 cells.
- Western blot showing Mup1 ubiquitination (Ub) and degradation at different time points after addition of Met. Loading control: glyceraldehyde‐3‐phosphate dehydrogenase (GAPDH).
- Effect of different Met concentrations on Mup1 internalization kinetics. Values are means ± SEM, n > 50 cells (timestamps in min).
- Western blot showing Mup1 ubiquitination (Ub) of the indicated mutants 5 min after Met addition. Loading control as in (C).
- Mup1 endocytosis of the mutants used in (E).
- FRAP analysis of Mup1‐GFP. Timestamps in min relative to bleaching event. The kymograph was drawn around the cell periphery and shows fluorescence recovery in the bleached area. Recovery curves represent averaged values from n = 3–5 cells. Smooth lines indicate exponential fits. Time arrow: 10 min.
We had previously reported that integral PM proteins in yeast exhibit rates of lateral mobility that are several orders of magnitude slower than those found in mammalian cells (Spira et al, 2012) and this was recently confirmed by single molecule tracking experiments (Bianchi et al, 2018). To determine whether Mup1 also followed this pattern, we performed fluorescence recovery after photobleaching (FRAP) experiments either in the absence or in the presence of Met. In agreement with our earlier observations, fluorescent Mup1 diffused into the bleached area of the PM only very slowly, with a t 1/2 of 5–10 min (Fig 1G). Mobility was not affected by ubiquitination, as the kinetics of FRAP recovery were not altered by deletion of ART1 (Fig 1G). Importantly, slow recovery of Mup1 at the PM was partially dependent on the actin cytoskeleton (Fig EV1A), indicating a significant contribution of membrane turnover. The combination of rapid but tightly controlled induction and endocytic removal, together with its low lateral mobility, makes Mup1 an ideal test protein with which to study the link between lateral PM compartmentalization and membrane turnover.
Figure EV1. FRAP analysis and TIRFM image processing pipeline.
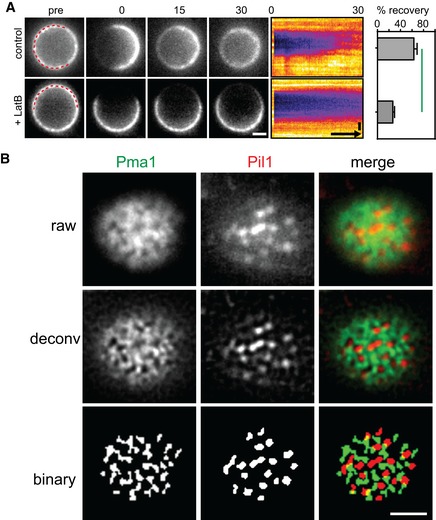
- FRAP analysis of Mup1‐GFP in the presence and absence of 100 μM LatB. Times are given in min relative to localized bleaching of fluorescence. The kymograph was drawn around the indicated cell periphery (red dashed lines) and shows fluorescence recovery in the bleached area. Mup1‐GFP fluorescence recovery was determined in the bleached area at t = 30 min. Time arrow represents 10 min. Values are means ± SD, n = 10 cells. The green line indicates significantly different data sets. An overview of the performed statistics can be found in Table EV3.
- Representative raw, deconvolved (deconv), and thresholded (binary) TIRFM images generated by an automated MATLAB algorithm to determine the degree of colocalization of GFP and RFP signals (Pearson Mean) and to quantify the fraction of the GFP signal present in the RFP‐labeled structure (GFP overlap).
We next analyzed the lateral organization of Mup1‐GFP within the PM. Equatorial images already revealed that, in the absence of Met, much of the Mup1‐GFP signal at the PM was restricted to defined clusters that strongly colocalized with eisosomes marked by Pil1‐RFP (Fig 2A). Profiles across the PM indicated that Mup1 was localized further away from the cell center than Pil1. This localization is even better seen by super‐resolution microscopy (Bianchi et al, 2018) and is typical for proteins of the MCC, which likely do not enter the furrows formed by eisosomes (Douglas & Konopka, 2014). By combining total internal reflection fluorescence microscopy (TIRFM) and 2D deconvolution, we confirmed the localization of Mup1 to the MCC, but also found weaker staining in a network‐like distribution connecting the patches (see asterisk in the lower plot of Fig 2A). The Network factor, which is equivalent to the variance of the intensity distribution in our deconvolved TIRFM images, confirms the mixed localization pattern for Mup1. Markers that strongly cluster in PM patches such as Sur7 exhibit a low Network factor, whereas proteins distributed in network‐like patterns such as Pma1 show higher values. For Mup1, an intermediate value was obtained (Fig 2B). As expected for an MCC marker, Mup1 completely lost its clustered distribution upon deletion of PIL1 (Fig 2B), while its lateral mobility was essentially unchanged (Fig 1G). Interestingly, when Met was added to the medium, Mup1 moved out of the MCC patches and its pattern became more diffuse (Fig 2C and D). Using an automated algorithm to analyze colocalization in thresholded TIRFM images (Fig EV1B), we confirmed Mup1 exit from the MCC upon substrate addition, illustrated by the decreasing colocalization with Pil1 (Fig 2E). Due to strong signal from endosomes labeled with internalized Mup1, it was difficult to accurately follow the pattern of Mup1 localization for more than 15 min after Met addition (Fig 2D). We therefore performed more detailed quantitative analyses using the internalization mutants mentioned above (Δart1 background, ΔN and 2KR, Fig 1F). In all three mutants, Mup1‐GFP exhibited a clustered distribution under Met starvation, but became much more uniformly distributed after substrate addition (Fig 2F). Importantly, in all three internalization mutants, this relocation was completely reversible upon washout of Met (Fig 2G). Our results thus show that, in the absence of its substrate, Mup1 is clustered in the MCC domain. This localization is independent of ubiquitination (Δart1, 2KR) or other N‐terminal signals (ΔN). Upon addition of Met, Mup1 rapidly relocates into a network‐like domain, becomes ubiquitinated, and is subsequently internalized.
Figure 2. Lateral segregation of Mup1 in the yeast PM .
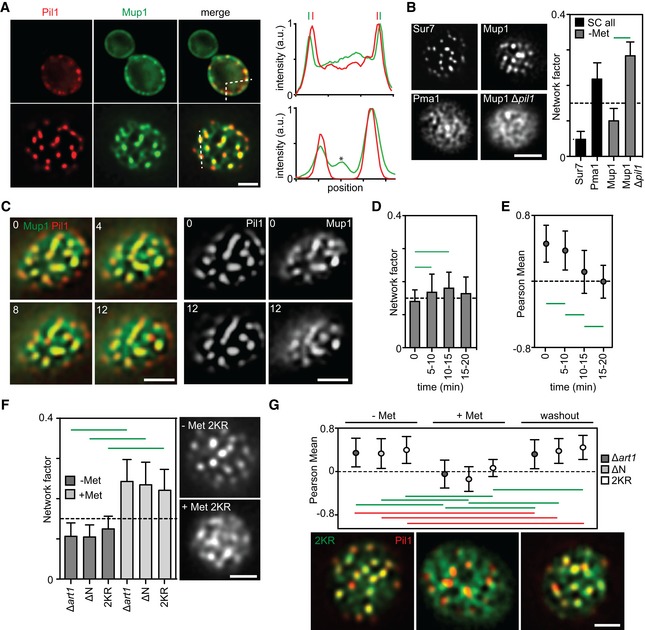
- Equatorial and TIRFM images showing Mup1 clustering in the MCC in the absence of its substrate. Intensity profiles correspond to the dotted lines within the merge images and show Mup1 also partitioning outside the Pil1 signal (above), with additional density mapping to a network‐like domain (bottom, asterisk).
- Mup1‐GFP intensity distribution (Network factor) indicating network (above dotted line) and patchy (below dotted line) patterns. Sur7 and Pma1 serve as references for patchy and network‐like distributions, respectively. Representative TIRFM images of the different patterns are shown.
- Left, two‐color representative TIRF images illustrating Mup1‐GFP exit from the MCC labeled by Pil1‐RFP upon addition of Met. Right, single channel images at the earliest and the latest time points for better visualization (timestamps in min).
- Mup1‐GFP distribution upon substrate addition shown by the Network factor.
- Mup1‐GFP colocalization with Pil1‐RFP after substrate addition for indicated times.
- Mup1‐GFP distribution upon substrate addition in the indicated mutants. Representative TIRFM images for the Mup1‐2KR mutant are shown.
- Substrate‐dependent and reversible Mup1 relocation shown by quantification of its colocalization with Pil1‐RFP in the indicated mutants. Representative two‐color TIRFM images are shown for the Mup1‐2KR mutant.
Cellular regulation of Mup1 clustering
To identify cellular factors that control Mup1 clustering at the PM, we investigated known regulators of MCC and eisosome integrity. Sphingolipid homeostasis has been shown to influence stability and composition of eisosomes (Aguilar et al, 2010; Frohlich et al, 2014; Olson et al, 2016). In particular, Slm1 is an eisosome‐resident protein that has been shown to dissociate from eisosomes and regulate TORC2 signaling upon inhibition of sphingolipid (SL) synthesis (Berchtold et al, 2012). To test whether SLs also play a role in clustering of Mup1, we treated cells either with myriocin (Myr) that completely blocks SL synthesis or with aureobasidin A (AbA), which specifically inhibits synthesis of complex SLs (Fig EV2A). As expected, Slm1 moved out of MCC patches upon addition of either drug (Fig 3A and B). In the absence of Met, Slm1 was still able to relocate upon SL stress, albeit to a lesser degree (Fig 3A and B). Strikingly, treatment with either Myr or AbA led to pronounced relocation of Mup1 (Fig 3A and B). The effect of Myr on Slm1 and Mup1 relocation could be reversed by subsequent addition of the sphingolipid intermediate phytosphingosine (Fig EV2A, PHS), consistent with a specific role of sphingolipids in Mup1 clustering within the MCC domain. The effect of AbA could not be rescued as phytosphingosine acts upstream of this drug (Fig EV2A). These results are consistent with very similar recent findings for the arginine permease Can1 (Gournas et al, 2018).
Figure EV2. Cellular regulation of Mup1 patterning.
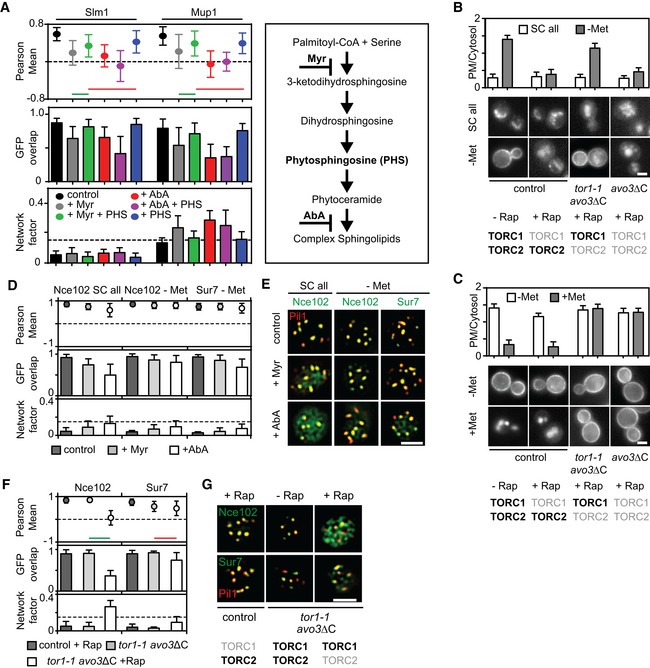
-
AMyriocin—but not aureobasidin A—induced Slm1 and Mup1 MCC exit is reversed upon treatment with phytosphingosine (PHS). Pil1‐RFP was used to determine the degree of concentration within the MCC.
-
B, CRequirements of TORC1 and TORC2 for the delivery of Mup1‐GFP to the PM upon methionine starvation (B) and for Mup1 endocytosis upon addition of methionine (C). In control cells, only TORC1 is rapamycin (Rap) sensitive, in the avo3ΔC mutant, both TORC1 and TORC2 are sensitive to rapamycin, and in the tor1‐1/avo3ΔC mutant, only TORC2 is rapamycin‐sensitive. Representative equatorial images are shown.
-
DInfluence of sphingolipid stress on the lateral segregation of the tetraspanners Nce102 and Sur7 under Met starvation. Pil1‐RFP was used to determine the degree of concentration within the MCC.
-
ERepresentative two‐color TIRFM images from the experiments summarized in (D).
-
FNce102 leaves the MCC upon TORC2 inhibition.
-
GRepresentative two‐color TIRFM images from the experiments summarized in (F).
Figure 3. Cellular regulation of Mup1 PM clustering.
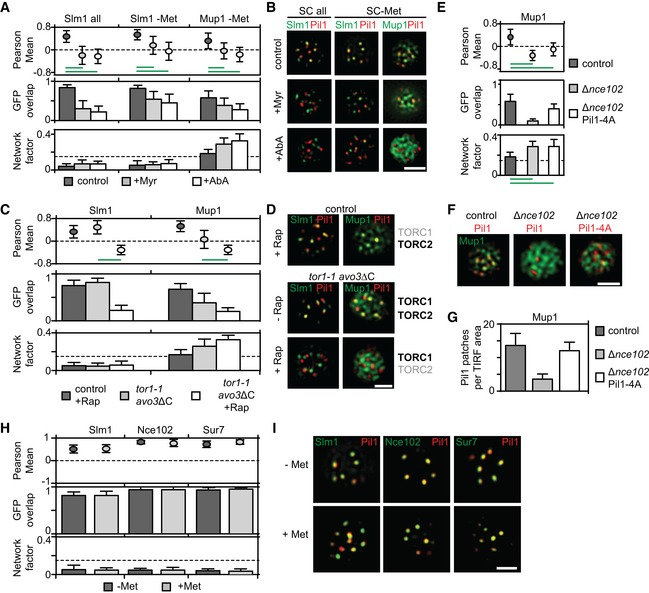
- Effect of sphingolipid stress on relocation of Slm1 and on Mup1 clustering in the absence of Met. Colocalization with Pil1‐RFP (Pearson Mean), GFP overlap (fraction of the GFP signal found within the structure marked by Pil1‐RFP), and Network factor are given. Myriocin (Myr) blocks the first step in sphingolipid synthesis, while aureobasidin A (AbA) blocks the formation of complex sphingolipids.
- Representative two‐color TIRFM images from the experiments summarized in (A).
- Degrees of Mup1 clustering in the MCC in the indicated strains and upon TORC1/2 inhibition with rapamycin (Rap). The tor1‐1 mutant makes TORC1 rapamycin‐insensitive, while the avo3ΔC mutant renders TORC2 rapamycin‐sensitive.
- Representative two‐color TIRFM images from the experiments summarized in (C). Light gray labels indicate inactive TOR complexes; bold labels indicate active TOR complexes.
- Nce102 is required for Mup1 clustering into the MCC.
- Representative two‐color TIRFM images of the Nce102‐dependent clustering of Mup1‐GFP in the PM from the experiments summarized in (E).
- Nce102‐dependent eisosome stability shown as number of Pil1‐RFP or Pil1‐4A‐RFP patches per area.
- Lateral segregation of Slm1, Nce102, and Sur7 before and after Met addition.
- Representative two‐color TIRFM images from the experiments summarized in (H).
Slm1 has been previously implicated in the regulation of TORC2 (Berchtold et al, 2012). We therefore next wanted to test, whether TORC signaling can regulate Mup1 clustering. We generated strains in which either TORC1, TORC2, or both could be inhibited by the addition of the drug rapamycin (Gaubitz et al, 2015). As expected from its reported role in protein synthesis and sorting (Loewith & Hall, 2011), TORC1 but not TORC2 was found to be required for delivery of Mup1 to the PM (Fig EV2B). Conversely, and in agreement with the reported function of TORC2 in actin organization and endocytosis (Rispal et al, 2015), inhibition of TORC2, but not TORC1, blocked internalization of Mup1 (Fig EV2C). We found that similar to a block in SL synthesis, inhibition of TORC2 led to the release of Slm1 from the MCC within 30 min (Fig 3C and D). Importantly, Mup1 also dissociated from the MCC upon inhibition of TORC2, but not of TORC1 (Fig 3C and D). Reduced Mup1 clustering already became apparent when simply removing the C terminus of the TORC2 subunit Avo3 (to render the complex sensitive to rapamycin, Fig 3C), indicating that this mutation partly affects TORC2 function and MCC integrity. In summary, our results show that both sphingolipids and TORC2 signaling regulate clustering of Mup1 in the MCC.
While TORC2 inhibition induced full Mup1 relocation within 15–30 min, Myr and AbA treatment had to be maintained for more than 1 h to achieve comparable results. We therefore wanted to verify whether TORC2 could also regulate Mup1 segregation through additional factors and tested the localization of other MCC components in our conditions. The tetraspanner protein Nce102 has been shown to support the segregation of several transporters into the MCC (Grossmann et al, 2008) and to exit MCC patches upon SL perturbation (Frohlich et al, 2009). In agreement with this report, we found that Nce102 partly moved from MCC patches into a network‐like compartment upon treatment with Myr and AbA in rich medium (SC all, Fig EV2D and E). However, neither Nce102 nor another MCC‐resident tetraspanner, Sur7, showed noticeable relocation when SL synthesis was blocked in the absence of Met (Fig EV2D and E). When we inhibited TORC2 signaling in cells grown in the absence of Met, we found that Sur7 localization was again unaffected. However, Nce102 was largely lost from the MCC and was dispersed all over the PM (Fig EV2F and G). To test whether this effect contributes to the reduced Mup1 clustering upon TORC2 inhibition, we deleted NCE102. Strikingly, Mup1 was almost completely lost from the MCC in Δnce102 cells (Fig 3E and F). A known additional phenotype of NCE102 deletion is the disassembly of eisosomes through Pkh‐dependent phosphorylation of Pil1 (Frohlich et al, 2009). To rescue this effect, we expressed a non‐phosphorylatable mutant of Pil1 (Pil1‐4A). Even though the number of eisosomes was restored in this mutant (Fig 3G), Mup1 remained fully dispersed in the PM (Fig 3E and F). In summary, our results indicate that the tetraspanner Nce102 and sphingolipids together ensure clustering of Mup1 into the MCC.
Importantly, the effects of SL and TORC2 inhibition on Mup1 clustering occurred within 30–60 min, while relocation of Mup1 upon Met addition must occur within only a few minutes (Figs 1 and 2). In addition, all potential regulators of Mup1 clustering, Sur7, Nce102 and Slm1, did not become relocated out of MCC clusters by addition of Met (Fig 3H and I). We therefore investigated whether intrinsic features of Mup1 directly control its rapid lateral relocation within the PM.
PM relocation of Mup1 is controlled by a conformational switch
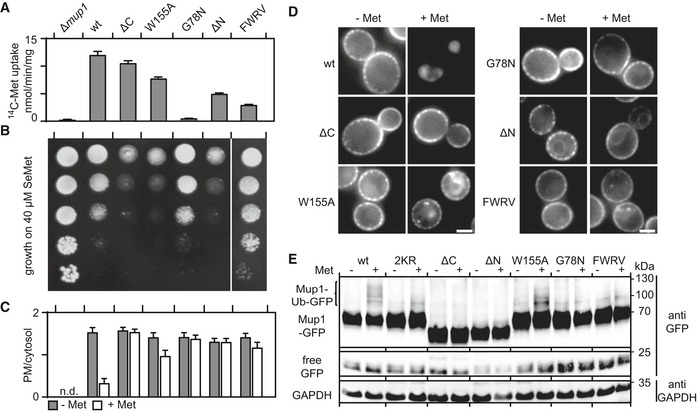
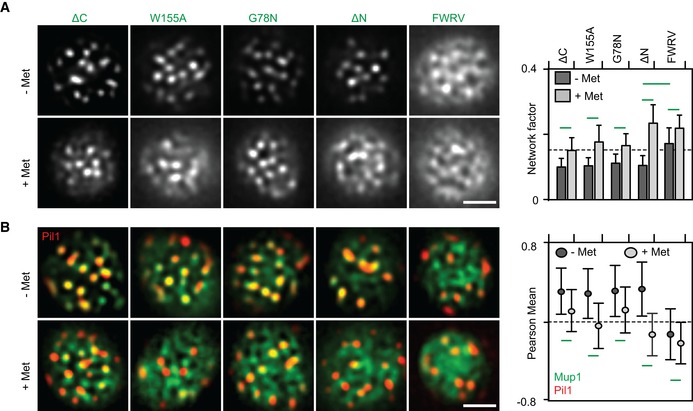
Neither clustering to the MCC nor relocation of Mup1 required ubiquitination or the cytosolic N‐terminal segment of Mup1. We therefore focused our analysis on intrinsic features of Mup1 that might contribute to its localization and dynamics on the C‐terminal tail and the transmembrane segments of the permease. In transporters that belong to the Amino acid Polyamine organoCation (APC) superfamily, including Can1 (Ghaddar et al, 2014b) and Fur4 (Keener & Babst, 2013), substrate uptake has been proposed to induce a structural transition from an open to a closed conformation. Based on crystal structures of several bacterial APC transporters, Mup1 is expected to adopt a 5 + 5‐fold structure with two inverted repeats of five transmembrane domains (TMDs; Fang et al, 2009). Substrate binding in this fold is stabilized by glycine‐rich regions within TMDs 1 and 6 and a stack of aromatic side chains within TMDs 3, 6, and 10 (Ghaddar et al, 2014b). We mutated glycine 78 (G78N) in TMD1 and tryptophan 155 (W155A) in TMD3 to test the role of these structural features in Met transport by Mup1. Both residues are conserved among fungal transporters, and the glycine also occurs in bacterial homologues (Fig EV3A ). Based on a high‐confidence structural homology model (Fig EV3B), they are expected to extend into the substrate‐binding pocket. In accordance with that prediction, mutation of the conserved glycine completely inhibited Met uptake, and replacement of the aromatic tryptophan by an alanine residue led to a marked reduction in Met transport (Fig 4A). However, while the G78N mutant is resistant to the toxic Met analog selenomethionine (SeMet, Fig 4B), the W155A substitution actually enhances sensitivity to SeMet. These observations can be explained by the reductions in Mup1 endocytosis seen in both mutants (Fig 4C and D). The expression of PM‐stabilized Mup1 variants with full or reduced function (W155A, ΔN) should lead to higher Met (or SeMet) accumulation, whereas lack of ubiquitination (Fig 4E) and internalization of the completely inactive G78N variant in the PM would have no effect on its sensitivity to SeMet. Note that the reduced Met uptake by Mup1‐ΔN (Fig 4A) is most probably attributable to its partial retention at the ER, and its correspondingly lower expression at the PM (Figs 4D and EV3C). In contrast to the endocytosis‐deficient mutants introduced above (ΔN, 2KR; see Fig 1F), G78N—and to a lesser extent W155A—exhibited reduced exit from the MCC region upon Met addition, as reflected by a modest increase in the Network factor (Fig 5A) and modest reduction of colocalization with Pil1‐RFP (Fig 5B). These results indicate that the predicted conformational switch associated with substrate transport is required for both lateral relocation and endocytic uptake of Mup1. Importantly, our results are based on homology models and not supported by structural and biochemical data on Mup1 itself. None the less, the selected mutations in the putative Met‐binding pocket of Mup1 did not affect PM delivery and MCC clustering of Mup1, indicating no gross effects on folding or targeting of the mutants.
Figure EV3. Mup1 sequence analysis and structure prediction.
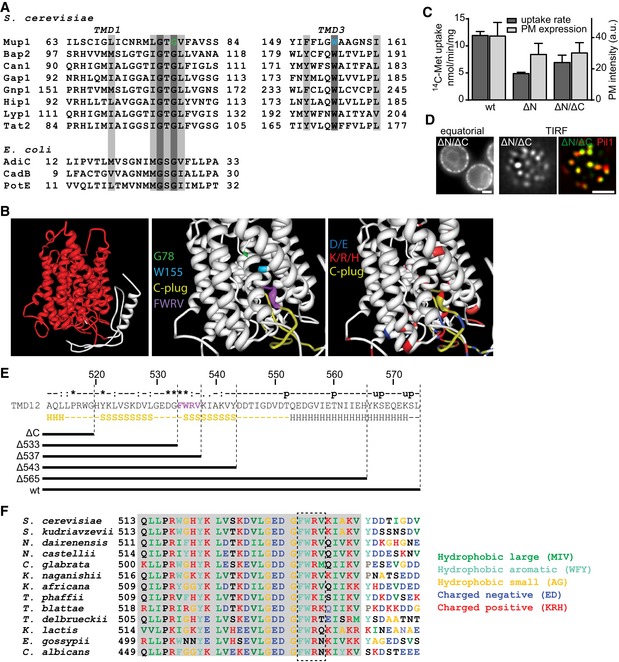
- Sequence alignments of predicted TMD1 and TMD3 of Mup1 with those of other yeast and Escherichia coli transporters. Conserved residues (dark gray), conservative replacements (light gray), and selected Mup1 mutations (G78 and W155) are highlighted.
- Structural organization of Mup1 as predicted by the Phyre2 software. High (red) and low (white) confidence predictions are highlighted (left panel). Mutations affecting Met transport (green and light blue), the C‐terminal “plug” oriented toward the substrate‐binding pocket (yellow), the conserved C‐terminal motif required for Mup1 localization and function (purple), as well as negatively (dark blue) and positively (red) charged residues around the binding pocket and the “C‐plug” are indicated (middle and right panels).
- 14C‐methionine uptake rates and PM expression of truncations and GFP‐fused Mup1 mutants. Values are means ± SD, n = 2 experiments (uptake) and n > 70 cells (PM expression).
- Representative equatorial and TIRFM images of Mup1ΔN/ΔC‐GFP in the absence of Met, showing its delivery to the PM and partitioning into the MCC (colocalization with Pil1‐RFP). Scale bars: 2 μm.
- Sequence of the Mup1 C‐terminal region. Degrees of conservation among Mup1 homologues (from ClustalW) calculated from various other fungi as shown in (F) (u: predicted ubiquitination site, p: predicted phosphorylation site) are indicated above the sequence, with secondary structure predictions (H: alpha helix, S: beta sheet) below it. The predicted “C‐plug” is indicated in yellow. The different C‐terminal truncations analyzed are shown.
- Sequence alignment of the Mup1 C‐terminal segment (513–550) with homologues from various other fungi. Gray shading indicates conserved region.
Figure 4. A conformational switch underlies Mup1 function and turnover.
-
A, BComparisons of the functional activities of different Mup1 mutants based on direct quantification of 14C‐Met uptake (A) and growth sensitivity to the toxic Met analog selenomethionine (SeMet, B). Growth assay is shown from top to bottom as a fivefold dilution series. White separator line indicates border to a lane that was removed from the original plate image.
-
C, DEndocytic internalization of the different Mup1 mutants fused to GFP. Ratios of PM to cytosolic fluorescence intensities (C) and representative images at equatorial planes (D) are shown.
-
DWestern blot showing ubiquitination (Ub) of the indicated Mup1 mutants grown in the absence (−) and presence of Met (+, 5 min after addition). Loading control as in Fig 1C. Mutants utilized: wt, wild‐type Mup1; ΔC, deletion of the C‐terminal segment to aa519; W155A and G78N, point mutants; ΔN, deletion of the N‐terminal segment to aa52; FWRV, mutation of aa534–537 to alanines; 2KR, Mup1 with N‐terminal mutations K27R and K28R. All strains refer to Mup1 variants fused to C‐terminal GFP.
Figure 5. A conformational switch drives Mup1 domain relocation at the PM .
-
A, BLateral PM segregation is shown in representative TIRFM images and quantified in terms of the Network factor (A) or the degree of colocalization with Pil1‐RFP (B). Mutants utilized as in Fig 4. All strains refer to Mup1 variants fused to C‐terminal GFP. Values are means ± SD, n = 50–250 cells. Green lines indicate significantly different data sets. An overview of the performed statistics can be found in Table EV3. Scale bars: 2 μm. All measured values are listed in Table EV1.
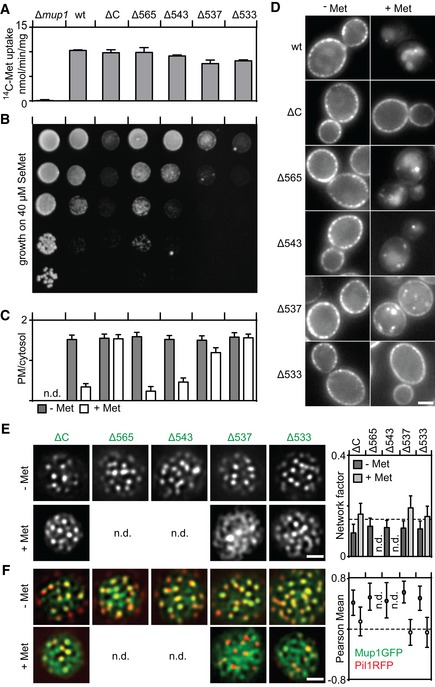
As substrate binding was not required for Mup1's ability to cluster into the MCC (Fig 5A and B), we turned to an analysis of the cytosolic C terminus of Mup1. When we removed the C terminus (ΔC = aa520‐end), Mup1's transport activity was largely unchanged (Fig 4A), but the protein was no longer ubiquitinated and remained at the PM upon addition of Met (Fig 4C–E). As expected, this led to hypersensitivity to SeMet (Figs 4B and EV4B). In addition, while clustering into MCC patches was unaffected (as in the case of the N‐terminal truncation mutant), exit from the MCC domain was compromised in cells expressing ΔC (Fig 5A and B). Complete deletion of both N and C termini did not further exacerbate the phenotype (Fig EV3C and D). The C‐terminal segment of Mup1 has multiple potential phosphorylation and ubiquitination sites (Fig EV3E). However, removal of these sites (in mutants Δ543 and Δ565) did not have any noticeable effects on Mup1 function or internalization (Fig EV4A–D), suggesting that C‐terminal post‐translational modifications do not contribute to the lateral segregation and the endocytic turnover of Mup1. When comparing Mup1 with known crystal structures of APC transporters, we noticed a structural domain near the beginning of the exposed C‐terminal segment (positions 512–543) that corresponds to a loop in the bacterial GadC transporter (Fig EV3B and E). Interestingly, this loop was identified as a C‐terminal “plug” that reaches into the core of the TMD segments in GadC (Ma et al, 2012). In Mup1, the tip of this plug is predicted to be positioned close to the substrate‐binding pocket and channel (Fig EV3B). Removal of the C‐terminal sequence of the plug up to position 543 did not affect either the function or internalization of Mup1 (Fig EV4A–D). However, further truncation by an additional 6 or 10 amino acids (Δ537 and Δ533) led to phenotypes similar to those seen upon complete deletion of the C‐terminal segment in the mutant ΔC (Fig EV4). The segment most relevant for Mup1 localization and function (FWRV, positions 534–537) corresponds to a conserved motif found within the C‐terminal regions of fungal Mup1 homologues (Fig EV3E and F). To test for a possible role of this signature sequence in Mup1 domain localization, we mutated all four amino acids to alanines (to yield the “FWRV” mutant). In contrast to the full C‐terminal truncation, the FWRV mutant exhibited strongly reduced function (Fig 4A and B), but was similarly defective in ubiquitination and internalization (Fig 4C–E). This is consistent with the previously proposed role of the C‐plug in facilitating a conformational transition during substrate transport in GadC (Ma et al, 2012). Strikingly, we found that the FWRV mutant was no longer able to cluster into the MCC domain in the absence of Met and was instead distributed in a network‐like fashion (Fig 5A and B). Similar findings were recently reported for the inactive E184Q mutant of the arginine transporter Can1 (Gournas et al, 2018), which is predicted to be kept in an inward‐facing (or closed) conformation (Gournas et al, 2017). In summary, our data support a role for the conformational state of Mup1 in mediating its clustering in the MCC and its rapid lateral relocation upon substrate transport. Our results also suggest a critical role of the C‐terminal plug in the conformational switch.
Figure EV4. Effects of truncations on function, segregation, and turnover of Mup1.
-
A, BFunction of different Mup1 mutants as measured by direct quantification of 14C‐Met uptake (A) and growth sensitivity to the toxic Met analog selenomethionine (SeMet, B). Growth assay is shown from top to bottom as a fivefold dilution series.
-
C, DEndocytic internalization of different Mup1 mutants. Ratios of PM to cytosolic fluorescence intensities (C) and representative images at equatorial planes (D) are shown.
-
E, FLateral PM segregation shown in representative TIRFM images and quantification of the Network factor (E) or the colocalization with Pil1‐RFP (F). Mutants utilized: wt (wild‐type Mup1), ΔC (deletion of C terminus after aa519), W155A and G78N (respective point mutants), Δ565/543/537/533 (deletion of C terminus beyond the indicated position). All strains refer to Mup1 variants fused to C‐terminal GFP.
Mup1 relocates into a unique dispersed network
We have previously shown that the yeast PM consists of a multitude of distinct domains (Spira et al, 2012). So far we have discussed how Mup1 clusters in MCC patches, but we have not defined the region of the PM into which it relocates upon its release from the MCC. To better define the network‐like domain where Mup1 resides after substrate addition (Fig 2), we tested its colocalization with the MCP marker Pma1 (Fig 6A), which is often used as a general marker for all PM areas outside of the MCC (Bianchi et al, 2018). Interestingly, while we confirmed the perfect separation of the MCC and the MCP (Fig 6A), we found that even after MCC exit, Mup1 clearly segregated from Pma1 (Fig 6A). This segregation was as strong as that between the MCC and the MCP (Fig 6A, right), indicating that Mup1 localizes to a distinct network domain upon MCC exit. As the limited resolution of our TIRFM images does not allow precise definition of the areas covered by particular proteins in the PM, we further characterized the different network domains via 3D structured illumination microscopy (3D‐SIM). This approach confirmed mutual segregation of the three domains (Fig 6B).
Figure 6. Spatial segregation of Mup1 into a unique dispersed network upon MCC exit.
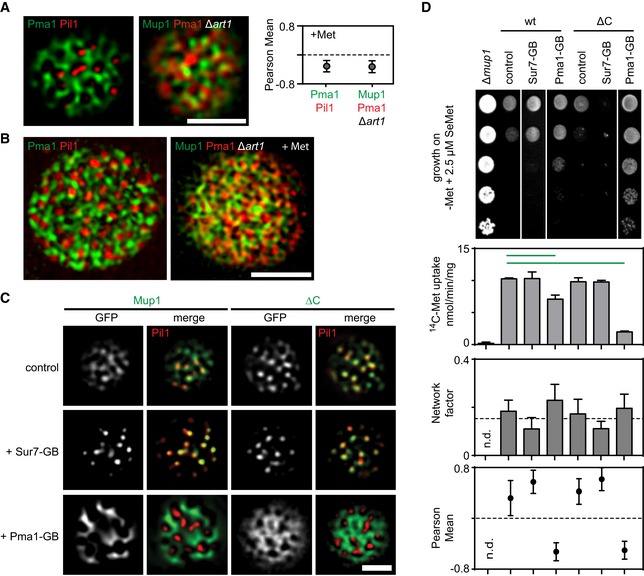
- Representative two‐color TIRFM images showing the spatial separation between the MCC (shown as Pil1‐RFP) and the MCP (shown as Pma1‐GFP), and the distribution of Mup1 outside the MCC together with the MCP marker Pma1‐RFP in the absence of ubiquitination and upon Met addition. The graph shows the quantification of colocalization (Person Mean) for the indicated protein combinations.
- Representative 3D‐SIM images showing the distribution of the indicated protein pairs in (A).
- TIRFM images showing Mup1 and ΔC artificially recruited to different PM domains using the GFP trap system. GB, GFP‐binding nanobody. Pil1‐RFP was used to illustrate the degree of relocation out of the MCC.
- Effects of forced relocation on SeMet sensitivity, rate of Met uptake, and the distribution of the respective Mup1‐GFP variant (Mup1/ΔC) in the PM (n.d., not determined). Growth assay is shown from top to bottom as a fivefold dilution series. White separator line indicates border to lanes that were removed from the original plate image. Note that the used concentration of SeMet (no added Met) was not sufficient to induce endocytosis of Mup1.
To determine whether the spatial segregation into the Mup1 network domain is relevant for its activity, we artificially relocated Mup1 to various domains using the GFP trap system (Fig 6C). Strikingly, we found that relocation of Mup1 to the Pma1 domain reduced its Met uptake activity (Fig 6D). This effect was seen with the wt variant, but was much more striking for the ΔC mutant (Fig 6D). Pma1 function was not affected by fusion to the GFP trap (Fig EV5A). The reduction in Mup1 activity was also not due to a general requirement of the MCC environment, as deletion of PIL1 (with concomitant loss of eisosomes) did not reduce Met uptake activity by Mup1 (Fig EV5B). Moreover, forced attachment of Mup1 to Sur7 did not noticeably increase Met uptake (Fig 6D). In contrast, the arginine transporter Can1 exhibited increased sensitivity to canavanine (a toxic analog of arginine) when anchored to the MCC (Fig EV5C).
Figure EV5. Mup1 uptake upon MCC disruption and Can1 sensitivity to canavanine.
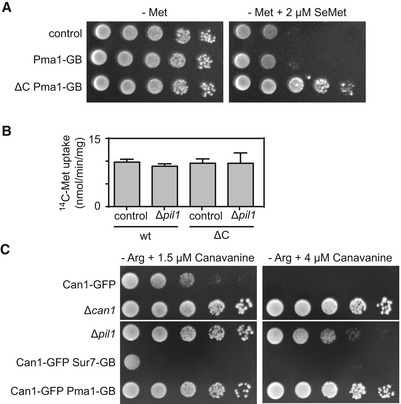
- Growth assay of indicated mutants in the absence of methionine and in the absence or presence of 2 μm selenomethionine (SeMet).
- 14C‐methionine uptake rate measured for Mup1 and ΔC in the wt and the Δpil1 background. Values are means ± SD, n = 2–4 experiments. All values are listed in Table EV1.
- Growth assay of indicated mutants in the absence of arginine (−Arg) and the presence of indicated concentrations of the toxic arginine analog canavanine. Growth assays are shown from left to right as a fivefold dilution series. White separator lines indicate borders to lanes that were removed from the original plate images.
In summary, we found that upon MCC exit Mup1 segregates into a unique network‐like domain. Of particular interest is the observation that the proton pump Pma1, or the PM environment of the MCP inhibits Mup1 activity. This might be a general effect on proton symporters, as we observed a similar, but even more pronounced effect on canavanine uptake via Can1 (Fig EV5C).
Mup1 clusters are protected from endocytosis
The MCC and eisosomal PM region has been proposed to be refractory to endocytosis (Grossmann et al, 2008), although this hypothesis has since been challenged (Brach et al, 2011). To test whether accumulation of Mup1 in the MCC hinders its endocytic reuptake—or simply precludes the prerequisite ubiquitination step—we artificially fused Mup1 to a single ubiquitin (Ub) moiety (Stringer & Piper, 2011). As expected, Mup1‐Ub was constitutively localized to the vacuole, even in the absence of its substrate (Fig 7A). In contrast, the ΔC mutant, which is defective in MCC exit, was partially retained in clusters at the PM (Fig 7A). Importantly, disruption of MCC domains by deletion of PIL1 completely abrogated ΔC‐Ub retention at the PM (Fig 7A). This is consistent with the idea that occupants of MCC domains are protected from endocytosis. As ΔC without fused Ub was retained at the PM in a Δpil1 strain grown with Met, our data also suggest that the C‐terminal plug is directly involved in Mup1 ubiquitination (Fig 7B). As a further test of the effect of the MCC on endocytosis, we attached Mup1 directly to the abundant MCC marker Nce102 (Fig 1B) using the GFP trap system. As expected, anchoring of Mup1 to the MCC protected the permease from Met‐dependent degradation, and this effect was abolished when PIL1 was deleted (Fig 7C). Finally, when we followed the effects of endocytic protection in yeast cultures grown for longer periods in the absence of Met, we observed slow internalization of Mup1 at a rate that was significantly enhanced in the absence of Pil1 (Fig 7D). In summary, our data are consistent with a role of the MCC domain in protecting resident proteins from endocytic uptake and degradation.
Figure 7. Clustering of Mup1 protects from endocytosis.
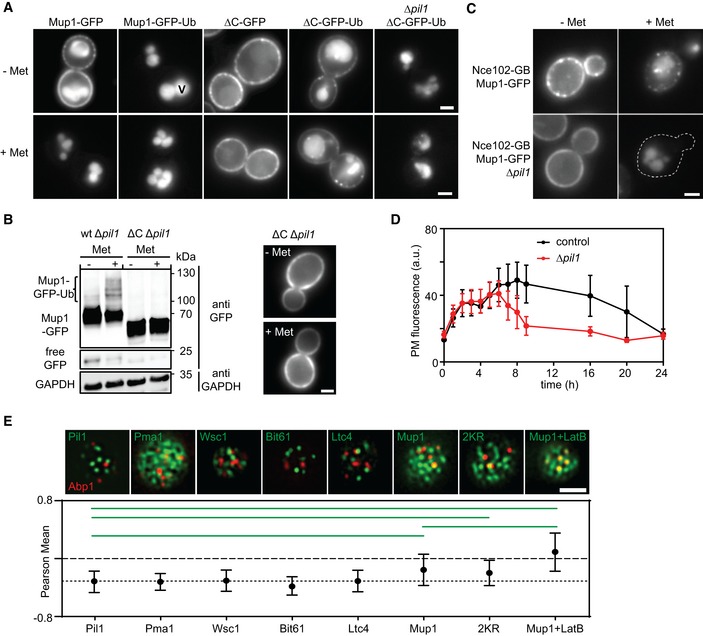
- Influence of the in‐frame fusion of an ubiquitin (Ub) moiety to Mup1 and ΔC on PM localization and turnover. V = vacuole.
- Western blot showing Mup1 and ΔC ubiquitination in Δpil1. Samples were prepared 5 min after addition of Met. Loading control as in Fig 1C. Representative images of indicated conditions are shown to illustrate defect in endocytosis of ΔC.
- Artificial anchoring of Mup1 to Nce102 in the presence or absence (Δpil1) of MCC and Met, respectively.
- Mup1 internalization during long‐term growth in the absence of Met.
- Degree of colocalization of endocytic events (shown by the late endocytic marker Abp1‐RFP) with various PM domains (GFP fusions). Representative two‐color TIRFM images of the indicated protein pairs are shown. Pil1 represents eisosomes, Pma1 the MCP, Wsc1 the MCW (membrane compartment occupied by Wsc1), Bit61 the MCT, and Ltc4 the MCL (membrane compartment of Ltc3/4). Cells were grown in Sc‐Met and imaging performed after addition of 100 μM Met. LatB was used at a concentration of 100 μM to stabilize endocytic sites. The dotted line is used as a guide to the eye.
In light of our finding that Mup1 occupies a distinct domain in the PM even after exit from the MCC, we wondered whether endocytosis might be specifically facilitated by this network domain. To test for a preferred association of Mup1 and endocytic sites, we colocalized various integral PM markers with the late endocytic marker Abp1‐RFP (Fig 7E). As expected from the observed protection from turnover in MCC patches, endocytic patches were completely segregated from Pil1 (Fig 7E). Indeed, we found that all of the previously described domains clearly segregated from endocytic regions (Fig 7E). Interestingly, 15 min after Met addition Mup1 or its 2KR variant were significantly less segregated from endocytic regions than all other tested markers (Fig 7E). This effect was further enhanced when endocytic sites were stabilized by addition of low doses of Latrunculin B (LatB, Fig 7E; Kaksonen et al, 2003). Our results thus show that the Mup1 molecules in a specific PM network outside of MCC clusters partially overlap with endocytic sites. Given that Mup1 becomes internalized within 10 min of relocating from the MCC (Fig 1D), this raises the question, whether Mup1 can directly influence the distribution of endocytic sites.
Mup1 actively redirects endocytic events
To test this hypothesis, we tracked the late endocytic marker Abp1, together with Mup1, at different time points after Met addition to monitor Mup1 endocytosis. We found no significant colocalization of actin patches with Mup1 in the initial phase of Mup1 relocation. However, within 10 min of Met addition, multiple Abp1 patches assembled on or close to Mup1 clusters (Fig 8A, asterisks in Movie EV1). Importantly, in most of these cases, both markers disappeared or were depleted together (Fig 8A, line scans shown for two examples). When we blocked internalization of actin patches by treatment with 100 μM LatB, we observed extended colocalization of Abp1 with Mup1 clusters (Fig 8B). In addition, upon disassembly of Abp1 patches, the Mup1 signal remained unchanged, which is consistent with the observed lack of internalization within 1 h of Met addition. These results indicate that clusters of ubiquitinated Mup1 can act as instructive signals for the recruitment of endocytic sites. To verify this, we quantified the distribution of endocytic patches in polarized yeast cells with small‐ to medium‐sized buds. In these cells, most endocytic events are limited to the bud region, where all polarized growth occurs. Remarkably, within 2–3 min of Met addition, we observed a large increase in endocytic activity within mother cells, with a coincident decline in buds (Fig 8C). This “depolarization” of endocytosis preceded the observed uptake of Mup1 into cells (Fig 8C, right panel). When we followed this response over an extended period, we found that the depolarization reversed within 10 min and all endocytic patches returned to the buds within 20–30 min (Fig 8D). Importantly, the response was not observed for cells that either did not express any Mup1 or that only expressed the ubiquitination‐deficient 2KR mutant. Together, our results are consistent with an active role for ubiquitinated Mup1 in driving its own internalization and regulating the subcellular distribution of endocytosis.
Figure 8. Mup1 actively redirects endocytic events.
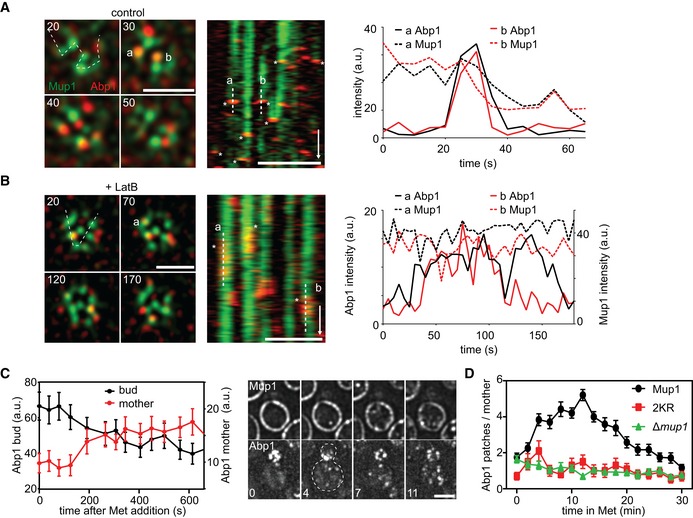
- Correlation of endocytic patch localization (marked by Abp1‐RFP) with Mup1 distribution. Kymographs (along the dotted line in the indicated cells) show localization patterns starting 10–15 min after Met addition. Representative line scans illustrate coordinated assembly and removal of endocytic patches from the indicated traces in the kymographs (marked “a” and “b”). Timestamps are given in s, time arrow: 100 s.
- Similar to the experiment in (A), except for the presence of 100 μM LatB. Note the longer lifetime of endocytic patches and the fact that there is no change in the fluorescence of Mup1‐GFP upon disassembly of Abp1‐RFP. Timestamps are given in s, time arrow: 100 s.
- Changes in the relative intensity of the Abp1‐RFP signals in the bud (black) and the mother cell (red) following the addition of Met. Representative images of Abp1‐RFP and Mup1‐GFP of a polarized cell are shown. Timestamps are given in min.
- Number of Abp1‐RFP patches in the mother cell during Met addition in the indicated strains. Growing cells with small buds and highly polarized Abp1 were individually selected, and the amount of Abp1 patches in the mother cell manually quantified.
Discussion
Cells must adapt rapidly to a wide variety of environmental changes and stresses. One universal mechanism that facilitates such adaptation is the selective alteration of the array of nutrient transporters present at the PM (Dupre et al, 2004). In budding yeast, 20–60% of energy consumption in exponentially growing cells is devoted to the maintenance of a proton gradient across the PM (Volkov, 2015), which serves as the primary driving force for the activity of a wide range of nutrient transporters. Yeast cells therefore face the critical challenge of providing optimal PM levels of nutrient transporters that ensure adequate nutrient uptake, while avoiding unnecessary energy consumption. Here, we provide evidence that controlled lateral segregation of transporters within specific PM domains provides a novel and important level of regulation in the response of cells to nutrient availability. We suggest that lateral segregation of the PM contributes to an optimal utilization of energy and resources.
The high‐affinity methionine permease Mup1 constitutes an ideal model with which to study the mechanisms of nutrient adaptation. Induction of Mup1 expression occurs promptly upon removal of its substrate, and Mup1 levels in the PM quickly surpass those of every other integral PM protein. Conversely, addition of even micromolar levels of substrate leads within minutes to endocytic uptake and degradation of Mup1. Importantly, we found that, as a prerequisite to its rapid turnover, Mup1 is also regulated via lateral segregation within the PM. In the absence of its substrate, Mup1 is clustered in the patchy MCC domain, where it is protected from internalization. Upon substrate addition, however, the transporter quickly leaves the MCC and relocates to a defined network‐like domain (Fig 9A). This relocation does not depend on ubiquitination but is inhibited by mutations that block substrate binding. We also uncovered a critical role for a C‐terminal domain of Mup1 in mediating lateral relocation. This domain is similar to one which is predicted to insert into the core of the structurally homologous bacterial transporter GadC (Ma et al, 2012). Deletion of the “C‐plug” (ΔC) in Mup1 did not interfere with substrate transport, but completely inhibited its lateral relocation, ubiquitination and subsequent internalization. We found that ubiquitination of ΔC was blocked in cells, even when the MCC had been disrupted by deletion of PIL1. In addition, a mutant with alterations in the tip of the C‐plug (FWRV→AAAA) exhibited strongly reduced function and was no longer able to cluster into the MCC. This mutant was also not susceptible to ubiquitination and exhibited very little substrate‐induced internalization. Our results therefore indicate that the C‐plug plays a structural role in Art1‐mediated ubiquitination of the Mup1 N terminus and is critical for efficient lateral relocation. Interestingly, a recent study reported a negatively charged region in the membrane‐proximal part of the N‐terminal tail (residues 40–55) of Mup1 as interaction site for Art1 (Guiney et al, 2016). However, this binding site was not sufficient for Mup1 ubiquitination and a second interaction site was postulated. We propose that the C‐plug serves as a linker domain that transmits the conformational change during substrate transport to the cytosolic N‐terminal tail, thereby exposing the binding site for Art1.
Figure 9. Model for the regulation of Mup1 segregation and turnover.
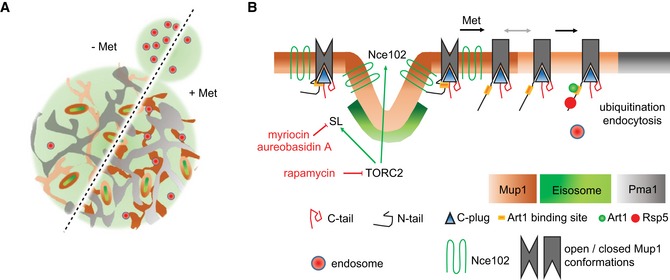
- Lateral organization of the yeast PM indicating relevant domains occupied by the indicated proteins. Upon addition of its substrate (+ Met), Mup1 relocates from the MCC (brown area around eisosomes) into a network‐like domain (light or dark brown), which is distinct from that marked by Pma1 (gray). Endocytosis in polarized cells is usually focused in the bud region but becomes depolarized upon addition of methionine.
- During substrate transport Mup1 undergoes a conformational change (indicated by the different gray shapes) that facilitates exposure of the N‐terminal ubiquitination sites and exit from the MCC (gray arrow). Ubiquitination and domain relocation both require an intact C‐plug (blue triangle). Exposure of the N terminus permits binding of Art1 (green circle) and subsequent recruitment of the ubiquitin ligase Rsp5 (red circle). Once modified, Ub‐Mup1 recruits the endocytic machinery (red circle with blue rim) and becomes internalized. The legend describes all indicated domains and proteins. Green arrows indicate activation, and red lines with bars indicate inhibition.
We show here that clustering of Mup1 into MCC patches is regulated by sphingolipids, by the MCC‐localized tetraspanner Nce102, and by TORC2 signaling (Fig 9B). Our data indicate that a complete blockade of SL synthesis (addition of Myr) or specific inhibition of the production of complex SLs (treatment with AbA) interferes with Mup1 clustering. SL synthesis is under control of the central metabolic regulatory kinases TORC1 and TORC2 (Eltschinger & Loewith, 2016). Strikingly, we found that selective inhibition of TORC2 but not TORC1 abolished clustering of Mup1 in the MCC. In addition to regulating SL levels, we found that TORC2 activity was also required for MCC localization of the tetraspanner protein Nce102, which is even more abundant in MCC patches than the core protein Pil1. Interestingly, Nce102 was not lost from the MCC following treatment with Myr or AbA. This contradicts previous findings (Frohlich et al, 2009) and might be attributed to a distinctive mode of regulation in the absence of Met. Importantly, deletion of NCE102 led to a complete loss of Mup1 from the MCC, and this effect could not be reversed by stabilization of eisosomes via expression of non‐phosphorylatable Pil1. Our results thus indicate that TORC2 regulates Mup1 clustering via two distinct mechanisms—SL biosynthesis and Nce102. SL stress could alter the global biophysical properties of the PM, thereby affecting composition and organization of individual domains. Considering the patchwork nature of the yeast PM (Spira et al, 2012), we favor a model where cooperative weak interactions between proteins (here Nce102 and Mup1) and lipids (here SL) can drive stable lateral segregation within the plane of the bilayer. Irrespective of the actual regulators, our data support a scenario where conformational changes within Mup1 are sufficient to rapidly override the existing lateral interactions and thereby mediate lateral relocation of the permease. Our findings are consistent with a dynamic regulation of lateral segregation that is highly adaptable to the environment and metabolic requirements of the cell. Interestingly, similar findings have been recently obtained for the arginine permease Can1 (Gournas et al, 2018). This study elegantly shows a link between conformational changes during arginine transport and lateral relocation of Can1 within the PM.
In accordance with our previous report on the existence of a multitude of PM domains in yeast (Spira et al, 2012), the network‐like domain defined by Mup1 after its exit from MCC patches is clearly distinct from the previously defined MCC and MCP domains. We found that forced anchoring of Mup1 to the proton pump Pma1 reduced its catalytic activity. This effect was even more apparent for the ΔC mutant, which lost nearly all its activity upon relocation. For GadC, it has been shown that the compact C‐plug covers a cleft in the protein core that has many exposed charges (Ma et al, 2012). In addition, removal of the C‐plug altered the pH sensitivity of the transporter (Ma et al, 2012). It is therefore tempting to speculate that the Pma1 domain constitutes a physicochemical environment that is harmful for Mup1. Since anchoring of the arginine transporter Can1 to Pma1 also abolishes its transport activity (Spira et al, 2012), this effect of the Pma1 compartment appears to be equally valid for other proton symporters.
Finally, we found that lateral segregation of Mup1 directly regulates its endocytic turnover. It has previously been shown that endocytosis is excluded from MCC patches (Grossmann et al, 2008; Brach et al, 2011), and we confirmed that Mup1 is not internalized while attached to the MCC. Importantly, we now show that endocytic internalization preferentially occurs at sites of Mup1 accumulation after substrate‐induced relocation from the MCC and ubiquitination. We specifically demonstrate for polarized cells that, within minutes of Met addition, endocytic events are redirected from the bud to the network of Mup1 in mother cells. Our results therefore indicate a dual role for Mup1 segregation: On the one hand, the MCC acts as protective site that ensures retention of functional Mup1 at the PM. On the other hand, ubiquitinated Mup1 that exits from the MCC acts as a potent beacon for endocytic adaptor proteins and is therefore able to efficiently compete with the bud‐localized signals that drive endocytosis to polarized growth regions.
Our study demonstrates that a transition between different types of lateral domains can regulate protein function and turnover at the plasma membrane. We not only elucidate the mechanism for lateral segregation of the Mup1 permease but also suggest a specific biological function for this process. Lateral segregation is a fundamental property of all biological membranes. It is therefore tempting to speculate that the uncovered interplay between protein segregation and turnover will apply to many other membrane components and cell types.
Materials and Methods
Yeast strains and plasmids
All strains created in this study were derived from the Saccharomyces cerevisiae BY4741 MATa strain (Euroscarf). In addition, strains from the UCSF C‐terminal GFP‐fusion collection (Huh et al, 2003) and EUROFAN II KO collection (Winzeler et al, 1999) were used. Genomic carboxy‐terminal tagging and gene deletions were performed by direct integration of PCR products as described previously (Janke et al, 2004). All mutants based on the Δmup1 strain were generated by replacing the kanMX KO cassette with the required PCR product (Mup1 mutant‐tag‐hphNT1) through in vivo homologous recombination. The PCR product was generated through overlapping PCR using standard methods. The tor1‐1 mutant was generated by homologous recombination with two complementary 140‐bp‐long oligonucleotides containing the required mutation (Heitman et al, 1991) and selection on plates containing 1 μg/ml rapamycin. Plasmids were constructed using standard molecular biology techniques. Transformation into yeast cells was performed using the LiOAc method. All plasmids were sequence‐verified. All PCR‐derived endogenous integrations were verified via colony PCR and sequencing. All strains, plasmids, oligonucleotides and linker sequences used in this study are listed in Table EV2.
Yeast culture
Unless otherwise stated, all strains were grown overnight in yeast extract peptone dextrose (YPD) media at 30°C with shaking, washed 3× with H2O, diluted to an OD600 = 0.1 in SC‐Met (synthetic complete media without methionine), and finally further grown for 2.5 h at 30°C and assayed as required in early logarithmic phase. Plasmid‐containing strains were grown overnight in SC‐Ura (synthetic complete media without uracil), washed 3× in H2O, and grown for 2.5 h in SC‐Ura‐Met media. Unless otherwise indicated, Mup1 endocytosis was triggered by addition of 1 mM methionine to the media. SC all: synthetic complete media. All media were supplemented with 2% glucose.
Microscopy and imaging
Epifluorescence, fluorescence recovery after photobleaching (FRAP), and total internal reflection fluorescence microscopy (TIRFM) were performed on an fully automated iMIC stand (FEI/Till Photonics) with an Olympus 100 × 1.45 NA objective. DPSS lasers (75 mW) at 491 nm (Coherent Sapphire) and 561 nm (Cobolt Jive) were selected through an acousto‐optical tunable filter. A two‐axis scan head was used to adjust TIRFM incidence angles or FRAP positions. An additional galvanometer was used to switch between illumination paths. Images were collected with an Andor iXON DU‐897 EMCCD camera controlled by the Live Acquisition (Till Photonics) software. For two‐color TIRFM, incidence angles were adjusted separately for each laser. Separate filters were used for detection of green and red fluorophores. 4‐color 100 nm microspheres (ThermoFisher Sci.) were used to determine the point spread function (PSF) in both channels and to correct for the offset between filters. For two‐color TIRFM, coverslips (Knittel Glass No. 1) were cleaned by sonication in absolute ethanol (Sigma), > 99.5% acetone (Sigma), 1 M NaOH (Roth), ddH2O and finally stored in absolute ethanol. Long‐term imaging experiments were performed using glass bottom culture dishes (MatTek). To immobilize cells, coverslips and glass bottom dishes were coated with 1 mg/ml concanavalin A (Sigma). TIRF images of Mup1 PM patterns were generally acquired 30 min after addition of Met to cultures. Equatorial images of Mup1 internalization were acquired 1 h after Met addition.
Image processing and analyses
Images were processed using Fiji and MATLAB (MathWorks Inc., Natick, MA). Images were contrast‐adjusted and zoomed for presentation purposes in Figures only. For image cleanup and denoising, we routinely used the background subtraction algorithm in Fiji (radius 50 pixel). Kymographs and intensity plots were created using the corresponding features in Fiji. All TIRFM images were deconvolved using the Lucy–Richardson algorithm in MATLAB (deconvlucy), with PSF functions calculated from 4‐color 100 nm microsphere images and 12 iterations. Protein colocalization (Pearson Mean), GFP intensity distribution (Network factor), and GFP overlap were calculated from TIRFM images using a customized automated script and GUI written in MATLAB. Cells were automatically detected from blurred raw images, deconvolved, and thresholded using an adaptive filter based on the difference between raw and deconvolved images. Masks were then generated for each separate channel. Calculations were based on combined (AND) masks (Fig EV1). Additional filters based on object size and intensity were used to discard false detections. Colocalization between GFP and RFP signals was determined by calculating the linear correlation coefficient (given as Pearson Mean) of the fluorescence within the generated masks. The GFP overlap indicates the fraction of GFP signal within the RFP mask and was used to better characterize colocalization of highly clustered proteins. The Network factor represents the normalized intensity distribution for entire cells detected in deconvolved images. A low Network factor represents highly clustered structures (patches), while higher values correspond to network‐like distributions. We included an arbitrarily selected line at a Network factor of 0.15 to provide a consistent guide to the eye separating patchy and network‐like patterns in all graphs. All images shown were scaled 3× and color‐coded using Fiji. TIRFM, and equatorial images in Fig 8A–C were processed using the super‐resolution radial fluctuations (SRRF) plugin in Fiji (Gustafsson et al, 2016).
PM expression and endocytosis measurements
All measurements are given as ratio between fluorescence intensity at the PM and the cytosol. Intensity values were determined from automatically detected cells using a customized MATLAB script. Cells expressing no PM fluorescence were quantified manually in Fiji. The PM intensity distribution in Fig 1B was calculated manually for strains taken from the UCSF GFP collection (Huh et al, 2003; Table EV2). The endocytosis assay in Fig 1D was performed at 22°C and the values automatically determined on completely static cells throughout the experiment using the detected PM and cytosol areas at t = 0 min.
Ubiquitination assay and Western blot
Strains were initially grown in SC‐Met as described under “Yeast culture.” Aliquots of 1 ml cells (OD600 = 1) were then supplemented with 1 mM Met for 5 min unless otherwise indicated. Cells were centrifuged at 16,000 g for 30 s, the supernatants removed, and the pellets quickly transferred to liquid nitrogen to stop ubiquitination. Cell pellets were then suspended in 100 μl of ice‐cold protease inhibitors (2 mM PMSF, 2× complete protease inhibitors, 8 mM EDTA). Next, 50 μl of a 2 M NaOH solution was added, cells were incubated for 10 min on ice, 50 μl of a 50% TCA solution was added, and cells were again incubated for 10 min on ice. Finally, samples were centrifuged for 5 min at 18,000 g (4°C) and the pellets resuspended in 50 μl sample buffer 1 (100 mM Tris–HCl pH 6.8; 4 mM EDTA; 4% SDS; 20% glycerol; 0.02% bromophenol blue) and 50 μl sample buffer 2 (1 M Tris; 2% β‐mercaptoethanol). The temperature was kept at 4°C throughout the entire protein extraction. Samples were loaded and separated using SDS‐glycerol gel electrophoresis (8.2% polyacrylamide/13.2% glycerol) to better separate ubiquitinated proteins. Proteins were transferred to a nitrocellulose membrane and probed with monoclonal mouse IgG1κ anti‐GFP (Roche, #11814460001) and monoclonal anti‐GAPDH (Abcam, #ab125247). Primary antibodies were detected with peroxidase AffiniPure goat anti‐mouse IgG secondary antibodies (Jackson ImmunoResearch Inc., #115‐035‐003) followed by chemiluminescence detection with Lumi‐LightPlus Western Blotting Substrate (Roche). Signals were detected with an advanced fluorescence imager (Intas).
Uptake measurements
Mup1 transport activity was analyzed by measuring the uptake of 14C‐methionine (specific activity: 1,417,484 nmoles/cpm, PerkinElmer, Boston, MA) 20, 40, 60, and 80 s after addition of the radioactive substrate at 40 μM final concentration (no cold Met added). Accumulated counts were measured using a β‐counter (LS 6500, Beckman Coulter Inc., Brea, CA) and line‐fitted to determine the uptake rate (given in nmol/min per mg of total protein). All strains were grown in SC‐Met as described under “Yeast culture” prior to the uptake measurement. All R 2 > 0.95. Further details are as described in Ghaddar et al (2014a).
Growth assays
Yeast growth assays were performed on plates in the presence of the toxic methionine analog selenomethionine (SeMet, Sigma‐Aldrich) or the toxic arginine‐related non‐proteinogenic amino acid canavanine (Sigma‐Aldrich). Plates were prepared as required in SC all, SC‐Met, or SC‐Arg and the corresponding drug. Cells were grown in SC‐Met as described under “Yeast culture” with the exception of final 2.5‐h growth on SC‐Arg for the canavanine‐based assay. Cells were spotted on plates in a 5× dilution series, starting at an OD600 = 0.1. Cells were then grown at 30°C for 3 days (SC all and SC‐Arg) and 5 days (SC‐Met). Drug concentrations used are as indicated in the respective figures.
Sequence alignments and tertiary structure prediction
Sequence alignments were performed using the open source Clustal Omega (EMBL‐EBI) software and color‐coded as indicated in the respective figure. Mup1 tertiary structure was predicted by the Protein Homology/analogY Recognition Engine V 2.0 (Phyre2; Kelley et al, 2015). The C‐terminal “plug” was inferred from the homology to the bacterial transporter GadC (Ma et al, 2012). Structures were color‐coded using the Java‐based free Protein Workshop software (Moreland et al, 2005).
Inhibitor experiments
Myriocin (Myr, Sigma‐Aldrich) and aureobasidin A (AbA, Clontech) were used to inhibit sphingolipid synthesis. Myr inhibits the serine palmitoyltransferase (SPT), which catalyzes the first step in the sphingolipid biosynthetic pathway. AbA inhibits the yeast inositol phosphorylceramide synthase, which catalyzes a late step in the biosynthesis of complex sphingolipids. Both drugs were dissolved in absolute ethanol at 5 mM and stored at 4°C, used at a final concentration of 5 μM, and incorporated into the cell suspension for 1 h at 30°C with shaking before imaging. Phytosphingosine hydrochloride (PHS, Sigma‐Aldrich) was used to rescue the sphingoid base synthesis defect caused by Myr. PHS was dissolved in absolute ethanol at 5 mM, stored at −20°C, and used at a final concentration of 50 μM for 15 min after Myr or AbA treatment. The macrolide compound rapamycin (Santa Cruz) was used to inhibit TORC signaling, dissolved in DMSO and stored at −20°C. Rapamycin was used at a final concentration of 1 μg/ml and added to the cell suspension for 30 min at 30°C with shaking before imaging. The tor1‐1 mutant (Heitman et al, 1991) makes TORC1 rapamycin‐insensitive while the avo3ΔC mutant renders TORC2 rapamycin‐sensitive (Gaubitz et al, 2015). Latrunculin B (LatB, Enzo Life Sciences) was used at 100 μM to inhibit actin dynamics in endocytosis experiments without inducing depolymerization.
3D Structured illumination microscopy (3D‐SIM)
3D‐SIM was performed on a Nikon Ti‐E N‐SIM/N‐STORM setup. The light source was controlled by a LU‐NV Laser Unit with a 488 nm (GFP) and a 561 nm (RFP) laser line using independent N‐SIM filter cubes. The objective was a CFI SR APO TIRF 100xH oil, NA 1.49, WD 0.12 mm (Nikon). Patterns were generated with an optimized grating (3D SIM 100x, 1.49 405–640 nm (Ex V‐R)) and the images collected with an Andor Ultra EM‐CCD and DU‐897 Camera controlled by the NIS‐Elements (Nikon) software. 4‐color 100 nm microspheres (ThermoFisher Sci.) were used to determine the PSF using the NIS‐Elements software. Z‐stacks were taken as 0.2 μm steps from the cell surface close to the glass coverslip up to 1 μm into the cell. Image z‐Stack‐Reconstruction was conducted automatically with default settings by the NIS‐Elements software. The samples were prepared as for TIRFM imaging. The coverslips were from VWR (No. 1.5) and the immersion oil from Nikon (nd: 1.515). Images represent maximum projections of 9–11 planes.
GFP trap system
In order to alter the localization of Mup1, we endogenously fused the GFP binder (GB) to the C terminus of the protein of interest. The GB is a single‐chain, high‐affinity GFP antibody from camelids (Rothbauer et al, 2006) that binds its target when both GFP and GB are coexpressed.
Statistics
Mean values, standard deviations (SD), standard error of the mean (SEM), and numbers of measurements (n) are provided for all quantified results. All quantifications are summarized in Table EV1. Values were always pooled from at least three independent experiments except for Met uptake experiments (more than 2). All replicates are biological replicates. Error bars in graphs are explained in the respective legends. For pairwise statistical comparisons, non‐parametric Wilcoxon–Mann–Whitney tests were performed. For comparison of multiple samples with a single control, one‐way ANOVA with Dunnett post hoc tests was performed. For comparison of multiple columns, one‐way ANOVA with Bonferroni post hoc test was performed. All graphs and test results were obtained with Prism 6.05 (GraphPad). Levels of significance for all tests are listed in Table EV3. For all figure panels, relevant comparisons are indicated with green bars for significant differences and red bars for non‐significant differences.
Author contributions
JVB, FS, and RW‐S conceived the project, designed, and conducted experiments, and analyzed data. JVB, FS, AE, and DH conducted experiments and analyzed data. JK and MS‐H wrote MATLAB code and analyzed data. JVB and RW‐S wrote the manuscript with the help of all authors.
Conflict of interest
The authors declare that they have no conflict of interest.
Supporting information
Expanded View Figures PDF
Table EV1
Table EV2
Table EV3
Movie EV1
Review Process File
Source Data for Figure 1
Source Data for Figure 4
Source Data for Figure 7
Acknowledgements
We thank P. Hardy, S. Wedlich, and members of the Wedlich‐Söldner laboratory for valuable comments on the manuscript. We are grateful to C. Gournas and B. André for help with Met uptake assays. This work was supported by the German Research Foundation (SFB944, 1348, WE2750/4‐1, RWS) and the Cells‐in‐Motion Cluster of Excellence (EXC1003–CiM, University of Münster, RWS). JVB was supported by a Postdoctoral Fellowship from the Basque Government.
The EMBO Journal (2018) 37: e99473
See also https://doi.org/10.15252/embj.2018100144 (August 2018)
References
- Aguilar PS, Frohlich F, Rehman M, Shales M, Ulitsky I, Olivera‐Couto A, Braberg H, Shamir R, Walter P, Mann M, Ejsing CS, Krogan NJ, Walther TC (2010) A plasma‐membrane E‐MAP reveals links of the eisosome with sphingolipid metabolism and endosomal trafficking. Nat Struct Mol Biol 17: 901–908 [DOI] [PMC free article] [PubMed] [Google Scholar]
- Berchtold D, Walther TC (2009) TORC2 plasma membrane localization is essential for cell viability and restricted to a distinct domain. Mol Biol Cell 20: 1565–1575 [DOI] [PMC free article] [PubMed] [Google Scholar]
- Berchtold D, Piccolis M, Chiaruttini N, Riezman I, Riezman H, Roux A, Walther TC, Loewith R (2012) Plasma membrane stress induces relocalization of Slm proteins and activation of TORC2 to promote sphingolipid synthesis. Nat Cell Biol 14: 542–547 [DOI] [PubMed] [Google Scholar]
- Bianchi F, Syga L, Moiset G, Spakman D, Schavemaker PE, Punter CM, Seinen AB, van Oijen AM, Robinson A, Poolman B (2018) Steric exclusion and protein conformation determine the localization of plasma membrane transporters. Nat Commun 9: 501 [DOI] [PMC free article] [PubMed] [Google Scholar]
- Brach T, Specht T, Kaksonen M (2011) Reassessment of the role of plasma membrane domains in the regulation of vesicular traffic in yeast. J Cell Sci 124: 328–337 [DOI] [PubMed] [Google Scholar]
- Douglas LM, Konopka JB (2014) Fungal membrane organization: the eisosome concept. Annu Rev Microbiol 68: 377–393 [DOI] [PubMed] [Google Scholar]
- Dupre S, Urban‐Grimal D, Haguenauer‐Tsapis R (2004) Ubiquitin and endocytic internalization in yeast and animal cells. Biochem Biophys Acta 1695: 89–111 [DOI] [PubMed] [Google Scholar]
- Eltschinger S, Loewith R (2016) TOR Complexes and the Maintenance of Cellular Homeostasis. Trends Cell Biol 26: 148–159 [DOI] [PubMed] [Google Scholar]
- Fang Y, Jayaram H, Shane T, Kolmakova‐Partensky L, Wu F, Williams C, Xiong Y, Miller C (2009) Structure of a prokaryotic virtual proton pump at 3.2 A resolution. Nature 460: 1040–1043 [DOI] [PMC free article] [PubMed] [Google Scholar]
- Frohlich F, Moreira K, Aguilar PS, Hubner NC, Mann M, Walter P, Walther TC (2009) A genome‐wide screen for genes affecting eisosomes reveals Nce102 function in sphingolipid signaling. J Cell Biol 185: 1227–1242 [DOI] [PMC free article] [PubMed] [Google Scholar]
- Frohlich F, Christiano R, Olson DK, Alcazar‐Roman A, DeCamilli P, Walther TC (2014) A role for eisosomes in maintenance of plasma membrane phosphoinositide levels. Mol Biol Cell 25: 2797–2806 [DOI] [PMC free article] [PubMed] [Google Scholar]
- Gaubitz C, Oliveira TM, Prouteau M, Leitner A, Karuppasamy M, Konstantinidou G, Rispal D, Eltschinger S, Robinson GC, Thore S, Aebersold R, Schaffitzel C, Loewith R (2015) Molecular basis of the rapamycin insensitivity of target of rapamycin complex 2. Mol Cell 58: 977–988 [DOI] [PubMed] [Google Scholar]
- Gaubitz C, Prouteau M, Kusmider B, Loewith R (2016) TORC2 structure and function. Trends Biochem Sci 41: 532–545 [DOI] [PubMed] [Google Scholar]
- Ghaddar K, Krammer EM, Mihajlovic N, Brohee S, Andre B, Prevost M (2014a) Converting the yeast arginine can1 permease to a lysine permease. J Biol Chem 289: 7232–7246 [DOI] [PMC free article] [PubMed] [Google Scholar]
- Ghaddar K, Merhi A, Saliba E, Krammer EM, Prevost M, Andre B (2014b) Substrate‐induced ubiquitylation and endocytosis of yeast amino acid permeases. Mol Cell Biol 34: 4447–4463 [DOI] [PMC free article] [PubMed] [Google Scholar]
- Gournas C, Saliba E, Krammer EM, Barthelemy C, Prevost M, Andre B (2017) Transition of yeast Can1 transporter to the inward‐facing state unveils an alpha‐arrestin target sequence promoting its ubiquitylation and endocytosis. Mol Biol Cell 28: 2819–2832 [DOI] [PMC free article] [PubMed] [Google Scholar]
- Gournas C, Gkionis S, Carquin M, Twyffels L, Tyteca D, Andre B (2018) Conformation‐dependent partitioning of yeast nutrient transporters into starvation‐protective membrane domains. Proc Natl Acad Sci USA 115: E3145–E3154 [DOI] [PMC free article] [PubMed] [Google Scholar]
- Grossmann G, Malinsky J, Stahlschmidt W, Loibl M, Weig‐Meckl I, Frommer WB, Opekarova M, Tanner W (2008) Plasma membrane microdomains regulate turnover of transport proteins in yeast. J Cell Biol 183: 1075–1088 [DOI] [PMC free article] [PubMed] [Google Scholar]
- Guiney EL, Klecker T, Emr SD (2016) Identification of the endocytic sorting signal recognized by the Art1‐Rsp5 ubiquitin ligase complex. Mol Biol Cell 27: 4043–4054 [DOI] [PMC free article] [PubMed] [Google Scholar]
- Gustafsson N, Culley S, Ashdown G, Owen DM, Pereira PM, Henriques R (2016) Fast live‐cell conventional fluorophore nanoscopy with ImageJ through super‐resolution radial fluctuations. Nat Commun 7: 12471 [DOI] [PMC free article] [PubMed] [Google Scholar]
- Heitman J, Movva NR, Hall MN (1991) Targets for cell cycle arrest by the immunosuppressant rapamycin in yeast. Science 253: 905–909 [DOI] [PubMed] [Google Scholar]
- Huh WK, Falvo JV, Gerke LC, Carroll AS, Howson RW, Weissman JS, O'Shea EK (2003) Global analysis of protein localization in budding yeast. Nature 425: 686–691 [DOI] [PubMed] [Google Scholar]
- Janke C, Magiera MM, Rathfelder N, Taxis C, Reber S, Maekawa H, Moreno‐Borchart A, Doenges G, Schwob E, Schiebel E, Knop M (2004) A versatile toolbox for PCR‐based tagging of yeast genes: new fluorescent proteins, more markers and promoter substitution cassettes. Yeast 21: 947–962 [DOI] [PubMed] [Google Scholar]
- Jensen MO, Mouritsen OG (2004) Lipids do influence protein function‐the hydrophobic matching hypothesis revisited. Biochem Biophys Acta 1666: 205–226 [DOI] [PubMed] [Google Scholar]
- Kaksonen M, Sun Y, Drubin DG (2003) A pathway for association of receptors, adaptors, and actin during endocytic internalization. Cell 115: 475–487 [DOI] [PubMed] [Google Scholar]
- Keener JM, Babst M (2013) Quality control and substrate‐dependent downregulation of the nutrient transporter Fur4. Traffic 14: 412–427 [DOI] [PMC free article] [PubMed] [Google Scholar]
- Kelley LA, Mezulis S, Yates CM, Wass MN, Sternberg MJ (2015) The Phyre2 web portal for protein modeling, prediction and analysis. Nat Protoc 10: 845–858 [DOI] [PMC free article] [PubMed] [Google Scholar]
- Kock C, Arlt H, Ungermann C, Heinisch JJ (2016) Yeast cell wall integrity sensors form specific plasma membrane microdomains important for signalling. Cell Microbiol 18: 1251–1267 [DOI] [PubMed] [Google Scholar]
- Kusumi A, Fujiwara TK, Chadda R, Xie M, Tsunoyama TA, Kalay Z, Kasai RS, Suzuki KG (2012) Dynamic organizing principles of the plasma membrane that regulate signal transduction: commemorating the fortieth anniversary of Singer and Nicolson's fluid‐mosaic model. Annu Rev Cell Dev Biol 28: 215–250 [DOI] [PubMed] [Google Scholar]
- Lauwers E, Erpapazoglou Z, Haguenauer‐Tsapis R, Andre B (2010) The ubiquitin code of yeast permease trafficking. Trends Cell Biol 20: 196–204 [DOI] [PubMed] [Google Scholar]
- Lin CH, MacGurn JA, Chu T, Stefan CJ, Emr SD (2008) Arrestin‐related ubiquitin‐ligase adaptors regulate endocytosis and protein turnover at the cell surface. Cell 135: 714–725 [DOI] [PubMed] [Google Scholar]
- Loewith R, Hall MN (2011) Target of rapamycin (TOR) in nutrient signaling and growth control. Genetics 189: 1177–1201 [DOI] [PMC free article] [PubMed] [Google Scholar]
- Ma D, Lu P, Yan C, Fan C, Yin P, Wang J, Shi Y (2012) Structure and mechanism of a glutamate‐GABA antiporter. Nature 483: 632–636 [DOI] [PubMed] [Google Scholar]
- Malinska K, Malinsky J, Opekarova M, Tanner W (2003) Visualization of protein compartmentation within the plasma membrane of living yeast cells. Mol Biol Cell 14: 4427–4436 [DOI] [PMC free article] [PubMed] [Google Scholar]
- Moreland JL, Gramada A, Buzko OV, Zhang Q, Bourne PE (2005) The Molecular Biology Toolkit (MBT): a modular platform for developing molecular visualization applications. BMC Bioinformatics 6: 21 [DOI] [PMC free article] [PubMed] [Google Scholar]
- Mueller NS, Wedlich‐Soldner R, Spira F (2012) From mosaic to patchwork: matching lipids and proteins in membrane organization. Mol Membr Biol 29: 186–196 [DOI] [PubMed] [Google Scholar]
- Murley A, Yamada J, Niles BJ, Toulmay A, Prinz WA, Powers T, Nunnari J (2017) Sterol transporters at membrane contact sites regulate TORC1 and TORC2 signaling. J Cell Biol 216: 2679–2689 [DOI] [PMC free article] [PubMed] [Google Scholar]
- Nikko E, Pelham HR (2009) Arrestin‐mediated endocytosis of yeast plasma membrane transporters. Traffic 10: 1856–1867 [DOI] [PMC free article] [PubMed] [Google Scholar]
- Olson DK, Frohlich F, Farese RV Jr, Walther TC (2016) Taming the sphinx: mechanisms of cellular sphingolipid homeostasis. Biochem Biophys Acta 1861: 784–792 [DOI] [PMC free article] [PubMed] [Google Scholar]
- Piper RC, Dikic I, Lukacs GL (2014) Ubiquitin‐dependent sorting in endocytosis. Cold Spring Harbor Perspectives in Biology 6: a016808 [DOI] [PMC free article] [PubMed] [Google Scholar]
- Rispal D, Eltschinger S, Stahl M, Vaga S, Bodenmiller B, Abraham Y, Filipuzzi I, Movva NR, Aebersold R, Helliwell SB, Loewith R (2015) Target of rapamycin complex 2 regulates actin polarization and endocytosis via multiple pathways. J Biol Chem 290: 14963–14978 [DOI] [PMC free article] [PubMed] [Google Scholar]
- Rothbauer U, Zolghadr K, Tillib S, Nowak D, Schermelleh L, Gahl A, Backmann N, Conrath K, Muyldermans S, Cardoso MC, Leonhardt H (2006) Targeting and tracing antigens in live cells with fluorescent nanobodies. Nat Methods 3: 887–889 [DOI] [PubMed] [Google Scholar]
- Simons K, Sampaio JL (2011) Membrane organization and lipid rafts. Cold Spring Harbor Perspectives in Biology 3: a004697 [DOI] [PMC free article] [PubMed] [Google Scholar]
- Spira F, Mueller NS, Beck G, von Olshausen P, Beig J, Wedlich‐Soldner R (2012) Patchwork organization of the yeast plasma membrane into numerous coexisting domains. Nat Cell Biol 14: 640–648 [DOI] [PubMed] [Google Scholar]
- Stringer DK, Piper RC (2011) A single ubiquitin is sufficient for cargo protein entry into MVBs in the absence of ESCRT ubiquitination. J Cell Biol 192: 229–242 [DOI] [PMC free article] [PubMed] [Google Scholar]
- Volkov V (2015) Quantitative description of ion transport via plasma membrane of yeast and small cells. Front Plant Sci 6: 425 [DOI] [PMC free article] [PubMed] [Google Scholar]
- Walther TC, Brickner JH, Aguilar PS, Bernales S, Pantoja C, Walter P (2006) Eisosomes mark static sites of endocytosis. Nature 439: 998–1003 [DOI] [PubMed] [Google Scholar]
- Winzeler EA, Shoemaker DD, Astromoff A, Liang H, Anderson K, Andre B, Bangham R, Benito R, Boeke JD, Bussey H, Chu AM, Connelly C, Davis K, Dietrich F, Dow SW, El Bakkoury M, Foury F, Friend SH, Gentalen E, Giaever G et al (1999) Functional characterization of the S. cerevisiae genome by gene deletion and parallel analysis. Science 285: 901–906 [DOI] [PubMed] [Google Scholar]
Associated Data
This section collects any data citations, data availability statements, or supplementary materials included in this article.
Supplementary Materials
Expanded View Figures PDF
Table EV1
Table EV2
Table EV3
Movie EV1
Review Process File
Source Data for Figure 1
Source Data for Figure 4
Source Data for Figure 7


