

Summary
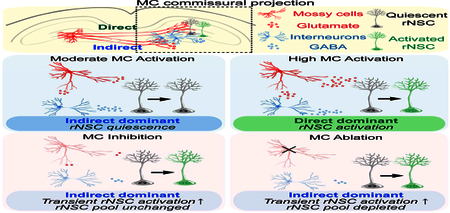
Mossy cells (MCs) represent a major population of excitatory neurons in the adult dentate gyrus, a brain region where new neurons are generated from radial neural stem cells (rNSCs) throughout life. Little is known about the role of MCs in regulating rNSCs. Here we demonstrate that MC commissural projections structurally and functionally interact with rNSCs through both direct glutamatergic MC-rNSC pathway and indirect GABAergic MC-local interneuron-rNSC pathway. Specifically, moderate MC activation increases rNSC quiescence through dominant indirect pathway; while high MC activation increases rNSC activation through dominant direct pathway. In contrast, MC inhibition or ablation leads to a transient increase of rNSC activation, but rNSC depletion only occurs after chronic ablation of MCs. Together, our study identifies MCs as a critical stem cell niche component that dynamically controls adult NSC quiescence and maintenance under various MC activity states through a balance of direct glutamatergic and indirect GABAergic signaling onto rNSCs.
eTOC Blurb
Yeh et al. demonstrate that mossy cells regulate adult NSCs through direct glutamatergic and indirect GABAergic pathways. Functionally, mossy cells at various activity states control NSC quiescence and maintenance through a dynamic balance of glutamatergic and GABAergic signaling onto NSCs.
Introduction
Adult hippocampal neurogenesis arises from radial neural stem cells (rNSCs) within a specialized local niche in the adult dentate gyrus (DG). Neuronal activity and experience, acting on this local niche, regulate rNSCs and subsequent hippocampal neurogenesis (Song et al., 2016; Song et al., 2012). Within the DG neurogenic niche, mossy cells (MCs) are one of the major glutamatergic neurons, and innervate both mature granule cells (GCs) and local interneurons that make GABAergic synapses onto GCs (Scharfman, 1995). Recently, MCs have received tremendous attention because of their critical roles in cognition, their vulnerability to glutamate excitotoxicity in temporal lobe epilepsy, and their potential involvement in neuropsychiatric disorders (Scharfman, 2016). To date, very few studies have examined the influence of MCs on hippocampal neurogenesis, though it has been suggested that MCs could be important because they provide the first glutamatergic synaptic inputs as well as disynaptic GABAergic inputs onto newborn GCs (Chancey et al., 2014; Deshpande et al., 2013; Vivar et al., 2012). MCs project axons along the septo-temporal axis of the ipsilateral DG (associational pathway) as well as to the contralateral DG (commissural pathway) (Buckmaster et al., 1996). These axons target the inner molecular layer (IML) of the DG and extend collaterals within the hilus (Scharfman and Myers, 2012). The localization of MC collaterals in the IML and hilus is particularly intriguing because it is closely associated with the neurogenic niche where rNSCs and local interneurons reside. It remains unknown whether and how MCs contribute to the functional regulation of rNSCs and subsequent hippocampal neurogenesis.
Using an array of circuit-based approaches in combination with stereological analysis of rNSCs, we demonstrate that MC commissural projections structurally and functionally interact with rNSCs through both direct glutamatergic MC-rNSC pathway and indirect GABAergic MC-local interneuron-rNSC pathway. Strikingly, rNSC quiescence is dynamically regulated through the balance of direct and indirect pathways onto rNSCs under various MC activity states. Under a moderate MC activation state, MCs increase rNSC quiescence through dominant indirect pathway. In contrast, under a high MC activation state, MCs increase rNSC activation through dominant direct pathway. Interestingly, both inhibition and chronic ablation of MCs lead to a transient increase of rNSC activation, likely due to reduced GABA signaling mediated by indirect pathway, but rNSC depletion only occurs upon chronic ablation of MCs. These results suggest that MC inhibition and ablation represent distinct MC activity patterns onto rNSCs. In summary, our study identifies MCs as a critical stem cell niche component that controls rNSC quiescence and long-term maintenance under various MC activity states through a dynamic balance of direct and indirect pathways onto rNSCs.
Results
MC commissural projections structurally interact with rNSCs through both direct glutamatergic and indirect GABAergic pathways
To examine the structural interaction between MCs and rNSCs, we injected AAV carrying CaMKII-driven mCherry (AAV-CaMKII-mCherry) into the hilus of Nestin-GFP mice to label excitatory neurons, and found that the majority of mCherry-labeled cells are dentate GCs and hilar MCs, along with some CA3c pyramidal cells (Fig. 1A-B). Since GCs and pyramidal cells do not project to the contralateral DG (Hsu et al., 2016), we limited our structural and functional analyses to the contralateral side for specificity. Within the hilus, injection of AAV-CaMKII-mCherry labeled ~82% of GluR2/3+ cells (specific marker for MCs) and ~94% of AAV-CaMKII-mCherry labeled cells were positive for GluR2/3 (Fig. 1C-D), thus validating the efficiency and specificity of CaMKII-driven AAVs for targeting MCs. We next examined whether direct morphological associations exist between MC commissural projections and rNSCs. Confocal imaging of contralateral brain sections from Nestin-GFP mice unilaterally injected with AAV-CaMKII-mCherry revealed close associations between MC commissural IML projections and distal thin processes of GFP+ rNSCs (Fig. 1E). We further examined MC commissural projections and the distal processes of the rNSCs using serial section immuno-electron microscopy (Immuno-EM). We found that rNSC processes extended into the IML and ensheathed excitatory synapses between MC commissural axons and GCs (Fig. 1F-Q; movies S1–S3). This is consistent with the concept that MCs directly mediate tonic glutamatergic signaling onto rNSCs. Additionally, immunogold labeling revealed NMDA receptor NR1 subunits in the perisynaptic processes of rNSC in the IML (Fig. S1; movie S4). These data provide high-resolution structural support for a direct glutamatergic MC-rNSC pathway. MCs also interact with several distinct types of dentate GABAergic interneurons (Hsu et al., 2016; Scharfman, 1995). It is possible that there is a substantial disynaptic GABAergic pathway onto the rNSCs. To examine the indirect association of MC commissural projections with rNSCs via dentate GABA interneurons, we injected AAV-CaMKII-eGFP into one DG for labeling MCs and AAV-hSyn-DIO-mCherry into the opposite DG to label local GABA interneurons using VGAT-Cre mice (Fig. 1R). Confocal microscopy showed that MC commissural hilar projections closely associated with somas of dentate GABAergic interneurons (Fig. 1R). Contralateral MC axons were further immunostained and imaged by electron microscopy. In the hilus, MC axons formed asymmetric (putatively glutamatergic) synapses directly on dendrites. These dendrites received multiple inputs from non-labeled asymmetric axons (Fig. 1S-T, 1S’-1T’), which are typical features of Parvalbumin-expressing (PV) basket cell dendrites (Ribak and Seress, 1983). MC axons were also found to synapse with hilar dendritic spines, suggestive of non-basket cell interneurons (Fig. 1U-V). These results thus provide morphological support for an indirect GABAergic pathway. While rNSCs do not possess synapses and typically exhibit hyperpolarized membrane potentials (Vm), single-cell analysis has detected mRNAs for both GABA and glutamate receptors (Shin et al., 2015). In order to determine if these receptors are functional in rNSCs which could potentially mediate both direct and indirect pathways onto rNSCs, we recorded Vm from Nestin-GFP+ rNSCs in response to bath application of glutamate or muscimol (GABAA receptor agonist). Interestingly, in the presence of TTX, bath application of muscimol hyperpolarized rNSCs (Fig. 1W); while bath application of glutamate depolarized rNSCs (Fig. 1X). Taken together, our morphological data and electrophysiological recordings suggest that rNSCs are regulated by both glutamatergic and GABAergic signaling, potentially mediated by MC direct and indirect pathways, respectively (Fig. 1Y).
Figure 1. MC commissural projections structurally interact with rNSCs through both direct glutamatergic and indirect GABAergic pathways.
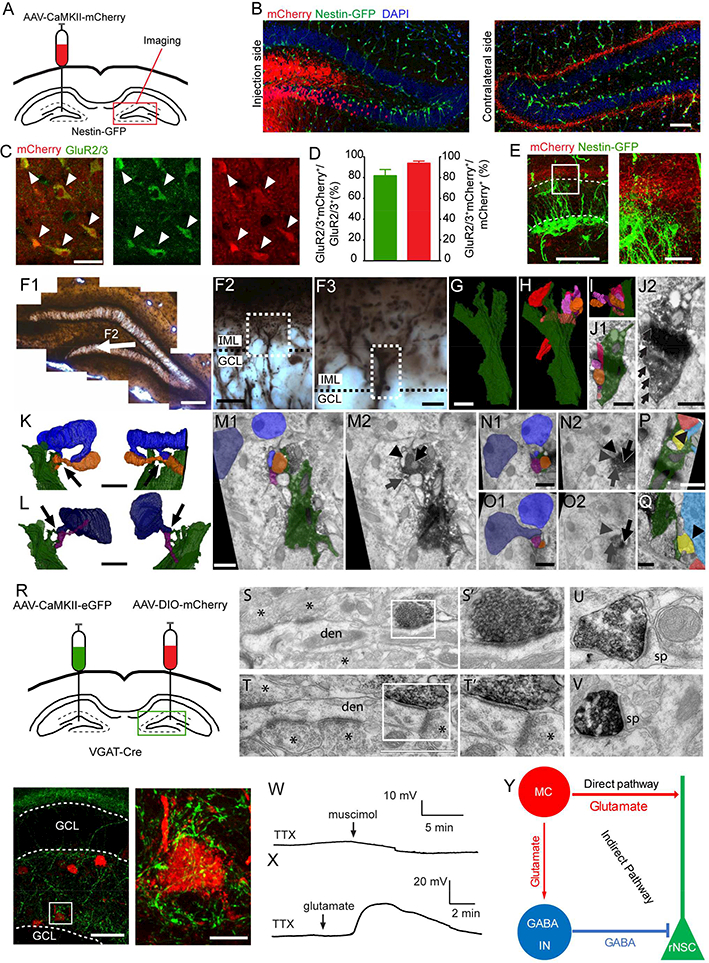
(A) Unilateral injection scheme for labeling MCs and contralateral analysis.
(B) Confocal image of mCherry expression at injection and contralateral DGs in a Nestin-GFP mouse. Scale bar 100 μm.
(C) mCherry and GluR2/3 expression at injected DG. Arrowheads indicate colocalization. Scale bar 20 μm.
(D) Efficiency and specificity of viral labeling of MCs.
(E) Close association of MC commissural projections (red) and rNSC bushy process (green) in the IML of the contralateral DG; boxed area shown on right. Scale bars 50,10 μm.
(F-Q) MC commissural axon terminals and synaptic contacts with GCs are directly ensheathed by Nestin-GFP+ NSC processes. (F) Bright field micrograph of DAB-labelled rNSCs from a Nestin-GFP mouse. Arrow region is shown at higher magnification in (F2) and (F3). rNSC processes reach the IML and intersect with CAMKII-GFP+ axons of MCs (punctate DAB labelling). Scale bars 200, 20, 5 μm. (G-I) 3D reconstruction of rNSC processes (green) traced from serial EM sections. Scale bars 1 μm. Warm colors (H and I) depict axons embedded within large NSC process, (purple/orange are DAB+, see movie S1). (J) EM section (colored (J1) and non-colored (J2)) from 3D reconstruction (arrows indicate penetrating axons). Scale bar 0.5 μm. Green: rNSC. Purple/orange: Axons. (K, L) 3D reconstructions of rNSC processes directly apposed (arrows) to synapses formed by MC axons (orange/purple) and GC dendritic spines (blue, see movies S2 and S3). Scale bars 2 μm. (M) EM section of asymmetrical (putatively excitatory) synapse at MC axon terminals (orange in M1, black arrow in M2) with GC spines (light blue in M1, arrowhead in M2). Other MC axons (purple in M1; grey arrow in M2). Scale bar 0.5 μm. (N, O) Consecutive EM sections of rNSC processes (green; N1) associating with an asymmetrical synapse between MC axon (purple in N1 and O1; grey arrows in N2 and O2) and GC dendrite (dark blue in S1 and T1) and spine head (grey arrowhead in N2 and O2). Scale bar 0.5 μm. (P, Q) rNSC processes (green) at the GCL-IML border also directly appose unlabeled axon terminals; (P; red) asymmetric synapse with a spine head (blue); (Q; yellow) asymmetrical synapse with GC soma (blue). Scale bar 0.5 μm.
(R) Viral injection scheme (top) in VGAT-Cre mice; and confocal images (below) of MC contralateral hilar projections (green) associating with VGAT+ interneuron soma (red). Boxed area shown on right. Scale bars 100, 10 μm.
(S-V) EM of asymmetric synapses from immunolabeled (dark) MC axon terminals in the contralateral hilus. (S, T) MC axo-dendritic synapses with dendrite (den); asterisks: additional asymmetric synapses from non-labeled axon terminals. (S’, T’) Higher magnification insets. (U-V) MC axo-spinous synapses with spines (sp). Scale bar: 1 μm (S, T) and 1.5 μm (S’-V).
(W) Slight hyperpolarization of GFP+ rNSCs to muscimol (in TTX).
(X) Brief 50 μl spike of glutamate depolarized GFP+ rNSCs (in TTX).
(Y) Illustration of rNSC regulation by MCs through direct glutamatergic and indirect GABAergic pathways.
See also Figure S1.
MC commissural projections functionally interact with rNSCs through both direct glutamatergic and indirect GABAergic pathways
To examine the functional interaction between MCs and rNSCs, we unilaterally injected a mixture of AAV carrying CaMKII-driven excitatory DREADDs (AAV-CaMKII-HA-hM3Dq-mCitrine) and AAV carrying CaMKII-driven mCherry (AAV-CaMKII-mCherry) into the hilus of Nestin-GFP mice, and recorded Vm from contralateral GFP+ rNSCs upon chemogenetic activation of MC commissural projections (Fig. 2A, Fig. S2A). Co-injecting two viruses facilitated the identification of MC commissural projections for electrophysiological recording, as mCitrine was not readily visualized by our fluorescence microscope. MC commissural projections at the contralateral side were detected 14 days after viral injection using immunostaining against the HA-tag (Fig. 2B-C), indicating that hM3Dq was efficiently transported to the contralateral terminals.
Figure 2. MC commissural projections provide direct glutamatergic inputs onto rNSCs.
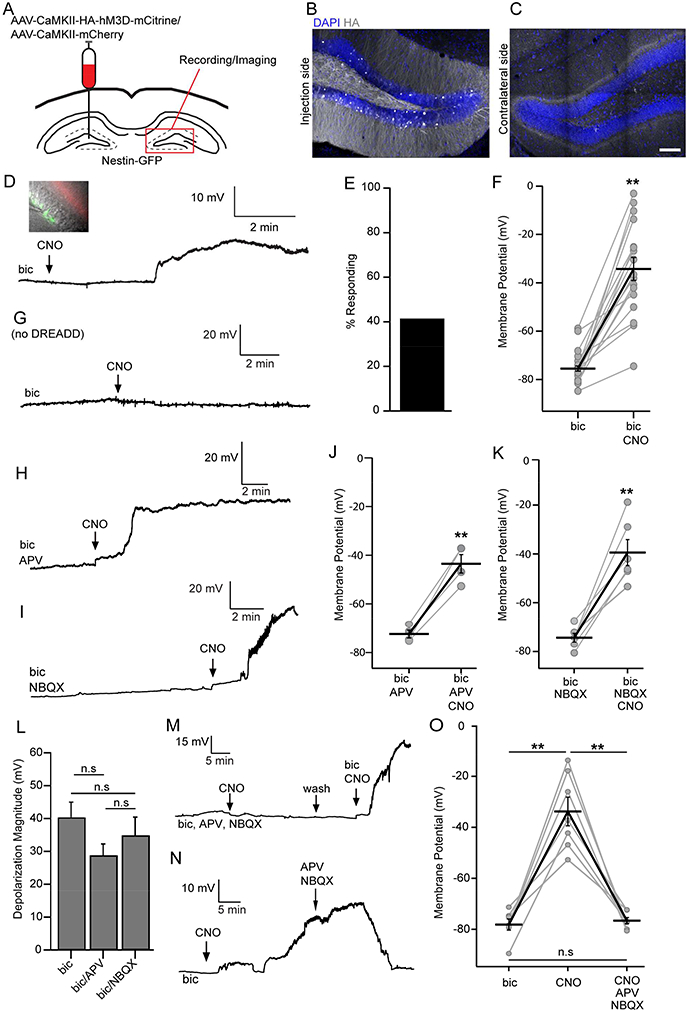
(A) Unilateral AAV injection scheme in the DG of Nestin-GFP mice for chemogenetic activation of MCs.
(B-C) HA+ MCs at injection side (B) and commissural projection (C). Scale bar 100 μm.
(D) Inset: whole-cell patch configuration from GFP+ rNSC with red commissural projection. Below: Depolarization of GFP+ rNSC under GABAaR blockade (bicuculline) upon CNO application.
(E) Percent of rNSCs that responded (⩾ 10 mV) to chemogenetic activation of MC commissural projections.
(F) Membrane potentials before and during CNO in responding GFP+ rNSCs (n=17 cells, 15 mice, paired Student’s t-test).
(G) No membrane potential change from mice without viral injection.
(H) Depolarization of GFP+ rNSCs in APV; or (I) in NBQX. Bicuculline was present in both conditions.
(J-K) Summary of rNSC depolarization in (J) NMDAR blockade (n=4 cells, 3 mice); or (K) AMPAR blockade (n=6 cells, 3 mice). Paired Student’s t-tests.
(L) Comparison of rNSC depolarization in AMPAR or NMDAR blockade. (n=17,4,6 cells; 15,3,3 mice).
(M) Combined blockade of NMDARs and AMPARs (APV and NBQX) in responding rNSCs.
(N) rNSC depolarization was abolished upon bath application of APV and NBQX.
(O) Membrane potentials under combined AMPAR and NMDAR blockade in responding rNSCs. (n=7 cells, 5 mice).
Values represent mean ± SEM. Significance was determined based on p< 0.05 (n.s: p > 0.05; * p < 0.05; ** p<0.01). See also Figure S2.
We then dissected the functional effects of MC-mediated direct and indirect pathways on the Vm of the rNSCs. We first examined the MC direct pathway onto rNSCs. We recorded GFP+ rNSCs upon chemogenetic activation of MC commissural projections in the presence of GABAA receptor blocker bicuculline in order to uncover potential glutamatergic components. Strikingly, we observed a significant depolarization in 41% of rNSCs ranging from 10–50 mV upon bath application of CNO to activate MC commissural projections (Fig. 2D-F). This depolarizing effect was not observed in the GFP+ rNSCs from non-viral injected mice in the presence of bicuculline and CNO (Fig. 2G), confirming that CNO by itself did not influence the Vm of the rNSCs. The highly variable depolarizing responses from rNSCs highlight a heterogeneity of rNSCs. Morphological heterogeneity in the height of rNSCs primary radial process has been recently reported (Gebara et al., 2016). Since MCs project axons to a specific molecular layer domain (Fig. 1B, E; Fig. 2C), we examined the reach of rNSCs into the IML, and found ~35% of the rNSCs reach MC projections (Fig. S2B-C).
Next we dissected the glutamate receptor subtypes mediating MC-induced rNSC depolarization. Recent single-cell RNA-sequencing data revealed AMPA and NMDA receptor expression in rNSCs (Shin et al., 2015), therefore, we recorded GFP+ rNSCs upon bath application of CNO in the presence of bicuculline and NMDA receptor blocker APV or AMPA receptor blocker NBQX. Interestingly, we found that rNSCs still depolarized upon adding CNO despite NMDA (Fig. 2H, J) or AMPA (Fig. 2I, K) receptor blockade, and the depolarization magnitude was not significantly different from bicuculline only conditions (Fig. 2L). These results suggest that NMDA and AMPA receptors have redundant functions in mediating MC-induced rNSC depolarization. Furthermore, we addressed whether combined NMDA and AMPA components mediate MC-induced rNSC depolarization with two sets of experiments. First, we recorded rNSCs upon adding CNO in the presence of both APV and NBQX along with bicuculline, and did not observe rNSC depolarization; however, after washing both glutamate blockers away, CNO-mediated rNSC depolarization was regained (Fig. 2M, O). Second, we added CNO first to induce rNSC depolarization which was later abolished upon adding glutamate receptor blockers (Fig. 2N, O). Together, these data support the combined involvement of both AMPA and NMDA receptors in mediating MC-induced rNSC depolarization.
To validate the chemogenetic manipulation, we also recorded the Vm of rNSCs upon optogenetic stimulation of MC commissural projections in contralateral brain slices prepared from Nestin-GFP mice injected with AAV-CaMKII-ChR2-mCherry (Fig. S2D). We recorded in the presence of GABAA receptor blocker bicuculline to uncover the glutamatergic component. Consistent with depolarization of rNSCs induced by chemogenetic activation of MCs, we observed light-evoked depolarization of rNSCs in response to optogenetic activation of MC commissural projections (Fig. S2E). Though the depolarization amplitude appeared small and the kinetics were slow, the responses were phase-locked to the light delivery onto the MC commissural projections. To enhance the reliability of light-evoked responses in rNSCs, we added low-concentration K+ channel blocker 4-AP (Grubb and Burrone, 2010). Indeed, this resulted in reliable robust depolarization in rNSCs upon blue light stimulations (Fig. S2F-G). Thus, both chemogenetic and optogenetic approaches confirm a glutamatergic direct pathway onto rNSCs.
Since local GABAergic interneurons regulate quiescence of rNSCs (Song et al., 2012), we next examined the plausibility of an indirect MC-GABAergic pathway regulating rNSCs. To probe the functional role of the MC commissural pathway in exciting local GABA interneurons, we injected a mixture of AAV-CaMKII-HA-hM3Dq-mCitrine and AAV-CaMKII-mCherry to one DG to label MCs and a Cre-dependent calcium sensor AAV-DIO-GCaMP6 to the other DG to label GABA cells using VGAT-Cre mice (Fig. 3A). We examined calcium signals of dentate GABA interneurons in response to chemogenetic activation of MC commissural projections by bath application of CNO, and observed a significant increase of Ca2+ signals in 48% of GABA interneurons located at subgranular zone (SGZ: 40% responding), hilus (50% responding), and granule cell layer (GCL: 60% responding) upon CNO application (Fig. 3B-F), suggesting that activation of MC commissural projections excites local GABA interneurons. Interestingly, CNO-induced responses in dentate GABA neurons were highly heterogeneous (Fig. 3B-D), consistent with the recent finding that the MC commissural pathway preferentially recruits several subsets of dentate GABA interneurons (Hsu et al., 2016). Dentate PV interneurons can functionally interact with and regulate rNSCs (Song et al., 2012), and our Ca2+ imaging showed 32% of the responding cells were from the SGZ where PV basket cells reside (Fig. 3G). Therefore, we hypothesized that PV basket cells in part mediate the MC GABAergic indirect pathway onto rNSCs. To probe the functional role of MC commissural pathway in regulating PV excitability, we repeated the same injections in PV-Cre mice (as for VGAT-Cre; Fig. 3H), and observed a significant increase in the Ca2+ signals in 50% of PV interneurons upon CNO (Fig. 3I-J), suggesting that PV interneurons in part mediate the MC GABAergic indirect pathway onto rNSCs.
Figure 3. MC commissural projections excite a subset of dentate GABA interneurons.
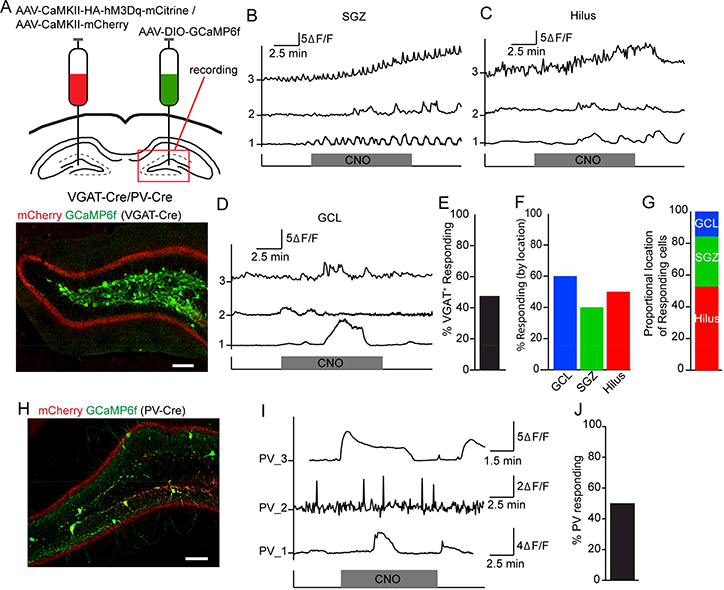
(A) Top: Viral injection scheme in VGAT-Cre (or PV-Cre) mice. Bottom: commissural projections and GCaMP6f expression in the contralateral DG of a VGAT-Cre mouse. Scale bar 100 μm.
(B) (B-D) Representative ΔF/F signals in contralateral VGAT+ interneurons from (B) subgranular zone (SGZ), (C) hilus, or (D) granule cell layer (GCL) upon CNO application.
(E) Percent of GCaMP6f+ GABA interneurons that increased Ca2+ events (⩾ 50%) upon chemogenetic activation of MC commissural projections.
(F) Percent of responsive VGAT+ cells residing within SGZ, hilus, or GCL.
(G) Distribution of the responders among the SGZ, hilus, and GCL.
(H) Commissural projections and GCaMP6f expression in the contralateral DG of a PV-Cre mouse. Scale bar 100 μm.
(I) Representative ΔF/F signals in contralateral PV+ interneurons upon CNO application.
(J) Percent of GCaMP6f+ PV interneurons that increased Ca2+ events (⩾ 50%) in response to chemogenetic activation of MC commissural projections.
rNSC quiescence is differentially regulated by distinct MC activation states
The presence of direct and indirect pathways onto rNSCs raised a question of the net effects of MC commissural projections on rNSCs under different MC activation states. The extent of neuronal activation using chemogenetic approaches is typically CNO dose-dependent (Sternson and Roth, 2014). We first examined rNSCs in acute brain slices prepared from adult Nestin-GFP mice injected with CaMKII-hM3Dq by recording the GFP+ rNSCs using CNO concentrations of 10 and 50 μM to represent moderate and high activation states of MCs. We recorded rNSCs in the absence of the GABA and glutamate receptor blockers to reflect the natural states of the circuit. We found that 10 μM CNO did not induce significant changes in the Vm of the rNSCs (Fig. 4A, C); in contrast, 50 μM CNO induced significant depolarization in rNSCs (Fig. 4B-C). Furthermore, the high-concentration CNO induced depolarization was abolished in the presence of AMPA and NMDA receptor blockers (Fig. 4D-F), suggesting that ionotropic glutamate receptors mediate membrane depolarization in rNSCs during high MC activation. Interestingly, we occasionally observed rapid depolarizing membrane potential transients during the bath application of 50 μM CNO in the presence of AMPA and NMDA blockers (Fig. 4D-E), which is in sharp contrast to the prolonged depolarization without the AMPA and NMDA blockers (Fig. 4B), suggesting the potential involvement of other MC-induced niche signals onto rNSCs under the high MC activation state. Importantly, these membrane transients did not affect the overall Vm of the rNSCs. These results together suggest a switch from indirect pathway dominance at moderate MC activation state (low-dose CNO) to direct pathway dominance at high MC activation state (high-dose CNO).
Figure 4. rNSC quiescence is differentially regulated by distinct MC activation states.
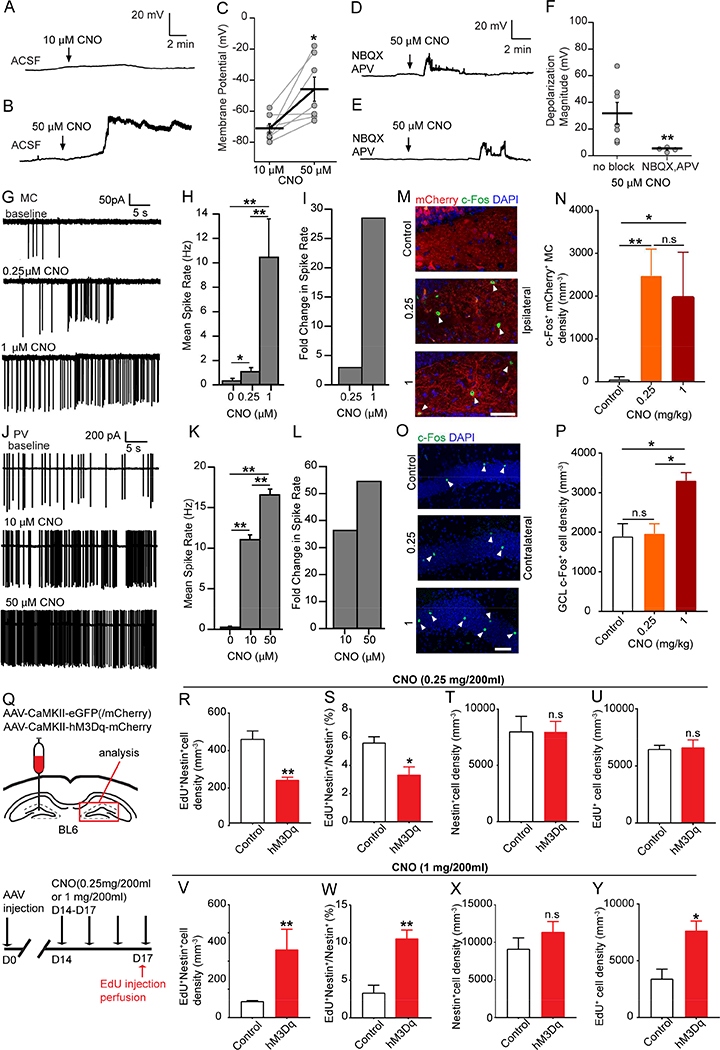
(A-B) Whole-cell recordings of rNSCs at (A) low-dose CNO, and (B) high-dose CNO in the absence of blockers.
(C) rNSC membrane potentials upon adding 10 and 50 μΜ CNO (n=7 cells, 4 mice; Paired Student’s T-test).
(D-E) Membrane depolarizations were blocked by NBQX and APV.
(F) Depolarization magnitude of rNSCs in glutamate receptor blockers upon CNO (n=7 cells from 3 mice: no blockers, and 4 cells from 3 mice: with blockers; Wilcoxon Rank Test).
(G) hM3Dq-mCherry+ MC spiking activity at indicated CNO concentrations (in bicuculline, NBQX, and APV).
(H) Representative CNO dose-dependent spike frequency in hM3Dq-mCherry+ MCs. (n=25,19,3 sweeps; Wilcoxon Rank,).
(I) Fold change in MC spike rate relative to baseline.
(J) Contralateral PV spiking activity at indicated concentrations of CNO (no blockers).
(K) Representative CNO dose-dependent spike frequency in contralateral PV+ interneurons. (n=25,20,20 sweeps; Wilcoxon Rank).
(L) Fold change in PV spike rate relative to baseline.
(M) c-Fos+ mCherry+ MCs (arrowheads) in hM3Dq-mCherry or mCherry injected DGs in control, low- and high-dose CNO. Scale bar 50 μm.
(N) Density of c-Fos+ mCherry+ MCs (n=3 mice in each group).
(O) c-Fos+ cells (arrowheads) in contralateral DGs. Scale bar 50 μm.
(P) Density of GCL c-Fos+ cells at the contralateral DG (n=3 mice in each group).
(Q) Viral injection scheme and experimental paradigm for in vivo chemogenetic activation of MCs.
(R-U) Density and percentage of activated rNSCs (R-S), Nestin+ rNSC pool (T), and EdU+ cell density (U) at the low-dose CNO (n=3,5 mice in each group).
(V-Y) Density and percentage of activated rNSCs (V-W), Nestin+ rNSC pool (X), and EdU+ cell density (Y) at the high-dose CNO (n=3,4 mice in each group).
Values represent mean ± SEM. Significance was determined based on p< 0.05 (n.s: p > 0.05; * p < 0.05; ** p<0.01). See also Figure S3.
To examine the circuit mechanism underlying this switch, we performed Ca2+ imaging and electrophysiology in acute slices to address dose-dependent effects of CNO on MCs and PV cells. Our Ca2+ imaging analysis revealed a significant increase in MCs that responded to high CNO concentrations (Fig. S3A-B), as well as a trend of CNO dose-dependence (Fig. S3C). Calcium imaging provided a quick readout for MC activity upon chemogenetic activation, but to get a more precise measurement of MC firing rates, we performed cell-attached electrophysiology recording. We observed a significant increase of MC firing at both low- and high-dose CNO as compared to baseline (Fig. 4G-I). Importantly, the increase of MC firing rate was dose-dependent. Next we performed cell-attached recording in dentate PV cells upon various CNO doses to address CNO dose-dependent effects on the indirect pathway. Similarly, we observed a significant increase of PV firing rate at both low- and high-dose CNO as compared to the baseline, and the increase of PV firing rate was dose-dependent (Fig. 4J-L). From our slice recording, it appears that PV cells have higher basal firing rate than MCs (Fig. 4G, J). Interestingly, low-dose CNO increased MC and PV firing rates by 3 and 37 fold, respectively (Fig. 4I, L), compared to the baselines. In contrast, high-dose CNO increased MC and PV firing rates by 28 and 55 fold, respectively (Fig. 4I, L). Together, these results reveal a differential regulation of MC and PV responses to low- and high-dose CNO: low-dose CNO increased the firing rate of PV cells 12 times of the increase in MCs; while high-dose CNO increased the firing rate of PV cells only 2 times of the increase in MCs. These results thus suggest that the indirect pathway is more sensitive to low-dose CNO treatment, which subsequently leads to more pronounced interneuron firing and GABA release. Together, these results provide mechanistic insights into the switch from indirect pathway dominance to direct pathway dominance at high-dose CNO.
To address the in vivo effects of CNO dose-dependent MC activation, we performed c-Fos staining at both ipsilateral and contralateral DGs in WT mice injected with AAV-CaMKII-hM3Dq. At the ipsilateral side, we quantified c-Fos+ MC somas; while at contralateral side, we quantified c-Fos+ dentate granule cells (GCs). Interestingly, we observed that low- and high-dose CNO similarly increased the density of c-Fos+ MCs at the ipsilateral side (Fig. 4M-N), but only high-dose CNO induced a significant increase of the density of c-Fos+ cells in the contralateral GCL (Fig. 4O-P). Additionally, high-dose CNO did not significantly alter the distribution of the c-Fos+ GCs within the GCL between control and hM3Dq groups (Fig. S3D). These results suggest that though both CNO doses induced MC activation, only high-dose CNO induced sufficient glutamate release to excite contralateral GCs and rNSCs.
To probe the function of MCs in regulating rNSCs in vivo, we administered low- or high-dose CNO drinking water (0.25 or 1mg/200ml) in C57BL6 mice injected AAV-CaMKII-eGFP (/mCherry) or AAV-CaMKII-hM3Dq-mCherry for 4 days, followed by thymidine analog EdU injections on the last day to label the proliferating cells (Fig. 4Q). Activated rNSCs were identified as contralateral SGZ cells with Nestin+ radial processes and EdU incorporation (Fig. S3E). Stereological analysis showed that chemogenetic activation of MCs at low-dose CNO led to a significant decrease in the density (Fig. 4R) and percentage (Fig. 4S) of activated rNSCs, without significant alteration of the Nestin+ rNSC pool (Fig. 4T) or EdU+ cell density (Fig. 4U). In contrast, chemogenetic activation of MCs at high-dose CNO led to a significant increase in the density (Fig. 4V) and percentage (Fig. 4W) of activated rNSCs, along with a significant increase of the EdU+ cell density (Fig. 4Y), without significant alteration of the Nestin+ rNSC pool (Fig. 4X). Together, these results suggest that rNSC quiescence is differentially regulated by distinct MC activation states.
Since high MC activation induced by high CNO concentration may represent pathological conditions, we tested a naturalistic stimulation of MC activity. MC are known to strongly respond to spatial exploration (Danielson et al., 2017). We therefore continuously exposed adult Nestin-GFP mice to enriched environment (EE) for 13 days. EE increased the proportion of MCs that express c-Fos (Fig. S3F-G) compared to standard housing, without changing the total number of MCs (Fig. S3H). In contrast, EE did not alter the proportion of PV cells that express c-Fos (Fig. S3I-J), indicating that EE may differentially activate MC and PV interneurons. Furthermore, this increase was accompanied by a 147% increase in the proportion of proliferating rNSC (Fig. S3K). Together, these results highlight the link between a high MC activation state in physiological conditions and rNSC behavior and suggest that EE favors the direct MC-rNSC pathway.
Sparse activation of MC inputs promotes NSC quiescence
Manipulating MC activity at moderate and high levels demonstrated that the strengths of MC-rNSC connections are important for the balance between direct and indirect pathways, and in turn rNSC quiescence. However, the CaMKII promoter used for in vivo studies is not specific to the MCs, so driving these cells may introduce abnormal circuit effects within the ipsilateral DG. It has been historically difficult to selectively target only MCs. Two mouse lines, Crlr-Cre and Drd2-Cre, were reported to label MCs, but both labeled secondary or tertiary cell types besides MCs. (Gangarossa et al., 2012; Jinde et al., 2012; Puighermanal et al., 2015). A recent study using double fluorescence in situ hybridization demonstrated that 5ht2A receptors colocalize with calretinin (Tanaka et al., 2012), another marker for MCs. To examine the specificity of 5htr2A-Cre mice in targeting MCs, we injected Cre-dependent AAV expressing mCherry (AAV-DIO-mCherry) to the hilus of 5htr2A-Cre mice (Fig. 5A). We observed prominent targeting of hilar cells with typical morphology of MCs (Fig. 5B). The vast majority of mCherry+ cells (94%) colocalized with MC-specific marker GluR2/3 (Fig. 5C-D), suggesting that 5htr2A-Cre line specifically targets MCs. Notably, AAV-labeled 5htr2A-expressing MCs only represent 24% of the total GluR2/3+ MC population (Fig. 5D). Although 5htr2A-Cre line appeared to more specifically label MCs than the two existing lines, we did notice that some CA3c pyramidal cells were labeled, similar to the Drd2-Cre mice, but not as abundant as the Crlr-Cre mice in which the whole CA3 was labeled.
Figure 5. Sparse activation of MC inputs promotes NSC quiescence.
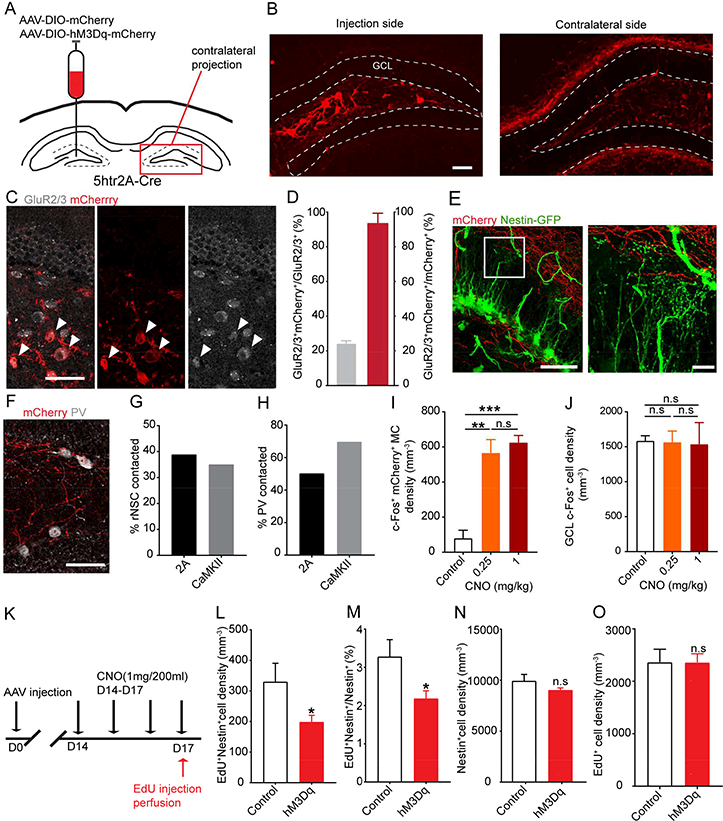
(A) Viral injection scheme in 5htr2A-Cre mice.
(B) Selective labeling of MCs and commissural projections by AAV-DIO-mCherry. Scale bar 50 μm.
(C) mCherry labeled a small subset of GluR2/3+ MCs (white) in the hilus. Arrowheads indicate colocalization. Scale bar 50 μm.
(D) mCherry+GluR2/3+ cells showed specificity for MCs but only labeled a subset of MCs.
(E) 5htr2A-MC commissural projections (red) formed close associations with the bushy processes of rNSCs (green); expanded view of boxed area is shown on right. Scale bars 50, 10 μm.
(F) 5htr2A-MC commissural projections (red) formed close associations with somas of contralateral PV+ interneurons (white) in the SGZ. Scale bar 50 μm.
(G-H) Percentage of contralateral rNSCs (G) or PV+ interneurons (H) contacted by 5htr2A-MC or CaMKII-MC projections.
(I-J) Density of c-Fos+mCherry+ MCs at the injection side (I) or c-Fos+ GCL cells in the contralateral DG (J) upon low- and high-dose CNO. (n=3 mice in each group).
(K) Experimental paradigm for in vivo chemogenetic activation of MCs.
(L-O) Density and percentage of activated rNSCs (L-M), Nestin+ rNSC pool (N), and EdU+ cell density (O) at the MC commissural projection side (n=3 mice in control group, and 5 mice in hM3Dq group).
Values represent mean ± SEM. Significance was determined based on p< 0.05 (n.s: p > 0.05; * p < 0.05; ** p<0.01, *** p< 0.001). See also Figure S4.
Since 5htr2A only labeled a subset of MCs, we addressed whether sparse MC inputs, which are believed to be more physiologically relevant, favor either the direct or indirect pathway onto rNSCs. We first confirmed the efficacy of chemogenetic activation of 5htr2A-expressing MCs by co-injecting Cre-dependent GCaMP6 and hM3Dq-mCherry to 5htr2A-Cre mice and performing calcium imaging of 5htr2A-expressing MCs in acute brain slices (Fig. S4A-B). Chemogenetic activation of hM3Dq-mCherry+GCaMP6+ MCs led to CNO-induced calcium increases in 5htr2A-expressing MCs (Fig. S4C). CNO-induced responses in 5htr2A-expressing MCs were variable (Fig. S4C), in agreement with observed functional heterogeneity in MCs (Goodsmith et al., 2017). These experiments validate the specificity of the 5htr2A-Cre line in targeting MCs and efficacy of CNO-induced chemogenetic activation of MCs.
Next we examined whether morphological associations exist between 5htr2A-Cre-MC projections and rNSCs or dentate PV cells. We found that 5htr2A-Cre-MC projections similarly associated with rNSCs and PV cells (as the CaMKII-MC projections; Fig. 5E-F). Furthermore, we quantified and compared the percentage of rNSCs (out of all rNSCs) and PV cells (out of all PV cells) that contacted 5htr2A-Cre-MC or CaMKII-MC projections. We found a similar percentage of rNSCs reaching 5htr2A-Cre-MC projections (Fig. 5G) as compared to CaMKII-MC projections (38% for 2A, 35% for CaMKII), but a smaller percentage of PV cells associated with 5htr2A-Cre-MC projections (Fig. 5H) as compared to CaMKII-MC projections (50% for 2A, 70% for CaMKII). In addition, CaMKII-MC projections are much more abundant in the hilus and IML than 5htr2A-Cre-MC projections (Fig. 1E, R; Fig. 5E-F). These morphological data suggest that both CaMKII-MC and 5htr2A-Cre-MC projections interact with a subset of rNSCs and PV cells, however, CaMKII-MC projections are more abundant. To determine the CNO dose-dependent activation state of MCs in vivo, we performed c-Fos staining in 5htr2A-Cre mice injected with AAV-DIO-hM3Dq at low- and high-dose CNO (0.25mg and 1 mg/200ml, respectively). As a result, we observed that low- and high-dose CNO similarly increased the density of c-Fos+ MCs at the ipsilateral side, thus confirming MC activation in response to CNO administration (Fig. 5I). Interestingly, in contrast to differential c-Fos expression at the contralateral side with low- and high-dose CNO in WT mice (with CaMKII-hM3Dq labeled MCs), we did not observe significant difference in 5htr2A-Cre mice (Fig. 5J), suggesting that moderate and high MC activation states induced similar circuit effects in 5htr2A-Cre mice. Together, the morphological and functional data suggest that CaMKII-MC projections provide more glutamate to rNSCs and local interneurons as compared to 5htr2A-Cre-MC projections, therefore, MCs in 5htr2A-Cre mice need to be driven harder in order to supply the same amount of GABA and glutamate for rNSCs as that of CaMKII-MC projections.
We then addressed the functional effects of sparse MC activation on rNSCs in vivo. Since we did not observe significant difference in circuit effects induced by low- and high-dose CNO, we utilized high-dose CNO to selectively activate 5htr2A-expressing MCs into a high-activation state and examined rNSC quiescence after 4-d administration of the high-dose CNO in the drinking water (1mg/200ml) (Fig. 5K). Our stereological analysis showed that chemogenetic activation of MCs significantly decreased the density and percentage of activated rNSCs (Fig. 5L-M) at the contralateral DG compared to the sham treatment group without altering the Nestin+ rNSC pool (Fig. 5N) or EdU+ cell density (Fig. 5O). These results suggest that sparse MC-rNSC connections remained indirect pathway dominant even when driven at high strength.
Taken together, these results suggest that MC-mediated glutamatergic and GABAergic signaling onto rNSCs determines the balance between direct and indirect pathways. When MC activation is moderate, such as might occur under physiological conditions, the indirect pathway is dominant; when MC activation is high, such as might occur under highly salient or pathological conditions, the direct pathway becomes dominant.
Inhibition of MCs leads to significant depolarization and increased activation of the rNSCs through indirect pathway
It is unclear whether indirect pathway dominance in rNSC regulation could persist without excitatory drive from MC hilar projections. We therefore addressed whether a “loss of function” in MC commissural projections would still favor indirect GABAergic pathway dominance in the regulation of rNSCs. We first performed slice electrophysiology to address the effect of chemogenetic inhibition of MCs on the Vm of the rNSCs using inhibitory DREADDs (hM4Di). Unilateral injections of AAV-CaMKII-hM4Di-mCherry were made in Nestin-GFP mice for chemogenetic inhibition of MCs and electrophysiological recordings were made from contralateral GFP+ rNSCs in the absence of receptor blockers (Fig. 6A). Unexpectedly, we observed a significant depolarization in 60% of recorded rNSCs upon adding CNO for chemogenetic inhibition of MCs ranging from 25–60 mV (Fig. 6B, E-F).
Figure 6. Chemogenetic inhibition of MCs leads to significant depolarization and increased activation of the rNSCs through indirect pathway.
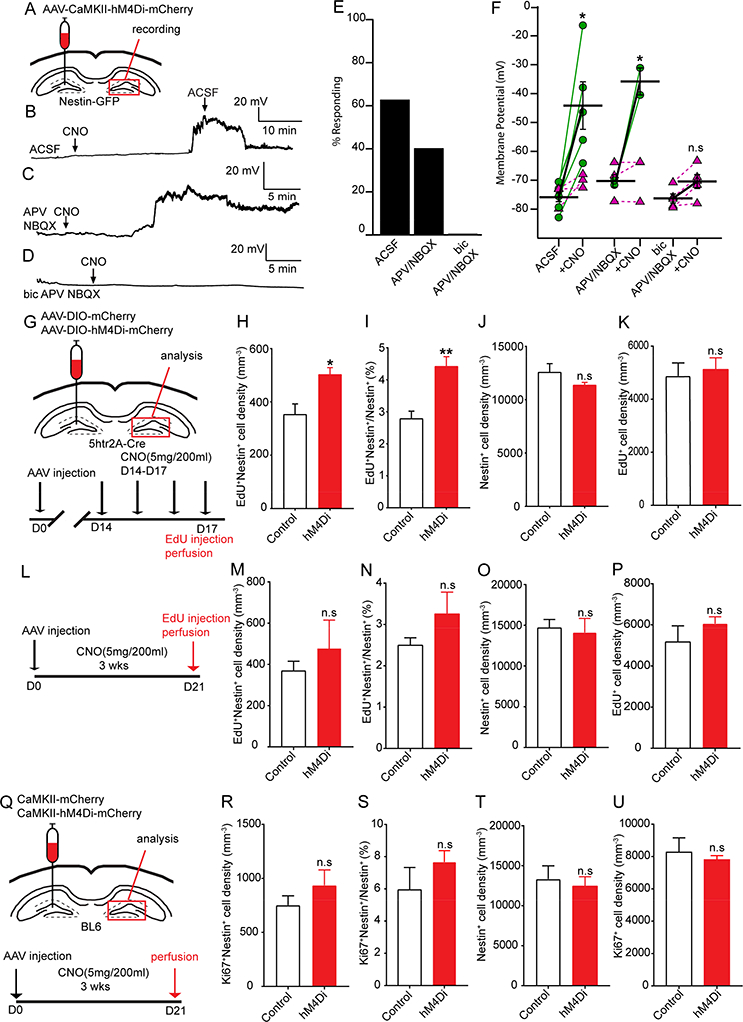
(A) Viral injection scheme in Nestin-GFP mice for electrophysiological recordings of rNSCs.
(B) Membrane depolarization in a GFP+ rNSC upon chemogenetic MC inhibition in the absence of blockers. Note recovery upon washout of CNO.
(C) Depolarization arose even in the presence of glutamatergic receptor blockade (NBQX and APV).
(D) No change in membrane potential under both glutamatergic and GABAergic receptor blockade (bicuculline, NBQX, APV).
(E) Percent of responding rNSCs (⩾ 10 mV) with and without pharmacological blockade.
(F) Membrane potentials in response to chemogenetic inhibition of MC commissural projections. Green circles indicate responding rNSCs; purple triangles, non-responsive. (n=8,5,5 cells from 5,3,3 mice; Wilcoxon Rank).
(G) Viral injection scheme and experimental paradigm for chemogenetic inhibition of MCs in 5htr2A-Cre mice.
(H-K) Density and percentage of activated rNSCs (H-I), Nestin+ rNSC pool (J), and EdU+ cell density (K) at the MC commissural projection side for short-term analysis. (n=4 mice in each group).
(L) Experimental paradigm for long-term chemogenetic inhibition of MCs in the 5htr-2A-Cre animal.
(M-P) Density and percentage of activated rNSCs (M-N), Nestin+ rNSC pool (O), and EdU+ cell density (P) at commissural projection side for long-term analysis in 5htr2A-Cre mice (n=3 mice in each group).
(Q) Experimental paradigm for long-term chemogenetic inhibition of MCs using CaMKII-hM4Di in BL6 mice.
(R-U) Density and percentage of activated rNSCs (R-S), Nestin+ rNSC pool (T), and EdU+ cell density (U) at the MC commissural projection side for long-term analysis in WT mice with CaMKII-labeled MCs (n=3 mice in each group).
Values represent mean ± SEM. Significance was determined based on p< 0.05 (n.s: p > 0.05; * p < 0.05; ** p<0.01). See also Figure S5.
Next we addressed the circuit mechanisms underlying MC inhibition mediated rNSC regulation. We recorded rNSCs in the presence of glutamate receptor blockers (APV+NBQX) or combined GABA and glutamate receptor blockers (Bic+APV+NBQX). The goal of these experiments was to address the relative contribution of glutamatergic and GABAergic signaling in regulating rNSCs in the context of chemogenetic inhibition of MCs. Interestingly, we found that rNSCs depolarized in the presence of glutamate blockers (APV+NBQX) (Fig.6C, E-F), but the rNSC depolarization was abolished in the presence of combined GABA and glutamate blockers (Fig. 6D-F). These results suggest that MC inhibition reduced both glutamatergic and GABAergic signaling onto rNSCs through direct and indirect pathways respectively, but reduced GABA signaling from indirect pathway contributes to rNSC depolarization, as blocking GABAA receptors (but not AMPA and NMDA receptors) abolished the rNSC depolarization.
To probe the functional role of MC inhibition in rNSC regulation in vivo, we took a chemogenetic approach to inhibit MCs using hM4Di in 5htr2A-Cre mice. First we performed Ca2+ imaging in acute brain slices prepared from 5htr2A-Cre mice co-injected with Cre-dependent GCaMP6 and hM4Di-mCherry to validate the efficacy of chemogenetic inhibition of MCs in the presence of CNO (Fig. S5A). We observed that chemogenetic inhibition of hM4Di-mCherry+ GCaMP6+ co-labeled MCs abolished spontaneous calcium activity in MCs upon bath application of CNO (Fig. S5B-C). Next we induced inhibition of MCs for 4 days by administration of CNO in the drinking water (5mg/200ml) (Fig. 6G). Interestingly, we observed a significant increase in the density and percentage of activated rNSCs (Fig. 6H-I) without significant change in the Nestin+ rNSC pool (Fig. 6J) or EdU+ cell density (Fig. 6K), consistent with our observed MC-inhibition induced depolarization in rNSCs.
To address chronic effects of MC inhibition on rNSC maintenance, we performed longterm chemogenetic inhibition of MCs using inhibitory DREADD (hM4Di) by providing CNO water for 21 days in both 5htr2A-Cre mice that sparsely labeled MCs (Fig. 6L) and WT mice with abundantly labeled MCs by CaMKII virus (Fig 6Q). Unexpectedly, we observed no significant changes in the rNSC pool in either 5htr2A-Cre or WT mice (Fig. 6O, T), suggesting that chronic MC inhibition did not alter the rNSC pool despite widespread MCs inhibition. Additionally, we observed no significant change in density or percentage of activated rNSCs (Fig. 6M-N, R-S), nor EdU+ cell density (Fig. 6P, U). It is likely that long-term inhibition of MCs induced circuit adaptation or DREADD receptor desensitization.
To provide further evidence of indirect pathway dominance in regulating rNSC quiescence upon MC inhibition, we selectively deleted glutamate receptors in rNSCs and examined whether glutamate signaling is required for rNSC quiescence. As our electrophysiology recordings identified that both AMPA and NMDA receptors were required for depolarization of rNSCs mediated by MC direct pathway, we selectively targeted three genes encoding AMPAR subunits (GluA1, A2 and A3) and the gene encoding the NMDAR GluN1 subunit for deletion with the Gria1–3f/fGrin1f/f mice (Gu et al., 2016; Hutchison et al., 2017; Lu et al., 2013). To genetically remove both AMPARs and NMDARs in rNSCs, we crossed an inducible Nestin-CreERT2 mouse line (Kuo et al., 2006) with Gria1–3f/fGrin1f/f mice to generate quintuple transgenic mice (Nestin-CreERT2+/−Gria1–3f/fGrin1f/f). The quintuple KO mice eliminateconcerns associated with glutamate receptor subunit compensation that occurs during only partial deletion (Adesnik et al., 2008; Lu et al., 2009) (Fig. S5D). To induce high-level recombination in rNSCs and their progeny at the population level, we injected tamoxifen (TMX, 100 mg/kg) for 7 consecutive days and mice were sacrificed 4 weeks after the last TMX induction following 4 EdU injections at the last day (Fig. S5E). We then quantified the density of activated rNSCs, the activation percentage of rNSCs, and the size of the rNSC pool. Compared to control mice (genotype: Gria1f/f::Gria2f/f::Gria3f/f:::Grin1f/f), both the density and the percentage of activated rNSCs were not significantly different from each other (Fig. S5F-G). In addition, the rNSC pool did not change significantly in quintuple transgenic mice compared to the controls (Fig. S5H). These results suggest that glutamate signaling does not exert a significant effect on rNSC quiescence at the baseline condition, thus providing the functional support that inhibition of MC activity leads to increased activation of rNSCs through a reduction in the functionally dominant GABAergic indirect pathway.
Chronic ablation of MCs leads to a transient increase of rNSC activation followed by rNSC pool depletion
Our data showed that MC activity bi-directionally regulated rNSC quiescence. However, long-term consequences of altered rNSC quiescence resulting from disrupted MC activity remain unknown. This may be particularly relevant, since many neuropathological states are associated with disrupted adult neurogenesis. To chronically manipulate MCs, we selectively ablated MCs and their projections by unilaterally injecting Cre-dependent AAV expressing the pro-apoptotic protease caspase 3 (AAV-FLEX-taCasp3-TEVp) to one hilus of adult 5htr2A-Cre mice (Yang et al., 2013) (Fig. 7A). We examined ablation of MC somas and commissural projections by injecting a mixture of AAV-DIO-mCherry and AAV-Flex-taCasp3–2A-TEVp, and observed no mCherry labeling at both injection and contralateral sides 21 days post AAV injection, compared to sham controls (Fig. 7B), suggesting that the caspase virus is efficient in ablating MCs. Furthermore, we quantified the percentage of GluR2/3+ MCs in caspase mice as compared to control mice at 15 and 21 days post viral injection, and found 10% and 55% reduction of GluR2/3+ MCs in caspase mice at 15 and 21 dpi, respectively (Fig. 7C-D). The result at 21dpi is unexpected but intriguing, as the 5htr2A-Cre line only labels 24% of total MC population but caused 55% reduction of the MC population upon ablation, thus suggesting that targeting a small number of MCs could induce the death of a large number of them. Additionally, we quantified the density of GABA+ cells in caspase mice at 21dpi as compared to the control mice, and found no significant difference between control and caspase groups (Fig. 7E-F), suggesting that caspase ablation was specific to MCs.
Figure 7. Chronic ablation of MCs leads to a transient increase of rNSC activation followed by rNSC pool depletion.
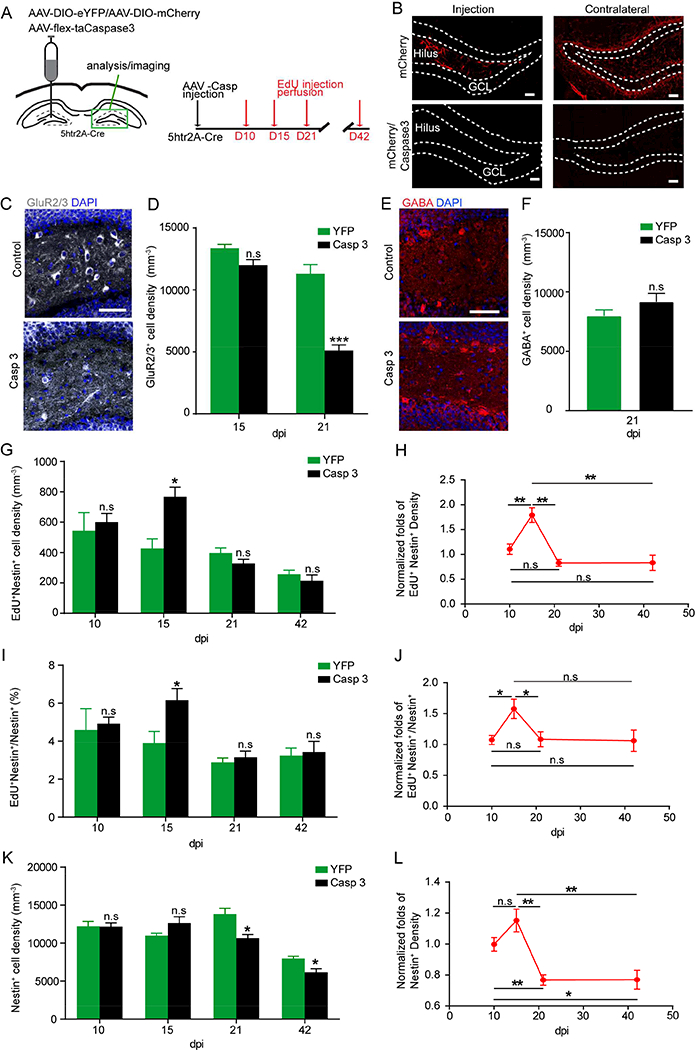
(A) Viral injection scheme and experimental paradigm for chronic ablation of MCs using caspase system in 5htr2A-Cre mice.
(B) AAV-DIO-mCherry labeled MCs and their commissural projections in mCherry only or mCherry and Caspace co-injected animals at 21 dpi. Scale bars 20 μm.
(C) Hilar GluR2/3+ MCs in animals injected with AAV-flex-taCaspase3 versus AAV-DIO-eYFP at 21 dpi. Scale bar 50 μm.
(D) Density of GluR2/3+ MCs remaining in injected hilus at 15 and 21 dpi. (n=3, 4 in control, n=5,4 in caspase, at 15, 21 dpi).
(E) GABA+ interneurons in the hilus injected with AAV-flex-taCaspase3 versus AAV-DIO-eYFP at 21 dpi. Scale bar 50 μm.
(F) Density of GABA+ interneurons remaining in the injected hilus at 21 dpi. (n=4).
(G, I, K) Activated rNSCs (G), percentage of activated rNSCs (I), and rNSC pool (K) at various time points after MC ablation (n=4,3,4,3 in control; n=4,5,4,4 in caspase, at 10, 15, 21, 42 dpi). (H, J, L) Time course of normalized fold change in density and percentage of activated rNSCs (H, J), and rNSC pool (L). (n=4,3,4,3 mice in control group; n=4,5,4,4 mice in caspase group, at 10, 15, 21, 42 dpi).
Values represent mean ± SEM. Significance was determined based on p< 0.05 (n.s: p > 0.05; * p < 0.05; ** p<0.01; *** p<0.001). See also Figure S6.
Using this system, we then examined rNSC activation and maintenance at the commissural projection side following ablation of MCs at 10, 15, 21, and 42 days (Fig. 7A). Interestingly, we observed a transient increase in the density and percentage of activated rNSCs at 15dpi (Fig. 7G-J), suggesting that MC ablation acted upon the initial stages of adult rNSC lineage which starts with symmetric self-renewing divisions of rNSCs followed by a self-depleting division (Gotz, 2018; Pilz et al., 2018). We furthermore observed an increased rNSC pool (not statistically significant) along with increased rNSC proliferation at 15dpi (Fig. 7K-L). Importantly, our time course analysis (10, 15, 21, and 42 dpi) revealed that the transient increase of rNSC activation at 15dpi was followed by rNSC pool depletion at 21 and 42dpi (Fig. 7H, J, L), suggesting that increased rNSC proliferation leads to precocious depletion of the rNSC pool.
In the adult mouse DG, lineage tracing has shown that activated Nestin+ rNSCs give rise to highly proliferative Tbr2+ intermediate progenitors, which in turn generate mitotic DCX+ neuroblasts. We examined the density of proliferating populations including EdU+, EdU+Tbr2+ intermediate progenitor cells, and EdU+DCX+ neuroblasts at various time points after MC ablation (Fig. S6A-C). Interestingly, the density of mitotic neuroblasts (EdU+DCX+) (Fig. S6A), but not intermediate progenitors (EdU+Tbr2+) (Fig. S6B) and overall proliferating population (EdU+) (Fig. S6C), was significantly reduced in the caspase group at 42 dpi (but not 21 dpi) without affecting the density of overall DCX+ population during this time frame (Fig. S6D), suggesting that chronic MC ablation led to impaired production of mitotic neuroblasts, likely resulting from a decreased rNSC pool.
Discussion
MCs are a major population of excitatory neurons in the adult hippocampus, and are critically important in circuit functions of this region. Recent in vivo electrophysiology and intrinsic calcium imaging studies convincingly link unique MC circuits and properties to pattern separation (Danielson et al., 2017; GoodSmith et al., 2017; Senzai and Buzsaki, 2017). However, how MCs might contribute to the regulation of adult NSCs and hippocampal neurogenesis remains unknown. In this study, we identified MCs as a critical stem cell niche component that regulates rNSC quiescence and pool maintenance though the balance of indirect GABAergic \ direct glutamatergic pathways under various activity states (Fig. S7). Strikingly, a small subset of MCs containing the 5ht2A receptor is necessary for maintaining rNSC quiescence, since genetic ablation of this small population significantly reduced the rNSC pool and impaired hippocampal neurogenesis. Our findings have a number of implications for understanding basic mechanisms underlying dynamic control of adult hippocampal neurogenesis and for developing strategies to treat neurological disorders arising from aberrant adult hippocampal neurogenesis.
Our study showed that MCs provide both direct excitatory glutamatergic signaling onto rNSCs and indirect GABAergic signaling onto rNSCs mediated in part by dentate PV interneurons. Moreover, our morphological data suggest that the direct pathway is mediated by the commissural projection in the IML, while the indirect pathway is mediated by projections terminating on local interneurons in the SGZ or the hilus. Supporting this notion, recent ultrastructural analysis demonstrated that the bushy processes of rNSCs wrap around glutamatergic synapses likely formed between MCs and mature GCs (Moss et al., 2016). Additionally, comparative recordings of patches from soma vs radial processes demonstrated that glutamatergic receptors are present in the radial processes (but not the soma) of the rNSCs (Renzel et al., 2013). Functionally, we identified a critical role of MC activity states in regulating rNSC quiescence. Specifically, when MCs were activated at a moderate level, the indirect pathway played a dominant role by maintaining hyperpolarized rNSCs in order to prevent activation. In contrast, when MCs were inhibited, inhibition of indirect pathway appeared to play a dominant role by allowing depolarization of the rNSCs which increased activation of rNSCs. These results together suggest that MC indirect pathway (but not direct pathway) dictates rNSC quiescence by regulating the membrane potential of the rNSCs when MCs are either activated at a moderate level or inhibited. It is worth mentioning that the activation state of MCs is a relative definition that only correlates with the CNO dose used for these experiments. Both in vitro electrophysiology and in vivo calcium imaging analysis has demonstrated that MCs are more active than dentate GCs (Danielson et al., 2017; Scharfman, 1995). The active basal state of MCs was also confirmed by our calcium imaging analysis of 5htr2A-expressing MCs in acute brain slices showing that MCs typically exhibit a high level of spontaneous activity. However, when MCs are activated at the high level, the balance of indirect and direct pathways onto rNSCs is shifted from “indirect pathway dominant” to “direct pathway dominant”. This high-activation state may represent a pathological condition called “irritable MCs” which has been associated with network hyperexcitability and seizures (Scharfman and Myers, 2012), which could in turn induce rNSC activation and subsequent differentiation into reactive astrocytes (Sierra et al., 2015). In contrast to the dynamic regulation of rNSCs by MC activation, we found that chemogenetic inhibition and chronic ablation of MCs led to a transient increase of rNSC activation. However, rNSC depletion only occurs upon chronic ablation of MCs. These results suggest that chemogenetic inhibition of MCs and genetic ablation of MCs represent distinct conditions that induce disparate activity patterns onto rNSCs. Killing the MCs has quite a different effect than simply inhibiting their functional activity, and may reflect consequences arising from the loss of spontaneous synaptic vesicle release at MC terminals. It is also likely that long-term inhibition of MCs may induce circuit adaptation or DREADD receptor desensitization. Taken together, our results suggest that fine-tuned MC activity is critical for maintaining rNSC quiescence and preserving the rNSC pool.
Interestingly, regulation of rNSCs under various MC activity states appears to be similar to how mature GCs are regulated. Recent studies showed that optogenetic activation of MC contralateral projections exerted a net inhibitory effect on GCs through disynaptic inhibition by preferentially recruiting basket cells (Hsu et al., 2016). Furthermore, MC loss caused a disinhibition and transient hyperexcitability of GCs (Jinde et al., 2012). Recent modeling data also concluded that deletion of the direct excitatory pathway would had little effect on GC excitability, but deletion of the indirect inhibitory pathways by deleting MC-basket cell connection would significantly increase GC excitability (Danielson et al., 2017). These results together implicate that rNSC activity is a reflection of the dentate network activity. This fits our previous model that rNSCs do not have synapses and therefore sense the dentate network activity through tonic GABA signaling mediated by spillover from synapses formed between PV cells and mature GCs (Moss and Toni, 2013; Song et al., 2012). Additionally, our data provide a plausible explanation for the dominant role of MC indirect pathway in maintaining an inhibitory tone for both rNSCs and mature GCs to prevent over-activation. Excessive activation of rNSCs may lead to rNSC pool depletion and hyperexcitability of the hippocampal network (Sierra et al., 2015), and our results suggest both aspects can be induced by reduced MC activity or the loss of MCs.
Chemogenetic activation of MCs promoted quiescence of contralateral rNSCs in both WT (moderate MC activation) and 5htr2A-Cre (high MC activation) mice. This raised the question of whether ipsilateral rNSCs are similarly regulated by MCs. We examined rNSC quiescence at the ipsilateral DG (i.e. injection side) in both wild-type and 5htr2A-Cre mice, and did not observe significant alteration of rNSC quiescence in either mouse line (data not shown). However, these results are not conclusive, because non-specific labeling of granule cells in wild-type mice and CA3c pyramidal cells in 5htr2A-Cre mice would likely increase the activation of rNSCs, counteracting the inhibitory effects of MCs on rNSC quiescence. Future efforts in developing mouse lines that can exclusively target MCs will be able to provide definitive answers to this question.
Our study using 5htr2A-Cre mice showed that a small subset of MCs constituting approximately a quarter of the total MC population are both necessary and sufficient in regulating rNSC quiescence. Genetic ablation of this small population of MCs results in a transient increase of rNSC activation followed by significant reduction of the rNSC pool and impaired hippocampal neurogenesis. These results demonstrate how a small subset of MCs exert powerful effects on rNSC behaviors and hippocampal neurogenesis. Whether this small population of MCs represent a molecularly and functionally distinct subset of MCs remains unknown. Future investigations using single-cell sequencing in combination with circuit-based approaches to selectively label specific MC subpopulations could further address this question. MCs are particularly vulnerable to ischemia, traumatic brain injury and seizures. Our study suggests that MC loss in these conditions, even in a small number, could potentially lead to aberrant hippocampal neurogenesis and associated cognitive deficits. Furthermore, a recent study demonstrated that activation of remaining MCs after chronic temporal lobe epilepsy alleviates seizure severity; while inhibition of those MCs impairs cognitive functions (Bui et al., 2018). Therefore, targeting the MC circuit by enhancing the indirect pathway or dampening the direct pathway may constitute a therapeutic strategy to combat hippocampal hyperexcitability associated with various neurological disorders and brain injuries in order to preserve neural stem cell pool, maintain sustainable hippocampal neurogenesis, and promote cognitive functions.
STAR METHODS
CONTACT FOR REAGENT AND RESOURCE SHARING
Further information and requests for resources and reagents should be directed to and will be fulfilled by the Lead Contact, Juan Song, Ph.D. (juansong@email.unc.edu).
EXPERIMENTAL MODELS AND SUBJECT DETAILS
Young adult mice (6–8 weeks, males and females) were used and randomly assigned to experimental groups. C57BL/6, VGAT-Cre (B6. Slc32a1tm2(cre)Lowl) and PV-Cre (B6.129P2-Pvalbtm1<cre>Arbr) mice were obtained from the Jackson laboratory, and have been backcrossed with C57BL/6 for at least 6 generations. Nestin-GFP mice were obtained from Dr. Grigori Enikolopov at Stony Brook University. 5htr2A-cre (B6.Tg(Htr2a-Cre)KM208Gsat) mice were from GENSAT (036679-UCD). Gria1–3fl/flGrin1fl/fl (F4 control) were generated as previously described(Lu et al., 2013). Nestin-creERT2+/−; Gria1–3fl/fl; Grin1fl/fl (cKO) were generated by crossing Gria1–3fl/flGrin1fl/fl mice with Nestin-creERT2 mice. All mice were experimentally and drug naive before procedure and no immune deficiency nor health problems were observed. Animals were grouped house in a 12hr light/dark cycle with access to food and water ad libitum. After the surgeries, animals were relocated to a satellite facility for recovery. For enriched environment, eight-week old C57BL/6J male mice were housed for 13 days in either a normal housing cage, or an enriched environment. Normal housing consisted of: 3 mice per cage, standard cage, unlimited access to water and food, bedding and 1 cardboard tunnel. Enriched environment consisted of: 2x larger cages, 5 mice per cage, unlimited access to food and water, numerous toys (ladder, box, tubes, houses), 2 cardboard tunnels, bedding, nest material and a running wheel. All procedures followed NIH Guide for the Care and Use of Laboratory Animals and were approved by Institutional Animal Care and Use Committee at the University of North Carolina at Chapel Hill (UNC).
METHOD DETAILS
Tamoxifen administration
Tamoxifen (Sigma) was prepared in corn coil at a concentration of 20 mg/ml. F4 control and cKO mice were given Tamoxifen (100 mg/kg) via intraperitoneal injection (i.p.) daily for 7 consecutive days at the age of 8 weeks old. Animals were sacrificed for tissue collection 4 weeks after the last injection.
Stereotaxic surgery
In brief, young adult mice (6–8 weeks) were anesthetized under 1–2% isoflurane in oxygen at 0.6–0.8 LPM flow rate. AAV vectors were injected stereotaxically to the DG using the following coordinate: AP −2.0 mm, ML +/− 1.5 mm, DV −2.3 mm from Bregma, with microsyringe (Hamilton, 33GA) and microinjection pump (Hamilton) at a speed of 100nl/min. Mice were allowed to recover for 2–3 weeks from the surgery before in vivo or ex vivo experiments. For in vivo DREADD experiments, mice in C57BL/6 background were injected unilaterally with AAV8-CaMKII-hM3Dq-mCherry, AAV8-CaMKII-hM4Di-mCherry, AAV8-CaMKII-hM3Dq-mCerry, AAV5-CaMKII-mCherry or AAV8-CAMKII-eGFP into DG. 5htr2A-Cre mice were injected unilaterally with AAV2-hsyn-DIO-hM3Dq-mCherry, AAV5-hsyn-DIO-hM4Di-mCherry, AAV2-EF1α-DIO-mCherry or AAV5-hsyn-DIO-mCherry into the DG. Animals were given 2-week recovery and subject to CNO treatment by adding CNO to drinking water at a concentration of 0.25 mg/200 ml or 1 mg/200 ml for 4 or 21 days. CNO was provided by NIH as part of the Rapid Access to investigative Drug Program funded by NINDS. On the last day, mice were given i.p. injection of EdU (40 mg/kg, Carbosynth) for 4 times with a 2-hr interval. Mice were perfused 2 hours after the last EdU injection. For c-Fos experiments, injected mice were given i.p. injection of 0.25 mg/kg or 1 mg/kg CNO and perfused 90 min after i.p. injection. For Caspase3-mediated ablation, 5htr2A-cre mice were injected with AAV5-FLEX-taCasp3-TEVp or AAV5-EF1a-DIO-eYFP unilaterally into the DG, and perfused at 10, 15, 21 or 42 days post viral injection (dpi) for immunohistochemistry and analysis. For slice recording, viral injections were conducted in similar ways. Additional AAV vectors including AAV8-CaMKII-HA-hM3Dq-IRES-mCitrine, AAV5-CaMKII-ChR2-mCherry, AAV5-hysn-DIO-mCherry, AAVdj-CaMKII-GCaMP6s, AAVdj-EF1α-DIO-GCaMP6f, and AAVdj-EF1α-DIO-GCaMP6s were injected into the DG of adult mice for different experiments. Mice were used for slice preparation and electrophysiological recording 2–4 weeks after viral injection. No specific replication designs were used, but multiple animals were used as indicated in the figure legends. Sample size estimation was based on previous publications and power analysis. Mice with viral expression outside the region of interest (DG) were excluded from tissue processing and further analysis.
Tissue process and Immunohistochemistry
Mice were anesthetized with isoflurane. Brains were fixed via aortic arch perfusion of ice-cold 4% paraformaldehyde (PFA) in phosphate buffered saline (PBS) at pH 7.4. Brains were collected and post-fixed in 4% PFA overnight, followed by 30% sucrose in PBS for 2–3 days. Brains were sectioned into 40 μm coronal sections with a microtome and stored in cryoprotectant solution containing 30% sucrose, 30% ethylene glycol in 0.1M phosphate buffer.
Tissues were rinsed with PBS and then 0.05% Triton X-100 in Tris-buffered saline (TBS+), followed by 0.5% Triton X-100 in TBS (TBST) for 30 min and incubation in 3% donkey serum in TBS+ for 30 min. The sections were then incubated in primary antibody overnight at 4oC. The sections were then rinsed with TBS+ and incubated in secondary antibody at room temperature for 2 hours. All brain sections were mounted in an aqueous medium.
For Nestin immunostaining and detection of EdU, tissues were subjected to antigen retrieval treatment by incubating the sections in boiled 0.1M citrate buffer and microwaved to keep buffer boiling for 7 min as previously described (Song et al., 2012). Sections were permeabilized in TBST for 20–30 min and then incubated in click reaction buffer (0.1 M Tris, 0.5–1 mM CuSO4, 30 μM 488/594 Alexa-azide, and 50–100 mM ascorbic acid) for 30 min for EdU labelling. Slides were then rinsed with TBS+, followed by similar immunostaining steps as described above.
Imaging
Coronal sections through the entire hippocampus were collected in a serial order. Images were acquired by Olympus FLUOVIEW1000 or Zeiss LSM780 confocal microscope, under 40x Oil (NA1.30), Z-resolution 1.0 or 1.5 μm/slice. Tiled images were acquired and stitched using Olympus FluoView or Zeiss Zen imaging software.
Slice Electrophysiology
Adult mice housed under standard conditions were used at 2–4 weeks post AAV injection for slice preparation. Animals were anesthetized under isoflurane and briefly perfused intracardially with 10 ml of ice-cold NMDG solution (Ting et al., 2014) containing (in mM): 92 NMDG, 30 NaHCO3, 25 glucose, 20 HEPES, 10 MgSO4, 5 sodium ascorbate, 3 sodium pyruvate, 2.5 KCl, 2 thiourea, 1.25 NaH2PO4, 0.5 CaCl2 (pH 7.3, 300 mOsm, bubbled with 95% O2 and 5% CO2). The brains were then quickly removed into additional ice-cold NMDG solution for slicing. Transverse slices were cut using a Leica VT1200S vibratome at 280 μm thickness, and warmed to 36.5°C for 10 minutes. Slices were transferred to room temperature (22–24°C) HEPES holding solution (Ting et al., 2014) containing (in mM): 92 NaCl, 30 NaHCO3, 25 glucose, 20 HEPES, 5 sodium ascorbate, 3 sodium pyruvate, 2.5 KCl, 2 thiourea, 2 MgSO4, 2 CaCl2, 1.25 NaH2PO4, (pH 7.3, 300 mOsm, bubbled with 95% O2 and 5% CO2) for 1 – 2 hours. Solutions intended for use with MC or PV recordings or for calcium imaging also contained 12 mM N-acetyl-L-cysteine in the NMDG and HEPES solutions to improve glutathione synthesis (Ting et al. 2014).
Electrophysiological recordings were obtained at 22–24°C in artificial CSF containing (in mM): 125 NaCl, 26 NaHCO3, 20 glucose, 2.5 KCl, 2 CaCl2, 1.3 MgCl2, 1.25 NaH2PO4, (pH 7.3, 300 mOsm, bubbled with 95% O2 and 5% CO2) on a Scientifica SliceScope. GFP+ neural stem cells within the sub-granule zone were visualized by DIC and fluorescence microscopy with a 40X water-dipping objective (LUMPlanFL N, 0.8; Olympus). Alternatively, subgranular YFP+ PV neurons, or hilar mCherry+ MCs were targeted for recordings. Microelectrodes (3–6 MΩ) were pulled from 1.5 mm diameter borosilicate glass capillaries (WPI) and filled with potassium based internal solution containing (in mM): 130 K-gluconate, 20 HEPES, 4 MgCl2, 4 Na-ATP, 2 NaCl, 0.5 EGTA, 0.4 Na-GTP (pH 7.3, 310 mOsm). To stimulate ChR2 in mossy-cell terminals, single light-pulses (1 or 5 s) or trains of 5 ms light-pulses (at 1 or 10 Hz) were generated by a pE-100 (CoolLED) 470 nm LED and triggered via TTL control through the acquisition software, illuminating the tissue through the 40X objective. Pharmacological agents (Tocris) were used at the following final concentrations in the bath as indicated: bicuculline (50 μΜ), muscimol (100 μΜ), glutamate (100 μΜ), NBQX (10 μΜ), APV (100 μΜ), TTX (1 μΜ), and 4-AP (40 μΜ). Bath-applied CNO was used at concentrations of 0.25–50 μΜ, but typically 10 μΜ. All other chemicals were purchased from Sigma. Data were collected using a Multiclamp 700B amplifier and digitized with a DigiData 1440A (Axon Instruments) at 10 kHz using pClamp10 software. The whole-cell patch-clamp configuration was employed in current-clamp mode (with I=0) to freely monitor membrane potential changes. Cell-attached recordings were made using filtered ACSF in the recording pipette, and collected in voltage-clamp mode with no applied holding voltage (V=0) and filtered at 6 kHz. Unstable whole-cell recordings (monitored by membrane test pulse) were excluded from analysis.
Ca2+ imaging
AAV-mediated DIO-GCaMP6f was selectively expressed in VGAT-Cre or PV-Cre mice, or with AAV-mediated DIO-GCaMP6s in 5htr2A-Cre mice. AAV-mediated GCaMP6s was expressed in C57BL/6 mice. Acute brain slices were prepared and observed as for electrophysiology. A CoolLED pE-100 at 470 nm was used for excitation, and GCaMP fluorescence was acquired through a standard GFP filter cube and captured with an Optimos sCMOS camera (Q-Imaging), using Micro Manager acquisition software. Image sequences were acquired at 100 to 500 ms frame rates with 6–7 focal-plane sections.
Electron Microscopy
6 adult male Nestin-GFP mice were used for immuno-electron microscopy. To examine contacts between rNSC and MC axons, mice were injected with AAV-CaMKII-eGFP. Mice were perfused with fixative (4% paraformaldehyde, w/v; 0.1% glutaraldehyde, v/v; in 0.1Μ phosphate buffer, PB; 10 min) and cut in 50 μm-thick coronal sections. Sections were cryoprotected, freeze-thawed 3 times and immunostained using the following antibodies: primary antibody (rabbit anti-NR1; Abcam, ab17345; 1:1000 or goat anti-GFP antibody, Vector Laboratories, BA0702; 1:1000) followed by the secondary antibody (goat anti-rabbit; 1:100; Nanoprobes, #2004; conjugated with 1.4 nm colloidal gold) followed by silver intensification (HQ Silver Kit; Nanoprobes) or avidin biotin peroxidase complex (ABC Elite; Vector Laboratories), followed by peroxidase reactions with 3, 3-diaminobenzidine (DAB; Vector Laboratories Kit).
All sections were washed in 0.1M PB, post-fixed with 1% osmium tetroxide in 0.1M PB and dehydrated in an ascending series of ethanol concentrations and acetone and then cured into resin. One hundred and twenty-four serial sections (70 nm thick) were cut, contrasted and observed using a Philips CM10 transmission electron microscope. Low magnification images (1,450×) were collected of each cell for each of the 124 sections and aligned for tracing and 3D reconstruction using Fiji ImageJ software. A sample of 10 sections, approximately 10 sections apart (700 nm) were selected for quantification of NR1 immunogold particles overlying peroxidase-labelled RGL stem cell processes. For these sections, processes of the RGL stem cell were captured at a higher magnification (5,800×) that allowed individual particles to be seen (approximately 5 images/section).
QUANTIFICATION AND STATISTICAL ANALYSIS
General
Mice from both genders were used for all experiments, as our previous studies have established that sex difference did not appear to contribute to observed statistical variation (Song et al., 2013; Song et al., 2012). Mouse identity and experimental manipulation were coded, and the quantifications and analysis were performed blindly by a single observer. Two-tailed unpaired Student’s t-test was used to examine statistical difference by using Graphpad Prism 7 (Graphpad Software) or Igor Pro (Wavemetrics) if not otherwise specified. Paired Student’s t-tests were use where appropriate. Wilcoxon Rank test was used when sample variances were unequal as determined in Igor Pro statistics package. For all experimental results, “n” represents the number of animals used unless otherwise specified and is reported in figure legends. Data throughout are presented as mean ± SEM. Significance was determined based on p< 0.05 (n.s: p > 0.05, not significant; * p < 0.05; ** p< 0.01; *** p < 0.001).
Cell quantification
Slide identities were blinded during quantification to avoid bias. For GluR2/3, GABA, c-Fos, Nestin-GFP, PV, Nestin/EdU, Tbr2/EdU, DCX/EDU, DCX, and EdU quantification, whole tilling DG images were acquired and quantified manually throughout z stacks.
Slice Electrophysiology
Electrophysiology traces were analyzed using a combination of the NeuroMatic package (by Jason Rothman, ThinkRandom.com) and custom built analysis routines, written for Igor Pro (Wavemetrics).
Ca2+ imaging
Ca2+ fluorescent signals were analyzed using NIH Image J software and custom procedures written in Igor Pro (Wavemetrics). The change in calcium signal was determined from surround subtracted regions of interest and converted into ΔF/F values (Jia et al., 2011). Quantification of calcium event frequency was determined using peak detection algorithms and manual thresholding in Igor Pro.
DATA AND SOFTWARE AVAILABILITY
ImageJ is an open source software for image analysis. FV10-ASW 4.2 viewer is available on Olympus website. Neuromatic Package for Igor Pro is freely available from ThinkRandom.com. All others are commercial software. See KEY RESOURCES TABLE for details.
Supplementary Material
Movie S1. Related to Figure 1). Rotation of 3D reconstruction showing rNSC processes (green) with apposing axons embedded into the side of the larger stem cell processes (warm colors); two of which are DAB-labelled hilar mossy cell axons (purple and orange).
Movie S2. Related to Figure 1). Rotation of 3D reconstruction showing an rNSC process (green) directly apposing a synapse formed by a DAB-labelled hilar mossy cell axon (orange) with the dendritic spine of a granule neuron dendrite (light blue). Another synapse between this axon and dendrite is also shown, which was not apposed by the labelled rNSC process.
Movie S3. Related to Figure 1). Rotation of 3D reconstruction showing an rNSC process (green) directly apposing a synapse formed by a DAB-labelled hilar mossy cell axon (purple) with the dendritic spine of a granule neuron dendrite (dark blue).
Movie S4. Related to Figure 1 and Figure S1). Rotation of 3D reconstruction showing NR1 gold particles in an entire rNSC.
Highlights.
MCs regulate NSCs through a balance between direct and indirect pathways
NSC quiescence is differentially regulated by distinct MC activity states
A small population of MCs exert a significant impact on NSC quiescence
MC loss leads to transient activation of NSCs followed by pool depletion
Acknowledgements
We thank members of Song lab for comments and discussions. This work was supported by grants awarded to J.S. from NARSAD (Brain and Behavior Research Foundation), American Heart Association, Whitehall Foundation, and NIH (MH111773, MH106939, AG058160). N.T., J.M., F.C. and E.G. were supported by funds from the Swiss National Science Foundation (Nb. 31003A_173128) and Synapsis Foundation.
Footnotes
Author contributions
J.S. conceived the project and wrote the manuscript. C.Y. led in vivo functional analysis and performed surgeries for all the experiments. B.A. led the electrophysiology and calcium imaging analysis. N.T. led EM and enriched environment experiments. C.Y., B.A., and N.T. wrote part of the manuscript; J.M. and N.T. performed EM; L.J.Q., T.H., and H.B. assisted experiments and analysis. F.C. and E.G. performed enriched environment experiments; X.M and W.L provided quintuple transgenic mice and assisted related experiments.
Declaration of Interests
The authors declare no competing interests.
Publisher's Disclaimer: This is a PDF file of an unedited manuscript that has been accepted for publication. As a service to our customers we are providing this early version of the manuscript. The manuscript will undergo copyediting, typesetting, and review of the resulting proof before it is published in its final citable form. Please note that during the production process errors may be discovered which could affect the content, and all legal disclaimers that apply to the journal pertain.
References
- Adesnik H, Li G, During MJ, Pleasure SJ, and Nicoll RA (2008). NMDA receptors inhibit synapse unsilencing during brain development. Proceedings of the National Academy of Sciences of the United States of America 105, 5597–5602. [DOI] [PMC free article] [PubMed] [Google Scholar]
- Buckmaster PS, Wenzel HJ, Kunkel DD, and Schwartzkroin PA (1996). Axon arbors and synaptic connections of hippocampal mossy cells in the rat in vivo. J Comp Neurol 366, 271–292. [DOI] [PubMed] [Google Scholar]
- Bui AD, Nguyen TM, Limouse C, Kim HK, Szabo GG, Felong S, Maroso M, and Soltesz I (2018). Dentate gyrus mossy cells control spontaneous convulsive seizures and spatial memory. Science 359, 787–790. [DOI] [PMC free article] [PubMed] [Google Scholar]
- Chancey JH, Poulsen DJ, Wadiche JI, and Overstreet-Wadiche L (2014). Hilar mossy cells provide the first glutamatergic synapses to adult-born dentate granule cells. The Journal of neuroscience : the official journal of the Society for Neuroscience 34, 2349–2354. [DOI] [PMC free article] [PubMed] [Google Scholar]
- Danielson NB, Turi GF, Ladow M, Chavlis S, Petrantonakis PC, Poirazi P, and Losonczy A (2017). In Vivo Imaging of Dentate Gyrus Mossy Cells in Behaving Mice. Neuron 93, 552–559 e554. [DOI] [PMC free article] [PubMed] [Google Scholar]
- Deshpande A, Bergami M, Ghanem A, Conzelmann KK, Lepier A, Gotz M, and Berninger B (2013). Retrograde monosynaptic tracing reveals the temporal evolution of inputs onto new neurons in the adult dentate gyrus and olfactory bulb. Proceedings of the National Academy of Sciences of the United States of America 110, E1152–1161. [DOI] [PMC free article] [PubMed] [Google Scholar]
- Gangarossa G, Longueville S, De Bundel D, Perroy J, Herve D, Girault JA, and Valjent E (2012). Characterization of dopamine D1 and D2 receptor-expressing neurons in the mouse hippocampus. Hippocampus 22, 2199–2207. [DOI] [PubMed] [Google Scholar]
- Gebara E, Bonaguidi MA, Beckervordersandforth R, Sultan S, Udry F, Gijs PJ, Lie DC, Ming GL, Song H, and Toni N (2016). Heterogeneity of Radial Glia-Like Cells in the Adult Hippocampus. Stem cells 34, 997–1010. [DOI] [PMC free article] [PubMed] [Google Scholar]
- GoodSmith D, Chen X, Wang C, Kim SH, Song H, Burgalossi A, Christian KM, and Knierim JJ (2017). Spatial Representations of Granule Cells and Mossy Cells of the Dentate Gyrus. Neuron 93, 677–690 e675. [DOI] [PMC free article] [PubMed] [Google Scholar]
- Gotz M (2018). Revising concepts about adult stem cells. Science 359, 639–640. [DOI] [PubMed] [Google Scholar]
- Grubb MS, and Burrone J (2010). Channelrhodopsin-2 localised to the axon initial segment. PloS one 5, e13761. [DOI] [PMC free article] [PubMed] [Google Scholar]
- Gu X, Zhou L, and Lu W (2016). An NMDA Receptor-Dependent Mechanism Underlies Inhibitory Synapse Development. Cell reports 14, 471–478. [DOI] [PMC free article] [PubMed] [Google Scholar]
- Hsu TT, Lee CT, Tai MH, and Lien CC (2016). Differential Recruitment of Dentate Gyrus Interneuron Types by Commissural Versus Perforant Pathways. Cerebral cortex 26, 2715–2727. [DOI] [PubMed] [Google Scholar]
- Hutchison MA, Gu X, Adrover MF, Lee MR, Hnasko TS, Alvarez VA, and Lu W (2017). Genetic inhibition of neurotransmission reveals role of glutamatergic input to dopamine neurons in high-effort behavior. Molecular psychiatry. [DOI] [PMC free article] [PubMed] [Google Scholar]
- Jia H, Rochefort NL, Chen X, and Konnerth A (2011). In vivo two-photon imaging of sensory-evoked dendritic calcium signals in cortical neurons. Nature protocols 6, 28–35. [DOI] [PubMed] [Google Scholar]
- Jinde S, Zsiros V, Jiang Z, Nakao K, Pickel J, Kohno K, Belforte JE, and Nakazawa K (2012). Hilar mossy cell degeneration causes transient dentate granule cell hyperexcitability and impaired pattern separation. Neuron 76, 1189–1200. [DOI] [PMC free article] [PubMed] [Google Scholar]
- Kuo CT, Mirzadeh Z, Soriano-Navarro M, Rasin M, Wang D, Shen J, Sestan N, Garcia-Verdugo J, Alvarez-Buylla A, Jan LY, et al. (2006). Postnatal deletion of Numb/Numblike reveals repair and remodeling capacity in the subventricular neurogenic niche. Cell 127, 1253–1264. [DOI] [PMC free article] [PubMed] [Google Scholar]
- Lu W, Bushong EA, Shih TP, Ellisman MH, and Nicoll RA (2013). The cell-autonomous role of excitatory synaptic transmission in the regulation of neuronal structure and function. Neuron 78, 433–439. [DOI] [PMC free article] [PubMed] [Google Scholar]
- Lu W, Shi Y, Jackson AC, Bjorgan K, During MJ, Sprengel R, Seeburg PH, and Nicoll RA (2009). Subunit composition of synaptic AMPA receptors revealed by a single-cell genetic approach. Neuron 62, 254–268. [DOI] [PMC free article] [PubMed] [Google Scholar]
- Mignone JL, Kukekov V, Chiang AS, Steindler D, and Enikolopov G (2004). Neural stem and progenitor cells in nestin-GFP transgenic mice. The Journal of comparative neurology 469, 311–324. [DOI] [PubMed] [Google Scholar]
- Moss J, Gebara E, Bushong EA, Sanchez-Pascual I, O’Laoi R, El M’Ghari I, Kocher-Braissant J, Ellisman MH, and Toni N (2016). Fine processes of Nestin-GFP-positive radial glia-like stem cells in the adult dentate gyrus ensheathe local synapses and vasculature. Proceedings of the National Academy of Sciences of the United States of America 113, E2536–2545. [DOI] [PMC free article] [PubMed] [Google Scholar]
- Moss J, and Toni N (2013). A circuit-based gatekeeper for adult neural stem cell proliferation: Parvalbumin-expressing interneurons of the dentate gyrus control the activation and proliferation of quiescent adult neural stem cells. BioEssays : news and reviews in molecular, cellular and developmental biology 35, 28–33. [DOI] [PubMed] [Google Scholar]
- Otis JM, Namboodiri VM, Matan AM, Voets ES, Mohorn EP, Kosyk O, McHenry JA, Robinson JE, Resendez SL, Rossi MA, et al. (2017). Prefrontal cortex output circuits guide reward seeking through divergent cue encoding. Nature 543, 103–107. [DOI] [PMC free article] [PubMed] [Google Scholar]
- Pilz GA, Bottes S, Betizeau M, Jorg DJ, Carta S, Simons BD, Helmchen F, and Jessberger S (2018). Live imaging of neurogenesis in the adult mouse hippocampus. Science 359, 658–662. [DOI] [PMC free article] [PubMed] [Google Scholar]
- Puighermanal E, Biever A, Espallergues J, Gangarossa G, De Bundel D, and Valjent E (2015). drd2-cre:ribotag mouse line unravels the possible diversity of dopamine d2 receptor expressing cells of the dorsal mouse hippocampus. Hippocampus 25, 858–875. [DOI] [PubMed] [Google Scholar]
- Renzel R, Sadek AR, Chang CH, Gray WP, Seifert G, and Steinhauser C (2013). Polarized distribution of AMPA, but not GABAA, receptors in radial glia-like cells of the adult dentate gyrus. Glia 61, 1146–1154. [DOI] [PubMed] [Google Scholar]
- Ribak CE, and Seress L (1983). Five types of basket cell in the hippocampal dentate gyrus: a combined Golgi and electron microscopic study. Journal of neurocytology 12, 577–597. [DOI] [PubMed] [Google Scholar]
- Rothman JS, and Silver RA (2018). NeuroMatic: An Integrated Open-Source Software Toolkit for Acquisition, Analysis and Simulation of Electrophysiological Data. Frontiers in neuroinformatics 12, 14. [DOI] [PMC free article] [PubMed] [Google Scholar]
- Scharfman HE (1995). Electrophysiological evidence that dentate hilar mossy cells are excitatory and innervate both granule cells and interneurons. Journal of neurophysiology 74, 179–194. [DOI] [PubMed] [Google Scholar]
- Scharfman HE (2016). The enigmatic mossy cell of the dentate gyrus. Nature reviews Neuroscience 17, 562–575. [DOI] [PMC free article] [PubMed] [Google Scholar]
- Scharfman HE, and Myers CE (2012). Hilar mossy cells of the dentate gyrus: a historical perspective. Frontiers in neural circuits 6, 106. [DOI] [PMC free article] [PubMed] [Google Scholar]
- Senzai Y, and Buzsaki G (2017). Physiological Properties and Behavioral Correlates of Hippocampal Granule Cells and Mossy Cells. Neuron 93, 691–704 e695. [DOI] [PMC free article] [PubMed] [Google Scholar]
- Shin J, Berg DA, Zhu Y, Shin JY, Song J, Bonaguidi MA, Enikolopov G, Nauen DW, Christian KM, Ming GL, et al. (2015). Single-Cell RNA-Seq with Waterfall Reveals Molecular Cascades underlying Adult Neurogenesis. Cell stem cell 17, 360–372. [DOI] [PMC free article] [PubMed] [Google Scholar]
- Sierra A, Martin-Suarez S, Valcarcel-Martin R, Pascual-Brazo J, Aelvoet SA, Abiega O, Deudero JJ, Brewster AL, Bernales I, Anderson AE, et al. (2015). Neuronal hyperactivity accelerates depletion of neural stem cells and impairs hippocampal neurogenesis. Cell stem cell 16, 488–503. [DOI] [PMC free article] [PubMed] [Google Scholar]
- Song J, Olsen RH, Sun J, Ming GL, and Song H (2016). Neuronal Circuitry Mechanisms Regulating Adult Mammalian Neurogenesis. Cold Spring Harbor perspectives in biology 8. [DOI] [PMC free article] [PubMed] [Google Scholar]
- Song J, Sun J, Moss J, Wen Z, Sun GJ, Hsu D, Zhong C, Davoudi H, Christian KM, Toni N, et al. (2013). Parvalbumin interneurons mediate neuronal circuitry-neurogenesis coupling in the adult hippocampus. Nature neuroscience 16, 1728–1730. [DOI] [PMC free article] [PubMed] [Google Scholar]
- Song J, Zhong C, Bonaguidi MA, Sun GJ, Hsu D, Gu Y, Meletis K, Huang ZJ, Ge S, Enikolopov G, et al. (2012). Neuronal circuitry mechanism regulating adult quiescent neural stem-cell fate decision. Nature 489, 150–154. [DOI] [PMC free article] [PubMed] [Google Scholar]
- Sternson SM, and Roth BL (2014). Chemogenetic tools to interrogate brain functions. Annual review of neuroscience 37, 387–407. [DOI] [PubMed] [Google Scholar]
- Tanaka KF, Samuels BA, and Hen R (2012). Serotonin receptor expression along the dorsal-ventral axis of mouse hippocampus. Philosophical transactions of the Royal Society of London Series B, Biological sciences 367, 2395–2401. [DOI] [PMC free article] [PubMed] [Google Scholar]
- Ting JT, Daigle TL, Chen Q, and Feng G (2014). Acute brain slice methods for adult and aging animals: application of targeted patch clamp analysis and optogenetics. Methods in molecular biology 1183, 221–242. [DOI] [PMC free article] [PubMed] [Google Scholar]
- Vivar C, Potter MC, Choi J, Lee JY, Stringer TP, Callaway EM, Gage FH, Suh H, and van Praag H (2012). Monosynaptic inputs to new neurons in the dentate gyrus. Nature communications 3, 1107. [DOI] [PMC free article] [PubMed] [Google Scholar]
- Yang CF, Chiang MC, Gray DC, Prabhakaran M, Alvarado M, Juntti SA, Unger EK, Wells JA, and Shah NM (2013). Sexually dimorphic neurons in the ventromedial hypothalamus govern mating in both sexes and aggression in males. Cell 153, 896–909. [DOI] [PMC free article] [PubMed] [Google Scholar]
Associated Data
This section collects any data citations, data availability statements, or supplementary materials included in this article.
Supplementary Materials
Movie S1. Related to Figure 1). Rotation of 3D reconstruction showing rNSC processes (green) with apposing axons embedded into the side of the larger stem cell processes (warm colors); two of which are DAB-labelled hilar mossy cell axons (purple and orange).
Movie S2. Related to Figure 1). Rotation of 3D reconstruction showing an rNSC process (green) directly apposing a synapse formed by a DAB-labelled hilar mossy cell axon (orange) with the dendritic spine of a granule neuron dendrite (light blue). Another synapse between this axon and dendrite is also shown, which was not apposed by the labelled rNSC process.
Movie S3. Related to Figure 1). Rotation of 3D reconstruction showing an rNSC process (green) directly apposing a synapse formed by a DAB-labelled hilar mossy cell axon (purple) with the dendritic spine of a granule neuron dendrite (dark blue).
Movie S4. Related to Figure 1 and Figure S1). Rotation of 3D reconstruction showing NR1 gold particles in an entire rNSC.