Abstract
To assess hyperacute focal cerebral ischemia in rats on 3.0-Tesla diffusion-weighted imaging (DWI), we developed a novel voxel-wise lesion segmentation technique that overcomes intra- and inter-subject variation in apparent diffusion coefficient (ADC) distribution. Our novel technique involves the following: (1) intensity normalization including determination of the optimal type of region of interest (ROI) and its intra- and inter-subject validation, (2) verification of focal cerebral ischemic lesions at 1 h with gross and high-magnification light microscopy of hematoxylin-eosin (H&E) pathology, (3) voxel-wise segmentation on ADC with various thresholds, and (4) calculation of dice indices (DIs) to compare focal cerebral ischemic lesions at 1 h defined by ADC and matching H&E pathology. The best coefficient of variation was the mode of the left hemisphere after normalization using whole left hemispheric ROI, which showed lower intra- (2.54 ± 0.72%) and inter-subject (2.67 ± 0.70%) values than the original. Focal ischemic lesion at 1 h after middle cerebral artery occlusion (MCAO) was confirmed on both gross and microscopic H&E pathology. The 83 relative threshold of normalized ADC showed the highest mean DI (DI = 0.820 ± 0.075). We could evaluate hyperacute ischemic lesions at 1 h more reliably on 3-Tesla DWI in rat brains.
Keywords: Brain ischemia, diffusion-weighted MRI, animal models, brain imaging, acute stroke
Introduction
The middle cerebral artery occlusion (MCAO) rat model is the most widely used animal model for investigating the pathophysiological mechanisms that underlie human brain injury after ischemic stroke and for developing effective therapeutic approaches to the disease.1,2 Diffusion-weighted imaging (DWI) of magnetic resonance imaging (MRI) can identify ischemic lesions with cytotoxic edema from very early on after MCAO, especially within the first 5–10 min after arterial occlusion.3 In addition, DWI can be used to visualize the location and volume of ischemic lesions and provide a temporal evolution of focal cerebral ischemia in the rat brain.2–4
Several quantitative DWI studies have used dedicated, small-bore, high Tesla (T) MRI scanners with strong gradient coils for evaluating small animals with experimental stroke; however, 3.0-T clinical MRI scanners can provide comparable spatial resolution with the use of small animal coils.4–6 However, the use of 3.0-T MRI scanners in quantitative DWI studies has some disadvantages, such as a prolonged scan time and scanner-dependent variation.7,8 The apparent diffusion coefficient (ADC) values of normal brain tissue and ischemic lesions in various animals have wide ranges, overlap, vary greatly over time and show inter-subject variation.7,8 The situation becomes complicated because ADC values in hyperacute (earlier than 2–3 h) focal cerebral ischemia have very wide ranges and overlap those of the normal brain. Additionally, time-consuming spatial resolution is needed to assess rat brain infarction with 3 T magnet, resulting in the decrease of SNR and the exacerbation of the situation. Therefore, to assess hyperacute focal cerebral ischemia in rats, multiple ADC maps should be normalized to overcome the substantial variations, but signal intensity normalization has rarely been attempted using T1- or T2-weighted imaging maps.9,10 This may be because ipsilateral focal lesions make normalization difficult, and complicated techniques should be required such as adjusting or matching histograms.11
To evaluate focal cerebral ischemic lesions on MRI, complex automatic or semi-automatic segmentation techniques are available, such as a multi-parametrical regression model, three-dimensional (3D) histograms of multi-modality imaging, and techniques based on tissue classifications;12–15 however, these techniques are not commonly used because of their limitations in acquiring perfusion maps or other time-consuming structural images in hyperacute studies. Threshold-derived pixel or voxel-wise segmentation based on ADC intensity is most commonly used.12,16,17 This technique uses a cut-off value of the ADC threshold (also known as the viable threshold, 530 (×10−6 mm2/s)),12,18–20 which has been verified by pathologic correlation studies using tetrazolium chloride (TTC) staining. The cut-off value of the ADC threshold of 530 reflects post-ischemic alterations after 12 to 24 h.12,21,22 Other pathologic staining can show hyperacute ischemic damage in rat brains at 2–4 h after MCAO.22,23 Especially for the hyperacute focal ischemic lesion on DWI (ADC map) very early after MCAO (within 1 h), a novel segmentation technique may be needed that has been validated by pathologic evidence. The present study observed that ischemic MCA territories in rats at 1 h after MCAO showed pallor areas on hematoxylin and eosin (H&E)-stained pathology, and we identified a valid, viable threshold that was correlated with H&E-stained pathology. Such a threshold has rarely been reported in previous work at this earlier hyperacute stage.
Here, we present a novel voxel-wise lesion segmentation technique for the assessment of hyperacute focal cerebral ischemia in rats at 1 h after MCAO on 3.0-T DWI, which was verified by gross and high-magnification light-microscopic examination of H&E pathology.
Materials and methods
Experimental animals and MCAO
This study was approved by the institutional review board for the care and use of animals. The data reporting is in compliance with the ARRIVE guidelines (www.nc3rs.org.uk/arriveguidelines). All housing conditions and experimental procedures were in accordance with the guidelines established by the Korea Research Institute of Bioscience and Biotechnology Institutional Animal Care and approved by the Korea Research Institute of Bioscience and Biotechnology Animal Care Committee.
Thirty-three Sprague-Dawley rats weighing between 290 and 350 g (eight weeks of age, healthy males, housed in pairs under standard conditions with a 12-h light/12-h dark cycle and ad libitum access to A04-10 pelleted diet and filtered tap water) were subjected to right MCAO using the intraluminal filament technique proposed by Koizumi et al.1 Anesthesia was induced by a 400-µL intramuscular injection of a 3:1 mixture of xylazine (Rompun®; Bayer, Leverkusen, Germany) and tiletamine and zolazepam (Zoletil®; Virbac, Carros, France) prior to surgery and MRI. We monitored physiological variables (respiration rate, heart rate, body temperature) during the surgical procedure and MR scanning. The respiratory rates were 65–82/min in 31 rats; two animals with extremely slow respiratory rate (20/min) expired during MRI (exclusion 1 in Figure 1).
Figure 1.
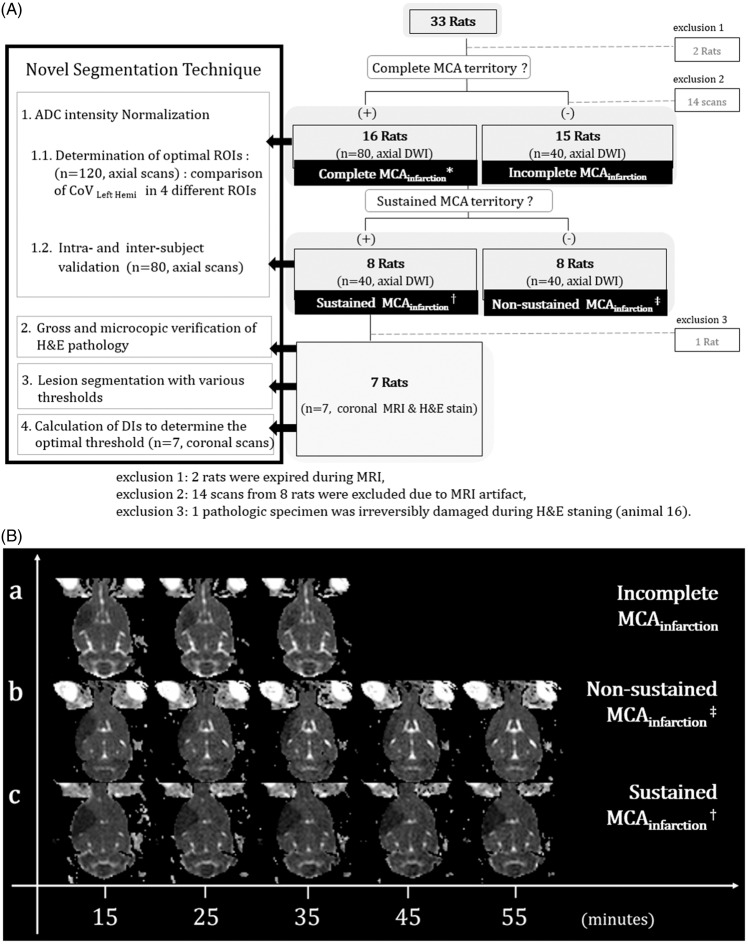
Schematic overview of our study. A: Axial DWI was repeated every 10 min until 55 min post-occlusion in 16 animals for which MCAO was classified as complete MCA territorial infarction (complete MCAinfarction*) involving the entire MCA territory. The MRI scan was ceased for 15 rats in which whole MCA territorial infarction was not maintained on three consecutive initial DWIs (incomplete MCAinfarction). Within the category complete MCAinfarction, sustained MCAinfarction† was observed in eight animals, which was defined as the maintenance of the ADC abnormal lesion involving the whole right MCA territory over five consecutive axial scans. Non-sustained MCAinfarction‡ was defined as non-maintenance of the lesion. Additional coronal MR scans of the sustained MCAinfarction group were obtained immediately following for pathological correlation. The four steps of the novel segmentation technique (left-hand black box) and post-hoc exclusions (bottom) are briefly described. B: Representative images of incomplete MCAinfarction (a), non-sustained MCAinfarction (b), and sustained MCAinfarction (c).
Each operation was performed with the rat on a heating pad. The right common carotid artery (CCA) was exposed through a midline incision of approximately 3 cm with the rat in the supine position. The right CCA, external carotid artery, and pterygopalatine artery were ligated sequentially with 4–0 sutures, and a 4–0 silicon-coated nylon filament (diameter of the distal 5-mm segment was between 0.35 to 0.40 mm) was introduced into the distal CCA and advanced to block the bifurcation of the internal carotid artery (ICA) preventing from the collateral blood flow from the contralateral side through the circle of Willis.
MRI data acquisition and patterns of MCA territorial infarction
A 3T MRI system (Philips Healthcare, Best, The Netherlands) with a 5-cm inner diameter animal coil and a 4-channel phased array design (Chenguang Medical Technology, China) were used to image the brains of 31 rats. A schematic overview of the study design with post-hoc exclusions is shown in Figure 1(A).
The MRI parameters were as follows: b values, 0 and 1000; field of view, 50 × 50 mm; matrix size, 128 × 128; repetition time/echo time, 4000/60; number of excitations, 32; voxel resolution, 0.39 × 0.39 × 2 mm. Immediately after each DWI scan, the ADC values were calculated using the standard equation
The axial DWI was acquired at 15 min after MCAO and every 10 min thereafter until 55 min. DWIs were interpreted by visual inspection with the consensus of three neuroradiologists (SHC, CHC, and KSY). Sustained MCA territorial infarction (MCAinfarction) was defined when the ADC abnormal lesion involving whole right MCA territory was detected on the first MR scan and maintained during five consecutive axial scans. We declared non-sustained MCAinfarction if the lesion changed over the consecutive MRIs. When the ADC abnormal lesion did not involve whole right MCA territory (on the first three consecutive MRI scans, the lesion was classified as incomplete MCAinfarction), further MR scanning was stopped. Among 31 rats, 8 were classified as sustained MCAinfarction, 8 non-sustained MCAinfarction, and 15 incomplete MCAinfarction (Figure 1).
Additionally, coronal DWIs (slice thickness, 2 mm) of eight animals in the sustained MCAinfarction were obtained to compare with the matching pathological results (H&E stain) for the verification of our novel segmentation technique. In total, 120 axial and 8 coronal diffusion MR images were included from the 31 rats, and 14 of 134 axial scans from 8 rats were excluded due to MR artifact (exclusion 2 in Figure 1). All data sets from MRI were transferred to a workstation (Intel Carework How-4100, i7 quad core CPU, Ubuntu 12.04 LTS) and converted to the 3D-NIFTI (Neuroimaging Informatics Technology Initiative) format using dcm2niigui (MRIcron, http://www.mccauslandcenter.sc.edu/mricro/mricron/).
H&E pathology at 1 hour after MCAO
Immediately after the final MRI data acquisition under anesthesia, eight rats were sacrificed by trans-cardiac perfusion with ice-cold heparinized saline after withdrawing the intraluminal suture, followed by perfusion with 10% neutral buffered formalin (NBF). The brains were harvested and immersed in NBF for post-fixation. The brains were subsequently sectioned coronally into 2-mm-thick slices using a rodent brain matrix for comparison with the coronal DW images. Blocks were embedded in paraffin, and 6-µm-thick sections from each block were stained with H&E. The pathologic specimen from animal 16 was irreversibly damaged during the staining procedure and excluded (exclusion 3 in Figure 1(A)).
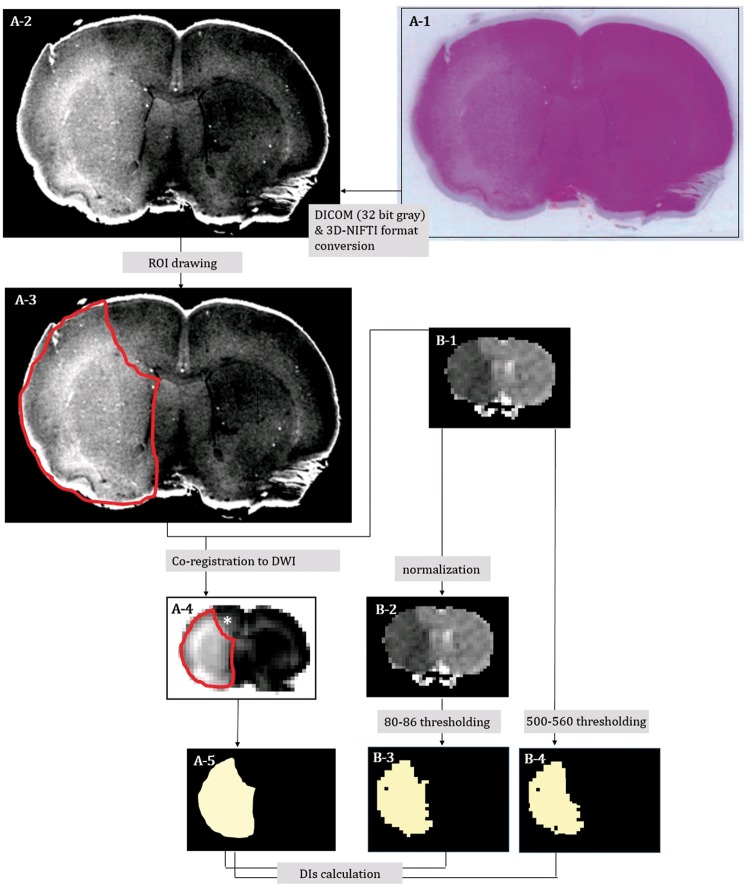
For comparison with the coronal DW images (using Dice indices (DIs)24,25), the H&E pathology data were converted to 3D-NIFT format as follows (Figure 2): (1) The H&E-stained slides from seven animals were captured using a digital scanner (Epson Perfection V33, Indonesia, 600 dpi) (Figure 2(A-1)). (2) All the images captured were aligned, stacked and transformed into 2D-DICOM (Digital Imaging and Communications in Medicine) format (32-bit gray scale using ImageJ software (http://imagej.nih.gov/ij/)) and into 3D NIFTI format by dcm2niigui (Figure 2(A-2)).
Figure 2.
Digitalization of the hematoxylin-eosin (H&E) pathologic slide and co-registration onto matching coronal ADC map images in representative animal 5; H&E pallor in the gross pathology slide (A-1) was more evident in the digitalized image (converted to 3D-NIFTI format via 32-bit gray DICOM) (A-2). H&E pallor ROI on the digital pathology was manually defined as the red-line area (A-3). Coronal ADC map image (B-1: ADCoriginal) was selected as a reference, and the ROI on the digital H&E pathology was co-registered onto the ADC map image (A-4) and binarized (A-5). The hyper-intense area (* in A-4) appeared only after co-registration. ADCoriginal (B-1) was normalized (B-2: ADCnormalized). Then, we segmented the focal ischemic lesion ROIs of coronal DWI (in seven of the eight rats) with gradually differing thresholds (80–86 relative thresholds (THRrelative) of ADCnormalized and 500–560 absolute thresholds (THRabsolute) of ADCoriginal) and binarized them (B-3 and B-4).
Details of the novel segmentation technique and its validation
For processing, we used the Oxford Centre for Functional Magnetic Resonance Imaging of the Brain software library (FSL) (http://fsl.fmrib.ox.ac.uk/fsl/fslwiki/,v5.0) and the Analysis of Functional NeuroImages software package (http://afni.nimh.nih.gov/afni/). Statistical analysis was performed using version 18.0 of SPSS for Windows (SPSS, Inc., Chicago, Illinois, USA).
Our novel lesion segmentation technique was developed with the following steps (black box in Figure 1(A)): (1) intensity normalization, including determination of the optimal type of region of interest (ROI) and its intra- and inter-subject validation; (2) verification of focal cerebral ischemic lesions with gross and high-magnification light microscopy of (×400) H&E pathology; (3) voxel-wise segmentation on ADC with various thresholds; and (4) calculation of DIs comparing focal cerebral ischemic lesions defined by ADC and matching H&E pathology to determine the optimal threshold.
ADC intensity normalization
All voxel intensity values in an animal were normalized to the percentage of the mode of the whole left hemisphere in the most valid region of interest (ROI). We quantified the matching ability of histogram peaks using the coefficient of variation (%) (=100 ×STD/mean) of the mode of the left hemispheres (CoVLt.Hemi).
Determination of the optimal ROI for normalization
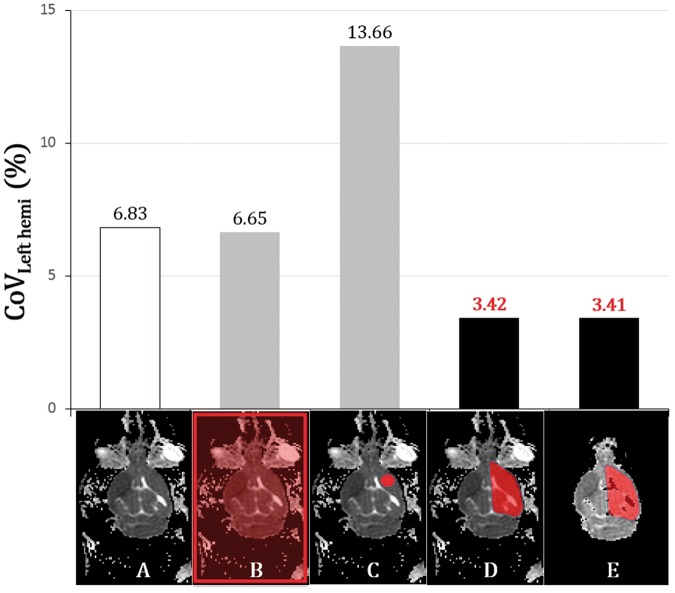
We calculated the modes using four different ROIs (Figure 3): (1) whole-field ROI including all the image area, (2) largest circular ROI in the left hemisphere by manual drawing (CSF & parenchymal boundary excluded), (3) ROI including the whole left hemisphere (by manual drawing at the left hemisphere, which was referenced to the interhemispheric fissure excluding the anterior olfactory brain and cerebellum), and (4) ROI including the whole left hemisphere with removal of background noise and CSF (with masking using a binarized time minimum-intensity map among the time series). The normalized ADCs (ADCnormalized) were calculated using the following equation (computed by 3dcalc of AFNI)
Figure 3.
Four types of ROIs on a representative ADC map (animal 1) and comparison of the mean of CoVLeft hemi in the 120 scans. An original axial ADC image at 15 min (A) showed background noise and CSF. Four different ROIs (B–E) were superimposed: (B)whole-field ROI; (C) largest circular ROI in the left hemisphere by manual drawing, CSF and parenchymal boundary excluded; (D) ROI including the whole left hemisphere with background noise and CSF; and (E) ROI including the whole left hemisphere without background noise and CSF. The bar graph shows that normalization with the whole left hemispheric ROI yielded the best result regardless of the removal of background noise and CSF.
Briefly, 120 axial scans were normalized to the percentages of the modes of 4 different ROIs. After normalization, we compared the mean of CoVLeft hemi (n = 120) in the 31 rats to determine the most optimal ROI (one-way ANOVA, p < 0.01).
Intra- and inter-subjective validation of normalization using the optimal ROI
Sixteen rats (80 left hemispheres) that underwent five consecutive DWIs were chosen to validate normalization using the optimal ROI. Compared were the CoVLeft hemi across five time points in each animal (intra-subject) and across eight different animals at each time point (inter-subject) (paired t-test, p < 0.01).
Gross and microscopic H&E pathology of focal cerebral ischemia at 1 hour after MCAO
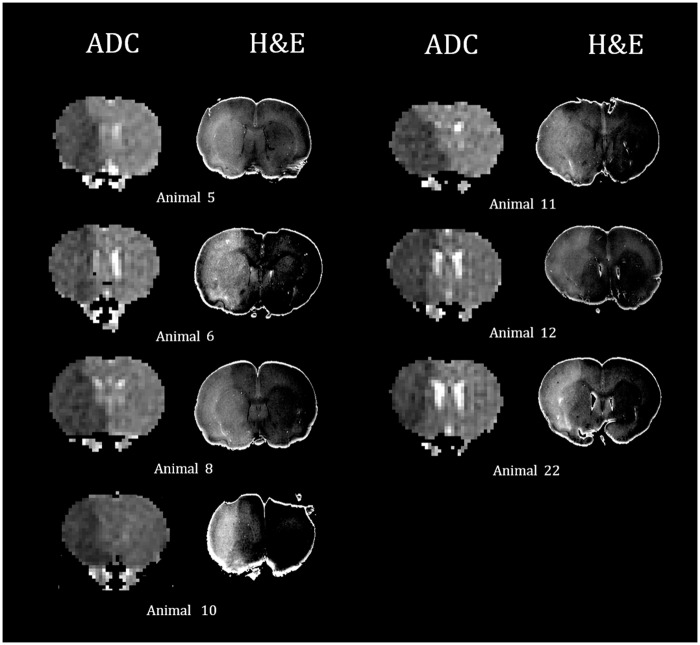
In all seven animals, at 1 h after MCAO, sustained ischemic lesions in the MCA territories (sustained MCAinfarction) were observed on the coronal ADC maps (Figure 2(B-1)), as well as the corresponding H&E pallor areas on gross pathologic slides (Figure 2(A-2)). High-magnification (×400) light microscopy investigations were performed to study the morphology of the damaged brain tissue cells.22,23,26,27 Each H&E pallor area on 3D-NIFTI format was manually segmented based on the consensus of two neuroradiologists (CHC and KSY) using MRIcro (http://www.mccauslandcenter.sc.edu/crnl/mricro) (Figure 2(A-3)). Each segmented lesion ROI was downscaled and co-registered onto the ADC maps (Figure 2(A-4) using FLIRT (FMRIB's Linear Image Registration Tool, http://fsl.fmrib.ox.ac.uk/fsl/fslwiki/FLIRT) and then binarized (Figure 2(A-5) for a 3D correlation study of the pathology and in vivo DWI.28
Voxel-wise segmentation of focal cerebral ischemia at 1 hour after MCAO on DWI: Relative thresholding vs absolute thresholding
The ADCoriginal (Figure 2(B-1)) was normalized to ADCnormalized (Figure 2(B-2)). Next, we segmented the focal ischemic lesion ROIs of coronal DWI (in seven of the eight rats) with gradually differing thresholds (80–86 relative thresholds (THRrelative) of ADCnormalized and 500–560 absolute thresholds (THRabsolute) of ADCoriginal and binarized them (Figure 2(B-3, 4)). THRrelative was visually investigated after segmentation with thresholds of 65 to 90, and then the range was narrowed to 80 to 86.
Calculation of DIs and determination of the optimal segmentation threshold
To determine the most valid threshold, each segmented lesion was binarized, and the spatial overlaps between the segmented lesions on DWI and matching H&E pathology were compared using the DI. The DI is a statistic used to assess the similarity of two samples.24,25 In each of seven experimental animals, we used it to compare the spatial overlap similarity between the segmented DWI lesion (80–86 THRrelative and 500–560 THRabsolute) and the abnormal H&E pallor area using the following formula
A: H&E pallor area, B: Segmented DWI lesion
, and were also binarized, and DIs were calculated by fslmaths and fslstats within FSL. The first and the last coronal scans of each coronal volume were excluded to avoid a partial volume error. Each of the relative and absolute thresholding values with the best DIs were statistically tested (paired t-test, n = 7, p < 0.01).
Results
Intensity normalization: Determination of the optimal type of ROI and its validation
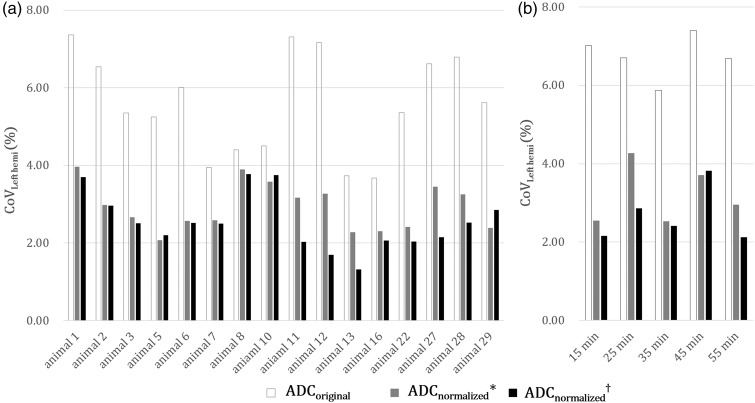
Among the four ROIs, the CoVLeft hemi of the whole left hemispheric ROI was the best (4.31%); however, there was no significant difference regardless of whether background noise and CSF were removed (n = 120, axial scans) (Figure 3). ADCnormalized showed lower CoVLeft hemi across the time series within each animal (intra-subject, 2.54 ± 0.72%) and across different animals within each time point (inter-subject, 2.67 ±0.70%) than ADCoriginal (intra-subject, 5.60 ± 1.28%; inter-subject, 6.74 ± 0.56%) (n = 80, p < 0.01) (Figure 4). These results indicate that our technique rescaled the original ADC histogram to realign the peaks.
Figure 4.
Bar graphs showing the validation results of the normalization procedure using the whole left hemispheric ROI in 80 left hemispheres of 16 rats. ADCnormalized with (*) or without the removal of background noise and CSF (†) showed significantly lower CoVLeft hemi than did ADCoriginal across the time series within each animal (a, intra-subjective) and across different animals within each time (b, inter-subjective) (paired t-test, p < 0.01).
High-magnification light microscopy of the H&E pallor area
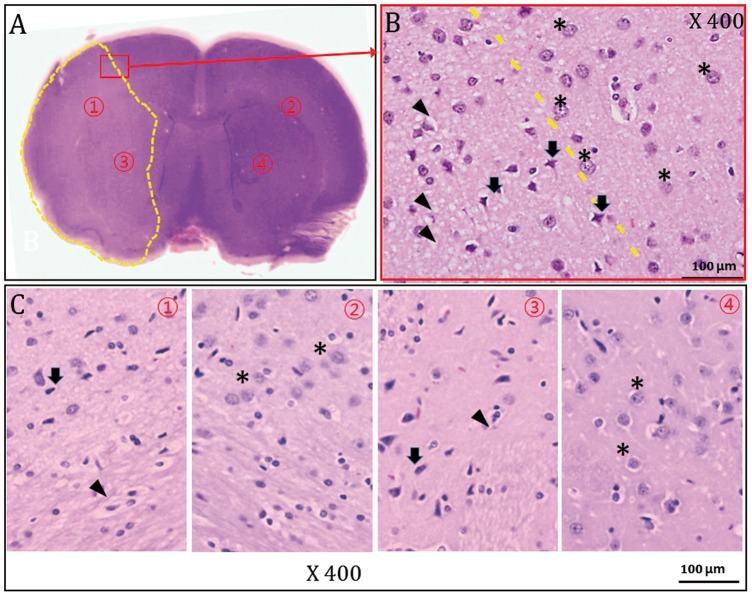
Seven animals (7/8) that sustained MCAinfarction within 1 h after MCAO evidently showed pallor area on H&E-stained gross pathology (Figure 5). High-magnification (×400) light microscopy demonstrated many pyknotic nuclei and vacuolated cytoplasms in the H&E pallor areas, and we could differentiate areas of ischemic damage from normal the brain tissue (Figure 6).
Figure 5.
Representative ADC images and matching digitalized images of gross H&E pathology after converting to 3D-NIFTI format. In seven animals at 1 h after permanent MCAO, diffusion restrictive lesions and corresponding pallor areas were clearly demonstrated in the whole right MCA territories. Artificial boundaries in the digitized H&E slides were made by automatic segmentation processing from the background.
Figure 6.
Gross and high-magnification light-microscopic findings of H&E pathology 1 h after MCAO (representative animal 5). The H&E-stained slide clearly demonstrated a pallor area corresponding to the right MCA territorial ischemic lesion (A). (B) The high-magnification (×400) image of the area outlined in red in (A) shows different cellular morphology of both the damaged (arrows) and normal regions (asterisks). (C)High-magnification images (×400) of ischemic regions (① and ③ in (A)) and contralateral non-ischemic areas (② and ④ in (A)). Note the many pyknotic nuclei (arrows) and vacuolated cytoplasms (arrows) in the H&E pallor area ((B) and (C) ①, ③).
Voxel-wise segmentation and DI calculation to determine the optimal threshold
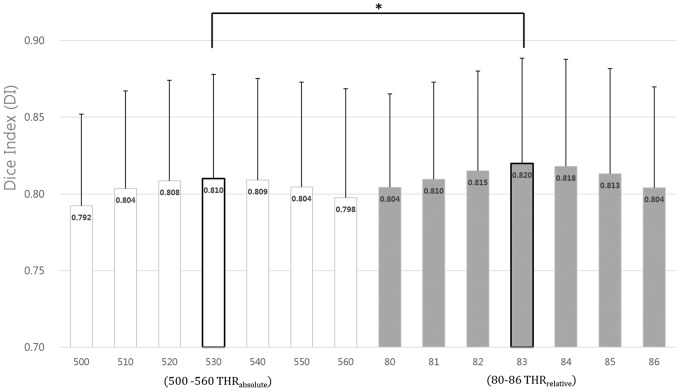
Among the THRrelative DIs, the mean obtained with a threshold of 83 (DI = 0.820 ± 0.075) was best.
530 THRabsolute (×10−6 mm2/s) had the best DI (0.810 ± 0.074) among the absolute thresholding ADC values (Supplementary Table). The segmented lesion with 83 THRrelative was more congruous with H&E pathology than when using 530 THRabsolute (paired t-test, p < 0.05) (Figure 7).
Figure 7.
Results of DI calculation to determine the optimal threshold for the segmentation. The mean DI with 83 THRrelative and 530 THRabsolute (DI = 0.820 ± 0.075, 0.810 ± 0.074) was the best mean DI. Focal cerebral ischemic lesion of ADC map at 1 h post MCAO segmented with 83 THRrelative was more congruous with H&E pathology than when using 530 THRabsolute (*p < 0.01, paired t-test).
Discussion
We normalized multiple ADC maps to reduce intra- and inter-subject variations and segmented abnormal hyperacute ADC lesions using the absolute and relative thresholds, which were validated by H&E pathology.
Intensity normalization of ADC map images on 3-T DW-MRI
Our ADC data showed intra- and inter-subject variation in the absence of normalization (Figure 5), which is consistent with previous reports.7,8 Sasaki et al.7 reported a 4 to 9% variation depending on the MRI machines, vendors, field strengths, and other factors. In small animal research, these scanner-dependent variations could be exacerbated with 3.0-T clinical MRI machines. To the author’s knowledge, intensity normalization of the ADC map images, particularly in cases of focal ischemic lesions in a rat brain, has been rarely attempted, possibly because ipsilateral focal lesions make intensity normalization difficult. Other techniques, such as Gaussian or Z-score normalization,29 rescale and adjust histogram widths; however, ADCs already had aligned histogram widths. The mean value normalization, which used the mean of contralateral ROIs, could also be changed depending on the means across multiple scans. Recently, Robben et al.11 normalized ADC maps in stroke patients using the voxel-wise, cross-subject, histogram equalization technique. The concept of this technique was partly in line with our study; however, they constrained the thresholding out of voxels higher than 90% of the entire histogram, which may have produced errors in our data (due to variations of extreme value).
To assess the focal cerebral infarction spatiotemporally, we used the mode value of the non-lesional contralateral left hemisphere as the novel reference to normalize and aligned the histogram peaks (Supplementary Figure). Our normalization method was validated step-wise and could significantly downsize the CoVLt.Hemi (Figure 4).
Determination of the optimal ROI
Our data showed that the mode in the whole left hemisphere with the removal of background noise and CSF signal yielded the best results. We normalized ADC maps with the modes of four different ROIs (Figure 4) and attempted to determine which ROI type was the most valid to compute the correct mode. Entire images may be contaminated by background noise, and a small contralateral ROI may not be representative of an entire brain region.
Digitalization of H&E pathology
We converted digital pictures of the pathological studies to 3D NIFTI format for the pathologic correlation of abnormal ADC lesions. 3D pathologic correlation using deformable transformation was reported, which provided a 1- to 2-mm level of accuracy in prostatic cancer.28 The 3D pathology correlation was made by creating a counterpart within the same reference space between digital pictures of slides and anatomical images contrary to their affine registration. We used rigid registration to avoid affecting the true space. H&E pallor areas were manually defined in the digitalized 3D H&E pathology by the consensus of two radiologists, and reliability was independently reanalyzed by two observers blinded to seven cases in random fashion. Calculated intra- and inter-rater intraclass correlation coefficients were all above 0.9.
H&E pathology of focal cerebral ischemia at 1 hour after MCAO
The H&E pallor area showed many pyknotic nuclei and vacuolated cytoplasms on high-magnification (×400) light-microscopic views (Figure 6). To the best of our knowledge, we are the first to report that the area of H&E pallor corresponds to DWI MR at 1 h after stroke, and no previous studies have verified hyperacute infarction at 1 h post MCAO using neuroimaging techniques.
H&E- or TTC-stained focal ischemic lesions in MCAO rats have been commonly used as a gold standard.21,22 While TTC staining reflected post-ischemic alterations after 12 to 24 h,21,22 H&E staining is well known to show both early and late (3–4 h to seven days) pathology.30,31 Slight H&E pallor in caudoputamen or patchy pallor in MCA territory had been reported after 30 min of MCAO in Wistar rats.32 Despite the early hyperacute findings indicating that H&E was imperfect,31 H&E pallor areas corresponded very well to DWI lesions at 1 h after MCAO in our study because we selected the eight animals using prospective DW-MRIs. They had sustained MCAinfarction for 55 min with diffusion–perfusion matched conditions.33 Nissl and MAP2 (microtubule-associated protein 2) stains may have helped demonstrate this,31 but these were not included in this study.
ADC reversibility and its pathologic findings have been reported.34 However, we excluded diffusion penumbrae and selected infarction cases. Thus, we consistently observed the diffusion lesions and the corresponding H&E pallor in all seven animals. Considering those results, we intentionally attempted to select eight animals with sustained MCAinfarction over five prospective repeated DWIs. We regarded final abnormal diffusion lesion at 55 min after MCAO as irreversible infarction.27,35
The rate of sustained MCAinfarction was low (8/34, 24%), and a relatively high number of incomplete MCA infarctions may indicate the volatility of the method used by our study; additionally, prospective DW-MRIs were necessary to select the sustained group.36,37 Moreover, incomplete MCAinfarction suggested partial occlusions and non-sustained MCAinfarction suggested reperfusion of the MCA perhaps due to movement of the filament or collateral flows;36 however, their histopathologic diagnoses were not pursued in the present study. This can be achieved by staining techniques such as amino-cupric silver stain38 or electron microscopy,39 which could show hyperacute infarction at 1 h post MCAO. Comparison of those techniques and further pathological investigations is warranted.
Dice index
To test the similarity between the segmentation results and the pathological study, we used DIs, which are known by several other names, including the Sørensen index or Dice's coefficient;24,25 “similarity coefficient”, “index”, and other variations are also used. The DIs is applied in many brain segmentation studies as a measure for the correctly classified lesion area relative to the total area of the reference and the area of the segmented image.
Because a large number of voxels were used in this study for testing the 3D voxel-wise assessment, we chose DIs to address spatial overlap and 3D configuration rather than classification accuracy (ROC analysis) or pixel numbers (mutual information).40 DI values of the similarity of the segmentation results at various thresholds are provided in Supplementary Table. Notably, the first and last coronal scans of every volume were excluded in the DIs comparison to avoid errors caused by the distortion of pathology in our study.
Optimal segmentation threshold: 83 THRrelative vs 530 THRabsolute
The 530 THRabsolute was the most valuable among the absolute thresholds without intensity normalization, which was correlated with previous result.12,18–20 The 530 THRabsolute was validated by TTC staining after 24 h of MCAO,12,18–20 and TTC has been used in acute and hyperacute stroke assessment. However, the threshold based on numerical volume correlation with pathology12 and the ADC variations in signal intensity7,8 on each diffusion MRI scan were too large to be segmented en bloc. In our data, the absolute thresholds with the best DI also varied according to inter-subjectively (Supplementary Table).
The relative 83 THRrelative was more congruous with H&E than when using the 530 THRabsolute. The 83 indicates a 17% reduction relative to the mode of contralateral hemispheres. The relative thresholds of 77 to 90% of the mean or two standard deviation (STD) below at the counterpart ROI in the contra-lesional hemisphere have been used.13,41,42 However, the mean ADC also varied, and STDs widened under different experimental conditions. We found the mode of contralateral hemispheres to be superior, perhaps because the mode was not influenced by the extreme ADC value (noise or CSF).
Without normalization processing across multiple scans, the 530 THRabsolute was the most valuable absolute threshold in acute and hyperacute stroke assessment. However, our 83 THRrelative will be more beneficial if there are intra- and inter-subject variations in the hyperacute stroke experiments. Further, since the validity of our method is questionable in later time points after the stroke, additional research is warranted to justify the method.
Limitations and applicable implementations
Due to the limitation of scan time, the z-resolution of the ADC maps (2 mm in thickness) was low, unlike the x- or y- resolutions. For the accurate spatial assessment of cerebral lesions, iso-cubic voxels or 3D imaging is needed; however, we had to trade z-axis resolution for scan time limitations. This trade-off may represent a confound for ischemic lesion segmentation because of the inevitable partial volume artifacts and quantification errors. Iso-voxel or 3D volume images should be considered for further studies. The use of DICOM-converted digital pathology is a well-accepted concept in image processing, and we used rigid registration to not affect the true space. However, quantitative errors may have occurred when the H&E pathology (high-resolution) was co-registered onto the coronal DWI (low-resolution). Finally, only seven experimental animals were used for the correlation analysis with H&E-stained pathology. However, in all seven animals at 1 h, gross and 400× high-magnification light-microscopic examination clearly showed evidence of ischemic damage, which was consistent with the DWI findings.
With our novel method, experimental hyperacute stroke can be reliably assessed at different locations using the same model with a 3.0-T MRI machine or different models if dedicated animal coils are available. The development of large-animal stroke models has been reported, which have several obvious advantages over rodent models.43,44 Although larger brains can provide greater neuroimaging resolution, intra- and inter-subject variation in ADC intensity on DWI persists. Our technique may help reduce such variation. High-field animal magnets can allow the accurate and reliable spatiotemporal assessment of experimental stroke due to the inherently high SNR, to overcome inter-subject variations in ADC intensity on DWI.45–47 Thus, our method of intensity normalization and segmentation using relative thresholds can be beneficial for high-field MRI systems in assessing hyperacute experimental stroke in animal models.
Conclusion
Our novel voxel-wise lesion segmentation technique for hyperacute focal cerebral ischemia in rats on 3.0-T DWI enables the reliable spatiotemporal evaluation of ischemic lesions. If spatiotemporal assessment of hyperacute focal cerebral ischemia is attempted in different experimental DWI settings, our step-wise procedure of DWI post-processing and H&E pathology validation can be applied as the most reproducible data analysis.
Supplementary Material
Acknowledgements
The authors are grateful for the efforts of Ms. Mihee Song and Mr. Hyeon-Gu Yeo.
Funding
The author(s) disclosed receipt of the following financial support for the research, authorship, or publication of this article: A research grant from the Korea Research Institute of Bioscience and Biotechnology (KRIBB) Research Initiative Program KGM4611714, the Bio & Medical Technology Development Program of the NRF funded by the Korean government, MSIP (NRF2016M3A9B6903268), and the Technology Innovation Program (10067787) funded by the Ministry of Trade, industry & Energy, Republic of Korea.
Declaration of conflicting interests
The author(s) declare no potential conflicts of interest with respect to the research, authorship, or publication of this article.
Authors’ contributions
CHC, KSY, SRL, SSC, HJL, CHL and SHC contributed to the study design. KSY, CYJ, YJL, SRL, SSC, HJL, and SHC performed the experiments. CHC and JWH contributed to data acquisition and analysis. CHC, KSY, SRL, CHL and SHC contributed to preparing the manuscript.
Supplementary material
Supplementary material for this paper can be found at the journal website: http://journals.sagepub.com/home/jcb
References
- 1.Koizumi J, Yoshida Y, Nakazawa T, et al. Experimental studies of ischemic brain edema, I. Jpn J Stroke 1986; 8: 1–8. [Google Scholar]
- 2.Belayev L, Zhao W, Pattany PM, et al. Diffusion-weighted magnetic resonance imaging confirms marked neuroprotective efficacy of albumin therapy in focal cerebral ischemia. Stroke 1998; 29: 2587–2599. [DOI] [PubMed] [Google Scholar]
- 3.Gerriets T, Stolz E, Walberer M, et al. Middle cerebral artery occlusion during MR-imaging: investigation of the hyperacute phase of stroke using a new in-bore occlusion model in rats. Brain Res Brain Res Protoc 2004; 12: 137–143. [DOI] [PubMed] [Google Scholar]
- 4.Linn J, Schwarz F, Schichor C, et al. Cranial MRI of small rodents using a clinical MR scanner. Methods 2007; 43: 2–11. [DOI] [PubMed] [Google Scholar]
- 5.Yang YM, Feng X, Yao ZW, et al. Magnetic resonance angiography of carotid and cerebral arterial occlusion in rats using a clinical scanner. J Neurosci Methods 2008; 167: 176–183. [DOI] [PubMed] [Google Scholar]
- 6.Pfefferbaum A, Adalsteinsson E, Sullivan EV. In vivo structural imaging of the rat brain with a 3-T clinical human scanner. J Magn Reson Imaging 2004; 20: 779–785. [DOI] [PubMed] [Google Scholar]
- 7.Sasaki M, Yamada K, Watanabe Y, et al. Variability in absolute apparent diffusion coefficient values across different platforms may be substantial: a multivendor, multi-institutional comparison study. Radiology 2008; 249: 624–630. [DOI] [PubMed] [Google Scholar]
- 8.Braithwaite AC, Dale BM, Boll DT, et al. Short- and midterm reproducibility of apparent diffusion coefficient measurements at 3.0-T diffusion-weighted imaging of the abdomen. Radiology 2009; 250: 459–465. [DOI] [PubMed] [Google Scholar]
- 9.Nyúl LG, Udupa JK, Zhang X. New variants of a method of MRI scale standardization. IEEE Trans Med Imaging 2000; 19: 143–150. [DOI] [PubMed] [Google Scholar]
- 10.Bedekar D, Jensen T, Schmainda KM. Standardization of relative cerebral blood volume (rCBV) image maps for ease of both inter- and intrapatient comparisons. Magn Reson Med 2010; 64: 907–913. [DOI] [PMC free article] [PubMed] [Google Scholar]
- 11.Robben D, Christiaens D, Rangarajan JR, et al. A Voxel-wise, cascaded classification approach to ischemic stroke lesion segmentation. In: Proceedings of the ISLES challenge, International Workshop on Brain lesion: Glioma, Multiple Sclerosis, Stroke and Traumatic Brain Injuries, Munich, German, 5–9 October 2015, pp. 254–265. Switzerland: Springer International Publishing.
- 12.Shen Q, Meng X, Fisher M, et al. Pixel-by-pixel spatiotemporal progression of focal ischemia derived using quantitative perfusion and diffusion imaging. J Cereb Blood Flow Metab 2003; 23: 1479–1488. [DOI] [PMC free article] [PubMed] [Google Scholar]
- 13.Kabir Y, Dojat M, Scherrer B, et al. Multimodal MRI segmentation of ischemic stroke lesions. In: 29th annual international conference of the IEEE engineering in medicine and biology society, Lyon, France, 22–26 August 2007, pp.1595–1598. New York: IEEE. [DOI] [PMC free article] [PubMed]
- 14.Braun J, Bernarding J, Koennecke H, et al. Feature-based, automated segmentation of cerebral infarct patterns using T 2- and diffusion-weighted imaging. Comput Methods Biomech Biomed Eng 2002; 5: 411–420. [DOI] [PubMed] [Google Scholar]
- 15.Pham DL, Xu C, Prince JL. Current methods in medical image segmentation. Annu Rev Biomed Eng 2000; 2: 315–337. [DOI] [PubMed] [Google Scholar]
- 16.Thijs VN, Adami A, Neumann-Haefelin T, et al. Relationship between severity of MR perfusion deficit and DWI lesion evolution. Neurology 2001; 57: 1205–1211. [DOI] [PubMed] [Google Scholar]
- 17.Bardutzky J, Shen Q, Henninger N, et al. Differences in ischemic lesion evolution in different rat strains using diffusion and perfusion imaging. Stroke 2005; 36: 2000–2005. [DOI] [PMC free article] [PubMed] [Google Scholar]
- 18.Liu JR, Jensen-Kondering UR, Zhou JJ, et al. Transient filament occlusion of the middle cerebral artery in rats: does the reperfusion method matter 24 hours after perfusion? BMC Neurosci 2012; 13: 154. [DOI] [PMC free article] [PubMed] [Google Scholar]
- 19.Belayev L, Zhao W, Pattany PM, et al. Diffusion-weighted magnetic resonance imaging confirms marked neuroprotective efficacy of albumin therapy in focal cerebral ischemia. Stroke 1998; 29: 2587–2599. [DOI] [PubMed] [Google Scholar]
- 20.Petty MA, Neumann-Haefelin C, Kalisch J, et al. In vivo neuroprotective effects of ACEA 1021 confirmed by magnetic resonance imaging in ischemic stroke. Eur J Pharmacol 2003; 474: 53–62. [DOI] [PubMed] [Google Scholar]
- 21.Back T, Hemmen T, Schüler OG. Lesion evolution in cerebral ischemia. J Neurol 2004; 251: 388–397. [DOI] [PubMed] [Google Scholar]
- 22.Sun L, Kuroiwa T, Ishibashi S, et al. Two region-dependent pathways of eosinophilic neuronal death after transient cerebral ischemia. Neuropathology 2009; 29: 45–54. [DOI] [PubMed] [Google Scholar]
- 23.Jacobs MA, Knight RA, Soltanian-Zadeh H, et al. Unsupervised segmentation of multiparameter MRI in experimental cerebral ischemia with comparison to T2, diffusion, and ADC MRI parameters and histopathological validation. J Magn Reson Imaging 2000; 11: 425–437. [DOI] [PubMed] [Google Scholar]
- 24.Sørensen T. A method of establishing groups of equal amplitude in plant sociology based on similarity of species and its to analyses of the vegetation on Danish commons. Kongelige Danske Videnskabernes Selskab 1948; 5: 1–34. [Google Scholar]
- 25.Dice LR. Measures of the amount of ecologic association between species. Ecology 1945; 26: 297–302. [Google Scholar]
- 26.Spratt NJ, Donnan GA, McLeod DD, et al. ‘Salvaged’ stroke ischaemic penumbra shows significant injury: studies with the hypoxia tracer FMISO. J Cereb Blood Flow Metab 2011; 31: 934–943. [DOI] [PMC free article] [PubMed] [Google Scholar]
- 27.Li F, Liu KF, Silva MD, et al. Transient and permanent resolution of ischemic lesions on diffusion-weighted imaging after brief periods of focal ischemia in rats: correlation with histopathology. Stroke 2000; 31: 946–954. [DOI] [PubMed] [Google Scholar]
- 28.Orczyk C, Rusinek H, Rosenkrantz AB, et al. Preliminary experience with a novel method of three-dimensional co-registration of prostate cancer digital histology and in vivo multiparametric MRI. Clin Radiol 2013; 68: e652–e658. [DOI] [PMC free article] [PubMed] [Google Scholar]
- 29.Ellingson BM, Zaw T, Cloughesy TF, et al. Comparison between intensity normalization techniques for dynamic susceptibility contrast (DSC)-MRI estimates of cerebral blood volume (CBV) in human gliomas. J Magn Reson Imaging 2012; 35: 1472–1477. [DOI] [PubMed] [Google Scholar]
- 30.Sun L, Kuroiwa T, Ishibashi S, et al. Two region-dependent pathways of eosinophilic neuronal death after transient cerebral ischemia. Neuropathology 2009; 29: 45–54. [DOI] [PubMed] [Google Scholar]
- 31.Zille M, Farr TD, Przesdzing I, et al. Visualizing cell death in experimental focal cerebral ischemia: promises, problems, and perspectives. J Cereb Blood Flow Metab 2012; 32: 213–231. [DOI] [PMC free article] [PubMed] [Google Scholar]
- 32.Garcia JH, Liu KF, Ho KL. Neuronal necrosis after middle cerebral artery occlusion in Wistar rats progresses at different time intervals in the caudoputamen and the cortex. Stroke 1995; 26: 636–43. [DOI] [PubMed] [Google Scholar]
- 33.Shen Q, Meng X, Fisher M, et al. Pixel-by-pixel spatiotemporal progression of focal ischemia derived using quantitative perfusion and diffusion imaging. J Cereb Blood Flow Metab 2003; 23: 1479–1488. [DOI] [PMC free article] [PubMed] [Google Scholar]
- 34.Minematsu K, Li L, Sotak CH, et al. Reversible focal ischemic injury demonstrated by diffusion-weighted magnetic resonance imaging in rats. Stroke 1992; 23: 1304–1310. [DOI] [PubMed] [Google Scholar]
- 35.Ringer TM, Neumann-Haefelin T, Sobel RA, et al. Reversal of Early diffusion-weighted magnetic resonance imaging abnormalities does not necessarily reflect tissue salvage in experimental cerebral ischemia. Stroke 2001; 32: 2362–2369. [DOI] [PubMed] [Google Scholar]
- 36.Gerriets T, Stolz E, Walberer M, et al. Complications and pitfalls in rat stroke models for middle cerebral artery occlusion: a comparison between the suture and the macrosphere model using magnetic resonance angiography. Stroke 2004; 35: 2372–2377. [DOI] [PubMed] [Google Scholar]
- 37.Yi K, Lee H, Lee S, et al. Identification of hyperacute ischemic stroke with a more homogenous nature. Transl Neurosci 2014; 5: 123–130. [Google Scholar]
- 38.de Olmos JS, Beltramino CA, de Olmos de Lorenzo S. Use of an amino-cupric-silver technique for the detection of early and semiacute neuronal degeneration caused by neurotoxicants, hypoxia, and physical trauma. Neurotoxicol Teratol 1994; 16: 545–561. [DOI] [PubMed] [Google Scholar]
- 39.Galluzzi L, Aaronson SA, Abrams J, et al. Guidelines for the use and interpretation of assays for monitoring cell death in higher eukaryotes. Cell Death Differ 2009; 16: 1093–1107. [DOI] [PMC free article] [PubMed] [Google Scholar]
- 40.Zou KH, Wells WM, III, Kikinis R, et al. Three validation metrics for automated probabilistic image segmentation of brain tumours. Stat Med 2004; 23: 1259–1282. [DOI] [PMC free article] [PubMed] [Google Scholar]
- 41.Olah L, Wecker S, Hoehn M. Secondary deterioration of apparent diffusion coefficient after 1-hour transient focal cerebral ischemia in rats. J Cereb Blood Flow Metab 2000; 20: 1474–1482. [DOI] [PubMed] [Google Scholar]
- 42.Hoehn-Berlage M, Norris DG, Kohno K, et al. Evolution of regional changes in apparent diffusion coefficient during focal ischemia of rat brain: the relationship of quantitative diffusion NMR imaging to reduction in cerebral blood flow and metabolic disturbances. J Cereb Blood Flow Metab 1995; 15: 1002–1011. [DOI] [PubMed] [Google Scholar]
- 43.Boltze J, Förschler A, Nitzsche B, et al. Permanent middle cerebral artery occlusion in sheep: a novel large animal model of focal cerebral ischemia. J Cereb Blood Flow Metab 2008; 28: 1951–1964. [DOI] [PubMed] [Google Scholar]
- 44.Yi KS, Choi CH, Lee SR, et al. Sustained diffusion reversal with in-bore reperfusion in monkey stroke models: confirmed by prospective magnetic resonance imaging. J Cereb Blood Flow Metab 2017; 37: 2002–2012. [DOI] [PMC free article] [PubMed]
- 45.Zhan L, Mueller BA, Jahanshad N, et al. Magnetic Resonance Field strength effects on diffusion measures and brain connectivity networks. Brain Connect 2013; 3: 72–86. [DOI] [PMC free article] [PubMed] [Google Scholar]
- 46.Huisman TA, Loenneker T, Barta G, et al. Quantitative diffusion tensor MR imaging of the brain: field strength related variance of apparent diffusion coefficient (ADC) and fractional anisotropy (FA) scalars. Eur Radiol 2006; 16: 1651–1658. [DOI] [PubMed] [Google Scholar]
- 47.Choi S, Cunningham DT, Aguila F, et al. DTI at 7 and 3 T: systematic comparison of SNR and its influence on quantitative metrics. Magn Reson Imaging 2011; 29: 739–751. [DOI] [PubMed] [Google Scholar]
Associated Data
This section collects any data citations, data availability statements, or supplementary materials included in this article.


