

Summary
How remote enhancers interact with appropriate target genes persists as a central mystery in gene regulation. Here we exploit the properties of transvection to explore enhancer-promoter communication between homologous chromosomes in living Drosophila embryos. We successfully visualized the activation of an MS2-tagged reporter gene by a defined developmental enhancer located in trans on the other homolog. This trans-homolog activation depends on insulator DNAs, which increase the stability—but not frequency—of homolog pairing. A pair of heterotypic insulators failed to mediate transvection, raising the possibility that insulator specificity underlies the formation of chromosomal loop domains. Moreover, we found that a shared enhancer co-activates separate PP7 and MS2 reporter genes in cis and in trans. Transvecting alleles weakly compete with one another, raising the possibility that they share a common pool of the transcription machinery. We propose that insulators establish stable trans-homolog associations, providing “hubs” for the conglomeration of transcription factors.

Assembly of transcription “hub” drives coordinated expression
Introduction
Enhancers are short segments of genomic DNA (typically ~100 bp to ~1 kb in length) that switch genes on and off in response to a variety of intrinsic and external signals. The human genome is thought to contain on the order of ~400,000 enhancers (ENCODE, 2012), an average of nearly 20 enhancers per protein coding gene. There is emerging evidence that sequence polymorphisms in enhancer DNAs represent a major source of population diversity and predilection to disease (e.g. Abraham et al., 2017; Indjeian et al., 2016). And yet, we do not understand how enhancers work over long distances to stimulate transcription at select target genes.
The phenomenon of transvection in Drosophila provides an intriguing model for analyzing enhancer-promoter interactions. Transvection was discovered by E.B. Lewis in 1954 in the course of his groundbreaking studies on the Ultrabithorax (Ubx) locus of the Bithorax complex (Lewis, 1954). He found that certain Ubx alleles are able to complement one another via transvection. Subsequent molecular studies suggested that this complementation is best explained by regulatory sequences on one homolog controlling the expression of the cognate transcription unit on the other homolog (Peifer and Bender, 1986). In this study, we sought to explore the molecular mechanisms underlying this regulatory communication between homologous chromosomes in living embryos.
Studies of transvection at Ubx and other genetic loci identified a number of properties that influence trans-homolog regulatory interactions, including chromosome pairing, promoter competition, and insulators (reviewed in Fukaya and Levine, 2017). Chromosomal inversions that disrupt pairing cause reductions in transvection at the Ubx locus (Lewis, 1954), although an unusual pairing-independent transvection process was documented at the Abdominal-B (Abd-B) locus (Hendrickson and Sakonju, 1995; Hopmann et al., 1995). Insulators positioned near transvecting alleles have been shown to augment the efficiency of trans-homolog interactions, possibly by facilitating stable chromosome pairing (Kravchenko et al., 2005). Finally, enhanced transvection was observed upon removal of nearby cis-linked promoters (Geyer et al., 1990; Martínez-Laborda et al., 1992), suggesting that enhancers on one homolog can more easily activate gene expression in trans on the other homolog when they are not impeded by proximal cis-linked promoters.
In this study, we visualized transvection in living Drosophila embryos. A well-defined developmental enhancer was placed in trans to a lacZ reporter gene containing a series of MS2 stem loops, permitting detection of nascent transcripts using an MCP-GFP fusion protein (Bertrand et al., 1998; Garcia et al., 2013; Lucas et al., 2013). Trans-activation of the MS2-lacZ reporter is observed in early embryos only when insulators are inserted into both alleles. Evidence is presented that insulators increase the stability, but not frequency, of homolog pairing. Different classes of insulators display distinct orientation requirements, and transvection is not observed with a pair of heterotypic insulators. We also show that a shared enhancer can co-activate a cis-linked PP7 reporter gene along with a trans-linked MS2 reporter gene. We propose that transvecting alleles form a trans-homolog “hub”, which serves as a scaffold for the conglomeration of transcription complexes.
Results
Insulators facilitate transvection
Site-directed integration was used to insert the well-defined snail (sna) shadow enhancer in trans to a lacZ reporter gene at the same location on homologous chromosomes (Figure 1A; top). The ~1.5-kb enhancer mediates stable expression in ~800-1000 cells comprising the presumptive mesoderm of early embryos (Figure S1A and B) (Dunipace et al., 2011; Perry et al., 2010). The lacZ reporter gene contains the minimal 100-bp even-skipped (eve) core promoter as well as 24 copies of the MS2 RNA stem loop sequence within the 5′ untranslated region (UTR). In situ hybridization assays were used to monitor expression of lacZ mRNAs. No significant expression was observed either in the absence of an insulator (Figure 1A), or upon insertion of a single copy of the minimal 432 bp gypsy insulator (Figure 1B). However, expression was observed when gypsy insulators were placed on both homologs, upstream of the sna shadow enhancer and MS2-lacZ reporter gene, respectively (Figure 1C). Reporter transcripts were detected in about 3-4% of the cells comprising the sna expression pattern within the presumptive mesoderm (Figure 1D). Importantly, trans-activation of the MS2 reporter gene was observed with different core promoters, transcription units, and genetic organization (Figure S1C and D). Insulators were placed adjacent to the enhancer since this configuration is commonly seen for endogenous loci that are active in the early embryo, including eve and fushi tarazu (ftz) (e.g. Fujioka et al. 2013).
Figure 1. A pair of gypsy insulators mediates transvection.

(A-C) Double fluorescent in situ hybridizations of lacZ (green) and endogenous sna (red). The lacZ reporter gene contains the 100-bp minimal eve promoter and 24x MS2 RNA stem loops within the 5′ UTR. Embryos at late nc 14 are shown. Images were rotated to align embryos (anterior to the left and posterior to the right).
(A) sna shadow enhancer is not sufficient to activate lacZ transcription in trans. Scale bar represents 50 μm.
(B) A single gypsy insulator cannot mediate trans-activation of the lacZ reporter.
(C) Insertion of gypsy insulators on both alleles facilitates trans-activation of lacZ transcription.
(D) Cumulative fraction of transvecting nuclei in the presumptive mesoderm cells. Trans-activation of MS2-lacZ reporter gene was visualized with MCP-GFP fusion protein in living embryos. gypsy insulators are positioned in the same orientation as shown in (C). A total of 1151 (1119 inactive, 32 active) nuclei from three independent embryos were analyzed. Error bars represent ± the standard error of the mean of three independent embryos. See also Figure S1.
These observations are consistent with previous reports that homolog pairing is inefficient in early embryos as compared with later stages of the Drosophila life cycle (Gemkow et al., 1998; Hiraoka et al., 1993). This might be due to the slow rate of homolog pairing during the brief interphase periods that characterize the early embryo. In principle, gypsy insulators could facilitate trans-activation of MS2-lacZ by increasing the frequency or stability of homolog pairing. Previous genetic studies of transvection at the yellow locus suggest that insulators increase the efficiency of trans-homolog interactions (Kravchenko et al., 2005).
Different classes of insulators
To explore the contributions of insulators to transvection, we manipulated the orientation of gypsy, and examined the activities of additional insulators (Figure 2). The gypsy insulator contains a highly ordered structure, with each of the 12 Suppressor of Hairy-wing (Su(Hw)) binding sites spanning the insulator positioned in the same orientation (Spana et al., 1988). Past studies have shown that insulators do not pair when placed in the same orientation in cis on the same chromosome (Kyrchanova et al., 2008). However, inverting one of the gypsy insulators did not diminish trans-activation of the MS2-lacZ reporter gene (Figure 2A and B), raising the possibility of distinct mechanisms for insulator interactions in cis and in trans.
Figure 2. Orientation-dependent and -independent insulator pairing.
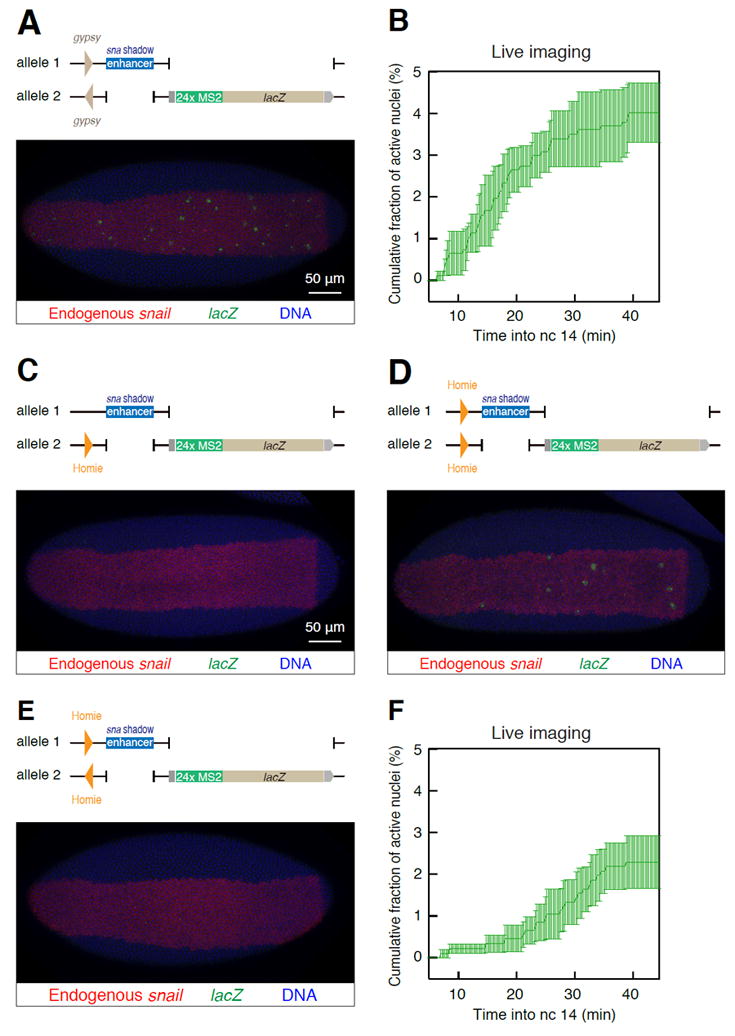
(A) Insertion of gypsy insulators in the opposite orientation can facilitate trans-activation of the lacZ reporter. Scale bar represents 50 μm.
(B) Cumulative fraction of transvecting nuclei in the presumptive mesoderm cells. gypsy insulators are positioned in the opposite orientation as shown in (A). A total of 916 (879 inactive, 37 active) nuclei from three independent embryos were analyzed. Error bars represent the ± standard error of the mean of three independent embryos.
(C) A single Homie insulator cannot mediate trans-activation of the lacZ reporter. Scale bar represents 50 μm.
(D) Homie insulators on both homologs positioned in the same orientation facilitates trans-activation of the lacZ reporter.
(E) A pair of Homie insulators positioned in the opposite orientation fails to mediate trans-activation of the lacZ reporter.
(F) Cumulative fraction of transvecting nuclei in the presumptive mesoderm cells. Homie insulators are positioned in the same orientation as shown in (D). A total of 980 (958 inactive, 22 active) nuclei from three independent embryos were analyzed. Error bars represent ± the standard error of the mean of three independent embryos. See also Figure S2.
We next examined the Homie insulator, which is located at the 3′ boundary of the endogenous eve locus (Fujioka et al., 2009; Fujioka et al., 2013). Homie is bound by Su(Hw), but unlike gypsy, it is also recognized by another insulator-binding protein CCCTC-binding factor (CTCF), which is highly conserved in vertebrates (Nègre et al., 2010). Homie insulators mediate a low rate of transvection when placed in the same orientation (Figure 2D and F), but not when positioned in opposing orientations (Figure 2E), similar to control embryos containing just a single Homie insulator (Figure 2C). This dependence on orientation is consistent with previous studies (Fujioka et al., 2013).
The gypsy and Homie insulators do not mediate transvection when placed in trans to one another (Figure S2A-C). This observation raises the possibility of separate classes of insulators: those that are bound by either Su(Hw) alone, or both Su(Hw) and CTCF. A third insulator, Fab-8, was also tested in this assay. It is bound by CTCF, but not Su(Hw) (Gerasimova et al., 2007). We examined a ~5 kb DNA fragment from the Abd-B transvection mediating region (tmr), which contains the Fab-8 insulator (Hopmann et al., 1995; Zhou et al., 1999). This tmr fragment also mediates trans-activation of the MS2 reporter gene, although expression is slightly delayed as compared with the timing observed for the gypsy and Homie insulators (Figure S2D-F). These observations raise the possibility that different classes of insulators mediate distinct kinetics of homolog interactions.
Stabilization of homolog pairing
It is possible that insulators facilitate transvection by increasing either the frequency or stability of homolog pairing. To address this question, we analyzed sna>lacZ alleles marked with either PP7 or MS2 in living embryos (Fukaya et al., 2016; Hocine et al., 2013) (Figure 3A). Most nuclei do not exhibit pairing, whether or not the two alleles contain gypsy insulators (Figure 3B-D, Figure S3A-D, Movie S1). Nuclei exhibiting pairing were divided into three classes based on the duration of association: 1-5 min, 5-10 min, and 10 min or more. Approximately 20% of these nuclei display pairing of sna>lacZ alleles whether there are two copies of gypsy or just one (control) (Figure 3H and I, Movie S2). Almost half of these nuclei correspond to the most stable class of pairing (10 min or more) with two copies of gypsy, but there is a two-fold reduction with a single copy. Thus, gypsy-gypsy interactions lead to a two-fold increase in stable pairing, and it is likely that this is important for transvection.
Figure 3. gypsy insulators foster stable homolog pairing.

(A) Schematic representation of the lacZ reporter genes containing the 100-bp minimal eve promoter, the 1.5-kb sna shadow enhancer, the 432-bp gypsy insulator and 24x MS2 or 24x PP7 RNA stem loops within the 5′ UTR.
(B) 3D tracking of MS2-lacZ (green) and PP7-lacZ (red) transcription foci in a nucleus that exhibits allelic separation throughout nc 14. An ellipsoid with 4 μm short-axis radius and 7 μm long-axis radius was plotted as a proxy for the shape of the nucleus at mid nc 14. Location of MS2 and PP7 alleles are indicated as spheres with 0.5 μm radii to represent uncertainty in the spatial resolution in the z-axis.
(C, D) Cumulative traces of MS2-lacZ (green) and PP7-lacZ (red) transcription foci during early (5 min to 29.9 min; C) and late nc 14 (30.1 min to 54.6 min; D) in the nucleus shown in (B).
(E) 3D tracking of MS2-lacZ (green) and PP7-lacZ (red) transcription foci in a nucleus that undergoes stable homolog pairing at the midpoint of nc 14. Note the association of the two alleles during later stages of nc 14.
(F, G) Cumulative traces of MS2-lacZ (green) and PP7-lacZ (red) transcription foci during early phases of nc 14 when the two alleles are unpaired (5.0 min to 29.5min; F) and later stages when paired (29.7 min to 54.6 min; G) in the nucleus shown in (E).
(H, I) The pairing efficiency across nuclei (H) and the distribution of the duration of homolog pairing in those nuclei exhibiting pairing (I). The most salient impact of two copies of gypsy is the doubling in the frequency of the most stably paired alleles (from ~4% in controls to ~9% with a pair of gypsy insulators). A total of 1135 and 936 nuclei from three independent embryos were analyzed for single gypsy and two gypsy, respectively. Error bars represent ± the standard error of the mean of three independent embryos. See also Figure S3.
To determine how this frequency of stable pairing compares to endogenous loci, we examined the pairing of ftz alleles (Figure S3E and F). ftz is located within the Antennapedia complex, which exhibits a variety of transvection phenomena (e.g. Southworth and Kennison, 2002). Moreover, ftz contains well-defined SF1 and SF2 insulators (Belozerov et al., 2003; Li et al., 2015). MS2 and PP7 stem loops were inserted into the 3′ UTR of each ftz allele using CRISPR-directed genome editing, and their activities were monitored in living embryos during nuclear cycle (nc) 14. There is an overall higher frequency of transient pairing as compared with the sna>lacZ transgenes (Figure S3E). However, stable pairing is seen in ~9% of all nuclei examined (Figure S3F), similar to the proportion of nuclei exhibiting stable pairing of the synthetic alleles. We therefore conclude that our transvection assay captures critical properties of the endogenous pairing process.
Co-activation in trans
An unresolved mystery of transvection is the relative levels of expression of the cis and trans transcription units when regulated by a shared enhancer. Does the enhancer on one homolog have equal access to target genes located on both homologs? To address this question, we created a co-transvection assay, whereby a single enhancer is challenged with both a cis-linked PP7 reporter gene as well as the MS2 reporter gene in trans (Figure 4A).
Figure 4. A shared enhancer can co-activate two reporter genes in cis and trans.

(A) Schematic representation of the transvection assay. The lacZ reporter gene contains the 100-bp minimal eve promoter and 24x MS2 or 24x PP7 RNA stem loops within the 5′ UTR. The 1.5-kb sna shadow enhancer was placed upstream of the PP7-lacZ reporter gene. The 432-bp minimal gypsy insulators were placed in both alleles to facilitate transvection.
(B) Representative trajectories of MS2-lacZ (green) and PP7-lacZ (red) transcriptional activity in a nucleus that displays transvection. Another example is shown in Figure S4.
(C) Snapshots of the maximum projected images of a representative transvecting nucleus within a living embryo. MS2 and PP7 activities were visualized with MCP-GFP (green) and mCherry-PCP (red). Nuclei were visualized with His2Av-eBFP2 (blue). Scale bar indicates 5 μm. The insets are magnifications of the transcription foci within the central nucleus. Images were processed to remove background fluorescence and enhance signals. Signal trajectories from the raw image are shown in (B). Minutes into nc 14 are indicated above each panel.
(D) 3D tracking of MS2-lacZ (green) and PP7-lacZ (red) transcription foci in the transvecting nucleus shown in (B, C).
(E) Cumulative traces of MS2-lacZ (green) and PP7-lacZ (red) transcription foci during transvection in the nucleus shown in (B-D). The plot spans from 24.5 min to 39.9 min. There is stable association of the two alleles during transvection. See also Figure S4, Figure S5 and Figure S6.
In most transvecting nuclei, the initial bursts of de novo transcription arise solely from the cis-linked PP7 reporter gene during the first 15-20 min following mitosis. Based on the kinetics of allele pairing (Figure 3E-G, Movie S2), we believe that this delay is due to a lag in pairing, which typically occurs 10-20 min after mitosis. Alternatively, the shared enhancer may prefer the cis-linked promoter due to its proximity (see Discussion). Following this delay, there is a high incidence of co-activation of the two reporter genes (Figure 4B and C, Figure S4A and B, Movie S3). During transvection, the two alleles exhibit tight association, although the signals do not completely coincide with one another (Figure 4C-E, Figure S4B-D, Figure S5, Movie S4 and S5). It is therefore possible that trans-activation of the MS2 reporter gene depends on proximity, rather than direct physical contact with the shared enhancer (see Discussion). Importantly, trans-activation was nearly abolished when the MS2 and PP7 alleles were inserted at non-homologous locations (Figure S6), suggesting that activation in trans depends on sequence homology of paired alleles.
Co-activation of the linked PP7 and MS2 reporter genes in cis and in trans is somewhat surprising since it suggests that they share “common resources” despite their location on different homologs. Further validation was obtained by statistical analysis, comparing the coordination of PP7 and MS2 reporter genes containing either a single shared enhancer (Figure 5A and B) or two separate enhancers (Figure 5C and D). There is a clear statistical trend: transvecting reporter genes sharing a common enhancer display significantly greater coordination in expression as compared with those containing separate enhancers (Mann-Whitney-U test, p < 1.5 × 10⁻⁷; Figure 5E, Figure S7A-C). This is consistent with the idea that the two alleles share a local pool of the transcription machinery during transvection (see below).
Figure 5. Coordinated transcription across homologous chromosomes.

(A) Schematic representation of the MS2-lacZ and PP7-lacZ reporter genes containing gypsy insulators. Only the PP7-lacZ reporter gene contains the sna shadow enhancer.
(B) Representative trajectory of MS2-lacZ (green) and PP7-lacZ (red) transcriptional activity. These reporters were placed under the control of a shared enhancer as shown in (A).
(C) Schematic representation of the MS2-lacZ and PP7-lacZ reporter genes containing gypsy insulators and separate sna shadow enhancers.
(D) Representative trajectory of MS2-lacZ (green) and PP7-lacZ (red) transcriptional activity. These reporter genes were placed under the control of separate enhancers as shown in (C).
(E) The distribution of correlation coefficients between MS2-lacZ and PP7-lacZ transcription activities during transvection (red) or under the control of separate enhancers (blue). A total of 99 and 883 nuclei from four and three independent embryos were analyzed, respectively. Both histograms were plotted with a bin width of 0.1. These two distributions were found to be significantly different (p < 1.5 × 10⁻⁷, Mann-Whitney-U test). See also Figure S7.
Allele competition during transvection
To explore this idea of “shared resources” during transvection, we measured the timing and amplitudes of MS2 transcription in the absence (Figure 6A) or presence (Figure 6C) of a linked PP7 reporter gene. There is a significant reduction in the amplitude of MS2 transcription in the presence of PP7 (Mann-Whitney-U test, p < 0.001; Figure 6B and D, Figure S7D). Moreover, there is a delay in the timing of MS2 transcription within a subset of transvecting nuclei (Figure 6E and F, Movie S6). As discussed earlier, most transvecting nuclei display a delay in the onset of trans-activation, possibly due to a lag in allele pairing (Figure 3) or preferential activation of the cis-linked reporter gene. However, in the absence of the cis-linked PP7 reporter, ~10% of transvecting nuclei show precocious activation of MS2 within the first 10 min following mitosis (Figure 6E and F). Such precocious expression is never observed in the presence of the PP7 reporter gene, again suggesting competition in the expression of PP7 and MS2 reporter genes during transvection. Thus, we conclude that the timing and quality, but not frequency, of transvection is affected by the presence of a cis-linked PP7 reporter. We believe that co-activation of the PP7 and MS2 reporter genes during transvection, along with weak competition between the two alleles, suggests that they share a common conglomeration of transcription factors (Figure 7).
Figure 6. Promoter competition attenuates the timing and the level of transvection.

(A) Schematic representation of the transvection assay without a cis-linked PP7-lacZ reporter gene. MS2-lacZ reporter gene and sna shadow enhancer are located on separate alleles. gypsy insulators were placed in both alleles to facilitate transvection. Single-color live imaging was performed to visualize MS2-lacZ reporter gene.
(B) Representative trajectory of MS2-lacZ transcriptional activity in the absence of cis-linked PP7-lacZ reporter gene. The first trans-activation can occur within first 10 min of nc 14.
(C) Schematic representation of the transvection assay with a cis-linked PP7-lacZ reporter gene.
(D) Representative trajectory of MS2-lacZ transcriptional activity in the presence of cis-linked PP7-lacZ reporter gene. There is a delay in the first MS2 burst, and the overall amplitudes of the bursts are lower as compared with the nucleus lacking the cis-linked PP7 reporter gene (B).
(E) Cumulative fraction of nuclei expressing MS2-lacZ reporter gene in the presence (blue) or absence (green) of a cis-linked PP7-lacZ. A total of 1110 (1077 inactive, 33 active) and 1151 (1119 inactive, 32 active) nuclei from three independent embryos were analyzed, respectively. Error bars represent ± the standard error of the mean of three biological replicates. Plot shown as – cis-linked PP7-lacZ is identical to Figure 1D.
(F) A close-up of the delay in trans-activation during the onset into nc 14 (5-15min) from the plot shown in (E). Error bars represent ± the standard error of the mean of three biological replicates. See also Figure S7.
Figure 7. A model for gene activation via formation of a transcription hub.

A pair of insulators establishes a stable trans-homolog association. Subsequently, the transcription “hub” is assembled near the site of transcription by trapping transcription factors (yellow and orange ovals) and co-activators (pink oval) at enhancers as well as Pol II complexes (blue ovals) at promoters, leading to coordinated transcription activity of both reporter genes in cis and trans.
Discussion
The most striking finding of this study is the co-activation of linked PP7 and MS2 reporter genes in cis and trans during transvection. Promoter competition has been observed in a variety of systems including both invertebrates and vertebrates (Choi and Engel, 1988; Foley and Engel, 1992; Fukaya et al., 2016; Ohtsuki et al., 1998). Enhancers tend to prefer nearby promoters as opposed to those positioned in more remote locations. We therefore expected preferential activation of the cis-linked PP7 reporter gene as compared with the MS2 gene located in trans on the other homolog. Instead, once transvection commences, the shared enhancer seems to have equal access to both reporter genes. The only preference for the cis-linked PP7 is seen during the initial periods of interphase following mitosis (Figure 4). It is possible that this delay in trans-activation is due to preferential enhancer-promoter interactions with the proximal cis-linked reporter gene. A nonexclusive alternative possibility is that the delay is due to the time it takes for the two alleles to become physically associated following mitosis. We prefer the latter explanation since the analysis of sna>MS2-lacZ and sna>PP7-lacZ hetero-allelic embryos reveals a delay in association during the first 10-20 min of nuclear cycle 14 (Figure 3E-G, Movie S2).
Transvection is not observed during the timeframe of our analysis (nc 14) without the insertion of insulators into both alleles (Figure 1). As a result, we were able to use transvection as an assay for examining insulator function. Most previous studies have centered on the role of insulators in creating chromosomal loop domains in cis, such as topologically associating domains (TADs). Insulators that are separated by large distances along a chromosome (~50 kb to 3 Mb) are thought to come into close physical proximity (Dekker and Mirny, 2016; Dixon et al., 2016). This pairing of insulators depends on their relative orientations (Guo et al., 2015; Rao et al., 2014). When in the convergent orientation in cis, they are able to form a chromosomal loop domain, but not when placed in the same orientation. We do not see this orientation dependence for the gypsy insulator in trans, although the Homie insulator does exhibit such a requirement (Figure 2). Moreover, we found that a pair of heterotypic insulators were unable to mediate transvection, e.g., there is no trans-activation of the MS2 reporter gene when one allele is tagged with the Su(Hw)-dependent gypsy insulator and the other with Su(Hw)/CTCF-dependent Homie insulator (Figure S2). This observation raises the possibility of insulator specificity in the creation of topological domains both in cis and in trans.
We found that insulators do not significantly increase the frequency of allelic pairing, but instead increase the stability of pairing, as suggested previously (Kravchenko et al., 2005). It is possible that somatic pairing of homologous chromosomes is mediated by DNA sequence homology, as seen for pairing during meiosis (Tsai and McKee, 2011). Support for this view stems from the analysis of trans-chromosomal interactions when the gypsy insulator, sna shadow enhancer and PP7 reporter gene are placed in non-homologous locations in the genome (Figure S6). Although trans-activation is exceedingly rare, we have detected a few nuclei that display co-expression of MS2 and PP7, and the resulting transcriptional bursts are comparable to those seen in pairing-dependent transvection (Movie S7). One interpretation of these findings is that sequence homology increases the probability of transient associations between alleles, while insulators stabilize the association. In the case of non-homologous sites, associations between the enhancer and MS2 reporter are rare, but, when they occur, the insulators stabilize the association for trans-activation of the MS2 reporter. There are instances of non-homologous interactions in vertebrates (Ling et al., 2006; Lomvardas et al., 2006), and we suggest that these depend on compatible insulators located near interacting loci. It is also important to note that some enhancers can act in trans independently of insulators (e.g. Bateman et al., 2012; Blick et al., 2016; Mellert and Truman, 2012), giving rise to the possibility that there might be other DNA elements that can mediate transvection.
We propose that insulator-insulator interactions create a trans-homolog topological domain, comparable to those formed in cis (Fukaya et al., 2016). This association places the shared enhancer in close proximity with both the cis-linked PP7 reporter gene and the trans-linked MS2 reporter (Figure 7). It is possible that paired insulators create a trap or “hub” for condensates of the transcriptional machinery. The formation of this transcriptional hub might be driven by the coalescence of Pol II complexes and transcription factors, accumulated at promoters and enhancers respectively (Hnisz et al., 2017). As implied by a recent live-imaging study (Gu et al., 2018), the formation of such hubs might influence the sub-diffusive mobility of enhancers. The release of Pol II from the hub could contribute to transcriptional bursting (Bothma et al., 2014), as well as co-activation of the PP7 and MS2 reporter genes in cis (Fukaya et al., 2016) and in trans.
This view of transcriptional control is quite distinct from the classical models of sequential recruitment of individual Pol II complexes to their target promoters. It was recently proposed that transcriptional bursts are the result of periodic phase transitions of activator proteins and the Pol II machinery at active loci (Hnisz et al., 2017). These transitions are thought to arise from protein-protein interactions via intrinsically disordered domains within transcription factors, co-activators and Pol II subunits (Gemayel et al., 2015; Hnisz et al., 2017). Indeed, recent super-resolution studies suggest highly dynamic clustering of Pol II complexes and transcription factors at active foci (Cisse et al., 2013; Mir et al., 2017; Tsai et al., 2017). The proposed transcription hubs also challenge traditional models of targeted enhancer-promoter loops. The formation of extended transcriptional condensates consisting of multiple activators and Pol II complexes might require approximate proximity rather than direct, physical association of enhancers with their target promoters.
STAR Method
Contact for reagent and resource sharing
Further information and requests for resources and reagents should be directed to and will be fulfilled by the Lead Contact, Michael Levine (msl2@princeton.edu).
Experimental model and subject details
In all experiments, we studied Drosophila melanogaster embryos at nuclear cycle 14. The following fly lines were used in this study: nos>MCP-GFP, His2Av-mRFP (this study), nos>MCP-GFP, nos>mCherry-PCP, His2Av-eBFP2 (this study), sna shadow enhancer (this study), gypsy-sna shadow enhancer (this study), sna shadow enhancer-gypsy (this study), sna shadow enhancer-evePr-MS2-lacZ (this study), gypsy-sna shadow enhancer-evePr-MS2-lacZ (this study), gypsy-evePr-MS2-lacZ (this study), gypsy (inverted)-evePr-MS2-lacZ (this study), Homie-evePr-MS2-lacZ (this study), Homie (inverted)-evePr-MS2-lacZ (this study), Homie-sna shadow enhancer (this study), tmr-sna shadow enhancer (this study), tmr-evePr-MS2-lacZ (this study), gypsy-sna shadow enhancer-evePr-PP7-lacZ (this study), gypsy-snaPr-MS2-yellow (this study), fushi tarazu-MS2 (this study), fushi tarazu-PP7 (this study), y1 w1118; PBac{y+-attP-3B} VK00033 (Bloomington Drosophila Stock Center #9750), y1w1118; PBac{y+-attP-3B}VK00031 (Bloomington Drosophila Stock Center #9748).
fushi tarazu-MS2 and fushi tarazu-PP7 were generated using CRISPR/Cas9 based insertion of 24x MS2 RNA stem loop or 24x PP7 RNA stem loop into the 3′ UTR of endogenous fushi tarazu. In brief, ~1-kb DNA fragment of 5′ and 3′ homology arm sequences were PCR amplified from the genomic DNA, and inserted into the pBS-MS2-loxP-dsRed-loxP and pBS-PP7-loxP-dsRed-loxP donor plasmids (see below). These plasmids were co-injected with the pCFD3 gRNA expression plasmid to nos-Cas9/CyO embryos (Ren et al., 2013).
Method Details
Site specific transgenesis by phiC31 system
All reporter plasmids were integrated into a unique landing site on the third chromosome using strain 9750 (Bloomington Drosophila Stock Center). In Figure S6, PP7-lacZ reporter plasmid was integrated into a unique landing site on the third chromosome using strain 9748 (Bloomington Drosophila Stock Center). Microinjection was performed as described (Ringrose, 2009). Zero to 1-hour embryos were collected and dechorionated with bleach. Aligned embryos were dried with silica gel for 12 min and covered with Halocarbon oil 27 (Sigma). Subsequently, microinjection was performed using Picospritzer III (Parker) and Narishige M-152 Micromanipulator (Narishige). Injection mixture contains 500 ng/μl plasmid DNA, 5 mM KCl ,0.1 mM phosphate buffer, pH 6.8. mini-White marker was used for subsequent screening.
Genome editing by CRISPR/Cas9
pCFD3 gRNA expression plasmid and pBS-dsRed donor plasmid were co-injected to nos-Cas9/Cyo embryos (Ren et al., 2013). Microinjection was performed as described (Ringrose, 2009). Injection mixture contains 500 ng/μl pCFD3 gRNA expression plasmid, 500 ng/μl pBS-dsRed donor plasmid, 5 mM KCl ,0.1 mM phosphate buffer, pH 6.8. 3xP3-dsRed marker was used for subsequent screening.
Fly strains
MCP-GFP, mCherry-PCP, His2Av-eBFP2
The nanos>SV40NLS-mCherry-PCP, His2Av-eBFP2 expression plasmid (Fukaya et al., 2017) was integrated into a unique landing site on the third chromosome using strain 9750 (Bloomington Drosophila Stock Center) to obtain maternal expression of the mCherry-PCP and His2Av-eBFP2 fusion proteins. Maternal expression of the MCP-GFP fusion protein was obtained using a transgenic strain carrying a nanos>MCP-GFP transgene that was integrated into the third chromosome by P-element mediated transformation (Garcia et al., 2013). These were mated to create the fly line mCherry-PCP, MCP-GFP, His2Av-eBFP2 in order to obtain co-expression of MCP-GFP, mCherry-PCP and His2Av-eBFP2 fusion proteins.
MCP-GFP, His2Av-mRFP
The nanos> MCP-GFP, His2Av-mRFP expression plasmid was integrated into a unique landing site on the third chromosome using strain 9750 (Bloomington Drosophila Stock Center) to obtain maternal expression of the MCP-GFP and His2Av-mRFP fusion proteins.
In situ hybridization
Embryos were dechorionated and fixed in fixation buffer (0.5x PBS, 25 mM EGTA, 4% formaldehyde and 50% Heptane) for 20 min at room temperature. Antisense RNA probes labeled with digoxigenin (DIG RNA Labeling Mix 10 × conc, Roche) and biotin (Biotin RNA Labeling Mix 10 × conc, Roche) were used to detect lacZ and snail RNAs, respectively. Hybridization was performed at 55 °C overnight in hybridization buffer (50% formamide, 5x SSC, 50 μg/ml Heparin, 100 μg/ml salmon sperm DNA, 0.1% Tween-20). Subsequently, embryos were washed with hybridization buffer at 55 °C and incubated with Western Blocking Buffer (Roche) at room temperature for one hour. Then, embryos were incubated with sheep anti-digoxigenin (Roche) and mouse anti-biotin primary antibodies (Invitrogen) at 4 °C for overnight, followed by incubation with Alexa Fluor 488 donkey anti-sheep (Invitrogen) and Alexa Flour 555 goat anti-mouse (Invitrogen) fluorescent secondary antibodies at room temperature for two hours. DNA was stained with Hoechst 33342 (Thermo Fisher Scientific), and embryos were mounted in ProLong Gold Antifade Mountant (Thermo Fisher Scientific). Imaging was performed on a Zeiss LSM 880 confocal microscope. Plan-Apochromat 20x / 0.8 N.A. objective was used. Images were captured in 16 bit.
Dual-color MS2/PP7 Live imaging
MCP-GFP, mCherry-PCP, His2Av-eBFP2 virgins were mated with homozygous males carrying PP7-lacZ reporter genes. Resulting trans-heterozygote virgins were collected and mated with homozygous males carrying MS2 reporter genes. The resulting embryos were dechorinated and mounted between a semipermeable membrane (In Vitro Systems & Services) and a coverslip (18 mm × 18 mm), and embedded in Halocarbon oil 27 (Sigma). Embryos were imaged using a Zeiss LSM 880 at room temperature. Plan-Apochromat 40x / 1.3N.A. oil immersion objective was used. At each time point, a stack of 21 images separated by 0.5 μm was acquired and the final time resolution is 13 sec. Images were captured in 16 bit. For each cross, more than three biological replicates were taken using the same setting of the microscope. The same laser power and microscope setting were consistently used in the same experiments.
Single-color MS2 Live imaging
MCP-GFP, His2Av-mRFP virgins were mated with homozygous males carrying the MS2 reporter gene. Resulting trans-heterozygote virgins were collected and mated with homozygous males carrying snail shadow enhancer. In Figure S1A and B, heterozygote MCP-GFP, His2Av-mRFP virgins were mated with homozygous males carrying snail shadow enhancer-evePr-MS2-lacZ reporter gene. The resulting embryos were dechorinated and mounted between a semipermeable membrane (In Vitro Systems & Services) and a coverslip (18 mm × 18 mm), and embedded in Halocarbon oil 27 (Sigma). Embryos were imaged using a Zeiss LSM 880 at room temperature. Plan-Apochromat 40x / 1.3N.A. oil immersion objective was used. At each time point, a stack of 21 images separated by 0.5 μm was acquired and the final time resolution is 13 sec. Images were captured in 16 bit. For each cross, three biological replicates were taken using the same setting of the microscope. The same laser power and microscope setting were used throughout this study.
Plasmids
pbphi-snail shadow enhancer
A DNA fragment containing snail shadow enhancer was amplified from the genomic DNA using primers (5′-GGG GGA AGC TTG CAT TGA GGT GTT TTG TTG G-3′) and (5′-CCC CCG CTA GCT AAA TTC CGA TTT TTC TTG T -3′), and digested with HindIII and NheI. The resulting fragment was inserted between the HindIII and NheI sites in pbphi-multi cloning site (Fukaya et al., 2016). Subsequently, a DNA fragment containing Burkholderia cenocepacia ParSc3 sequence (Saad et al., 2014) was inserted into the unique NdeI site of the plasmid. ParSc3 was not used in this study.
pbphi-gypsy-snail shadow enhancer
A DNA fragment containing gypsy insulator was amplified from the genomic DNA using primers (5′-GGG GGG CGG CCG CCT GGC CAC GTA ATA AGT GTG CG-3′) and (5′-CCC CCG GAT CCG TTG TTG GTT GGC ACA CCA C-3′), and digested with NOTI and BamHI. The resulting fragment was inserted between the NOTI and BglII sites in pbphi-snail shadow enhancer.
pbphi-snail shadow enhancer-gypsy
A DNA fragment containing gypsy insulator was amplified from the genomic DNA using primers (5′-GGG GGG CTA GCC TGG CCA CGT AAT AAG TGT GCG -3′) and (5′-CCC CCT CTA GAG TTG TTG GTT GGC ACA CCA C-3′), and digested with NheI and XbaI. The resulting fragment was inserted between the NheI and XbaI sites in pbphi-snail shadow enhancer. ParSc3 sequence is depleted from this plasmid.
pbphi-lacZ-αTub 3′UTR
A DNA fragment containing α-Tubulin at 84B 3′UTR was amplified from the genomic DNA using primers (5′-GGG GGC TCG AGG CGT CAC GCC ACT TCA ACG C-3′) and (5′-CCC CCT CTA GAA AGC TTG AGC TTC GCA TGG TTT TGC C-3′), and digested with XhoI and XbaI. The resulting fragment was inserted between the XhoI and XbaI sites in pbphi-multi cloning site. Subsequently, a DNA fragment containing lacZ was amplified using primers (5′-GGG GGA GAT CTA TGC AGA ACT GGG AGA CGA C-3′) and (5′-CCC CCC TCG AGT TAT TTT TGA CAC CAG ACC A-3′), and digested with BglII and XhoI. The resulting fragment was inserted between the BglII and XhoI sites in the plasmid.
pbphi-evePr-MS2-lacZ-αTub 3′UTR
A DNA fragment containing eve core promoter was amplified from the genomic DNA using primers (5′-GGG GGC GGC CGC ACT AGT TTT GCC TGC AGA GCG CAG CG-3′) and (5′-CCC CCA GAT CTA ACG AAG GCA GTT AGT TGT T-3′), and digested with NOTI and BglII. The resulting fragment was inserted between the NOTI and BglII sites in pbphi-lacZ-αTub 3′UTR. Subsequently, a DNA fragment containing 24x MS2 stem loops was purified from pCR4-24xMS2SL-stable (Bertrand et al., 1998) by digesting with BamHI and BglII. The resulting fragment was inserted into the unique BglII site in the plasmid.
pbphi-gypsy-evePr-MS2-lacZ-αTub 3′UTR
A DNA fragment containing gypsy insulator was amplified from the genomic DNA using primers (5′-GGG GGG CGG CCG CCT GGC CAC GTA ATA AGT GTG-3′) and (5′-CCC CCG CGG CCG CGT TGT TGG TTG GCA CAC CAC-3′), and digested with NOTI. The resulting fragment was inserted into the unique NOTI site in the pbphi-evePr-MS2-lacZ-αTub 3′UTR. By sequencing resulting plasmids, orientation of gypsy insulator was determined.
pbphi-gypsy-snail shadow enhancer-evePr-MS2-lacZ-αTub 3′UTR
A DNA fragment containing gypsy insulator and snail shadow enhancer was purified from pbphi-gypsy-snail shadow enhancer by digesting with NOTI and NheI. The resulting fragment was inserted between the NOTI and SpeI sites in the pbphi-evePr-MS2-lacZ-αTub 3′UTR.
pbphi-snail shadow enhancer-evePr-MS2-lacZ-αTub 3′UTR
A DNA fragment containing snail shadow enhancer was purified from pbphi-snail shadow enhancer by digesting with NOTI and NheI. The resulting fragment was inserted between the NOTI and SpeI sites in the pbphi-evePr-MS2-lacZ-αTub 3′UTR.
pbphi-evePr-PP7-lacZ-αTub 3′UTR
A DNA fragment containing eve core promoter was amplified from the genomic DNA using primers (5′-GGG GGG CGG CCG CGC TAG CTT TGC CTG CAG AGC GCA GCG-3′) and (5′-CCC CCA GAT CTA ACG AAG GCA GTT AGT TGT T-3′), and digested with NOTI and BglII. The resulting fragment was inserted between the NOTI and BglII sites in pbphi-lacZ-αTub 3′UTR. Subsequently, a DNA fragment containing 24x PP7 stem loops was purified from pBS-24x PP7 (Fukaya et al., 2016) by digesting with BamHI and BglII, and the resulting fragment was inserted into the unique BglII site in the plasmid.
pbphi-gypsy-snail shadow enhancer-evePr-PP7-lacZ-αTub 3′UTR
A DNA fragment containing gypsy insulator and snail shadow enhancer was purified from pbphi-gypsy-snail shadow enhancer by digesting with NOTI and NheI. The resulting fragment was inserted between the NOTI and NheI sites in pbphi-evePr-PP7-lacZ-αTub 3′UTR.
pbphi-gypsy-snaPr-MS2-yellow-αTub 3′UTR
A DNA fragment containing partial sequence of lacZ was amplified using primers (5′-GGG GGC TGC AGG TAT GCA GAA CTG GGA GAC GAC-3′) and (5′-CCC CCC TGC AGC GAA ACC GAC ATC GCA GGC TT-3′), and digested with PstI. The resulting fragment was inserted into the unique PstI site of the snaPr-MS2-yellow plasmid (Ferraro et al., 2016) to discriminate from the endogenous yellow gene. Subsequently, a DNA fragment containing gypsy insulator was amplified from the genomic DNA using primers (5′-GGG GGG CGG CCG CCT GGC CAC GTA ATA AGT GTG CG-3′) and (5′-CCC CCC TCG AGG TTG TTG GTT GGC ACA CCA C-3′), and digested with NotI and XhoI. The resulting fragment was inserted between the NotI and XhoI sites of the plasmid.
pbphi-Homie-snail shadow enhancer
A DNA fragment containing Homie insulator was amplified from the genomic DNA using primers (5′-GGG GGG CGG CCG CAA TAC TAA AAA GTT TTT ACG AGC-3′) and (5′-CCC CCA GAT CTG ATT ACA CGC TGC GAT GGT T-3′), and digested with NOTI and BglII. The resulting fragment was inserted between the NOTI and BglII sites in pbphi-snail shadow enhancer.
pbphi-Homie-evePr-MS2-lacZ-αTub 3′UTR
A DNA fragment containing Homie insulator was amplified from the genomic DNA using primers (5′-GGG GGG CGG CCG CAA TAC TAA AAA GTT TTT ACG AGC-3′) and (5′-CCC CCG CGG CCG CGA TTA CAC GCT GCG ATG GTT-3′), and digested with NOTI. The resulting fragment was inserted into the unique NOTI site in pbphi-evePr-MS2-lacZ-α Tub 3′UTR. By sequencing resulting plasmids, orientation of Homie insulator was determined.
pbphi-tmr-snail shadow enhancer
A DNA fragment containing Abd-B transvection mediating region was amplified from the genomic DNA using primers (5′-GGG GGG CGG CCG CGA ATT CGT CTT CTA GCT ACC TGC CC-3′) and (5′-CCC CCA GAT CTC GTG TGG AAT TCT GTT CTG TCA CAA-3′), and digested with NOTI and BglII. The resulting fragment was inserted between the NOTI and BglII sites in pbphi-snail shadow enhancer.
pbphi-tmr-evePr-MS2-lacZ-αTub 3′UTR
A DNA fragment containing Abd-B transvection mediating region was amplified from the genomic DNA using primers (5′-GGG GGG CGG CCG CGA ATT CGT CTT CTA GCT ACC TGC CC-3′) and (5′-CCC CCG CGG CCG CCG TGT GGA ATT CTG TTC TGT CAC AA-3′), and digested with NOTI. The resulting fragment was inserted between the unique NOTI in pbphi-evePr-MS2-lacZ-αTub 3′UTR. By sequencing resulting plasmids, orientation of transvection mediating region was determined.
pbphi-nanos>MCP-GFP
A DNA fragment containing MCP was amplified from pUC18-Pnos-MCP-GFP-αTub 3′UTR plasmid (Garcia et al., 2013) using primers (5′-GGG GGC TCG AGA TGG CTT CTA ACT TTA CTC A-3′) and (5′-CCC CCA AGC TTG TAG ATG CCG GAG TTT GCT G-3′), and digested with XhoI and HindIII. The resulting fragment was inserted between the XhoI and HindIII sites in pbphi-nanos promoter-αTubulin 3′UTR expression vector (Fukaya et al., 2016). Subsequently, a DNA fragment containing GFP was amplified using primers (5′-GGG GGG CTA GCA TGG TGA GCA AGG GCG AGG A-3′) and (5′-CCC CCG GAT CCT TAC TTG TAC AGC TCG TCC A-3′) and digested with NheI and BamHI, and the resulting fragment was inserted between the NheI and BamHI sites in the plasmid.
pbphi-His2Av-mRFP
A DNA fragment containing mRFP was amplified using primers (5′-GGG GGA AGC TTG GCG GAT CAG GCT CGG GAT CAT CGA TGG CCT CCT CCG AGG ACG T-3′) and (5′-CCC CCG CTA GCT TAG GCG CCG GTG GAG TGG C-3′), and digested with HindIII and NheI. The resulting fragment was inserted between the HindIII and NheI sites in the pbphi-His2Av (Fukaya et al., 2017).
pbphi-nanos>MCP-GFP, His2Av-mRFP
A DNA fragment containing His2Av-mRFP was purified from pbphi-His2Av-mRFP by digesting with XbaI. The resulting fragment was inserted into the unique XbaI site in the pbphi-nanos>MCP-GFP.
pCFD3-dU6-ftz gRNA
Two DNA oligos (5′-GTC GAG TTA CTC TCT TCC CCA GAG-3′) and (5′-AAA CCT CTG GGG AAG AGA GTA ACT-3′) were annealed and inserted into the pCFD3-dU6:3gRNA vector (addgene # 49410) using BbsI sites.
pBS-loxP
Two DNA oligos (5′-CCA AGG ATC CAT AAC TTC GTA TAA TGT ATG CTA TAC GAA GTT ATC ATA TGC GAC TAG TGG TC-3′) and (5′-GAC CAC TAG TCG CAT ATG ATA ACT TCG TAT AGC ATA CAT TAT ACG AAG TTA TGG ATC CTT GG-3′) were annealed and inserted into the pBlueScript vector using BamHI and SpeI restriction sites.
pBS-MS2-loxP-dsRed-loxP
A DNA fragment containing 24x MS2 stem loops was purified from pCR4-24xMS2SL-stable (Bertrand et al., 1998) by digesting with BamHI and BglII. The resulting fragment was inserted into the unique BamHI site in pBS-loxP plasmid. Subsequently, a DNA fragment containing dsRed and loxP site was amplified from pHD-DsRed-attP (addgene #51019) using primers (5′-GGG GGC ATA TGG GAT CTA ATT CAA TTA GAG A-3′) and (5′-TCT TTA CTA GTA CCG GTT AAG ATA CAT TGA TGA G-3′), and digested with NdeI and SpeI. The resulting fragment was inserted between the NdeI and SpeI sites of the plasmid.
pBS-PP7-loxP-dsRed-loxP
A DNA fragment containing 24x PP7 stem loops was purified from pBlueScript-24x PP7 (Fukaya et al., 2016) by digesting with BamHI and BglII. The resulting fragment was inserted into the unique BamHI site in pBS-loxP plasmid. Subsequently, a DNA fragment containing dsRed and loxP site was amplified from pHD-DsRed-attP (addgene #51019) using primers (5′-GGG GGC ATA TGG GAT CTA ATT CAA TTA GAG A-3′) and (5′-TCT TTA CTA GTA CCG GTT AAG ATA CAT TGA TGA G-3′), and digested with NdeI and SpeI. The resulting fragment was inserted between the NdeI and SpeI sites of the plasmid.
pBS-ftz5′-MS2-loxP-dsRed-loxP-ftz3′
A DNA fragment containing 3′ homology arm of ftz was amplified from genomic DNA using primers (5′-GGG GGA CTA GTG AGC GGA ACC GAA AGC CGT ACC GCC-3′) and (5′-CCC CCG CGG CCG CGC CCC GAA GCC AGA CCA AAA TGT GA-3′), and digested with SpeI and NotI. The resulting fragment was inserted between the SpeI and NotI sites of pBS-loxP-MS2-dsRed-loxP. Subsequently, a DNA fragment containing 5′ homology arm of ftz was amplified from genomic DNA using primers (5′-GGG GGG GTA CCC GTC GAG CAG GTG AAG AAG GCT CCC-3′) and (5′-CCC CCC TGC AGT GGG GAA GAG AGT AAC TGA GCA TC-3′), and digested with KpnI and PstI. The resulting fragment was inserted between the KpnI and PstI sites of the plasmid.
pBS-ftz5′-PP7-loxP-dsRed-loxP-ftz3′
A DNA fragment containing 3′ homology arm of ftz was amplified from genomic DNA using primers (5′-GGG GGA CTA GTG AGC GGA ACC GAA AGC CGT ACC GCC-3′) and (5′-CCC CCG CGG CCG CGC CCC GAA GCC AGA CCA AAA TGT GA-3′), and digested with SpeI and NotI. The resulting fragment was inserted between the SpeI and NotI sites of pBS-PP7-loxP-dsRed-loxP. Subsequently, a DNA fragment containing 5′ homology arm of ftz was amplified from genomic DNA using primers (5′-GGG GGG GTA CCC GTC GAG CAG GTG AAG AAG GCT CCC-3′) and (5′-CCC CCC TGC AGT GGG GAA GAG AGT AAC TGA GCA TC-3′), and digested with KpnI and PstI. The resulting fragment was inserted between the KpnI and PstI sites of the plasmid.
Quantification and Statistical Analysis
All the image processing methods and analysis were implemented in MATLAB (R2016b, MathWorks).
Nuclei segmentation and tracking
For each time point, maximum projections were obtained for all 21 z-sections per image. His2Av-mRFP and His2Av-eBFP2 were used to segment nuclei for single-color imaging and dual-color imaging, respectively. Nuclei-labeled channel images were pre-processed with Gaussian filtering, top-hap filtering, and adaptive histogram equalization, in order to enhance the signal-to-noise contrast. Processed images were converted into binary images using a threshold value obtained from Otsu’s method. The number and the position of separate components within a frame was obtained, where each component serves as a mask for individual nuclei. Since nuclei hardly move past 5 min into nc 14, nuclei tracking was obtained by finding the component with minimal movement across these frames (5 min into nc 14 to the onset of gastrulation).
Recording MS2 and PP7 signals
Maximum projections of raw images were used to record fluorescent intensities. Using nuclei segmentation files as a mask for each nucleus, fluorescence intensities within each nucleus was extracted. After subtracting the background nuclear signal, the signal of MS2 and PP7 transcription foci was determined by taking an average of the top three pixels with the highest fluorescence intensity within each nucleus.
3D tracking of MS2 and PP7 alleles
The entire 21 z-stack images were used to track the three-dimensional position of the active MS2 and PP7 transcription foci within a nucleus. For each nucleus, x, y, and z coordinates of the pixel with the maximum MS2 or PP7 signal was determined respectively using raw image files. The MS2 and PP7 foci coordinates were then transformed with respect to the center of each corresponding nucleus. The resulting x, y, and z resolution is 0.277 μm, 0.277 μm, and 0.5 μm per pixel, respectively. The distance between MS2 and PP7 alleles was measured only when the MS2-lacZ and PP7-lacZ are both transcriptionally active. MS2 and PP7 alleles were considered to be paired when the average distance between the two alleles was less than 1 μm (Figure 3H, Figure S3E and Figure S6B). In Figure 3I, Figure S3F and Figure S6B, pairing duration was determined by measuring the time during which the allelic distance was less than 1.5 μm.
Analysis of coordinated transcription
For each of the MS2 and PP7 trajectories from a given nucleus, the Pearson correlation coefficient was calculated. In the transvection assay, the correlation coefficients within the time window between the first and the last time point of active MS2 transcription were measured. When MS2 and PP7 reporter genes were individually placed under the control of separate enhancers, the correlation coefficients were measured using the MS2 and PP7 trajectories during the period of 5 min into nc 14 to the onset of gastrulation. To compare the histograms between two data sets, the distribution of correlation coefficients was determined by normalizing to the number of total analyzed nuclei. In Figure 5E and Figure S7C, the statistical significance of the difference between two distributions of correlation coefficients was examined using a two-sided Mann-Whitney-U test.
Measurement of cumulative fraction of active nuclei
The time of activation was determined as the first time frame wherein MS2 fluorescence intensity exceeded a threshold value. To determine the threshold value, maximum fluorescence intensity throughout the entirety of nc 14 was measured for each embryo. Subsequently, 15% of the maximum fluorescence intensity was calculated and averaged among replicates. This value was used as the threshold for each genotype. Nuclei were considered as active if MS2 signal exceeded the threshold for longer than 2 min. The presumptive mesoderm region was defined as a domain containing ~17-18 cell widths centered to the ventral most nuclei, which corresponds to endogenous sna expression domain. The very first cells that undergo gastrulation were determined as the ventral most nuclei. The same measurement methods were used in Figure 1, 2, 6 and Figure S1, S2. In all these figures, error bars represent the standard error of the mean.
False coloring of active nuclei
Active nuclei were determined by possessing MS2 signal above a threshold value as described in the previous section. The set of nuclei that were active at any point during the ~50 min period of nc 14 was then identified per embryo. Using their segmentation mask, these active nuclei were then colored and layered over the raw His2Av-eBFP2 image at the time point of ~30 min into nc 14.
Characterization of transcriptional bursting
The amplitude was measured by taking the peaks of each transcriptional burst after smoothing with the local regression (LOESS) method. A transcriptional burst was defined as a change in fluorescence intensity where the local dynamic range (i.e., distance between peak and trough) was as least twice the dynamic range between the global and local minima (i.e., distance between baseline and trough). When a nucleus had above-baseline transcriptional activity at the onset (5 min into nc14) or end (onset of gastrulation) of the analysis, that burst was excluded, due to uncertainty in the detection of its associated amplitude. A two-sided Mann-Whitney-U test was performed to determine the statistical significance of the difference between two distributions of burst amplitude shown in Figure S7D.
Data and Software Availability
Original imaging data of in situ hybridization assay has been deposited to Mendeley Data (http://dx.doi.org/10.17632/3ff644zs6s.1).
Supplementary Material
Fluorescent intensity (left), temporal 3D location (middle), and cumulative 3D trace (right) of MS2-lacZ and PP7-lacZ transcriptional foci in the nucleus shown in Figure 3B-D.
Fluorescent intensity (left), temporal 3D location (middle), and cumulative 3D trace (right) of MS2-lacZ and PP7-lacZ transcriptional foci in the nucleus shown in Figure 3E-G.
Maximum projection of MS2-lacZ and PP7-lacZ in nc 14. MCP-GFP is shown in green, mCherry-PCP is shown in red and His2Av-eBFP2 is shown in blue.
Fluorescent intensity (left), temporal 3D location (middle), and cumulative 3D trace (right) of MS2-lacZ and PP7-lacZ transcriptional foci in the nuclei shown in Figure 4.
Fluorescent intensity (left), temporal 3D location (middle), and cumulative 3D trace (right) of MS2-lacZ and PP7-lacZ transcriptional foci in the nuclei shown in Figure S4.
Raw image (left) and fluorescence intensity (right) of MS2-lacZ transcriptional focus in the nucleus shown in Figure 6B (top) and Figure 6D (bottom).
Maximum projection of MS2-lacZ (inserted at VK00033 landing site; Venken et al., 2006) and PP7-lacZ (inserted at VK00031 landing site; Venken et al., 2006) in nc 14. MCP-GFP is shown in green, mCherry-PCP is shown in red and His2Av-eBFP2 is shown in blue.
In Brief.
Lim and Heist et al. explore a process called transvection in living Drosophila embryos, whereby enhancers on one homolog activate transcription units on the other homolog. They show that insulators facilitate transvection by stabilizing allele-allele pairing. Surprisingly, a shared enhancer coactivates a cis-linked PP7 reporter gene along with a trans-linked MS2 reporter contained on the other homolog. This coactivation is consistent with emerging evidence for transcription “hubs” containing clusters of RNA Polymerase II and associated activators.
Highlights.
Insulators increase the stability, but not frequency, of allele-allele pairing
The gypsy insulator functions in an orientation-independent manner
A shared enhancer co-activates linked PP7 and MS2 reporter genes in cis and in trans
Linked reporter genes compete for shared resources during transvection
Acknowledgments
We thank Evangelos Gatzogiannis for instruction and help with confocal imaging, and the Bloomington Drosophila Stock Center for fly strains. We are also grateful to members of the Levine laboratory for discussions. T.F. is the recipient of a Human Frontier Science Program Long-Term Fellowship. B.L. is the recipient of the National Institutes of Health postdoctoral fellowship (1F32GM122186). T.H. is supported by funding from the National Human Genome Research Institute of the National Institutes of Health (T32HG003284). This study was funded by grants from the National Institutes of Health to M.L. (U01EB021239 and GM118147).
Footnotes
Author Contributions
T.F. and M.L. designed the experiments. T.F. and T.H. performed the experiments. B.L. and T.H. performed the image analysis. All the authors discussed the results and wrote the manuscript.
Supplemental Information
Supplemental Information includes seven figures and seven movies.
Declaration of Interests
The authors declare no competing interests.
Publisher's Disclaimer: This is a PDF file of an unedited manuscript that has been accepted for publication. As a service to our customers we are providing this early version of the manuscript. The manuscript will undergo copyediting, typesetting, and review of the resulting proof before it is published in its final citable form. Please note that during the production process errors may be discovered which could affect the content, and all legal disclaimers that apply to the journal pertain.
References
- Abraham BJ, Hnisz D, Weintraub AS, Kwiatkowski N, Li CH, Li Z, Weichert-Leahey N, Rahman S, Liu Y, Etchin J, Li B, Shen S, Lee TI, Zhang J, Look AT, Mansour MR, Young RA. Small genomic insertions form enhancers that misregulate oncogenes. Nat Commun. 2017;8:14385. doi: 10.1038/ncomms14385. [DOI] [PMC free article] [PubMed] [Google Scholar]
- Bateman JR, Johnson JE, Locke MN. Comparing enhancer action in cis and in trans. Genetics. 2012;191:1143–1155. doi: 10.1534/genetics.112.140954. [DOI] [PMC free article] [PubMed] [Google Scholar]
- Belozerov VE, Majumder P, Shen P, Cai HN. A novel boundary element may facilitate independent gene regulation in the Antennapedia complex of Drosophila. EMBO J. 2003;22:3113–3121. doi: 10.1093/emboj/cdg297. [DOI] [PMC free article] [PubMed] [Google Scholar]
- Bertrand E, Chartrand P, Schaefer M, Shenoy SM, Singer RH, Long RM. Localization of ASH1 mRNA particles in living yeast. Mol Cell. 1998;2:437–445. doi: 10.1016/s1097-2765(00)80143-4. [DOI] [PubMed] [Google Scholar]
- Blick AJ, Mayer-Hirshfeld I, Malibiran BR, Cooper MA, Martino PA, Johnson JE, Bateman JR. The Capacity to Act in trans Varies Among Drosophila Enhancers. Genetics. 2016;203:203–218. doi: 10.1534/genetics.115.185645. [DOI] [PMC free article] [PubMed] [Google Scholar]
- Bothma JP, Garcia HG, Esposito E, Schlissel G, Gregor T, Levine M. Dynamic regulation of eve stripe 2 expression reveals transcriptional bursts in living Drosophila embryos. Proc Natl Acad Sci U S A. 2014;111:10598–10603. doi: 10.1073/pnas.1410022111. [DOI] [PMC free article] [PubMed] [Google Scholar]
- Choi OR, Engel JD. Developmental regulation of beta-globin gene switching. Cell. 1988;55:17–26. doi: 10.1016/0092-8674(88)90005-0. [DOI] [PubMed] [Google Scholar]
- Cisse II, Izeddin I, Causse SZ, Boudarene L, Senecal A, Muresan L, Dugast-Darzacq C, Hajj B, Dahan M, Darzacq X. Real-time dynamics of RNA polymerase II clustering in live human cells. Science. 2013;341:664–667. doi: 10.1126/science.1239053. [DOI] [PubMed] [Google Scholar]
- Dekker J, Mirny L. The 3D Genome as Moderator of Chromosomal Communication. Cell. 2016;164:1110–1121. doi: 10.1016/j.cell.2016.02.007. [DOI] [PMC free article] [PubMed] [Google Scholar]
- Dixon JR, Gorkin DU, Ren B. Chromatin Domains: The Unit of Chromosome Organization. Mol Cell. 2016;62:668–680. doi: 10.1016/j.molcel.2016.05.018. [DOI] [PMC free article] [PubMed] [Google Scholar]
- Dunipace L, Ozdemir A, Stathopoulos A. Complex interactions between cis-regulatory modules in native conformation are critical for Drosophila snail expression. Development. 2011;138:4075–4084. doi: 10.1242/dev.069146. [DOI] [PMC free article] [PubMed] [Google Scholar]
- ENCODE, P. C. An integrated encyclopedia of DNA elements in the human genome. Nature. 2012;489:57–74. doi: 10.1038/nature11247. [DOI] [PMC free article] [PubMed] [Google Scholar]
- Ferraro T, Esposito E, Mancini L, Ng S, Lucas T, Coppey M, Dostatni N, Walczak AM, Levine M, Lagha M. Transcriptional Memory in the Drosophila Embryo. Curr Biol. 2016;26:212–218. doi: 10.1016/j.cub.2015.11.058. [DOI] [PMC free article] [PubMed] [Google Scholar]
- Foley KP, Engel JD. Individual stage selector element mutations lead to reciprocal changes in beta- vs. epsilon-globin gene transcription: genetic confirmation of promoter competition during globin gene switching. Genes Dev. 1992;6:730–744. doi: 10.1101/gad.6.5.730. [DOI] [PubMed] [Google Scholar]
- Fujioka M, Mistry H, Schedl P, Jaynes JB. Determinants of Chromosome Architecture: Insulator Pairing in cis and in trans. PLoS Genet. 2016;12:e1005889. doi: 10.1371/journal.pgen.1005889. [DOI] [PMC free article] [PubMed] [Google Scholar]
- Fujioka M, Sun G, Jaynes JB. The Drosophila eve insulator Homie promotes eve expression and protects the adjacent gene from repression by polycomb spreading. PLoS Genet. 2013;9:e1003883. doi: 10.1371/journal.pgen.1003883. [DOI] [PMC free article] [PubMed] [Google Scholar]
- Fujioka M, Wu X, Jaynes JB. A chromatin insulator mediates transgene homing and very long-range enhancer-promoter communication. Development. 2009;136:3077–3087. doi: 10.1242/dev.036467. [DOI] [PMC free article] [PubMed] [Google Scholar]
- Fukaya T, Levine M. Transvection. Curr Biol. 2017;27:R1047–R1049. doi: 10.1016/j.cub.2017.08.001. [DOI] [PMC free article] [PubMed] [Google Scholar]
- Fukaya T, Lim B, Levine M. Enhancer Control of Transcriptional Bursting. Cell. 2016;166:358–368. doi: 10.1016/j.cell.2016.05.025. [DOI] [PMC free article] [PubMed] [Google Scholar]
- Fukaya T, Lim B, Levine M. Rapid Rates of Pol II Elongation in the Drosophila Embryo. Curr Biol. 2017;27:1387–1391. doi: 10.1016/j.cub.2017.03.069. [DOI] [PMC free article] [PubMed] [Google Scholar]
- Garcia HG, Tikhonov M, Lin A, Gregor T. Quantitative imaging of transcription in living Drosophila embryos links polymerase activity to patterning. Curr Biol. 2013;23:2140–2145. doi: 10.1016/j.cub.2013.08.054. [DOI] [PMC free article] [PubMed] [Google Scholar]
- Gemayel R, Chavali S, Pougach K, Legendre M, Zhu B, Boeynaems S, van der Zande E, Gevaert K, Rousseau F, Schymkowitz J, Babu MM, Verstrepen KJ. Variable Glutamine-Rich Repeats Modulate Transcription Factor Activity. Mol Cell. 2015;59:615–627. doi: 10.1016/j.molcel.2015.07.003. [DOI] [PMC free article] [PubMed] [Google Scholar]
- Gemkow MJ, Verveer PJ, Arndt-Jovin DJ. Homologous association of the Bithorax-Complex during embryogenesis: consequences for transvection in Drosophila melanogaster. Development. 1998;125:4541–4552. doi: 10.1242/dev.125.22.4541. [DOI] [PubMed] [Google Scholar]
- Gerasimova TI, Lei EP, Bushey AM, Corces VG. Coordinated control of dCTCF and gypsy chromatin insulators in Drosophila. Mol Cell. 2007;28:761–772. doi: 10.1016/j.molcel.2007.09.024. [DOI] [PMC free article] [PubMed] [Google Scholar]
- Geyer PK, Green MM, Corces VG. Tissue-specific transcriptional enhancers may act in trans on the gene located in the homologous chromosome: the molecular basis of transvection in Drosophila. EMBO J. 1990;9:2247–2256. doi: 10.1002/j.1460-2075.1990.tb07395.x. [DOI] [PMC free article] [PubMed] [Google Scholar]
- Gu B, Swigut T, Spencley A, Bauer MR, Chung M, Meyer T, Wysocka J. Transcription-coupled changes in nuclear mobility of mammalian cis-regulatory elements. Science. 2018 doi: 10.1126/science.aao3136. [DOI] [PMC free article] [PubMed] [Google Scholar]
- Guo Y, Xu Q, Canzio D, Shou J, Li J, Gorkin DU, Jung I, Wu H, Zhai Y, Tang Y, Lu Y, Wu Y, Jia Z, Li W, Zhang MQ, Ren B, Krainer AR, Maniatis T, Wu Q. CRISPR Inversion of CTCF Sites Alters Genome Topology and Enhancer/Promoter Function. Cell. 2015;162:900–910. doi: 10.1016/j.cell.2015.07.038. [DOI] [PMC free article] [PubMed] [Google Scholar]
- Hendrickson JE, Sakonju S. Cis and trans interactions between the iab regulatory regions and abdominal-A and Abdominal-B in Drosophila melanogaster. Genetics. 1995;139:835–848. doi: 10.1093/genetics/139.2.835. [DOI] [PMC free article] [PubMed] [Google Scholar]
- Hiraoka Y, Dernburg AF, Parmelee SJ, Rykowski MC, Agard DA, Sedat JW. The onset of homologous chromosome pairing during Drosophila melanogaster embryogenesis. J Cell Biol. 1993;120:591–600. doi: 10.1083/jcb.120.3.591. [DOI] [PMC free article] [PubMed] [Google Scholar]
- Hnisz D, Shrinivas K, Young RA, Chakraborty AK, Sharp PA. A Phase Separation Model for Transcriptional Control. Cell. 2017;169:13–23. doi: 10.1016/j.cell.2017.02.007. [DOI] [PMC free article] [PubMed] [Google Scholar]
- Hocine S, Raymond P, Zenklusen D, Chao JA, Singer RH. Single-molecule analysis of gene expression using two-color RNA labeling in live yeast. Nat Methods. 2013;10:119–121. doi: 10.1038/nmeth.2305. [DOI] [PMC free article] [PubMed] [Google Scholar]
- Hopmann R, Duncan D, Duncan I. Transvection in the iab-5,6,7 region of the bithorax complex of Drosophila: homology independent interactions in trans. Genetics. 1995;139:815–833. doi: 10.1093/genetics/139.2.815. [DOI] [PMC free article] [PubMed] [Google Scholar]
- Indjeian VB, Kingman GA, Jones FC, Guenther CA, Grimwood J, Schmutz J, Myers RM, Kingsley DM. Evolving New Skeletal Traits by cis-Regulatory Changes in Bone Morphogenetic Proteins. Cell. 2016;164:45–56. doi: 10.1016/j.cell.2015.12.007. [DOI] [PMC free article] [PubMed] [Google Scholar]
- Kravchenko E, Savitskaya E, Kravchuk O, Parshikov A, Georgiev P, Savitsky M. Pairing between gypsy insulators facilitates the enhancer action in trans throughout the Drosophila genome. Mol Cell Biol. 2005;25:9283–9291. doi: 10.1128/MCB.25.21.9283-9291.2005. [DOI] [PMC free article] [PubMed] [Google Scholar]
- Kyrchanova O, Chetverina D, Maksimenko O, Kullyev A, Georgiev P. Orientation-dependent interaction between Drosophila insulators is a property of this class of regulatory elements. Nucleic Acids Res. 2008;36:7019–7028. doi: 10.1093/nar/gkn781. [DOI] [PMC free article] [PubMed] [Google Scholar]
- Lewis EB. The Theory and Application of a New Method of Detecting Chromosomal Rearrangements in Drosophila melanogaster. The American Naturalist. 1954;88:225–239. [Google Scholar]
- Li M, Ma Z, Liu JK, Roy S, Patel SK, Lane DC, Cai HN. An Organizational Hub of Developmentally Regulated Chromatin Loops in the Drosophila Antennapedia Complex. Mol Cell Biol. 2015;35:4018–4029. doi: 10.1128/MCB.00663-15. [DOI] [PMC free article] [PubMed] [Google Scholar]
- Ling JQ, Li T, Hu JF, Vu TH, Chen HL, Qiu XW, Cherry AM, Hoffman AR. CTCF mediates interchromosomal colocalization between Igf2/H19 and Wsb1/Nf1. Science. 2006;312:269–272. doi: 10.1126/science.1123191. [DOI] [PubMed] [Google Scholar]
- Lomvardas S, Barnea G, Pisapia DJ, Mendelsohn M, Kirkland J, Axel R. Interchromosomal interactions and olfactory receptor choice. Cell. 2006;126:403–413. doi: 10.1016/j.cell.2006.06.035. [DOI] [PubMed] [Google Scholar]
- Lucas T, Ferraro T, Roelens B, De Las Heras Chanes J, Walczak AM, Coppey M, Dostatni N. Live imaging of Bicoid-dependent transcription in Drosophila embryos. Curr Biol. 2013;23:2135–2139. doi: 10.1016/j.cub.2013.08.053. [DOI] [PubMed] [Google Scholar]
- Martínez-Laborda A, González-Reyes A, Morata G. Trans regulation in the Ultrabithorax gene of Drosophila: alterations in the promoter enhance transvection. EMBO J. 1992;11:3645–3652. doi: 10.1002/j.1460-2075.1992.tb05449.x. [DOI] [PMC free article] [PubMed] [Google Scholar]
- Mellet DJ, Truman JW. Transvection is common throughout the Drosophila genome. Genetics. 2012;191:1129–1141. doi: 10.1534/genetics.112.140475. [DOI] [PMC free article] [PubMed] [Google Scholar]
- Mir M, Reimer A, Haines JE, Li XY, Stadler M, Garcia H, Eisen MB, Darzacq X. Dense Bicoid hubs accentuate binding along the morphogen gradient. Genes Dev. 2017;31:1784–1794. doi: 10.1101/gad.305078.117. [DOI] [PMC free article] [PubMed] [Google Scholar]
- Nègre N, Brown CD, Shah PK, Kheradpour P, Morrison CA, Henikoff JG, Feng X, Ahmad K, Russell S, White RA, Stein L, Henikoff S, Kellis M, White KP. A comprehensive map of insulator elements for the Drosophila genome. PLoS Genet. 2010;6:e1000814. doi: 10.1371/journal.pgen.1000814. [DOI] [PMC free article] [PubMed] [Google Scholar]
- Ohtsuki S, Levine M, Cai HN. Different core promoters possess distinct regulatory activities in the Drosophila embryo. Genes Dev. 1998;12:547–556. doi: 10.1101/gad.12.4.547. [DOI] [PMC free article] [PubMed] [Google Scholar]
- Peifer M, Bender W. The anterobithorax and bithorax mutations of the bithorax complex. EMBO J. 1986;5:2293–2303. doi: 10.1002/j.1460-2075.1986.tb04497.x. [DOI] [PMC free article] [PubMed] [Google Scholar]
- Perry MW, Boettiger AN, Bothma JP, Levine M. Shadow enhancers foster robustness of Drosophila gastrulation. Curr Biol. 2010;20:1562–1567. doi: 10.1016/j.cub.2010.07.043. [DOI] [PMC free article] [PubMed] [Google Scholar]
- Rao SS, Huntley MH, Durand NC, Stamenova EK, Bochkov ID, Robinson JT, Sanborn AL, Machol I, Omer AD, Lander ES, Aiden EL. A 3D map of the human genome at kilobase resolution reveals principles of chromatin looping. Cell. 2014;159:1665–1680. doi: 10.1016/j.cell.2014.11.021. [DOI] [PMC free article] [PubMed] [Google Scholar]
- Ren X, Sun J, Housden BE, Hu Y, Roesel C, Lin S, Liu LP, Yang Z, Mao D, Sun L, Wu Q, Ji JY, Xi J, Mohr SE, Xu J, Perrimon N, Ni JQ. Optimized gene editing technology for Drosophila melanogaster using germ line-specific Cas9. Proc Natl Acad Sci U S A. 2013;110:19012–19017. doi: 10.1073/pnas.1318481110. [DOI] [PMC free article] [PubMed] [Google Scholar]
- Ringrose L. Transgenesis in Drosophila melanogaster. Methods Mol Biol. 2009;561:3–19. doi: 10.1007/978-1-60327-019-9_1. [DOI] [PubMed] [Google Scholar]
- Saad H, Gallardo F, Dalvai M, Tanguy-le-Gac N, Lane D, Bystricky K. DNA dynamics during early double-strand break processing revealed by nonintrusive imaging of living cells. PLoS Genet. 2014;10:e1004187. doi: 10.1371/journal.pgen.1004187. [DOI] [PMC free article] [PubMed] [Google Scholar]
- Southworth JW, Kennison JA. Transvection and silencing of the Scr homeotic gene of Drosophila melanogaster. Genetics. 2002;161:733–746. doi: 10.1093/genetics/161.2.733. [DOI] [PMC free article] [PubMed] [Google Scholar]
- Spana C, Harrison DA, Corces VG. The Drosophila melanogaster suppressor of Hairy-wing protein binds to specific sequences of the gypsy retrotransposon. Genes Dev. 1988;2:1414–1423. doi: 10.1101/gad.2.11.1414. [DOI] [PubMed] [Google Scholar]
- Tsai A, Muthusamy AK, Alves MR, Lavis LD, Singer RH, Stern DL, Crocker J. Nuclear microenvironments modulate transcription from low-affinity enhancers. Elife. 2017;6 doi: 10.7554/eLife.28975. [DOI] [PMC free article] [PubMed] [Google Scholar]
- Tsai JH, McKee BD. Homologous pairing and the role of pairing centers in meiosis. J Cell Sci. 2011;124:1955–1963. doi: 10.1242/jcs.006387. [DOI] [PubMed] [Google Scholar]
- Venken KJ, He Y, Hoskins RA, Bellen HJ. P[acman]: a BAC transgenic platform for targeted insertion of large DNA fragments in D. melanogaster. Science. 2006;314:1747–1751. doi: 10.1126/science.1134426. [DOI] [PubMed] [Google Scholar]
- Zhou J, Ashe H, Burks C, Levine M. Characterization of the transvection mediating region of the Abdominal-B locus in Drosophila. Development. 1999;126:3057–3065. doi: 10.1242/dev.126.14.3057. [DOI] [PubMed] [Google Scholar]
Associated Data
This section collects any data citations, data availability statements, or supplementary materials included in this article.
Supplementary Materials
Fluorescent intensity (left), temporal 3D location (middle), and cumulative 3D trace (right) of MS2-lacZ and PP7-lacZ transcriptional foci in the nucleus shown in Figure 3B-D.
Fluorescent intensity (left), temporal 3D location (middle), and cumulative 3D trace (right) of MS2-lacZ and PP7-lacZ transcriptional foci in the nucleus shown in Figure 3E-G.
Maximum projection of MS2-lacZ and PP7-lacZ in nc 14. MCP-GFP is shown in green, mCherry-PCP is shown in red and His2Av-eBFP2 is shown in blue.
Fluorescent intensity (left), temporal 3D location (middle), and cumulative 3D trace (right) of MS2-lacZ and PP7-lacZ transcriptional foci in the nuclei shown in Figure 4.
Fluorescent intensity (left), temporal 3D location (middle), and cumulative 3D trace (right) of MS2-lacZ and PP7-lacZ transcriptional foci in the nuclei shown in Figure S4.
Raw image (left) and fluorescence intensity (right) of MS2-lacZ transcriptional focus in the nucleus shown in Figure 6B (top) and Figure 6D (bottom).
Maximum projection of MS2-lacZ (inserted at VK00033 landing site; Venken et al., 2006) and PP7-lacZ (inserted at VK00031 landing site; Venken et al., 2006) in nc 14. MCP-GFP is shown in green, mCherry-PCP is shown in red and His2Av-eBFP2 is shown in blue.