Abstract
Death receptors (DR4 and DR5) offer attractive targets for cancer treatment because cancer cell death can be induced by apoptotic signal upon binding of death ligands such as tumor necrosis factor-related apoptosis-inducing ligand (TRAIL) with death receptors. Cyclometalated iridium(III) complexes such as fac-Ir(tpy)3 (tpy = 2-(4-tolyl)pyridine) possess a C 3-symmetric structure like TRAIL and exhibit excellent luminescence properties. Therefore, cyclometalated Ir complexes functionalized with DR-binding peptide motifs would be potent TRAIL mimics to detect cancer cells and induce their cell death. In this study, we report on the design and synthesis of C 3-symmetric and luminescent Ir complex-peptide hybrids (IPHs), which possess cyclic peptide that had been reported to bind DR5. The results of 27 MHz quartz-crystal microbalance (QCM) measurements of DR5 with IPHs and costaining experiments of IPHs and anti-DR5 antibody, suggest that IPHs bind with DR5 and undergo internalization into cytoplasm, possibly via endocytosis. It was also found that IPHs induce slow cell death of these cancer cells in a parallel manner to the DR5 expression level. These results indicate that IPHs may offer a promising tool as artificial luminescent mimics of death ligands to develop a new category of anticancer agents that detect and kill cancer cells.
1. Introduction
Death receptors (DRs) are often overexpressed on the cell membrane of cancer cells and bind with death ligands such as tumor necrosis factor-related apoptosis-inducing ligand (TRAIL) to send the cell extrinsic apoptotic signal [1]. TRAIL receptors comprise five categories, plasma membrane-expressed TRAIL-R1 (DR4), TRAIL-R2 (DR5), TRAIL-R3 (DcR1), TRAIL-R4 (DcR2), and a soluble receptor, osteoprotegerin (OPG). DR4 and DR5 contain death domain (DD) to transduce apoptotic signals and hence named as death receptors, whereas DcR1 and DcR2 are unable to induce cell death and regarded as decoy receptors [1–7]. TRAIL is a C 3-symmetric protein, consists of three monomeric units, and binds with three DRs [8, 9]. Upon binding of DR with TRAIL, TRAIL-DR cluster sets up death-inducing signaling complex (DISC) at their cytoplasmic death domain (DD) and recruits adaptor protein (FADD) via death-effector domain (DED). The signaling activates procaspase-8 to caspase-8 and then caspase-3 in order to cleave multiple substrates to execute cell death [10]. The nonsignaling DcR1 does not contain cytoplasmic DD, and DcR2 is very similar to death receptors but contains a truncated form of DD. Therefore, both DcR1 and DcR2 are unable to assemble DISC [4–6].
Since death receptors are overexpressed in various types of cancer cells, TRAIL is capable of selectively inducing apoptosis of cancer cells with low cytotoxicity in normal cells [11–19]. Therefore, death receptors have been conceived as promising targets for the treatment and imaging of cancer cells. To date, only limited examples of artificial death receptor binders having TRAIL-like functionalities are reported. Representative examples include DR5 binding peptides [20–26], zinc-binding site peptide of TRAIL (RNSCWSKD that was screened out from TRAIL (227–234)) [27], and small molecular TRAIL mimics (bioymifi) [28].
Meanwhile, cyclometalated iridium (Ir(III)) complexes such as fac-Ir(tpy)3 1 (tpy = 2-(4-tolyl)pyridine) (Figure 1) draw increasing attention as one of the imaging tools to study extra- and intracellular events, in addition to organic light-emitting diodes (OLEDs) such as phosphorescent emitters [29–33] because of their significant stability and excellent photophysical properties under physiological conditions [31, 33–39]. Such types of Ir complex analogues have been widely applied to oxygen sensors [40, 41], chemosensors [42–47], and luminescent probes for biological systems [48–66]. These advantages originate from their high-luminescence quantum yields, the long luminescence lifetimes (τ∼µs) that can eliminate the short-lived autofluorescence (τ∼ns) from biological samples in cellular imaging, and significant stokes shift that minimizes self-quenching process [29–39]. We previously reported some examples of Ir complexes that can be functionalized as blue∼green∼red and white color emitters [67–71], pH sensors [68–70], photosensitizers [68–70], and cell death inducer of cancer cells [68–70]. Recently, we have reported on Ir complexes (2a-f and 3a-c) having cationic peptides (typically, H2N-KKGG-) (Figure 1) as inducers and detectors of cell death of Jurkat cells (a human T-lymphoma cell line) [72–74]. These results suggest that Ir complexes are potential agents for the diagnosis and treatment of cancer and related diseases and even for mechanistic study of cell death processes.
Figure 1.
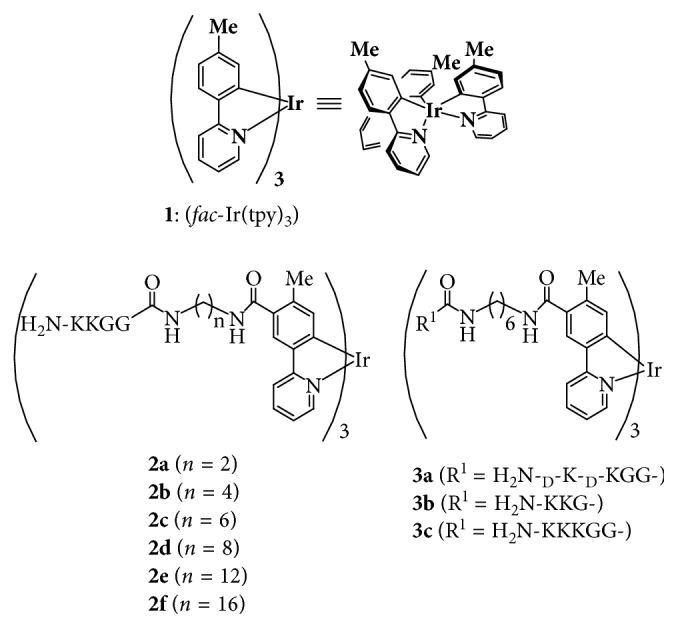
Ir complexes having cationic peptides.
Because cyclometalated iridium (Ir(III)) complexes such as fac-Ir(tpy)3 1 possess a C 3-symmetric structure like TRAIL (the top of Figure 2), it is hypothesized that these complexes could be good scaffolds to mimic TRAIL. In this manuscript, we report on the design and synthesis of some new C 3-symmetric tris-cyclometalated Ir complexes having cyclic peptides (Figure 2) [20–22], which had been reported to be able to bind DR5, for selective staining and induction of cell death of cancer cells. The Ir complexes 4–6 were synthesized by regioselective substitution reactions reported by us [75] and the successive coupling reactions with cyclic peptides [20–22]. Due to low solubility of 4 in water, Ser-Gly-Ser-Gly (SGSG) was inserted at the N-terminus of the peptide parts of 5-6 to improve their solubility. The results of 27 MHz quartz-crystal microbalance (QCM) measurements of DR5 with 5 and 6 and costaining experiments of Jurkat cells with 5 and anti-DR5 antibody that 5 and 6 bind to DR5 at the different sites from the recognition sites of anti-DR5 antibody. Some cancer cell lines such as Jurkat cells, K562 cells, and Molt-4 cells were stained with 5 for luminescence microscopic observation, showing that Ir complexes exhibit green emitting spots localized inside the cell. In addition, it was turned out that 5 induces cell death of Jurkat cells more slowly than those by 2c-d (5 requires almost 24 h to induce considerable cell death, while 2c, 2d, 3a, and 3c induce cell death in a couple of hours). Binding of 5 to cancer cells and its cytotoxicity against cancer cells are dependent on the DR5 expression level of cancer cells. Further mechanistic studies suggest that cell death induced by 5 is necrotic type. Interestingly, the treatment of cancer cells with 5 and then with anti-DR5 antibody lowers the staining level on cell membrane of Jurkat cells by anti-DR5 antibody, indicating that DR5 undergoes endocytosis upon binding with 5. Furthermore, it was found that DR5 moved from cytoplasm to the cell membrane or reproduced on the cell membrane after additional incubation for 6 h. Finally, detection of Jurkat cells spiked in bovine blood is demonstrated. To the best of our knowledge, 5 is the first example of artificial luminescent death ligand that detects cancer cells and induces their necrosis-type cell death.
Figure 2.
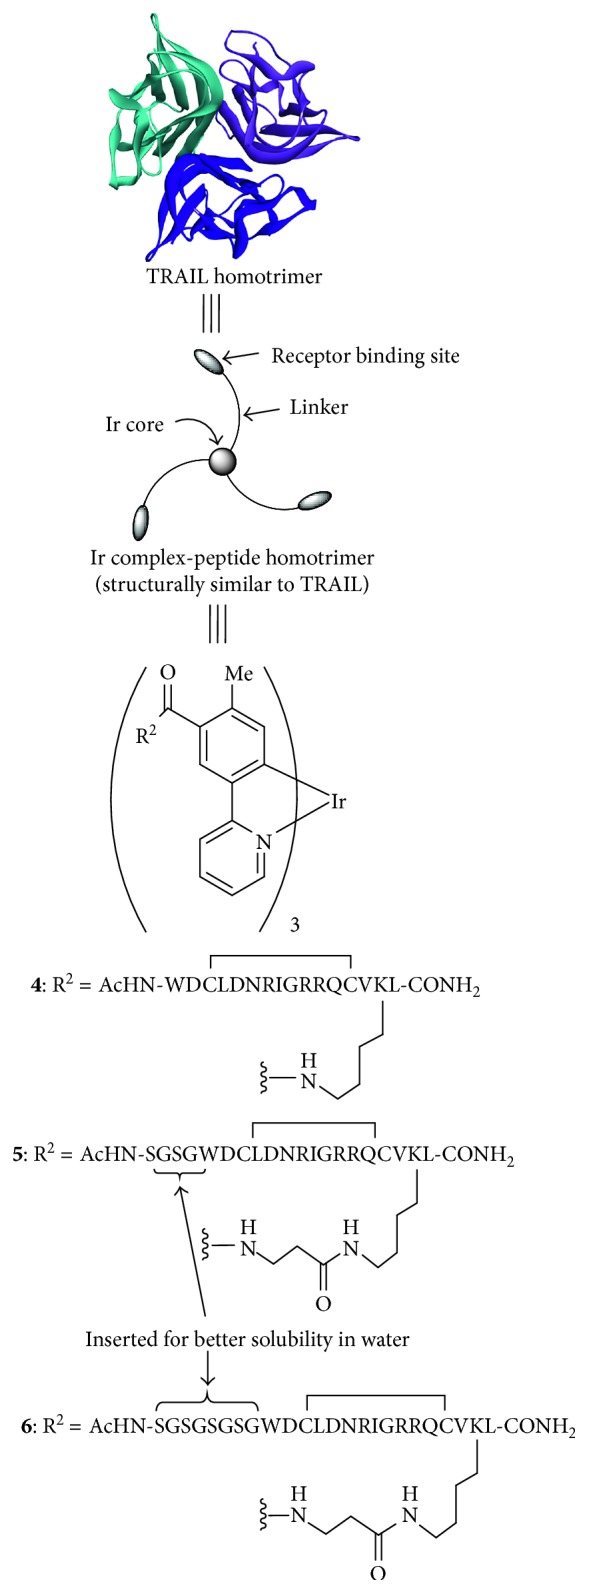
C 3-symmetric tris-cyclometalated Ir complex-peptide hybrids (IPHs).
2. Experimental Section
2.1. General Information
All reagents and solvents were purchased from commercial suppliers and were used without further purification, unless otherwise noted. MTT (3-(4,5-dimethyl-2-thiazolyl)-2,5-diphenyl-2H-tetrazolium bromide) was purchased from Dojindo. Z-VAD-FMK (Z-Val-Ala-Asp(OMe) fluoromethylketone) was purchased from the Peptide Institute. Necrostatin-1 and IM-54 were purchased from Enzo Life Sciences. Anti-DR5 antibody [DR5-01-1] (phycoerythrin) (ab55863) was purchased from Abcam. TRAIL/Apo2L (human recombinant), chloroquine diphosphate, verapamil hydrochloride, and nicardipine hydrochloride were purchased from Wako Pure Chemical Industries. The oligomycin complex was purchased from Cayman Chemical Co., quinidine and 4-aminopyridine were purchased from TCI. CCCP (carbonyl cyanide 3-chlorophenylhydrazone), and bafilomycin A1 and amiloride hydrochloride were purchased from Sigma-Aldrich. Propidium iodide and NaN3 were purchased from Nacalai Tesque. Annexin V-Cy3 was purchased from BioVision, Inc. All aqueous solutions were prepared using deionized and distilled water. UV spectra were recorded on a JASCO V-550 spectrophotometer, equipped with a temperature controller unit at 25 ± 0.1°C. Emission spectra were recorded on a JASCO FP-6200 and FP-6500 spectrometers. IR spectra were recorded on a Perkin-Elmer FT-IR spectrophotometer (Spectrum100). 1H NMR (300 MHz) spectra were recorded on a JEOL Always 300 spectrometer. Tetramethylsilane (TMS) was used as an internal reference for 1H measurements in CDCl3 and CD3OD, and 3-(Trimethylsilyl)-propionic-2,2,3,3-d 4 acid (TSP) sodium salt was used as an external reference for 1H NMR measurement in D2O. Mass spectral measurements were performed on a JEOL JMS-SX102A and Varian TQ-FT. Luminescence imaging studies were performed using fluorescent microscope (Biorevo, BZ-9000, Keyence). Thin-layer chromatographies (TLC) and silica gel column chromatographies were performed using Merck Art. 5554 (silica gel) TLC plate and Fuji Silysia Chemical FL-100D, respectively. HPLC experiments were carried out using a system consisting of two PU-980 intelligent HPLC pumps (JASCO, Japan), a UV-970 intelligent UV-visible detector (JASCO), a Rheodine injector (Model no. 7125), and a Chromatopak C-R6A (Shimadzu, Japan). For analytical HPLC, the Senshu Pak Pegasil ODS column (Senshu Scientific Co., Ltd.) (4.6φ × 250 mm, No. 07051001) was used. For preparative HPLC, the Senshu Pak Pegasil ODS SP100 column (Senshu Scientific Co., Ltd.) (20φ × 250 mm, No. 1302014G) was used. Lyophilization was performed with the freeze-dryer FD-5N (EYELA).
2.2. Synthesis of Ir Complexes and Peptide Units
Ir Complexes 1 and 7: These complexes were synthesized according to our previously reported procedure [75].
Ir Complex 8: A solution of Ir complex 7 (50 mg, 0.06 mmol), DIEA (190 µL, 1.08 mmol), and PyBOP (283 mg, 0.54 mmol) in distilled DMF (3 mL) was stirred for 10 min at room temperature, to which β-alanine ethyl ester (84 mg, 0.54 mmol) was added. The whole solution was stirred for 18 h and concentrated under reduced pressure. The remaining residue was extracted with CHCl3/H2O, dried over Na2SO4, concentrated under reduced pressure, and purified by silica gel column chromatography. (hexanes: AcOEt = 2 : 3 → 1 : 2 → 1 : 4 → 1 : 6) to obtain Ir complex 8 as a yellow solid. This Ir complex (30 mg, 0.026 mmol) and 5 M LiOH (25 mg, 1.06 mmol) in H2O/THF (1/1, 9 mL) was stirred at 60°C for 17 h, and then 2 N HCl (pH = 1) was added to form precipitate. The precipitate was filtrated and washed with H2O to give Ir complex 8 as a yellow solid (26 mg, 41% from 7). IR (ATR): ν = 3279, 2924, 2579, 1975, 1712, 1586, 1527, 1471, 1259, 1186, 1068, 1022, 892, 781, and 750 cm−1. 1H NMR (CD3OD, 300 MHz): δ = 8.04 (d, 3H, J = 8.1 Hz), 7.74 (m, 6H), 7.47 (d, 3H, J = 5.4 Hz), 6.98 (t, 3H, J = 7.5 Hz), 6.69 (s, 3H), 3.59 (t, 6H, J = 5.1 Hz), 2.63 (t, 6H, J = 6.9 Hz), and 2.12 (s, 9H) ppm. ESI-MS (m/z): calcd. for C48H45IrN6O9 [M]+: 1042.28773 and found: 1042.28784.
Ir Complex 9 [72]: DIEA (63 mg, 0.5 mmol), PyBOP (126.6 mg, 0.24 mmol), and mono-Boc-protected hexamethylenediamine (103 mg, 0.5 mmol) were added to a solution of 7 (33 mg, 0.039 mmol) in distilled DMF (1 mL). The reaction mixture was stirred at room temperature for 36 h and then concentrated under reduced pressure. The remaining residue was purified by silica gel column chromatography (CHCl3/MeOH, 1/0 to 50/1 to 0/1), gel permeation chromatography (CHCl3), and recrystallization from hexanes/CHCl3 to afford the Boc-protected 9 as a yellow solid. A mixture of TMSCl (21 mg, 0.46 mmol) and NaI (70 mg, 0.46 mmol) in CH3CN (1 mL) was added to a suspension of Boc-protected 9 (21.6 mg, 15 μmol) in CH3CN (3.3 mL). The mixture was stirred at room temperature for 10 min and sonicated for 2 min. The insoluble compound was centrifuged and washed with CH3CN to give 9 as the HI salt. The product was purified by preparative HPLC (H2O (0.1% TFA)/CH3CN (0.1% TFA) = 80/20 to 50/50 (30 min), t r = 21 min, 6.0 mL/min), followed by lyophilization to give 9 as a yellow solid (41 mg, 62% as 3 TFA salt). IR (ATR): ν = 2934, 2862, 2035, 1674, 1600, 1531, 1472, 1425, 1262, 1199, 1069, 892, 781, and 721 cm−1. 1H NMR (D2O, 300 MHz): δ = 8.04 (d, 3H, J = 8.41 Hz), 7.82–7.76 (m, 6H), 7.69 (d, 3H J = 5.4 Hz), 7.09–7.05 (t, 3H J = 6.0 Hz), 6.58 (s, 3H), 3.38–3.33 (m, 6H), 3.01–2.96 (t, 6H, J = 6.9 Hz), 2.11 (s, 9H), 1.68–1.62 (m, 12H), and 1.43 (m, 12H) ppm. ESI-MS (m/z): calcd for C57H73IrN9O3 [M + H]+: 1124.54656 and found: 1124.54487.
Fmoc-Leu-NH-SAL-Trt(2-Cl)-resin: NH2-SAL-Trt (2-Cl)-resin (500 mg, 0.54 mmol/g) was suspended in DMF (2.5 mL), to which a mixture of Fmoc-Leu-OH (3 eq.), DIC (4 eq.), and HOBt (4 eq.) was added. After stirring for 2 h, the residue was filtrated, washed with DMF, CH2Cl2, and ether, and dried in vacuo. The amount of Fmoc-Leu-OH loaded on the resin was determined by UV absorption of the Fmoc derivative at 301 nm (ε 301nm = 7800 M−1·cm−1) after treatment with 20% (v/v) piperidine in DMF. Yield: 593 mg (loading: 0.43 mmol/g resin).
Cyclic peptide CP1: Fmoc-protecting group of Fmoc-Leu-NH-SAL-Trt(2-Cl)-resin (500 mg, 0.43 mmol) was deprotected by treatment with 20% piperidine in DMF. Each Fmoc-Xaa-OH (4 eq.) was coupled at 45°C for 1 h to the Fmoc-deprotected resin in the presence of DIC (4 eq.) and HOBt (8 eq.) in DMF (2.5 mL). After the last deprotection, the N-terminus was acetylated using Ac2O (4 eq.) and DIEA (4 eq.) in DMF (2.5 mL). The peptide was cleaved from the resin and also deprotected using a mixture of TFA/H2O/TIPS/thioanisole (85/2.5/10/2.5). After 4 h of stirring, the resin was filtered and washed with TFA. After evaporation of TFA, the precipitation was obtained by adding cooled Et2O and collected by centrifugation. The crude product was purified by preparative HPLC (H2O (0.1% TFA)/CH3CN (0.1% TFA) = 80/20→50/50 (30 min) t r = 11 min, 1 mL/min), lyophilized to give CP1 as a linear form. The linear form of CP1 was subjected to cyclization using 0.1 mM aq. NH4HCO3 (1 mg/1 mL). After cyclization reaction for 12–24 h, the solution was concentrated and the remaining residue was purified again by preparative HPLC (H2O (0.1% TFA)/CH3CN (0.1% TFA) = 80/20→50/50 (30 min), t r = 7.5 min, 1 mL/min), lyophilized to give CP1 as white powder (217 mg, 26%). IR (ATR): ν = 3217, 2992, 2291, 2167, 2097, 2031, 1980, 1637, 1508, 1434, 1173, 1118, 839, 800, and 723 cm−1. 1H NMR (D2O, 300 MHz): δ = 7.62 (m, 1H), 7.46 (m, 1H), 7.23 (m, 2H), 7.22 (m, 1H), 5.59 (s, 1H), 4.29 (m, 17H), 3.91 (s, 1H), 3.34 (s, 1H), 2.80 (s, 8H), 2.55 (m, 3H), 2.49 (m, 3H), 2.34 (m, 6H), 1.95 (m, 5H), 1.59 (m, 7H), 1.41 (m, 31H), 1.29 (m, 2H), and 0.98 (m, 50H) ppm. ESI-MS (m/z): calcd for C85H142N30O23S6 [M + 2H]2+: 1008.01809 Found: 1008.01709.
Cyclic peptides CP2 and CP3 were prepared according to the same procedure described for cyclic peptide CP1.
Cyclic peptide CP2: white powder (371 mg, 29% over two steps). HPLC: (H2O (0.1% TFA)/CH3CN (0.1% TFA) = 90/10→60/40 (30 min), t r = 16 min, 1 mL/min). IR (ATR): ν = 3283, 2939, 2167, 2027, 1980, 1651, 1533, 1431, 1177, 1119, 1044, 891, 840, 798, 721, and 655 cm−1. 1H NMR (D2O, 300 MHz): δ = 7.49 (m, 1H), 7.38 (m, 1H), 7.20 (m, 2H), 7.09 (m, 1H), 4.97 (m, 24H), 3.86 (m, 12H), 3.17 (m, 24H), 2.09 (m, 24H), 1.62 (m, 29H), and 0.90 (m, 38H) ppm. ESI-MS (m/z): calcd. for C95H159N34O29S2 [M + 3H]3+: 768.71559 and found: 768.71568.
Cyclic peptide CP3: white powder (18 mg, 23% over two steps). HPLC: (H2O (0.1% TFA)/CH3CN (0.1% TFA) = 90/10→60/40 (30 min), t r = 11 min, 1 mL/min). IR (ATR): ν = 3287, 3071, 2965, 2547, 2045, 1778, 1651, 1532, 1440, 1290, 1155, 1042, 845, 700, and 578 cm−1. 1H NMR (D2O, 300 MHz): δ = 7.51 (m, 1H), 7.38 (m, 1H), 7.20 (m, 2H), 7.10 (m, 1H), 4.97 (m, 31H), 3.86 (m, 18H), 3.17 (m, 27H), 2.09 (m, 24H), 1.62 (m, 29H), and 0.90 (m, 38H) ppm. ESI-MS (m/z): calcd for C105H175N38O35S2 [M + 3H]3+: 864.41581 and found: 864.41735.
Ir Complex 4: EDC (832 mg, 4.34 mmol) and NHS (500 mg, 4.34 mmol) was added to a solution of 7 (120 mg, 0.14 mmol) in DMF (12 mL). The reaction mixture was stirred for 24 h at room temperature and concentrated under reduced pressure. After addition of CHCl3, organic layer was washed with sat. NH4Cl. The combined organic layer was washed with H2O, dried over Na2SO4, filtered, and concentrated under reduced pressure to give NHS ester of 7 as a yellow solid (110 mg, 67%). IR (ATR): ν = 2941, 2162, 1705, 1581, 1519, 1380, 1293, 1206, 1066, 976, 886, and 648 cm−1. 1H-NMR (CDCl3, 300 MHz): δ = 8.45 (s, 3H), 8.00 (d, 3H, J = 7.8), 7.73 (t, 3H, J = 7.8), 7.42 (d, 3H, J = 5.7), 6.97 (t, 3H, J = 6.0), 6.82 (s, 3H), 2.89 (s, 12H), and 2.42 (s, 9H) ppm. ESI-MS (m/z): calcd for C51H39IrN6O12 [M]+: 1120.22552. Found: 1120.22641. NHS ester of Ir complex 7 (1 mg, 0.8 µmol) was added to a solution of CP1 (5.39 mg, 2.6 µmol) and DIEA (4.7 µL, 0.026 mmol) in DMF (100 μL) and stirred for 24 h at room temperature in the dark. After that, 0.1% TFA H2O was added to the reaction mixture and the crude product was purified by preparative HPLC (H2O (0.1% TFA)/CH3CN (0.1% TFA) = 80/20→50/50 (30 min), t r = 21 min, (1 mL/min)), lyophilized to give 4 as a yellow powder (3.8 mg, 43% from 7). IR (ATR): ν = 32879, 2320, 1981, 1638, 1535, 1426, 1264, 1201, 1134, 923, 835, 800, and 722 cm−1. 1H NMR (DMSO, 300 MHz): δ = 8.26 (s, 3H), 8.22 (s, 7H), 8.15 (m, 10H), 7.83 (m, 8H), 7.40 (m, 8H), 7.30 (m, 12H), 7.13 (m, 21H), 6.96 (s, 13H), 6.55 (s, 3H), 4.23 (m, 6H), 4.12 (m, 14H), 3.11 (s, 3H), 2.51 (m, 29H), 2.49 (m, 10H), 2.48 (m, 24H), 2.22 (m, 12H), 1.76 (s, 7H), 1.47 (m, 36H), 1.3 (s, 3H), and 0.80 (m, 41) ppm. ESI-MS (m/z); calcd for C294H450IrN93O72S6 [M + 6H]6+: 1137.2104 and found: 1137.20847.
Ir Complex 5: EDC (137 mg, 0.71 mmol) and NHS (83 mg, 0.71 mmol) was added to a solution of 8 (25 mg, 0.023 mmol) in DMF (2.5 mL). The resulting solution was stirred for 24 h at room temperature. The reaction mixture was concentrated under reduced pressure. After addition of CHCl3, the organic layer was washed with sat. NH4Cl. The combined organic layer was washed with H2O, and then dried over Na2SO4, filtered, and concentrated under reduced pressure to give NHS ester of 8 as a yellow solid (20 mg, 62%). IR (ATR): ν = 3743, 3318, 2925, 1815, 1780, 1706, 1471, 1375, 1260, 1204, 1131, 1067, 994, 781, and 648 cm−1. 1H-NMR (CDCL3, 300 MHz): δ 7.94 (d, 3H, J = 8.1), 7.73 (s, 3H), 7.58 (t, 3H, J = 7.8), 7.40 (d, 3H, J = 5.1), 6.84 (t, 3H, J = 6.3), 6.67 (s, 3H), 6.50 (t, 3H, J = 6.6), 3.81 (d, 6H, J = 5.1), 2.95 (t, 6H, J = 6.3), 2.91 (s, 12H), and 2.23 (s, 9H). ESI-MS (m/z): calcd for C60H54IrN9O15 [M]+: 1333.33686 and found: 1333.33747. NHS ester of Ir complex 8 (6 mg, 0.0044 mmol) was added to a solution of CP2 (31.06 mg, 0.013 mmol) and DIEA (23 µL, 0.134 mmol) in DMF (600 μL) and stirred for 24 h at room temperature in the dark. The reaction mixture was diluted with 0.1% TFA H2O and purified by preparative HPLC (H2O (0.1% TFA)/CH3CN (0.1% TFA) = 80/20→50/50 (30 min), t r = 10 min, 1 mL/min), lyophilized to give 5 as a yellow powder (15.45 mg, 27% from 8). IR (ATR): ν = 3282, 3074, 2964, 2054, 1980, 1639, 1531, 1472, 1425, 1261, 1181, 915, 799, and 720 cm−1. 1H NMR. (D2O, 300 MHz): δ = 7.68 (s, 3H), 7.46 (s, 3H), 7.08 (m, 6H), 6.89 (m, 3H), 6.68 (s, 3H), 3.79 (m, 18H), 3.73 (m, 7H), 3.71 (m, 11H), 3.25 (m, 18H), 3.23 (m, 12H), 3.18 (m, 13H), 2.73 (m, 5H), 2.24 (m, 193H), 2.23 (m, 20H), 2.00 (m, 11H), 1.63 (m, 45), 1.35 (m, 50H) 1.15 (m, 12H), and 0.89 (m, 74H) ppm. ESI-MS (m/z): calcd. for C333H513IrN108O93S6 [M + 6H]6+: 1316.94104. Found: 1316.94569.
Ir complex 6 was prepared according to the same procedure described for 5.
Ir Complex 6: yellow powder (8.3 mg, 21% from 8). HPLC: (H2O (0.1% TFA)/CH3CN (0.1% TFA) = 90/10→60/40 (30 min), t r = 12 min, 1 mL/min). IR (ATR): ν = 3383, 2963, 2014, 1984, 1638, 1535, 1475, 1262, 1200, 1057, 836, 799, and 720 cm−1. 1H NMR (D2O, 300 MHz): δ = 7.72 (s, 3H), 7.42 (s, 3H), 7.17 (m, 6H), 6.95 (m, 3H), 6.78 (s, 3H), 3.86 (m, 23H), 3.71 (m, 38H), 3.23 (m, 42H), 2.73 (m, 31H), 2.07 (m, 12H), 1.92 (m, 70H), 1.62 (m, 69H), 1.34 (m, 132H), and 0.88 (m, 120H) ppm. ESI-MS (m/z): calcd for C363H563IrN120O111S6 [M + 8H]8+: 1096.00145 and found: 1096.00136.
2.3. UV/Vis Absorption and Luminescence Spectra Measurements
UV/Vis spectra were recorded on a JASCO V-550 UV/Vis spectrophotometer equipped with a temperature controller, and emission spectra were recorded on a JASCO FP-6200 spectrofluorometer at 25°C. Before the luminescence measurements, sample aqueous solutions were degassed by Ar bubbling for 10 min in quartz cuvettes equipped with Teflon septum screw caps. Concentrations of all the Ir complexes in stock solutions (DMSO) were determined based on a molar extinction coefficient of 380 nm (ε 380nm = 1.08 ±0.07 × 10⁴ M−1·cm−1). Quantum yields for luminescence (Φ) were determined by comparing with the integrated corrected emission spectrum of a quinine sulfate standard, whose emission quantum yield in 0.1 M H2SO4 was assumed to be 0.55 (excitation at 366 nm). Equation (1) was used to calculate the emission quantum yields, in which Φs and Φr denote the quantum yields of the sample and reference compounds, η s and η r are the refractive indexes of the solvents used for the measurements of the sample and reference, A s and A r are the absorbance of the sample and the reference, and I s and I r stand for the integrated areas under the emission spectra of the sample and reference, respectively (all of the Ir compounds were excited at 366 nm for luminescence measurements in this study):
| (1) |
The luminescence lifetimes of sample solutions were measured on a TSP1000-M-PL (Unisoku, Osaka, Japan) instrument by using THG (355 nm) of Nd:YAG laser, Minilite I (Continuum, CA, USA), at 25°C in degassed aqueous solutions. The R2949 photomultiplier were used to monitor the signals. Data were analyzed using the nonlinear least-squares procedure.
2.4. 27 MHz Quartz Crystal Microbalance (QCM) Analysis
QCM analysis was performed on an Affinix-Q4 apparatus (Initium Inc., Japan). The clean Au (4.9 mm2) electrode equipped on the quartz crystal was incubated with an aqueous solution of 3,3′-dithiodipropionic acid (3 mM, 4 μL) at room temperature for 60 min. After washing with distilled water, the surface was activated by a mixture of EDC·HCl (0.52 M) and N-hydroxy succinimide (0.87 M) for 30 min, washed with distilled water, and then treated with DR5 (100 μg/mL, 4 μL) at room temperature for 60 min. After washing with distilled water, an aqueous solution of 1 M ethanolamine (5 μL) was added as a blocking reagent. After washing with distilled water, cell was filled with phosphate-buffered saline (PBS) (500 μL). The apparent binding constants (K app) for IPHs with DR5 in PBS were calculated from the decrease in frequency. The nonspecific response was subtracted from frequency decrease curve to obtain apparent complexation constants K app and dissociation constants K d (=1/K app).
2.5. Cell Culture
All cell lines (Jurkat, Molt-4, and K562 cells) were cultured in RPMI 1640 medium supplemented with 10% heat-inactivated fetal calf serum (FCS), L-glutamine, HEPES (2-[4-(2-hydroxyethyl)-1-piperazinyl]ethanesulfonic acid, pK a = 7.5), 2-mercaptoethanol, and penicillin/streptomycin and monothioglycerol (MTG) in a humidified 5% CO2 incubator at 37°C.
2.6. MTT Assay
Jurkat cells (1.0 × 10⁵ cells/mL) were incubated in 1% DMSO, 10% FCS RPMI 1640 medium (MTG free) containing solution of Ir complexes 4–6 (0–75 µM) under 5% CO2 at 37°C for 1 to 24 h in 96-well plates (BD Falcon), then 0.5% MTT reagent in PBS buffer (10 µL) was added to the cells. After incubation under 5% CO2 at 37°C for 4 h, formazan lysis solution (10% SDS in 0.01 N HCl) (100 µL) was added and incubated overnight under same conditions, followed by measurement of absorbance at 570 nm by a microplate reader (Bio-Rad). MTT assay of Molt-4 cells and K562 cells with Ir complexes was also performed according to the same procedure described above.
2.7. MTT Assay in the Presence of Caspase Inhibitor (Z-VAD-FMK) and Necroptosis Inhibitor (Necrostatin-1) and Oxidative Stress Induce Necrosis Inhibitor (IM-54)
Jurkat cells (1.0 × 10⁵ cells/mL) were incubated in 10% FCS RPMI 1640 medium (MTG-free) containing a solution Z-VAD-fmk (15 µM)/necrostatin-1 (30 µM)/IM-54 (10 µM)/(under 5% CO2 at 37°C for 1 h in 96-well plates (BD Falcon). Then, Ir complexes (75 µM) were added and incubated under 5% CO2 at 37°C for 24 h, and then 0.5% MTT reagent in PBS buffer (10 µL) was added to the cells and incubated under 5% CO2 at 37°C for 4 h. A formazan lysis solution (10% SDS in 0.01 N HCl) (100 µL) was added, and the resulting solution incubated overnight under the same conditions, followed by measurement of absorbance at 570 nm with a microplate reader (Bio-Rad).
2.8. Fluorescent Microscopy Studies of Jurkat Cells, K562 Cells, and Molt-4 Cells with Ir Complexes
Jurkat cells, K562 cells, or Molt-4 cells (1.0 × 10⁶ cells/mL) were incubated in the absence or presence of Ir complexes in 10% FCS RPMI 1640 medium (MTG free) for specified time under 5% CO2 at 37°C. The cells were then washed twice with ice-cold PBS with 0.1% NaN3 and 0.5% FCS and taken on a Greiner CELLview™ petri dish (35 × 10 mm) and mounted on fluorescent microscope for observation (Biorevo, BZ-9000, Keyence) (excitation: 377 ± 25 nm; emission: 520 ± 35 nm; FF01 filter).
2.9. Fluorescent Microscopy Studies of Jurkat Cells with Ir Complexes in the Presence of Inhibitors
Jurkat cells (1.0 × 10⁶ cells/mL) were incubated with the given inhibitors in RPMI 1640 medium (MTG free) with 10% FCS under 5% CO2 at 37°C for 1 h, and then Ir complexes were added and then again incubated at 37°C for 24 h. The cells were then washed twice with ice-cold PBS containing 0.5% FCS and 0.1% NaN3 and incubated with PI in PBS at room temperature for 10–15 min. The cells were then again washed with PBS buffer and observed by fluorescent microscope (Biorevo, BZ-9000, Keyence) (excitation: 377 ± 25 nm; emission: 520 ± 35 nm; FF01 filter).
2.10. Propidium Iodide (PI) Staining
The cells were incubated with Ir complexes for specified time, washed with PBS buffer, and then incubated with PI in PBS buffer at room temperature for 10–15 minutes. The cells were then again washed with PBS buffer and observed by fluorescent microscope (Biorevo, BZ-9000, Keyence) (excitation: 540 ±25 nm; emission: 605 ± 55 nm; TRICT filter) or analyzed by flow cytometer (Beckman Coulter Gallios Flow Cytometer, detector: FL2, excitation: 488 nm, emission: 575 ± 20 nm).
2.11. Anti-DR5 Antibody Staining
Given cells were incubated with anti-DR5 antibody at 4°C for 15 min on ice. The cells were then washed twice with ice-cold PBS containing 0.5% FCS and 0.1 % NaN3 and were mounted on fluorescent microscope (Biorevo, BZ-9000, Keyence) (excitation: 540 ± 25 nm; emission: 605 ± 55 nm; TRICT filter) or analyzed by flow cytometer (Beckman Coulter Gallios Flow Cytometer, detector: FL2, excitation: 488 nm; emission: 575 ± 20 nm).
2.12. Annexin V-Cy3 Staining
Jurkat cells were incubated with Ir complexes for 2 h, washed with PBS buffer, and then suspended in 1X binding buffer. Annexin V-Cy3 was added to the cell suspension and then incubated at room temperature in the dark for 5–10 minutes. The cells were then washed with PBS buffer and observed by fluorescent microscope (Biorevo, BZ-9000, Keyence) (excitation 540 ± 25 nm, emission 605 ± 55 nm, TRICT filter).
2.13. Flow Cytometry Analysis of Staining and Cell Death Induction Assay
Jurkat cells, K562 cells, or Molt-4 cells (3.0 × 10⁵ cells) were incubated in the absence or the presence of Ir complexes in 10% FCS RPMI 1640 medium (MTG free) for the specified time under 5% CO2 at 37°C. After that, the cells were washed twice with ice-cold FACS buffer and then suspended in 450 µl FACS buffer. The cells were analyzed by flow cytometer (Beckman Coulter Gallios Flow Cytometer, detector: FL2, excitation: 488 nm, emission: 575 ± 20 nm) to detect PI staining or anti-DR5 antibody staining (detector: FL10, excitation: 405 nm, emission: 550 ± 40 nm) to detect Ir complexes staining).
3. Results and Discussion
3.1. Design and Synthesis of Ir Complex-Peptide Hybrids (IPHs)
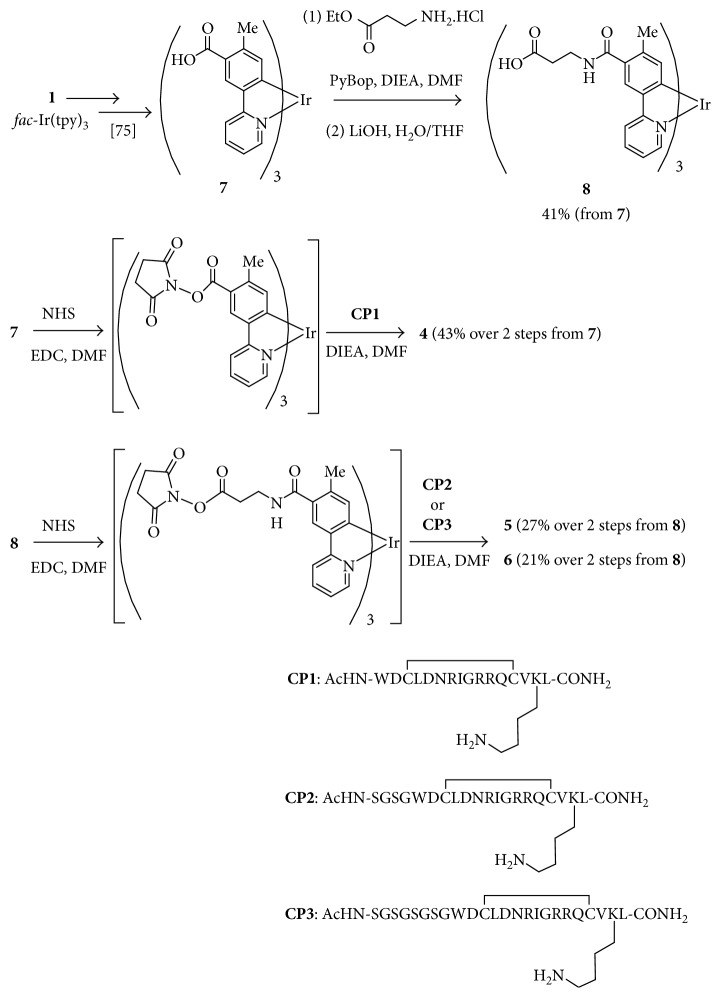
Synthesis of the Ir complex-peptide hybrids (IPHs) 4–6 is shown in Figure 3. The Vilsmeier reaction of 1 (fac-Ir(tpy)3) and the following Pinnick oxidation [72, 73, 75] gave 7. Condensation of 7 with β-alanine ethyl ester hydrochloride and the following ester hydrolysis yielded 8. Both 7 and 8 were converted to the corresponding N-hydroxy succinimide (NHS) esters and then reacted with the peptide units, CP1, CP2, and CP3 that had been prepared by Fmoc solid-phase peptide synthesis, to afford 4–6, respectively. Because 4 is poorly soluble in water, a hydrophilic Ser-Gly-Ser-Gly (H2N-SGSG-CO) sequence was incorporated to the N-terminus of cyclic peptide CP1 to afford CP2-3. All the Ir complexes 4–6 were purified by reversed-phase HPLC column with a continuous gradient of H2O (0.1%TFA)/CH3CN (0.1%TFA) and lyophilized to give yellow powders as the corresponding TFA salts. It should be mentioned that negligible conversion of the facial form of 4–6 to the corresponding meridional form was observed during their synthesis and the following biological assays.
Figure 3.
Synthesis of the Ir complex-peptide hybrids (IPHs).
3.2. UV/Vis and Luminescence Spectra of IPHs
UV/Vis and luminescence spectra of Ir complexes 2c, 4, 5, and 6 (10 µM) in DMSO at 25°C are shown in Figure 4, and their photophysical data are summarized in Table 1. The concentrations of the Ir complexes in stock solutions (DMSO) were determined by the molar extinction coefficient at 380 nm (ɛ 380nm = 1.43 ± 0.03 × 10⁴·M−1·cm−1) of 4, 5, and 6, which are almost identical to those of typical Ir(tpy)3 derivatives having peptides 2a–f and 3a–c (Figure 1), as we previously reported [72, 73]. The strong absorption bands at 270–300 nm were assigned to the 1 π-π ∗ transition of tpy ligands and weak shoulder bands at 320–450 nm were assigned as spin-allowed singlet-to-singlet metal-to-ligand charge transfer (1MLCT) transitions, spin-forbidden singlet-to-triplet (3MLCT) transitions, and 3 π-π ∗ transitions. Strong green emission of 4, 5, and 6 is observed with emission maxima at ca. 506 nm, which are almost same as that of 2c (Figure 4(b)). The luminescence quantum yields (Φ) of 4, 5, and 6 were determined to be 0.39, 0.33, and 0.36, respectively, and their luminescence lifetimes (τ) are 1.1–1.3 µs, which are almost same as those of 1–3.
Figure 4.
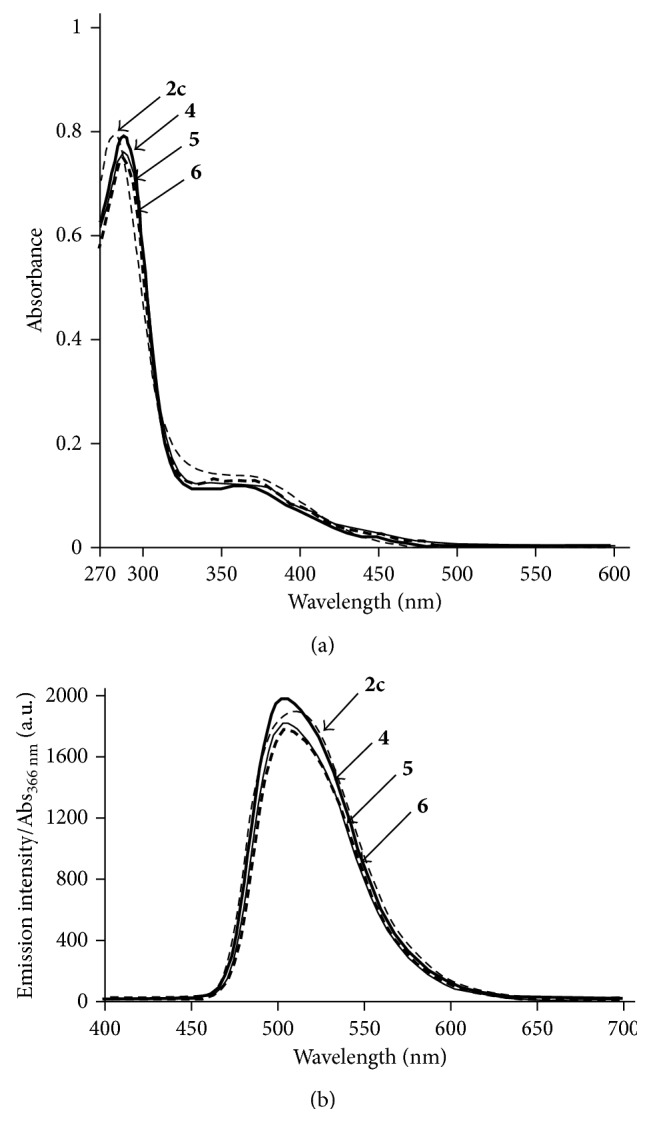
UV/Vis spectra of (a) 2c (dashed curve), 4 (bold curve), 5 (plain curve), and 6 (bold dashed curve). Emission spectra of (b) 2c (dashed curve), 4 (bold curve), 5 (plain curve), and 6 (bold dashed curve), in degassed DMSO at 25°C ([Ir complex] = 10 μM, excitation at 366 nm) (a.u. is the arbitrary unit).
Table 1.
Photophysical properties of Ir complexes 2c, 4, 5, and 6 in degassed DMSO at 25°C ([Ir complex] = 10 µM, excitation at 366 nm).
| Compound | λ max (absorption) (nm) | λ max (emission) (nm) | Φa | τ b (µs) |
|---|---|---|---|---|
| 2c | 280, 362 | 509 | 0.55 | 1.7 |
| 4 | 285, 363 | 505 | 0.39 | 1.1 |
| 5 | 285, 361 | 506 | 0.33 | 1.3 |
| 6 | 286, 360 | 506 | 0.36 | 1.2 |
aQuinine sulfate in 0.1 M H2SO4 (Φ = 0.55) was used as a reference. bLifetime of luminescence emission.
3.3. Determination of Complexation Properties of IPHs with DR5
First, complexation of IPHs with DR5 was checked by 27 MHz quartz-crystal microbalance (QCM). DR5 was immobilized on a sensor chip, to which IPHs were added on a certain time interval. Upon addition of IPHs, frequency change was observed (Figure 5) indicating the interaction of IPHs with DR5. The apparent complexation constants (K app) (and dissociation constant, K d) for TRAIL, 5, and 6 with DR5 were determined to be (2.3 ± 0.05) × 108 M−1 (K d = 4.3 ± 0.1 nM), (3.8 ± 0.1) × 105 M−1 (K d = 2.7 ± 0.1 µM), and (4.0 ± 0.2) × 105 M−1 (K d = 2.5 ± 0.1 µM), respectively, assuming 1 : 1 complexation (Table 2). Negligible interaction was observed for 9, which lacks the receptor-binding peptide (Figure 6) and 2c that contains a KKGG peptide (Figure 1) [72, 73].
Figure 5.
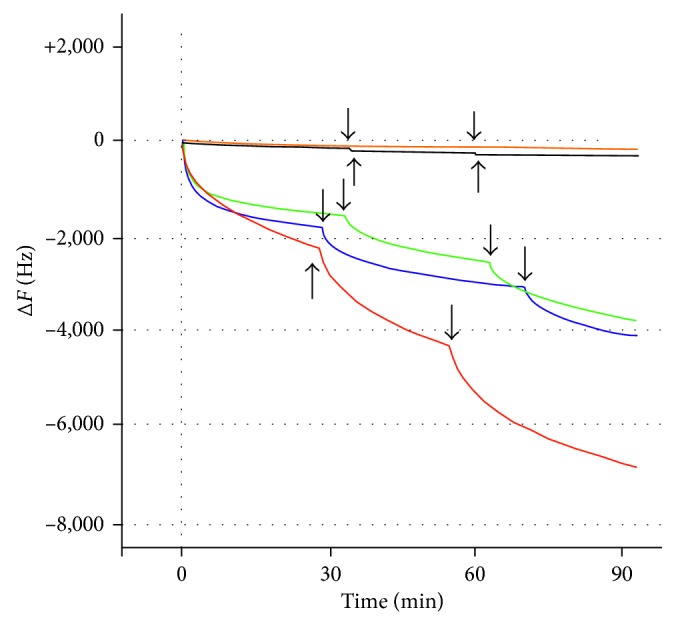
Time course of frequency change (ΔF (Hz)) of IPHs-DR5 complexation. Conditions: temperature, 25°C; solvent, phosphate-buffered saline (PBS). An aliquot of solutions of TRAIL (red curve) (200 µg/mL), 5 (green curve), 6 (blue curve), 9 (orange curve), and 2c (black curve) ([Ir complex] = 10 mM solution in DMSO) was added to DR5 fixed on the sensor chip. Plain arrows indicate the time when solutions of these analytes were added to DR5.
Table 2.
Complexation constants of IPHs (assuming 1 : 1 complexation).
| Analyte | K app (M−1) | K d |
|---|---|---|
| TRAIL | (2.3 ± 0.05) × 108 | 4.3 ± 0.1 nm |
| 5 | (3.8 ± 0.1) × 105 | 2.7 ± 0.1 μM |
| 6 | (4.0 ± 0.2)105 | 2.5 ± 0.1 μM |
| 9 | <104 | >100 μM |
| 2c | <104 | >100 μM |
Figure 6.
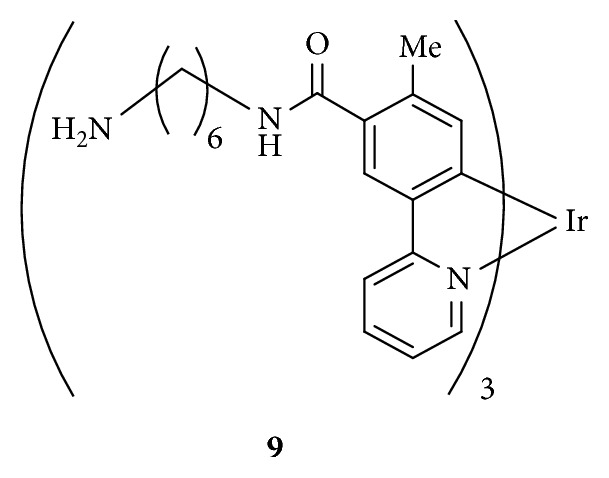
Ir complex having no peptide.
3.4. Cancer Cell Death Induced by IPHs, as Evaluated by MTT Assay and Fluorescence Microscopy
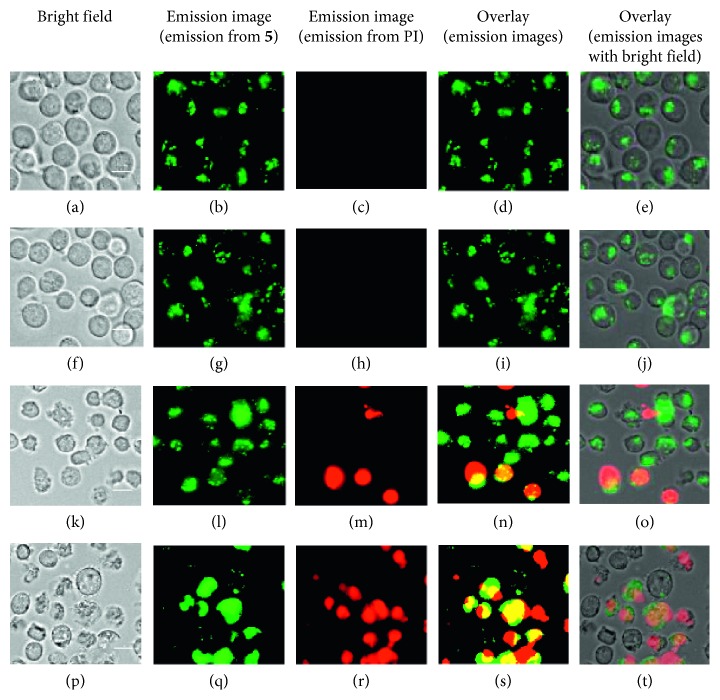
Next, cell death inducing activity of Ir complexes 4–6 against Jurkat cells was evaluated by MTT assay (MTT = 3-(4,5-dimethyl-2-thiazolyl)-2,5-diphenyl-2H-tetrazolium bromide). Jurkat cells were incubated with the given concentrations of 5 or 6 in 10% FCS (fetal calf serum) RPMI 1640 (MTG free) medium at 37°C and treated with MTT reagent. It was observed that the induction of cell death of Jurkat cells by 5 and 6 is much slower than that by our previous Ir complexes 2c, 2d, and 3c, which induce cell death of Jurkat cells in 1 h. Because both 5 and 6 interact with DR5 to the same extent, as described in Figure 5 and Table 2, the following assays were carried out with 5. Jurkat cells were observed by luminescence microscopy after incubation with 5 for 1 h, 6 h, 12 h, and 24 h and stained with propidium iodide (PI) to check their cell death. As summarized in Figures 7 and 8, 5 requires ca. 24 h to induce considerable cell death (ca. 50% cell death at [5] = 72 µM). For comparison, negligible 4-induced cell death, even after incubation for 16 h, was possibly due to its low solubility in water (Figure S1 in Supplementary Materials).
Figure 7.
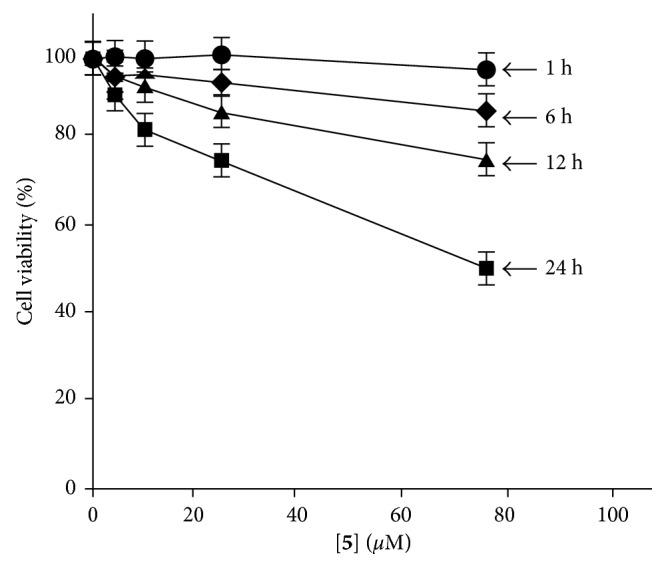
The results of MTT assay: cell viability of Jurkat cells after incubation in the presence of 5 (5–75 µM) for 1 h (filled circles), 6 h (filled diamonds), 12 h (filled triangles), and 24 h (filled squares) at 37°C.
Figure 8.
Time lapse luminescence microscopy images (Biorevo, BZ-9000, Keyence) of Jurkat cells (×40) treated with 5 (75 µM) at 37°C. Cell deaths were confirmed by staining with propidium iodide (PI), (a–e) after incubation for 1 h, (f–j) after incubation for 6 h, (k–o) after incubation for 12 h, and (p–t) after incubation for 24 h. Scale bar (white) = 10 µm.
3.5. Luminescence Staining of Jurkat Cells with IPHs
Slow induction of cell death by IPHs allowed us to conduct luminescence staining experiments of Jurkat cells. Figures 9–9 and 9–9 indicate that 5 (5 and 10 µM) binds to Jurkat cells after incubation at 37°C for 1 h. Passive uptake of 5 through the cell membrane is unlikely, due to the facts that negligible emission was observed after incubation at 4°C for 1 h ([5] = 20 µM) (Figures 9–9) and that the pretreatment with NaN3 (a metabolic inhibitor) at 4°C for 15 min ([NaN3] = 5 mM, a concentration required to inhibit metabolic activity) exhibits the localization of 5 on the cell membrane (Figures 9–9).
Figure 9.
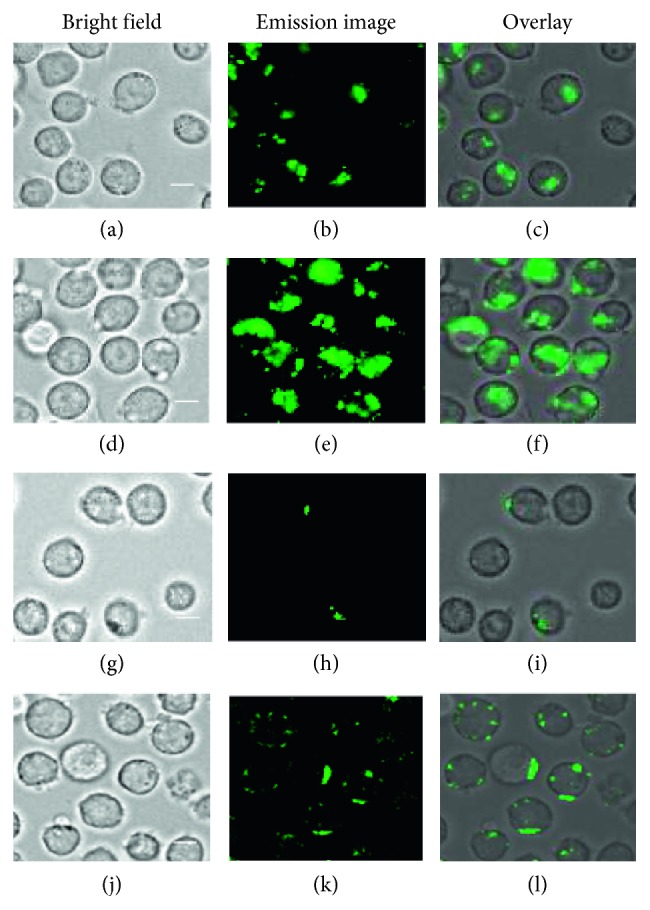
Luminescence microscopy images (Biorevo, BZ-9000, Keyence) of Jurkat cells (×40) stained with 5. (a–c) Jurkat cells after incubation with 5 (5 µM) at 37°C for 1 h; (d–f) Jurkat cells after incubation with 5 (10 µM) at 37°C for 1 h; (g–i) Jurkat cells after incubation with 5 (20 µM) at 4°C for 1 h; (j–l) Jurkat cells after incubation with NaN3 (5 mM) at 4°C for 15 min and then with 5 (5 µM) at 37°C for 1 h. Scale bar (white) = 10 µm.
Competitive staining of Jurkat cells with 5 and DR5 binding peptide [20–22] (CP1, Figure 3) was conducted. Jurkat cells were incubated with CP1 for 1 h at 37°C to which 5 was added and incubated again for 1 h at 37°C. Green emission from the cells was considerably reduced by the pretreatment with CP1 (100 µM) than those treated with only 5 (Figure S2 in Supplementary Materials). Similar results were obtained by flow cytometry (Figure S3 in Supplementary Materials), implying that 5 competes with CP1 for DR5.
3.6. Costaining of Jurkat Cells by IPHs and Anti-DR5 Antibody and Observation of the Movement of DR5 between Cell Surface and Cytoplasm
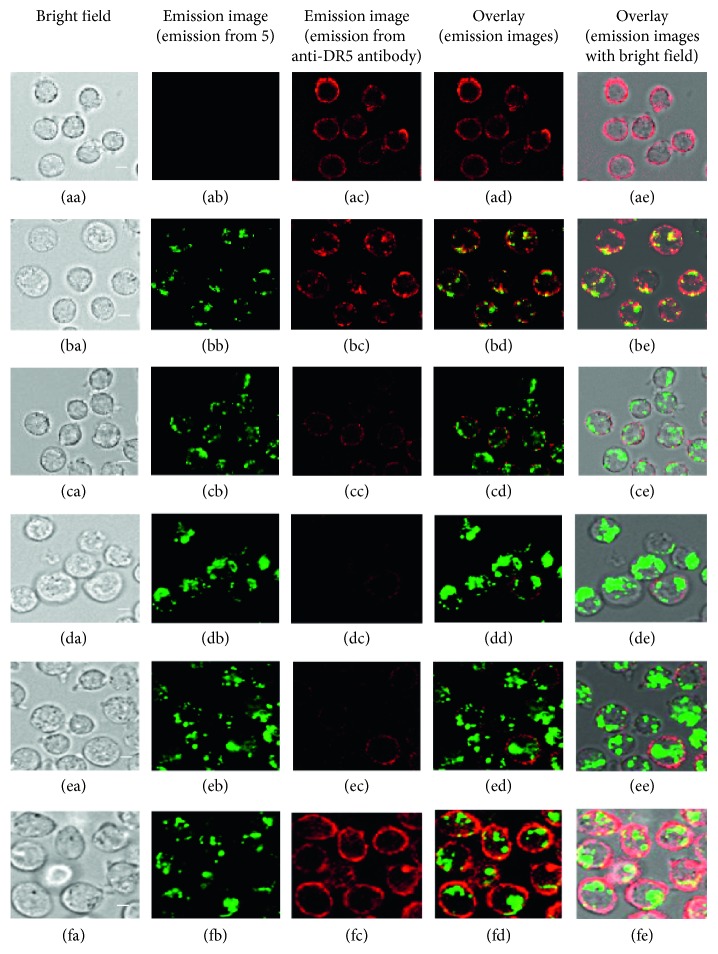
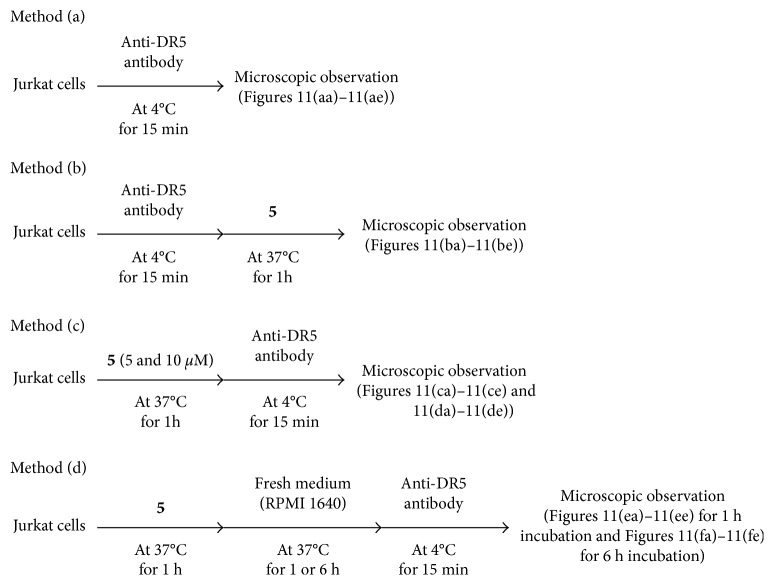
In Figures 11–11, red emission was observed on the cell membrane of Jurkat cells that were treated with anti-DR5 antibody (conjugated with a red color fluorochrome) at 4°C for 15 min (Method a in Figure 10). Next, we observed luminescence images of Jurkat cells that were treated with anti-DR5 antibody at 4°C for 15 min and then incubated with 5 at 37°C for 1 h (Method b in Figure 10). In Figures 11 and 11, green emission from 5 and red emission from anti-DR5 antibody were observed, respectively. The overlays of Figures 11 and 11 show yellow spots (Figures 11 and 11), suggesting that anti-DR5 antibody and 5 stain the same or similar area on the cells. Besides, it was found that there is negligible difference between emission intensity (from anti-DR5 antibody) of Jurkat cells treated with only anti-DR5 antibody and then 5 (Figure S4 in Supplementary Materials), suggesting that both of 5 and anti-DR5 antibody bind with DR5, possibly at the different sites.
Figure 11.
Luminescence microscopic images of (Biorevo, BZ-9000, Keyence) of Jurkat cells stained with 5 and anti-DR5 antibody obtained by protocol presented in Figure 10. (aa–ae) Jurkat cells incubated with anti-DR5 antibody (15 µg/mL) at 4°C for 15 min. (ba–be) Jurkat cells incubated with anti-DR5 antibody (15 µg/mL) at 4°C for 15 min and then with 5 (5 µM) at 37°C for 1 h. (ca–ce) Jurkat cells incubated with 5 (5 µM) at 37°C for 1 h and then with anti-DR5 antibody (15 µg/mL) at 4°C for 15 min. (da–de) Jurkat cells incubated with 5 (10 µM) at 37°C for 1 h and then with anti-DR5 antibody (15 µg/mL) at 4°C for 15 min. (ea–ee) Jurkat cells incubated with 5 (10 µM) at 37°C for 1 h and then in fresh medium for 1 h (2 h in total) and then with anti-DR5 antibody (15 µg/mL) at 4°C for 15 min. (fa–fe) Jurkat cells incubated with 5 (10 µM) at 37°C for 1 h and then in fresh medium for 6 h (7 h in total) and then with anti-DR5 antibody (15 µg/mL) at 4°C for 15 min. Scale bar (white) = 10 µm.
Figure 10.
Costaining assay protocol.
Next, the order of the treatment of Jurkat cells with anti-DR5 antibody and 5 was reversed. In this experiment, Jurkat cells were treated with 5 (5 µM) and then with anti-DR5 antibody (Method c in Figure 10). In this case, very weak red emission was observed from Jurkat cells (Figures 11–11), suggesting that the expression level of DR5 on cell membrane was decreased by the treatment with 5. The increase in the concentration of 5 to 10 µM resulted in the considerable decrease in the red emission from anti-DR5 antibody (Figures 11–11). Similar results were observed in flow cytometry assay, in which Jurkat cells treated with only anti-DR5 antibody exhibit high emission intensity (red curve in Figure S5 in Supplementary Materials).
In the previous experiments, it was hypothesized that DR5 is internalized from the cell membrane to the cell cytoplasm after binding with IPH. To check this hypothesis, Jurkat cells were incubated with 5 at 37°C for 1 h, washed with fresh medium, and incubated again in fresh medium at 37°C for 1 or 6 h (Method d in Figure 10) (Figures 11–11 for 1 h incubation and Figures 11–11 for 6 h incubation). Interestingly, the red emission from anti-DR5 antibody was restored after an additional incubation for 6 h, as displayed in Figures 11–11, showing a good contrast to Figures 11–11 obtained without incubation in fresh medium for 6 h. In flow cytometry assay, red emission intensity from anti-DR5 antibody in cells was reduced after 1 h incubation with 5 and then anti-DR5 antibody in comparison to Jurkat cells treated with only anti-DR5 antibody. After incubation of Jurkat cells with 5 and then again in fresh medium for 6 h, emission from anti-DR5 antibody was restored (Figure S6 in Supplementary Materials).
Our assumption based on the results of these experiments is summarized in Figure 12. (i) Upon incubation of Jurkat cells with IPH at 37°C for 1 h, IPH-DR5 complex undergoes internalization into the cytoplasm from the cell surface (Figure 12). (ii) As a result, the binding of anti-DR5 antibody to the cell membrane becomes weak (Figure 12). (iii) After incubation of Jurkat cells (in which IPH-DR5 complexes is internalized in the cytoplasm) in fresh medium at 37°C for 1 or 6 h, a considerable amount of DR5 is restored on the cell membrane (Figure 12), and then (iv) anti-DR5 antibody is able to bind DR5 (Figure 12).
Figure 12.
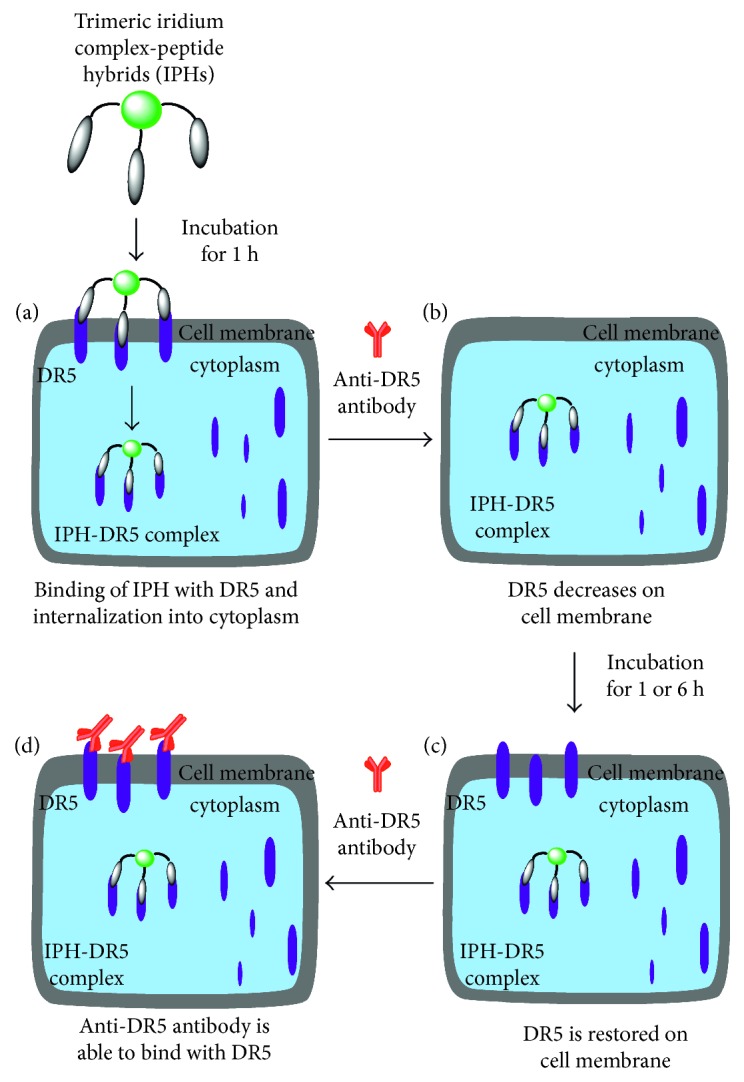
Schematic presentation of the behavior of DR5 after complexation with IPH.
To assess the affinity of IPH to DR5 expressed on cancer cell membrane, we carried out cell staining of different types of cancer cell lines that express different levels of DR5. DR5 expression of Jurkat cells, K562 cells, and Molt-4 cells was evaluated by staining with anti-DR5 antibody and flow cytometer analysis. It was found that Jurkat cells express comparatively high level of DR5 than K562 cells and Molt-4 cells, as confirmed by staining with anti-DR5 antibody (the second left in Figure 13). These three cell lines were incubated with 5 (5 µM and 10 µM) at 37°C for 1 h and then analyzed by flow cytometer. Figure 13 shows that, Jurkat cells are highly stained by 5, while K562 cells and Molt-4 cells are weakly stained. Luminescence microscopic observation of different types of cancer cell lines also show similar results (Figures S7(a)–S7(i) in Supplementary Materials) and Ir complex 9 having no peptide [72] (Figure 6) negligibly stains Jurkat cells (Figures S7(j)–S7(l) in Supplementary Materials). Together with the results of the aforementioned QCM experiments (Figure 2), these facts strongly suggest that the binding of 5 is dependent on the DR5 expression level of cancer cells.
Figure 13.
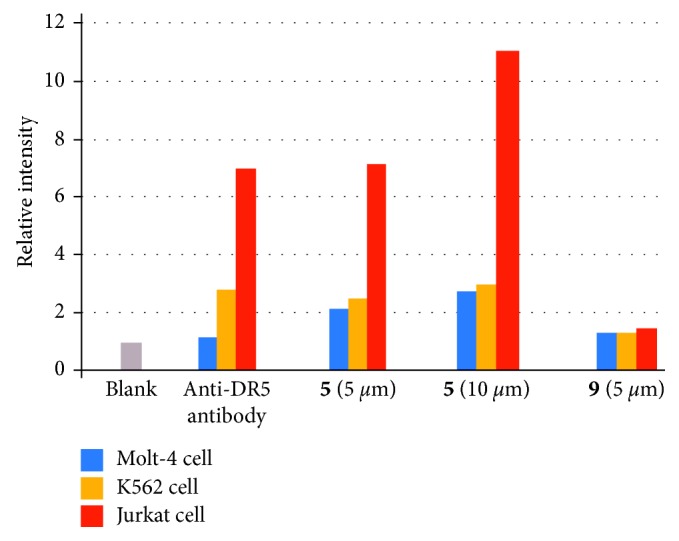
Summary of flow cytometry assay of DR5 expression of Molt-4 cells (blue bar), K562 cells (orange bar), and Jurkat cells (red bar). The cells were stained with anti-DR5 antibody (15 µg/mL) at 4°C for 15 min. 5 (5/10 µM) and 9 (5 µM) at 37°C for 1 h. The relative intensity is the ratio of the geometric mean values of luminescence intensity to the blank.
Relationship between cell death inducing activity of IPH and DR5 expression of cancer cells was studied. Flow cytometry assay was conducted with Jurkat cells, K562 cells, and Molt-4 cells that express different level of DR5, as mentioned above. These three cell lines were incubated with 5 (25/75 µM) at 37°C for 24 h, to which PI (30 µM) was added to stain the dead cells for analysis by flow cytometer. As summarized in Figure 14, cell death induction of these three cell lines is parallel to expression level of DR5.
Figure 14.
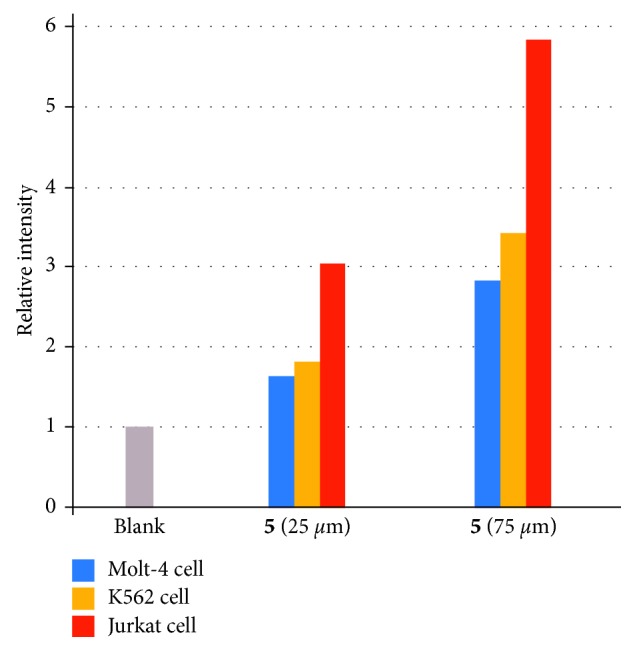
Summary of cell death assay (PI staining of dead cells) of Molt-4 cells (blue bar), K562 cells (orange bar), and Jurkat cells (red bar). The relative intensity is the ratio of the geometric mean values of the luminescence intensity to the blank.
3.7. Mechanistic Studies of Cell Death Induced by IPH
The aforementioned results strongly suggest that 5 is able to detect Jurkat cells and induce their cell death via complexation with DR5. The stability of 5 in RPMI 1640 (MTG Free) medium (Incubation at 37°C for 24 h) was checked, as shown in Figure S8 in the Supplementary Materials. Since it is well established that DR5 initiates apoptosis signal after binding with TRAIL or other reported artificial TRAIL mimics, it was initially presumed that the cell death induced by 5 would be apoptosis. MTT assay of Jurkat cells with 5 was carried out in the presence of Z-VAD-FMK (15 µM), which is a broad caspase inhibitor [76], necrostation-1 (30 µM), which is a necroptosis inhibitor [77], and IM-54 (10 µM), which is an inhibitor of oxidative stress induced necrosis [78]. However, these three drugs negligibly inhibited the cell death induced by 5 (Figures S9 and S10 in Supplementary Materials). On the other hand, TRAIL-induced cell death was inhibited by Z-VAD-FMK almost completely (Figures S9 and S10 in Supplementary Materials). In addition, the staining experiments of the dead Jurkat cells with annexin V-Cy3 [79, 80], which is a well-known reagent to detect apoptosis, disclosed that only few cells were stained by annexin V-Cy3. These facts have allowed us to conclude that it is unlikely that 5 induces apoptosis of Jurkat cells.
Aforementioned studies suggest that 5 internalizes into cells by DR5-mediated endocytosis. Therefore, 5 may interact with cytoplasmic organelles or interfere and/or activate any cellular events to induce cell death. In order to examine this mechanism, we evaluated the cell death in the presence of the inhibitors of several cellular events or metabolisms, channel blockers, or receptor antagonist, namely, carbonyl cyanide 3-chlorophenylhydrazone (CCCP) (a mitochondrial uncoupling reagent) [81, 82], amiloride (Na+ channel blocker, inhibitors of macropinocytosis) [83], chloroquine (inhibitors of autophagy) [84], bafilomycin A1 (an inhibitor of vacular ATPase (V-ATPase) [85], oligomycin (an inhibitor of the mitochondrial F1/F0-ATP synthase to cause ATP depletion) [86], 4-aminopyridine (K+ channel blocker), verapamil (L-type voltage-operated Ca2+ channel blocker) [87–89], nicardipine, (L-type voltage-operated Ca2+ channel blocker) [87–89], and quinidine, (Na+ and K+ channel blocker, antagonist of α-adrenergic receptors, and an inhibitor of the mitochondrial uptake of Ca2+) [90–94], according to our previous studies [72, 73]. Jurkat cells were incubated with these inhibitors at their recommended concentrations (Figure S11 in Supplementary Materials) at 37°C for 1 h, to which 5 was added and incubated again at the same temperature for 24 h. The cells were then washed with PBS buffer and stained with propidium iodide (PI) for microscopic observation. Interestingly, it was found that only voltage-operated Ca2+ channel blocker (nicardipine and verapamil) considerably inhibited cell death induced by 5. Therefore, we conclude that the cell death induced by 5 can be considered as necrosis-type cell death via Ca2+-mediated intracellular signaling pathway.
3.8. Detection of Jurkat Cells in Bovine Blood
The detection of cancer cells by use of IPHs was carried out. Jurkat cells (10 × 105 cells) were suspended in bovine blood (100 µL) and then incubated with 5 (10 µM) in medium (RPMI 1640) at 37°C for 6 h, resulting in the successful detection of Jurkat cells in bovine blood, as shown in Figure 15.
Figure 15.

Luminescence microscopy images (×40) (Biorevo, BZ-9000, Keyence) of Jurkat cells spiked in bovine blood in presence of 5. (a–c) Jurkat cells spiked in bovine blood after incubation with 5 (10 µM) at 37°C for 6 h: (a) bright field image, (b) emission image, and (c) overlay image of (a) and (b). Scale bar (white) = 10 µm.
4. Conclusions
In this study, we report on the design and synthesis of Ir complex-peptide hybrids (4–6) consisted of C 3-symmetric tris-cyclometalated Ir complexes equipped with DR5 binding cyclic peptides. Among these complexes, 5 and 6 were found to be cytotoxic against Jurkat cells. Studies demonstrate that 5 binds with DR5 on the cell membrane (by 27 MHz QCM and costaining experiments with anti-DR5 antibody), and their complex is internalized into the cytoplasm by DR5-mediated endocytosis. Our previous Ir complexes 2–3 having basic peptides such as KKGG sequence induce Jurkat cell death in a few hours and exhibit strong emission from dead cells. In contrast, the IPHs reported in this study (5 and 6) detect Jurkat cells first and then induce their death very slowly (after 16 to 24 h). Moreover, DR5 is transferred and/or reproduced on the cell surface after additional incubation. Jurkat cells can be detected even in bovine blood which may offer an easy and convenient method for cancer diagnosis. To the best of our knowledge, 5 is the first example of the artificial compound that achieve imaging and cell death induction of cancer cells associated with DR5, due to its moderate cytoxicity and slow cell death induction property.
The aforementioned results postulate that IPHs can be good candidates to study death receptor biology, cancer cell imaging, induction of cancer cell death, and understanding of the mechanism of cell death mediated by death receptor. Additionally, IPHs induce slow cell death, which may provide new approaches in the treatment of cancer and related diseases. Improvement of the anticancer activity of IPHs and attempts at controlling cell death types are now in progress.
Acknowledgments
This work was supported by grants-in-aid from the Ministry of Education, Culture, Sports, Science and Technology (MEXT) of Japan (nos. 22890200, 24890256, 26860016, and 16K18851 to Yosuke Hisamatsu and nos. 19659026, 22390005, 24590025, 24650011, 24640156, and 15K00408 to Shin Aoki), the Uehara Memorial Foundation (Tokyo, Japan) to Yosuke Hisamatsu, the Tokyo Biochemical Research Foundation (Tokyo, Japan) to Shin Aoki, “Academic Frontiers” Project for Private Universities (matching fund subsidy from MEXT), and TUS (Tokyo University of Science) fund for strategic research areas. The authors thank Prof. Dr. Takeshi Inukai (Department of Pediatrics, School of Medicine, University of Yamanashi) for the valuable suggestion. The authors sincerely acknowledge Ms. Fukiko Hasegawa and Ms. Noriko Sawabe (Faculty of Pharmaceutical Sciences, Tokyo University of Science) for measurement of mass spectra and NMR.
Abbreviations
- DIC:
N,N′-diisopropylcarbodiimide
- DIEA:
N,N-diisopropylethylamine
- DMF:
N,N-dimethylformamide
- EDC:
1-Ethyl-3-(3-dimethylaminopropyl)carbodiimide
- HOBt:
1-Hydroxybenzotriazole
- NHS:
N-hydroxy succinimide
- PyBOP:
Benzotriazol-1-yl-oxytripyrrolidinophosphonium hexafluorophosphate
- TFA:
Trifluoroacetic acid
- THF:
Tetrahydrofuran
- TIPS:
Triisopropylsilane
- TMSCl:
Trimethylsilyl chloride.
Conflicts of Interest
The authors declare that there are no conflicts of interest regarding the publication of this paper.
Supplementary Materials
Figure S1: the results of MTT assay. Figure S2: microscopic images of competitive staining. Figure S3: flow cytometry assay results of competitive staining. Figures S4–S6: flow cytometry assay results of costaining Figure S7: microscopic images of Jurkat, K562, and Molt-4 cells staining. Figure S8: HPLC charts of 5 after incubation in RPMI 1640 medium. Figures S9 and S10: the results of MTT assay in presence of inhibitors. Figure S11: microscopic images of staining in presence of inhibitors. Figure S12–13: 1H NMR and ESI mass charts of NHS ester of Ir complex 7. Figures S14–S15: 1H NMR and ESI mass charts of Ir complex 8. Figures S16 and S17: 1H NMR and ESI mass charts of NHS ester of Ir complex 8. Figures S18 and S19: 1H NMR and ESI mass charts of Ir complex 9. Figures S20–S22: HPLC, 1H NMR, and ESI mass charts of CP1. Figures S23–S25: HPLC, 1H NMR, and ESI mass charts of CP2. Figures S26–S28: HPLC, 1H NMR, and ESI mass charts of CP3. Figure S29–S31: HPLC, 1H NMR, and ESI mass charts of Ir complex 4. Figures S32–S34: HPLC, 1H NMR, and ESI mass charts of Ir complex 5. Figures S35–S37: HPLC, 1H NMR, and ESI mass charts of Ir complex 6.
References
- 1.Ashkenazi A., Dixit V. M. Death receptors: signaling and modulation. Science. 1998;281(5381):1305–1308. doi: 10.1126/science.281.5381.1305. [DOI] [PubMed] [Google Scholar]
- 2.Pan G., O’Rourke K., Chinnaiyan A. M., et al. The receptor for the cytotoxic ligand TRAIL. Science. 1997;276(5309):111–113. doi: 10.1126/science.276.5309.111. [DOI] [PubMed] [Google Scholar]
- 3.Walczak H., Delgi-Esposti M. A., Johnson R. S., et al. TRAIL-R2: a novel apoptosis-mediating receptor for TRAIL. EMBO Journal. 1997;16(17):5386–5397. doi: 10.1093/emboj/16.17.5386. [DOI] [PMC free article] [PubMed] [Google Scholar]
- 4.Pan G., Ni J., Wei Y. F., Yu G., Gentz R., Dixit V. M. An antagonist decoy receptor and a death domain-containing receptor for TRAIL. Science. 1997;277(5327):815–818. doi: 10.1126/science.277.5327.815. [DOI] [PubMed] [Google Scholar]
- 5.Delgi-Esposti M. A., Smolak P. J., Walczak H., et al. Cloning and characterization of TRAIL-R3, a novel member of the emerging TRAIL receptor family. Journal of Experimental Medicine. 1997;186(7):1165–1170. doi: 10.1084/jem.186.7.1165. [DOI] [PMC free article] [PubMed] [Google Scholar]
- 6.Delgi-Esposti M. A., Dougall W. C., Smolak P. J., Waugh J. Y., Smith C. A., Goodwin R. G. The novel receptor TRAIL-R4 induces NF-kB and protects against TRAIL-mediated apoptosis, yet retains an incomplete death domain. Immunity. 1997;7(6):813–820. doi: 10.1016/s1074-7613(00)80399-4. [DOI] [PubMed] [Google Scholar]
- 7.Simonet W. S., Lacey D. L., Dunstan C. R., et al. Osteoprotegerin: a novel secreted protein involved in the regulation of bone density. Cell. 1997;89(2):309–319. doi: 10.1016/s0092-8674(00)80209-3. [DOI] [PubMed] [Google Scholar]
- 8.Hymowitz S. G., Christinger H. W., Fuh G., et al. Triggering cell death: the crystal structure of Apo2L/TRAIL in a complex with death receptor 5. Molecular Cell. 1999;4(4):563–571. doi: 10.1016/s1097-2765(00)80207-5. [DOI] [PubMed] [Google Scholar]
- 9.Hymowitz S. G., O’Connell M., Ultsch M. H., et al. A unique zinc-binding site revealed by a high-resolution X-ray structure of homotrimeric Apo2L/TRAIL. Biochemistry. 2000;39(4):633–640. doi: 10.1021/bi992242l. [DOI] [PubMed] [Google Scholar]
- 10.Fesik S. W. Insight into programmed cell death through structural biology. Cell. 2000;103(2):273–282. doi: 10.1016/s0092-8674(00)00119-7. [DOI] [PubMed] [Google Scholar]
- 11.Ashkenazi A., Pai R. C., Fong S., et al. Safety and anti-tumor activity of recombinant soluble Apo2 ligand. Journal of Clinical Investigation. 1999;104(2):155–162. doi: 10.1172/jci6926. [DOI] [PMC free article] [PubMed] [Google Scholar]
- 12.Walczak H., Miller R. E., Ariall K., et al. Tumoricidal activity of tumor necrosis factor-related apoptosis-inducing ligand in vivo. Nature Medicine. 1999;5(2):157–163. doi: 10.1038/5517. [DOI] [PubMed] [Google Scholar]
- 13.Kelly S. K., Ashkenazi A. Targeting death receptors in cancer with Apo2L/TRAIL. Current Opinion in Pharmacology. 2004;4(4):333–339. doi: 10.1016/j.coph.2004.02.006. [DOI] [PubMed] [Google Scholar]
- 14.Ashkenazi A., Holland P., Eckhardt S. G. Ligand-based targeting of apoptosis in cancer: the potential of recombinant human apoptosis ligand 2/tumor necrosis factor-related apoptosis-inducing ligand (rhApo2L/TRAIL) Journal of Clinical Oncology. 2008;26(21):3621–3630. doi: 10.1200/jco.2007.15.7198. [DOI] [PubMed] [Google Scholar]
- 15.Ichikawa K., Liu W., Zhao L., et al. Tumoricidal activity of a novel anti-human DR5 monoclonal antibody without hepatocyte cytotoxicity. Nature Medicine. 2001;7(8):954–960. doi: 10.1038/91000. [DOI] [PubMed] [Google Scholar]
- 16.Jin H., Yang R., Fong S., et al. Apo2 ligand/tumor necrosis factor-related apoptosis-inducing ligand cooperates with chemotherapy to inhibit orthotopic lung tumor growth and improve survival. Cancer Research. 2004;64(14):4900–4905. doi: 10.1158/0008-5472.can-04-0408. [DOI] [PubMed] [Google Scholar]
- 17.Camidge D. R. Apomab: an agonist monoclonal antibody directed against death receptor 5/TRAIL-receptor 2 for use in the treatment of solid tumors. Expert Opinion on Biological Therapy. 2008;8(8):1167–1176. doi: 10.1517/14712598.8.8.1167. [DOI] [PubMed] [Google Scholar]
- 18.Li J., Knee D. A., Wang Y., et al. LBY135, a novel anti-DR5 agonistic antibody induces tumor cell–specific cytotoxic activity in human colon tumor cell lines and xenografts. Drug Development Research. 2008;69(2):69–82. doi: 10.1002/ddr.20229. [DOI] [Google Scholar]
- 19.Wiezorek J., Holland P., Graves J. Death receptor agonists as a targeted therapy for cancer. Clinical Cancer Research. 2011;16(6):1701–1708. doi: 10.1158/1078-0432.ccr-09-1692. [DOI] [PubMed] [Google Scholar]
- 20.Angell Y. M., Bhandari A., Chakrabarti A., et al. Discovery and optimization of a TRAIL R2 agonist for cancer therapy. In: Blondelle S. E., editor. Understanding Biology Using Peptides. New York, NY, USA: Springer; 2006. pp. 405–406. [Google Scholar]
- 21.Angell Y. M., Bhandari A., De Francisco M. N., et al. Peptides for youth. In: Del Valle S., Escher E., Lubell W. D., editors. Advances in Experimental Medicine and Biology. New York, NY, USA: Springer; 2009. pp. 101–103. [Google Scholar]
- 22.Angell Y. M., Bhandari M., De Francisco M. N., et al. Discovery and optimization of a TRAIL R2 agonist for cancer therapy. Advances in Experimental Medicine and Biology. 2009;611:101–103. doi: 10.1007/978-0-387-73657-0_45. [DOI] [PubMed] [Google Scholar]
- 23.Pavet V., Beyrath J., Pardin C., et al. Multivalent DR5 peptides activate the TRAIL death pathway and exert tumoricidal activity. Cancer Research. 2010;70(3):1101–1110. doi: 10.1158/0008-5472.can-09-2889. [DOI] [PubMed] [Google Scholar]
- 24.Lamanna G., Smulski C. R., Chekkat N., et al. Multimerization of an apoptogenic TRAIL-mimicking peptide by using adamantane-based dendrons. Chemistry-A European Journal. 2013;19(5):1762–1768. doi: 10.1002/chem.201202415. [DOI] [PubMed] [Google Scholar]
- 25.Pulka-Ziach K., Pavet V., Chekkat N., et al. Thioether analogues of disulfide-bridged cyclic peptides targeting death receptor 5: conformational analysis, dimerisation and consequences for receptor activation. ChemBioChem. 2015;16(2):293–301. doi: 10.1002/cbic.201402485. [DOI] [PubMed] [Google Scholar]
- 26.Valldorf B., Fittler H., Deweid L., et al. An apoptosis-inducing peptidic heptad that efficiently clusters death receptor 5. Angewandte Chemie International Edition. 2016;55(16):1–6. doi: 10.1002/anie.201511894. [DOI] [PubMed] [Google Scholar]
- 27.Kaga C., Okochi M., Nakanishi M., Hayashi H., Kato R., Honda H. Screening of a novel octamer peptide, CNSCWSKD, that induces caspase-dependent cell death. Biochemical and Biophysical Research Communications. 2007;362(4):1063–1068. doi: 10.1016/j.bbrc.2007.08.110. [DOI] [PubMed] [Google Scholar]
- 28.Wang G., Wang X., Yu H., et al. Small-molecule activation of the TRAIL receptor DR5 in human cancer cells. Nature Chemical Biology. 2013;9(2):84–89. doi: 10.1038/nchembio.1153. [DOI] [PubMed] [Google Scholar]
- 29.Lamansky S., Djurovich P., Murphy D., et al. Highly phosphorescent bis-cyclometalated iridium complexes: synthesis, photophysical characterization, and use in organic light emitting diodes. Journal of the American Chemical Society. 2001;123(18):4304–4312. doi: 10.1021/ja003693s. [DOI] [PubMed] [Google Scholar]
- 30.Baldo M. A., O’Brien D. F., You Y., et al. Highly efficient phosphorescent emission from organic electroluminescent devices. Nature. 1998;395(6698):151–154. doi: 10.1038/25954. [DOI] [Google Scholar]
- 31.Farinola G. M., Ragni R. Electroluminescent materials for white organic light emitting diodes. Chemical Society Reviews. 2011;40(7):3467–3482. doi: 10.1039/c0cs00204f. [DOI] [PubMed] [Google Scholar]
- 32.Yersin H. Highly Efficient OLEDs with Phosphorescent Materials. Weinheim, Germany: Wiley-VCH; 2008. [Google Scholar]
- 33.Ulbricht C., Beyer B., Friebe C., Winter A., Schubert U. S. Recent developments in the application of phosphorescent iridium(iii) complex systems. Advanced Materials. 2009;21(44):4418–4441. doi: 10.1002/adma.200803537. [DOI] [Google Scholar]
- 34.Tamayo A. B., Alleyne B. D., Djurovich P. I., et al. Synthesis and characterization of facial and meridional triscyclometalated iridium(III) complexes. Journal of the American Chemical Society. 2003;125(24):7377–7387. doi: 10.1021/ja034537z. [DOI] [PubMed] [Google Scholar]
- 35.Dedeian K., Djurovich P. I., Garces F. O., Carlson G., Watts R. J. A new synthetic route to the preparation of a series of strong photoreducing agents: fac-tris-ortho-metalated complexes of iridium(III) with substituted 2-phenylpyridines. Inorganic Chemistry. 1991;30(8):1685–1687. doi: 10.1021/ic00008a003. [DOI] [Google Scholar]
- 36.Lowry M. S., Bernhard S. Synthetically tailored excited states: phosphorescent, cyclometalated iridium(III) complexes and their applications. Chemistry-A European Journal. 2006;12(31):7970–7977. doi: 10.1002/chem.200600618. [DOI] [PubMed] [Google Scholar]
- 37.Flamigni L., Barbieri A., Sabatini C., Ventura B., Barigelletti F. Photochemistry and photophysics of coordination compounds: iridium. Topics in Current Chemistry. 2007;281:143–203. [Google Scholar]
- 38.Evans R. C., Douglas P., Winscom C. J. Coordination complexes exhibiting room-temperature phosphorescence: evaluation of their suitability as triplet emitters for light-emitting diodes. Coordination Chemistry Reviews. 2006;250(15-16):2093–2126. doi: 10.1016/j.ccr.2006.02.007. [DOI] [Google Scholar]
- 39.Chi Y., Chou P. T. Transition-metal phosphors with cyclometalating ligands: fundamentals and applications. Chemical Society Reviews. 2010;39(2):638–655. doi: 10.1039/b916237b. [DOI] [PubMed] [Google Scholar]
- 40.Marco G. D., Lanza M., Mamo A., et al. Luminescent mononuclear and dinuclear iridium(III) cyclometalated complexes immobilized in a polymeric matrix as solid-state oxygen sensors. Analytical Chemistry. 1998;70(19):5019–5023. doi: 10.1021/ac0710836. [DOI] [PubMed] [Google Scholar]
- 41.DeRosa M. C., Mosher P. J., Yap G. P. A., Focsaneanu K. S., Crutchley R. J., Evanc C. E. B. Synthesis, characterization, and evaluation of [Ir(ppy)2(vpy)Cl] as a polymer-bound oxygen sensor. Inorganic Chemistry. 2003;42(16):4864–4872. doi: 10.1021/ic026230r. [DOI] [PubMed] [Google Scholar]
- 42.Licini M., Williams J. A. G. Iridium(iii) bis-terpyridine complexes displaying long-lived pH sensitive luminescence. Chemical Communications. 1999;(19):1943–1944. doi: 10.1039/a906203c. [DOI] [Google Scholar]
- 43.Arm K. J., Leslie W., Williams J. A. G. Synthesis and pH-sensitive luminescence of bis-terpyridyl iridium(III) complexes incorporating pendent pyridyl groups. Inorganica Chimica Acta. 2006;359(4):1222–1232. doi: 10.1016/j.ica.2005.09.021. [DOI] [Google Scholar]
- 44.Ho M. L., Hwang F. M., Chen P. N., et al. Design and synthesis of iridium(III) azacrown complex: application as a highly sensitive metal cation phosphorescence sensor. Organic and Biomolecular Chemistry. 2006;4(1):98–103. doi: 10.1039/b511943j. [DOI] [PubMed] [Google Scholar]
- 45.Konishi K., Yamaguchi H., Harada A. Synthesis of a water-soluble iridium(iii) complex with pH and metal cation sensitive photoluminescence. Chemistry Letters. 2006;35(7):720–721. doi: 10.1246/cl.2006.720. [DOI] [Google Scholar]
- 46.Schmittel M., Lin H. Luminescent iridium phenanthroline crown ether complex for the detection of silver(I) ions in aqueous media. Inorganic Chemistry. 2007;46(22):9139–9145. doi: 10.1021/ic700413v. [DOI] [PubMed] [Google Scholar]
- 47.Zhao Q., Cao T., Li F., et al. A highly selective and multisignaling optical-electrochemical sensor for Hg2+ based on a phosphorescent iridium(III) complex. Organometallics. 2007;26(8):2077–2081. doi: 10.1021/om061031r. [DOI] [Google Scholar]
- 48.Lo K. K. W., Louie M. W., Zhang K. Y. Design of luminescent iridium(III) and rhenium(I) polypyridine complexes as in vitro and in vivo ion, molecular and biological probes. Coordination Chemistry Reviews. 2010;254(21-22):2603–2622. doi: 10.1016/j.ccr.2010.01.014. [DOI] [Google Scholar]
- 49.Lo K. K. W., Li S. P. Y., Zhang K. Y. Development of luminescent iridium(III) polypyridine complexes as chemical and biological probes. New Journal of Chemistry. 2011;35(2):265–287. doi: 10.1039/c0nj00478b. [DOI] [Google Scholar]
- 50.Leung S. K., Kwok K. Y., Zhang K. Y., Lo K. K. W. Design of luminescent biotinylation reagents derived from cyclometalated iridium(III) and rhodium(III) bis(pyridylbenzaldehyde) complexes. Inorganic Chemistry. 2010;49(11):4984–4995. doi: 10.1021/ic100092d. [DOI] [PubMed] [Google Scholar]
- 51.Lo K. K. W., Li S. P. Y. Utilization of the photophysical and photochemical properties of phosphorescent transition metal complexes in the development of photofunctional cellular sensors, imaging reagents, and cytotoxic agents. RSC Advances. 2014;4(21):10560–10585. doi: 10.1039/c3ra47611a. [DOI] [Google Scholar]
- 52.Zhang K. Y., Li S. P. Y., Zhu N., et al. Structure, photophysical and electrochemical properties, biomolecular interactions, and intracellular uptake of luminescent cyclometalated iridium-(III) dipyridoquinoxaline complexes. Inorganic Chemistry. 2010;49(5):2530–2540. doi: 10.1021/ic902465b. [DOI] [PubMed] [Google Scholar]
- 53.Lee P. K., Law W. H. T., Liu H. W., Lo K. K. W. Luminescent cyclometalated iridium(III) polypyridine di-2-picolylamine complexes: synthesis, photophysics, electrochemistry, cation binding, cellular internalization, and cytotoxic activity. Inorganic Chemistry. 2011;50(17):8570–8579. doi: 10.1021/ic201153d. [DOI] [PubMed] [Google Scholar]
- 54.Zhang K. Y., Liu H. W., Fong T. T. H., Chen X. G., Lo K. K. W. Luminescent dendritic cyclometalated iridium(III) polypyridine complexes: synthesis, emission behavior, and biological properties. Inorganic Chemistry. 2010;49(12):5432–5443. doi: 10.1021/ic902443e. [DOI] [PubMed] [Google Scholar]
- 55.Zhao Q., Huang C., Li F. Phosphorescent heavy-metal complexes for bioimaging. Chemical Society Reviews. 2011;40(5):2508–2524. doi: 10.1039/c0cs00114g. [DOI] [PubMed] [Google Scholar]
- 56.Zhao Q., Yu M., Shi L., et al. Cationic iridium(III) complexes with tunable emission color as phosphorescent dyes for live cell imaging. Organometallics. 2010;29(5):1085–1091. doi: 10.1021/om900691r. [DOI] [Google Scholar]
- 57.Li C., Yu M., Sun Y., Wu Y., Huang C., Li F. Anonemissive iridium(III) complex that specifically lights-up the nuclei of living cells. Journal of the American Chemical Society. 2011;133(29):11231–11239. doi: 10.1021/ja202344c. [DOI] [PubMed] [Google Scholar]
- 58.You Y., Lee S., Kim T., et al. Phosphorescent sensor for biological mobile zinc. Journal of the American Chemical Society. 2011;133(45):18328–18342. doi: 10.1021/ja207163r. [DOI] [PMC free article] [PubMed] [Google Scholar]
- 59.Wu Y., Jing H., Dong Z., Zhao Q., Wu H., Li F. Ratiometric phosphorescence imaging of hg(II) in living cells based on a neutral iridium(III) complex. Inorganic Chemistry. 2011;50(16):7412–7420. doi: 10.1021/ic102082k. [DOI] [PubMed] [Google Scholar]
- 60.Murphy L., Congreve A., Palsson L. O., Williams J. A. G. The time domain in co-stained cell imaging: time- resolved emission imaging microscopy using a protonatable luminescent iridium complex. Chemical Communications. 2010;46(46):8743–8745. doi: 10.1039/c0cc03705b. [DOI] [PubMed] [Google Scholar]
- 61.Baggaley E., Weinstein J. A., Williams J. A. G. Lighting the way to see inside the live cell with luminescent transition metal complexes. Coordination Chemistry Reviews. 2012;256(15-16):1762–1785. doi: 10.1016/j.ccr.2012.03.018. [DOI] [Google Scholar]
- 62.You Y. Phosphorescence bioimaging using cyclometalated ir(III) complexes. Current Opinion in Chemical Biology. 2013;17(4):699–707. doi: 10.1016/j.cbpa.2013.05.023. [DOI] [PubMed] [Google Scholar]
- 63.Cao R., Jia J., Ma X., Zhou M., Fei H. Membrane localized iridium(III) complex induces endoplasmic reticulum stress and mitochondria-mediated apoptosis in human cancer cells. Journal of Medicinal Chemistry. 2013;56(9):3636–3644. doi: 10.1021/jm4001665. [DOI] [PubMed] [Google Scholar]
- 64.Zhou Y., Jia J., Li W., Fei H., Zhou M. Luminescent biscarbene iridium(III) complexes as living cell imaging reagents. Chemical Communications. 2013;49(31):3230–3232. doi: 10.1039/c3cc40845k. [DOI] [PubMed] [Google Scholar]
- 65.Zhang S., Hosaka M., Yoshihara T., et al. Phosphorescent light–emitting iridium complexes serve as a hypoxia-sensing probe for tumor imaging in living animals. Cancer Research. 2010;70(11):4490–4498. doi: 10.1158/0008-5472.can-09-3948. [DOI] [PubMed] [Google Scholar]
- 66.Tobita S., Yoshihara T. Intracellular and in vivo oxygen sensing using phosphorescent iridium(III) complexes. Current Opinion in Chemical Biology. 2016;33:39–45. doi: 10.1016/j.cbpa.2016.05.017. [DOI] [PubMed] [Google Scholar]
- 67.Hisamatsu Y., Aoki S. Design and synthesis of blue-emitting cyclometalated iridium-(III) complexes based on regioselective functionalization. European Journal of Inorganic Chemistry. 2011;2011(35):5360–5369. doi: 10.1002/ejic.201100755. [DOI] [Google Scholar]
- 68.Moromizato S., Hisamatsu Y., Suzuki T., Matsuo Y., Abe R., Aoki S. Design and synthesis of a luminescent cyclometalated iridium(III) complex having N,N-diethyl amino group that stains acidic intracellular organelles and induces cell death by photoirradiation. Inorganic Chemistry. 2012;51(23):12697–12706. doi: 10.1021/ic301310q. [DOI] [PubMed] [Google Scholar]
- 69.Nakagawa A., Hisamatsu Y., Moromizato S., Kohno M., Aoki S. Synthesis and photochemical properties of pH responsive tris-cyclometalated iridium(III) complexes that contain a pyridine ring on the 2-phenylpyridine ligand. Inorganic Chemistry. 2014;53(1):409–422. doi: 10.1021/ic402387b. [DOI] [PubMed] [Google Scholar]
- 70.Kando A., Hisamatsu Y., Ohwada H., Moromizato S., Kohno M., Aoki S. Photochemical properties of red-emitting tris(cyclometalated) iridium(III) complexes having basic and nitro groups and application to pH sensing and photo induced cell death. Inorganic Chemistry. 2015;54(11):5342–57. doi: 10.1021/acs.inorgchem.5b00369. [DOI] [PubMed] [Google Scholar]
- 71.Kumar S., Hisamatsu Y., Tamaki Y., Ishitani O., Aoki S. Design and synthesis of heteroleptic cyclometalated iridium(III) complexes containing quinoline-type ligands that exhibit dual phosphorescence. Inorganic Chemistry. 2016;55(8):3829–3843. doi: 10.1021/acs.inorgchem.5b02872. [DOI] [PubMed] [Google Scholar]
- 72.Hisamatsu Y., Shibuya A., Suzuki N., Abe R., Aoki S. Design and synthesis of amphiphilic and luminescent tris-cyclometalated iridium(III) complexes containing cationic peptides as inducers and detectors of cell death via a calcium-dependent pathway. Bioconjugate Chemistry. 2015;26(5):857–879. doi: 10.1021/acs.bioconjchem.5b00095. [DOI] [PubMed] [Google Scholar]
- 73.Hisamatsu Y., Suzuki N., Masum A., et al. Cationic amphiphilic tris-cyclometalated iridium(iii) complexes induce cancer cell death via interaction with Ca2+-calmodulin complex. Bioconjugate Chemistry. 2017;28(2):507–523. doi: 10.1021/acs.bioconjchem.6b00627. [DOI] [PubMed] [Google Scholar]
- 74.Yokoi K., Hisamatsu Y., Naito K., Aoki S. Design, synthesis and anticancer activity of cyclometalated tris(ppy) iridium(III) complexes having cationic peptides at the 4’-position of the ppy ligand (Ppy=2-phenylpyridine) European Journal of Inorganic Chemistry. 2017;2017(44):5295–5309. doi: 10.1002/ejic.201700846. [DOI] [Google Scholar]
- 75.Aoki S., Matsuo Y., Ogura S., et al. Regioselective aromatic substitution reactions of cyclometalated ir(III) complexes: synthesis and photochemical properties of substituted ir(III) complexes that exhibit blue, green, and red color luminescence emission. Inorganic Chemistry. 2011;50:806–818. doi: 10.1021/ic101164g. [DOI] [PubMed] [Google Scholar]
- 76.Slee E. A., Zhu H., Chow S. C., MacFarlane M., Nicholson D. W., Cohen G. M. Benzyloxycarbonyl-Val-Ala-Asp(OMe) fluoromethylketone (Z-VAD-FMK) inhibits apoptosis by blocking the processing of CPP32. Biochemical Journal. 1996;315(1):21–24. doi: 10.1042/bj3150021. [DOI] [PMC free article] [PubMed] [Google Scholar]
- 77.Degterev A., Hitomi J., Germscheid M., et al. Identification of RIP1 kinase as a specific cellular target of necrostatins. Nature Chemical Biology. 2008;4(5):313–321. doi: 10.1038/nchembio.83. [DOI] [PMC free article] [PubMed] [Google Scholar]
- 78.Dodo K., Katoh M., Shimizu T., Takahashi M., Sodeoka M. Inhibition of hydrogen peroxide-induced necrotic cell death with 3-amino-2-indolylmaleimide derivatives. Bioorganic and Medicinal Chemistry Letters. 2005;15(12):3114–3118. doi: 10.1016/j.bmcl.2005.04.016. [DOI] [PubMed] [Google Scholar]
- 79.Koopman G., Reutelingsperger C. P., Kuijten G. A., Keehnen R. M., Pals S. T., van Oers M. H. Annexin V for flow cytometric detection of phosphatidylserine expression on B cells undergoing apoptosis. Blood. 1994;84:1415–1420. [PubMed] [Google Scholar]
- 80.Vermes I., Haanen C., Steffens-Nakken H., Reutellingsperger C. A novel assay for apoptosis Flow cytometric detection of phosphatidylserine expression on early apoptotic cells using fluorescein labelled Annexin V. Journal of Immunological Methods. 1995;184(1):39–51. doi: 10.1016/0022-1759(95)00072-i. [DOI] [PubMed] [Google Scholar]
- 81.Lee P.-K., Liu H.-W., Yiu S.-M., Louie M. M.-W., Lo K. K.-W. Luminescent cyclometallated iridium(III) bis(quinolylbenzaldehyde) diimine complexes–synthesis, photophysics, electrochemistry, protein cross-linking properties, cytotoxicity and cellular uptake. Dalton Transactions. 2011;40(10):2180–2189. doi: 10.1039/c0dt00501k. [DOI] [PubMed] [Google Scholar]
- 82.Li S. P. Y., Tang T. S. M., Yiu K. S. M., Lo K. K. W. Cyclometalated iridium(III)-polyamine complexes with intense and long-lived multicolor phosphorescence: synthesis, crystal structure, photophysical behavior, cellular uptake, and transfection properties. Chemistry-A European Journal. 2012;18(42):13342–13354. doi: 10.1002/chem.201200979. [DOI] [PubMed] [Google Scholar]
- 83.Sun V. Z., Li Z., Deming T. J., Kamei D. T. Intracellular fates of cell-penetrating block copolypeptide vesicles. Biomacromolecules. 2011;12(1):10–13. doi: 10.1021/bm101036f. [DOI] [PMC free article] [PubMed] [Google Scholar]
- 84.Kimura T., Takabatake Y., Takahashi T., Isaka Y. Chloroquine in cancer therapy: a double-edged sword of autophagy. Cancer Research. 2013;73(1):3–7. doi: 10.1158/0008-5472.can-12-2464. [DOI] [PubMed] [Google Scholar]
- 85.Dröse S., Altendorf K. Bafilomycins and concanamycins as inhibitors of V-ATPases and P-ATPases. Journal of Experimental Biology. 1997;200:1–8. doi: 10.1242/jeb.200.1.1. [DOI] [PubMed] [Google Scholar]
- 86.Novohradsky V., Liu Z., Vojtiskova M., Sadler P. J., Brabec V., Kasparkova J. Mechanism of cellular accumulation of an iridium(III) pentamethyl cyclopentadienyl anticancer complex containing a C,N-chelating ligand. Metallomics. 2014;6(3):682–690. doi: 10.1039/c3mt00341h. [DOI] [PubMed] [Google Scholar]
- 87.Catterall W. A., Striessnig J. Receptor sites for Ca2+ channel antagonists. Trends in Pharmacological Sciences. 1992;13:256–262. doi: 10.1016/0165-6147(92)90079-l. [DOI] [PubMed] [Google Scholar]
- 88.Hockerman G. H., Peterson B. Z., Johnson B. D., Catterall W. A. Molecular determinants of drug binding and action on l-type calcium channels. Annual Review of Pharmacology and Toxicology. 1997;37(1):361–396. doi: 10.1146/annurev.pharmtox.37.1.361. [DOI] [PubMed] [Google Scholar]
- 89.Triggle D. J. Calcium channel antagonists: clinical uses: past, present and future. Biochemical Pharmacology. 2007;74(1):1–9. doi: 10.1016/j.bcp.2007.01.016. [DOI] [PubMed] [Google Scholar]
- 90.Motulsky H. J., Maisel A. S., Snavely M. D., Insel P. A. Quinidine is a competitive antagonist at alpha 1- and alpha 2- adrenergic receptors. Circulation Research. 1984;55(3):376–381. doi: 10.1161/01.res.55.3.376. [DOI] [PubMed] [Google Scholar]
- 91.Shibata K., Hirasawa A., Foglar R., Ogawa S., Tsujimoto G. Effects of quinidine and verapamil on human cardiovascular α1-adrenoceptors. Circulation. 1998;97(13):1227–1230. doi: 10.1161/01.cir.97.13.1227. [DOI] [PubMed] [Google Scholar]
- 92.Schreiber G., Barak A., Sokolovsky M. Disopyramide and quinidine bind with inverse selectivity to muscarinic receptors in cardiac and extra cardiac rat tissues. Journal of Cardiovascular Pharmacology. 1985;7(2):390–393. doi: 10.1097/00005344-198503000-00026. [DOI] [PubMed] [Google Scholar]
- 93.Harrow J. A., Dhalla N. S. Effects of quinidine on calcium transport activities of the rabbit heart mitochondria and sarcotubular vesicles. Biochemical Pharmacology. 1976;25(8):897–902. doi: 10.1016/0006-2952(76)90311-7. [DOI] [PubMed] [Google Scholar]
- 94.Van Driessche W. Physiological role of apical potassium ion channels in frog skin. Journal of Physiology. 1984;356(1):79–95. doi: 10.1113/jphysiol.1984.sp015454. [DOI] [PMC free article] [PubMed] [Google Scholar]
Associated Data
This section collects any data citations, data availability statements, or supplementary materials included in this article.
Supplementary Materials
Figure S1: the results of MTT assay. Figure S2: microscopic images of competitive staining. Figure S3: flow cytometry assay results of competitive staining. Figures S4–S6: flow cytometry assay results of costaining Figure S7: microscopic images of Jurkat, K562, and Molt-4 cells staining. Figure S8: HPLC charts of 5 after incubation in RPMI 1640 medium. Figures S9 and S10: the results of MTT assay in presence of inhibitors. Figure S11: microscopic images of staining in presence of inhibitors. Figure S12–13: 1H NMR and ESI mass charts of NHS ester of Ir complex 7. Figures S14–S15: 1H NMR and ESI mass charts of Ir complex 8. Figures S16 and S17: 1H NMR and ESI mass charts of NHS ester of Ir complex 8. Figures S18 and S19: 1H NMR and ESI mass charts of Ir complex 9. Figures S20–S22: HPLC, 1H NMR, and ESI mass charts of CP1. Figures S23–S25: HPLC, 1H NMR, and ESI mass charts of CP2. Figures S26–S28: HPLC, 1H NMR, and ESI mass charts of CP3. Figure S29–S31: HPLC, 1H NMR, and ESI mass charts of Ir complex 4. Figures S32–S34: HPLC, 1H NMR, and ESI mass charts of Ir complex 5. Figures S35–S37: HPLC, 1H NMR, and ESI mass charts of Ir complex 6.


