VOLUME 292 (2017) PAGES 7189–7207
There was an error in Equation 2 on pages 7197 and 7206 and in the supporting information. The corrected equation should be ((OCRtot − OCRoli)/hyperpolarization correction factor)/μg of protein = OCRcoupled. Additionally, a hyperpolarization correction factor of 0.932 was used in some calculations instead of the value reported in the paper (0.908). Correction of these errors alters a number of the numerical values for rates of ATP synthesis in the text and in Figs. 3–6 by up to 17%, but does not affect the qualitative conclusions or any of the statements about the statistical significance. The corrected Figs. 3–6 and the supporting information have been updated with the correct values. Consequently, the following changes to the text should also be made.
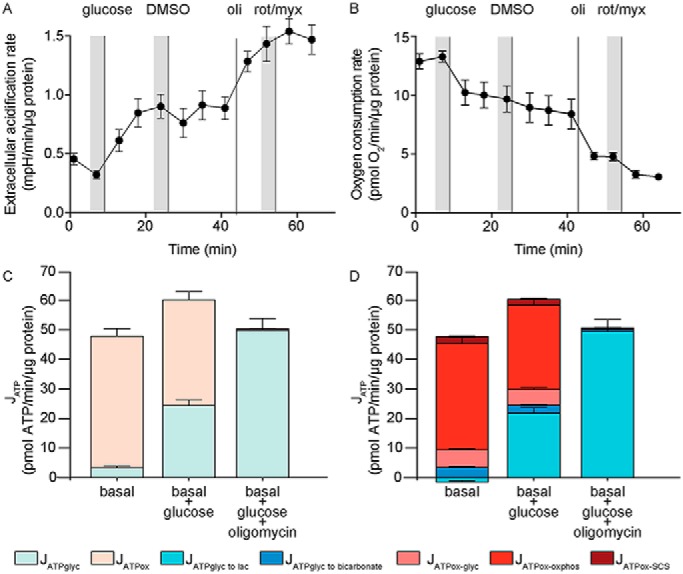
Figure 3.

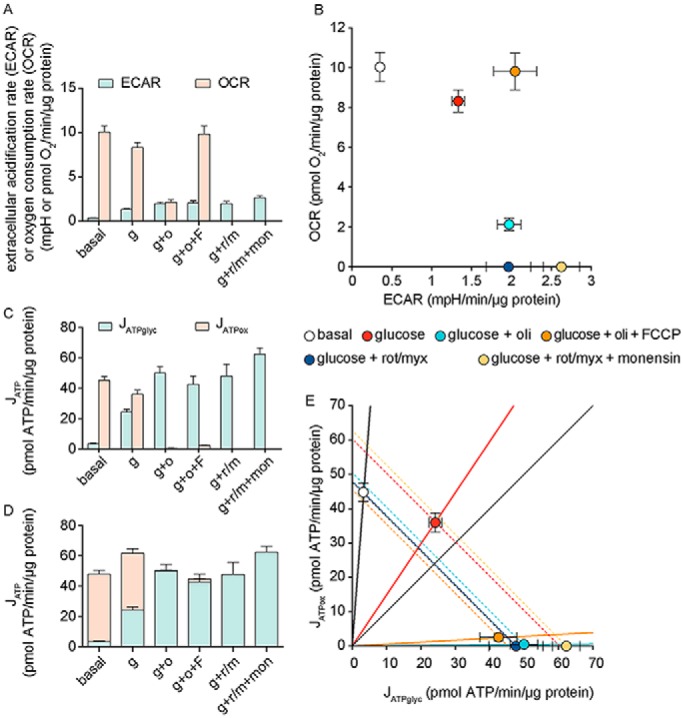
Figure 4.

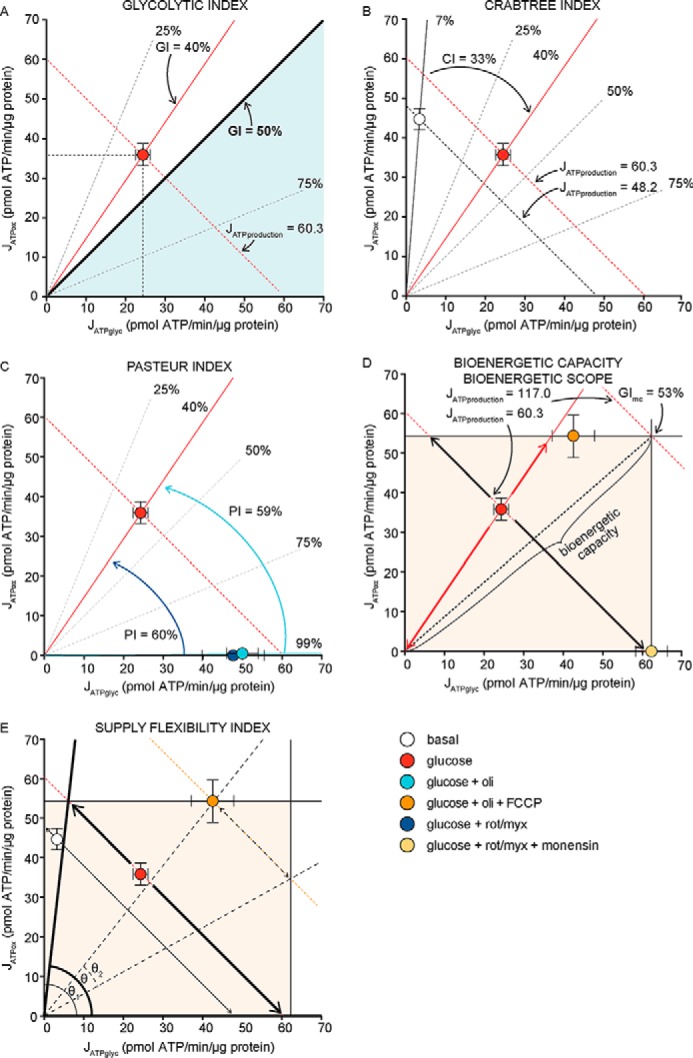
Figure 5.

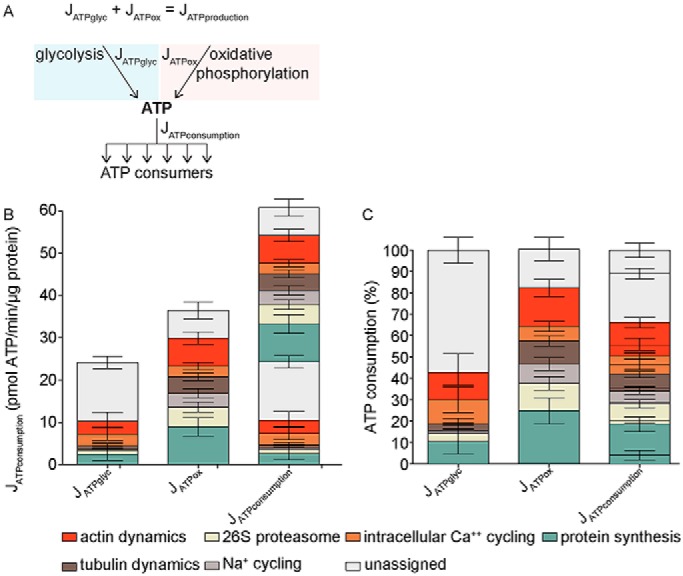
Figure 6.

PAGE 7196
In the second paragraph, left column, starting “JATPglyc and JATPox,” the last sentence: “The total rate of ATP production was 41.7 pmol of ATP/min/μg of cellular protein” should be: “The total rate of ATP production was 48.2 pmol of ATP/min/μg of cellular protein.”
In the third paragraph, left column: “Upon the addition of glucose to provide exogenous substrate, the cells began to run glycolysis to lactate, leading to a 32% increase in the total ATP production rate to 55.2 pmol of ATP/min/μg of cellular protein. This is equivalent to about 0.2 fmol of ATP/s/cell. At the same time, oxidative ATP production decreased by 19.6% (from 38.3 to 30.8 pmol/min/μg of protein)” should be:
“Upon the addition of glucose to provide exogenous substrate, the cells began to run glycolysis to lactate, leading to a 25% increase in the total ATP production rate to 60.3 pmol of ATP/min/μg of cellular protein. This is equivalent to about 0.2 fmol of ATP/s/cell. At the same time, oxidative ATP production decreased by 20.0% (from 44.8 to 36.0 pmol/min/μg of protein).”
PAGE 7197
In the third paragraph, left column: “The respiration rate/μg of protein coupled to ATP production is determined in column K using a correction for oligomycin-induced hyperpolarization of the mitochondrial membrane of 0.908, taken from Ref. 15,
| (Eq. 2) |
where ((182 − 62) × 0.908)/15 = 7.3 pmol of O2/min/μg of protein … where (7.3 × 2 × 2.486) + (9.3 × 2 × 0.121) = 38.4 pmol of ATP/min/μg of protein, assuming … ” should be:
“The respiration rate/μg of protein coupled to ATP production is determined in column K using a correction for oligomycin-induced hyperpolarization of the mitochondrial membrane of 0.908, taken from Ref. 15,
| (Eq. 2R) |
where ((182 − 62)/0.908)/15 = 8.8 pmol of O2/min/μg of protein … where (8.8 × 2 × 2.486) + (9.3 × 2 × 0.121) = 46.1 pmol of ATP/min/μg of protein, assuming … ”
In the second paragraph, right column: “In sum, the calculations for the basal condition are 1) OCRmito = (182 − 42)/15 = 9.3 pmol of O2/min/μg of protein; 2) OCRcoupled = ((182 − 62) × 0.908)/15 = 7.3 pmol of O2/min/μg of protein; 3) PPRtot = 5.2/0.045/15 = 7.7 pmol of H+/min/μg of protein; 4) PPRresp = 9.3 × 1 × (10(7.4 − 6.093)) / (1 + 10(7.4 − 6.093)) = 8.9 pmol of H+/min/μg of protein; 5) PPRglyc = 7.7 − 8.9 = −1.2 pmol of H+/min/μg of protein; 6) JATPglyc = (−1.2 × 1) + (9.3 × 2 × 0.242) = 3.3 pmol of ATP/min/μg of protein; 7) JATPox = (7.3 × 2 × 2.486) + (9.3 × 2 × 0.121) = 38.4 pmol of ATP/min/μg of protein” should be:
“In sum, the calculations for the basal condition are 1) OCRmito = (182 − 42)/15 = 9.3 pmol of O2/min/μg of protein; 2) OCRcoupled = ((182 − 62)/0.908)/15 = 8.8 pmol of O2/min/μg of protein; 3) PPRtot = 5.2/0.045/15 = 7.7 pmol of H+/min/μg of protein; 4) PPRresp = 9.3 × 1 × (10(7.4 − 6.093)) /(1 + 10(7.4 − 6.093)) = 8.9 pmol of H+/min/μg of protein; 5) PPRglyc = 7.7 − 8.9 = −1.2 pmol of H+/min/μg of protein; 6) JATPglyc = − (1.2 × 1) + (9.3 × 2 × 0.242) = 3.3 pmol of ATP/min/μg of protein; 7) JATPox = (8.8 × 2 × 2.486) + (9.3 × 2 × 0.121) = 46.1 pmol of ATP/min/μg of protein.”
In the fourth paragraph, right column: “For glucose, 1) OCRmito = (158 − 42)/15 = 7.7 pmol of O2/min/μg of protein; 2) OCRcoupled = ((158 − 62) × 0.908)/15 = 5.8 pmol of O2/min/μg of protein; 3) PPRtot = 19.7/0.045/15 = 29.2 pmol of H+/min/μg of protein; 4) PPRresp = 7.7 × 1 × (10(7.4 − 6.093))/ (1 + 10(7.4 − 6.093)) = 7.4 pmol of H+/min/μg of protein; 5) PPRglyc = 29.2 − 7.4 = 21.8 pmol of H+/min/μg of protein; 6) JATPglyc = (21.8 × 1) + (7.7 × 2 × 0.167) = 24.4 pmol of ATP/min/μg of protein; 7) JATPox = (5.8 × 2 × 2.486) + (7.7 × 2 × 0.121) = 30.8 pmol of ATP/min/μg of protein” should be:
“For glucose, 1) OCRmito = (158 − 42)/15 = 7.7 pmol of O2/min/μg of protein; 2) OCRcoupled = ((158 − 62)/0.908)/15 = 7.0 pmol of O2/min/μg of protein; 3) PPRtot = 19.7/0.045/15 = 29.2 pmol of H+/min/μg of protein; 4) PPRresp = 7.7 × 1 × (10(7.4 − 6.093))/(1 + 10(7.4 − 6.093)) = 7.4 pmol of H+/min/μg of protein; 5) PPRglyc = 29.2 − 7.4 = 21.8 pmol of H+/min/μg of protein; 6) JATPglyc = (21.8 × 1) + (7.7 × 2 × 0.167) = 24.4 pmol of ATP/min/μg of protein; 7) JATPox = (7.0 × 2 × 2.486) + (7.7 × 2 × 0.121) = 36.9 pmol of ATP/min/μg of protein.”
PAGE 7201
In the third paragraph, left column: “Fig. 5A demonstrates this characterization in the bioenergetic space plot. When provided with external glucose in aerobic culture, C2C12 myoblasts had JATPglyc = 24.4 ± 1.8 and JATPox = 30.8 ± 2.4, for a total of 55.2 ± 3.0 pmol of ATP/min/μg of protein (mean ± S.E., n = 36). Their glycolytic index was 24.4/55.2 = 44.2 ± 6.7%, insufficient (although … ” should be:
“Fig. 5A demonstrates this characterization in the bioenergetic space plot. When provided with external glucose in aerobic culture, C2C12 myoblasts had JATPglyc = 24.4 ± 1.8 and JATPox = 36.0 ± 2.7, for a total of 60.3 ± 3.2 pmol of ATP/min/μg of protein (mean ± S.E., n = 36). Their glycolytic index was 24.4/60.3 = 40.3 ± 6.7%, insufficient (although … ”
In the second paragraph, right column: “Fig. 5B demonstrates how the Crabtree effect (the change in JATPox when JATPglyc is altered) can be represented in the bioenergetic space plot. In addition to the glucose data point (24.4, 30.8) shown in Fig. 5A, Fig. 5B shows the point for C2C12 myoblasts under basal conditions with no exogenous substrate (3.4 ± 0.5, 38.3 ± 2.3). The glycolytic index of the cells without glucose was 3.4/(38.3 + 3.4) = 8.2%, whereas GI with glucose = 44.2%. This information … ” should be:
“Fig. 5B demonstrates how the Crabtree effect (the change in JATPox when JATPglyc is altered) can be represented in the bioenergetic space plot. In addition to the glucose data point (24.4, 36.0) shown in Fig. 5A, Fig. 5B shows the point for C2C12 myoblasts under basal conditions with no exogenous substrate (3.4 ± 0.5, 44.8 ± 2.6). The glycolytic index of the cells without glucose was 3.4/(44.8 + 3.4) = 7.0%, whereas GI with glucose = 40.3%. This information … ”
In the third paragraph, right column: “The Crabtree effect … This decrease is slightly greater for JATPox in Figs. 3C, 4C, and 5B, calculated as the x-value difference of 38.3 − 30.8 = 7.5 pmol ATP/min/μg of protein between the points before and after the glucose addition, a decrease in JATPox of 19.6%. It is tempting to conclude that the Crabtree index (the change in JATPox upon the addition of glucose) should have a value of 19.6%. However, to ensure that the Crabtree index is not confounded by any associated changes in total ATP production rate, JATPox should be scaled to JATP production. Therefore, the Crabtree index is best calculated as the change in the percentage of ATP production that is oxidative, not the absolute change. Under basal conditions without glucose (condition 1), oxidative ATP production was 38.3/(38.3 + 3.4) = 91.8%, and with glucose (condition 2), it was 30.8/(30.8 + 24.4) = 55.8%. The Crabtree index in these cells was therefore 91.8 − 55.8 = 36.0%. Because these values are scaled to JATP production, any change in JATPox describes an equal and opposite change in JATPglyc. Mathematically, this calculation of the Crabtree index is then the same as the value of the glycolytic index in condition 2 minus the value of the glycolytic index in condition 1 (44.2 − 8.2 = 36.0%) (Fig. 5B), so … ” should be:
“The Crabtree effect … This decrease is slightly greater for JATPox in Figs. 3C, 4C, and 5B, calculated as the x-value difference of 44.8 − 36.0 = 8.8 pmol ATP/min/μg of protein between the points before and after the glucose addition, a decrease in JATPox of 20.0%. It is tempting to conclude that the Crabtree index (the change in JATPox upon the addition of glucose) should have a value of 20.0%. However, to ensure that the Crabtree index is not confounded by any associated changes in total ATP production rate, JATPox should be scaled to JATP production. Therefore, the Crabtree index is best calculated as the change in the percentage of ATP production that is oxidative, not the absolute change. Under basal conditions without glucose (condition 1), oxidative ATP production was 44.8/(44.8 + 3.4) = 93.0%, and with glucose (condition 2), it was 36.0/(36.0 + 24.4) = 60.0%. The Crabtree index in these cells was therefore 93.0 − 60.0 = 33.0%. Because these values are scaled to JATP production, any change in JATPox describes an equal and opposite change in JATPglyc. Mathematically, this calculation of the Crabtree index is then the same as the value of the glycolytic index in condition 2 minus the value of the glycolytic index in condition 1 (40 − 7 = 33%) (Fig. 5B), so … ”
PAGE 7202
In the second paragraph, left column, through the first paragraph, right column: “This Crabtree index of 36% illustrates that more than one-third of JATP production shifted from JATPox to JATPglyc, reflecting a strong depression of oxidative ATP production by added glucose in these C2C12 cells. It reflects the underlying bioenergetics much more accurately than the simple change in oxygen consumption rate (17%) for three reasons. First, … In Fig. 5B, the addition of glucose increased JATP production from 41.7 to 55.2 units, partially … Theoretically, a negative Crabtree effect could occur if glycolytic activity were forced to slow (e.g. by adding an inhibitor to fully prevent glucose transport in the condition with glucose). We did not carry out such an experiment, but if it were to return all of the rates to basal, the Crabtree index would have been 36% (8 − 44% GI units); partial glycolytic inhibition would lead to smaller absolute values of CI.
Fig. 5C demonstrates how the Pasteur effect (the alteration in JATPglyc when JATPox is altered) can be represented in the bioenergetic space plot. In addition to the point for C2C12 myoblasts with glucose present (24.4, 30.8) shown in Fig. 5A, … Using the same logic … Starting from the point with glucose (GI = 44%) in Fig. 5C, the addition of oligomycin moved the cells to GI = 99%, giving PI a value of 44 − 99 = −55%. Similarly, the addition of rotenone plus myxothiazol moved the cells to GI = 100%, giving PI a value of 44 − 100 = −56%. If instead we choose to consider the inhibited conditions to be the initial ones, with the experimental manipulation being the “removal” of the inhibitors, then these values change sign (the “removal” of oligomycin activates oxidative phosphorylation and gives a Pasteur index of 55%)” should be:
“This Crabtree index of 33% illustrates that more than one-third of JATP production shifted from JATPox to JATPglyc, reflecting a strong depression of oxidative ATP production by added glucose in these C2C12 cells. It reflects the underlying bioenergetics much more accurately than the simple change in oxygen consumption rate (20%) for three reasons. First, … In Fig. 5B, the addition of glucose increased JATP production from 48.1 to 60.3 units, partially … Theoretically, a negative Crabtree effect could occur if glycolytic activity were forced to slow (e.g. by adding an inhibitor to fully prevent glucose transport in the condition with glucose). We did not carry out such an experiment, but if it were to return all of the rates to basal, the Crabtree index would have been 33% (7 − 40% GI units); partial glycolytic inhibition would lead to smaller absolute values of CI.
Fig. 5C demonstrates how the Pasteur effect (the alteration in JATPglyc when JATPox is altered) can be represented in the bioenergetic space plot. In addition to the point for C2C12 myoblasts with glucose present (24.4, 36.0) shown in Fig. 5A, … Using the same logic … Starting from the point with glucose (GI = 40%) in Fig. 5C, the addition of oligomycin moved the cells to GI = 99%, giving PI a value of 40 − 99 = − 59%. Similarly, the addition of rotenone plus myxothiazol moved the cells to GI = 100%, giving PI a value of 40 − 100 = −60%. If instead we choose to consider the inhibited conditions to be the initial ones, with the experimental manipulation being the “removal” of the inhibitors, then these values change sign (the “removal” of oligomycin activates oxidative phosphorylation and gives a Pasteur index of 59%).”
In the fourth paragraph, right column, through the first paragraph, left column, on page 7303: “Similarly, the maximum capacity … From the mitochondrial respiration rate in the presence of glucose + oligomycin + FCCP shown in Fig. 4A, the hypothetical maximum value of JATPox was 46.5 pmol of ATP/min/μg of protein. However, because the mitochondria were uncoupled, the actual value of JATPox (from substrate-linked phosphorylation in the tricarboxylic acid cycle) was 1.3 pmol of ATP/min/μg of protein, as shown in Fig. 4C. These maximum values of JATPglyc and JATPox define the bioenergetic capacity of the cells. As shown in Fig. 5D, the maximum individual capacities of JATPglyc and JATPox in the bioenergetic space plot intersect at (62.5, 46.5) for a theoretical maximum bioenergetic capacity of 62.5 + 46.5 = 109.0 pmol of ATP/min/μg of protein. At this maximum point, the glycolytic index (GImax capacity) would be 62.5/109 = 57.3%, making C2C12 myoblasts primarily glycolytic when running at their maximum ATP production rate. Compared with the actual value of JATP production in the presence of glucose (55.2), the bioenergetic capacity was 109/55.2 = 197% of the rate with glucose (Fig. 5D). This bioenergetic capacity of 197% of the rate with glucose (alternatively, a reserve capacity of 109.0 − 55.2 = 53.8 pmol of ATP/min/μg of protein) reveals … ” should be:
“Similarly, the maximum capacity … From the mitochondrial respiration rate in the presence of glucose + oligomycin + FCCP shown in Fig. 4A, the hypothetical maximum value of JATPox was 54.5 pmol of ATP/min/μg of protein. However, because the mitochondria were uncoupled, the actual value of JATPox (from substrate-linked phosphorylation in the tricarboxylic acid cycle) was 1.5 pmol of ATP/min/μg of protein, as shown in Fig. 4C. These maximum values of JATPglyc and JATPox define the bioenergetic capacity of the cells. As shown in Fig. 5D, the maximum individual capacities of JATPglyc and JATPox in the bioenergetic space plot intersect at (62.5, 54.5) for a theoretical maximum bioenergetic capacity of 62.5 + 54.5 = 117.0 pmol of ATP/min/μg of protein. At this maximum point, the glycolytic index (GImax capacity) would be 62.5/117 = 53.4%, making C2C12 myoblasts primarily glycolytic when running at their maximum ATP production rate. Compared with the actual value of JATP production in the presence of glucose (60.3), the bioenergetic capacity was 117/60.3 = 194% of the rate with glucose (Fig. 5D). This bioenergetic capacity of 194% of the rate with glucose (alternatively, a reserve capacity of 117.0 − 60.3 = 56.7 pmol of ATP/min/μg of protein) reveals … ”
PAGE 7203
In the first paragraph, right column: “ … cells with glucose, SFI was 100 × 79°/90° = 87%. This value shows that the cells had high flexibility to switch between ATP production pathways (87% of the maximum possible). The limitation … At the slightly lower ATP demand under basal conditions (JATP production = 41.7, thin arrows in Fig. 5E), SFI would rise to 100% as the line stayed within both limits of the bioenergetic scope. At the higher hypothetical ATP demand under glucose, oligomycin, and FCCP exposure (dotted arrows in Fig. 5E), SFI would drop further and be limited by both JATPox and JATPglyc, with a value of 28%. At the maximum … ” should be:
“ … cells with glucose, SFI was 100 × 84°/90° = 93%. This value shows that the cells had high flexibility to switch between ATP production pathways (93% of the maximum possible). The limitation … At the slightly lower ATP demand under basal conditions (JATP production = 48.1, thin arrows in Fig. 5E), SFI would rise to 100% as the line stayed within both limits of the bioenergetic scope. At the higher hypothetical ATP demand under glucose, oligomycin, and FCCP exposure (dotted arrows in Fig. 5E), SFI would drop further and be limited by both JATPox and JATPglyc, with a value of 25%. At the maximum ….”
PAGE 7206
In the first paragraph, left column: “ … mitochondrial protonmotive force upon the addition of oligomycin (5) (see supplemental Table 1). Thus, OCRcoupled = (OCRtot − OCRoli) × 0.908” should be:
… mitochondrial protonmotive force upon the addition of oligomycin (5) (see supplemental Table 1). Thus, OCRcoupled = (OCRtot − OCRoli)/0.908.”


