

Summary
The network approach is increasingly being applied to the investigation of normal brain function and its impairment. In the present review, we introduce the main methodological approaches employed for the analysis of resting‐state neuroimaging data in Parkinson's disease studies. We then summarize the results of recent studies that used a functional network perspective to evaluate the changes underlying different manifestations of Parkinson's disease, with an emphasis on its cognitive symptoms. Despite the variability reported by many studies, these methods show promise as tools for shedding light on the pathophysiological substrates of different aspects of Parkinson's disease, as well as for differential diagnosis, treatment monitoring and establishment of imaging biomarkers for more severe clinical outcomes.
Keywords: Functional magnetic resonance imaging, Neural networks, Parkinson's disease, Resting‐state
Introduction
Parkinson's disease (PD) is a chronic progressive neurological process. Clinically, PD is mainly characterized by motor symptoms derived from the severe loss of dopaminergic neurons in the substantia nigra pars compacta. PD is not, however, merely a motor disease. Cognitive, neuropsychiatric and autonomic manifestations are highly prevalent and may precede the onset of motor symptoms 1.
For any given task, a host of distributed, functionally specialized brain areas work in concert to integrate sensorial inputs with previously stored information, as well as with executive and motor regions to generate an appropriate behavior. The set of brain regions that interact in this manner make up large‐scale functional networks 2. A network perspective of brain function, accounting for the interactions between regions, offers a potentially useful framework for the study of normal functioning and also for the identification of relevant intermediate pathological phenotypes 3. Despite being in its early stages, the network approach applied to PD has shown potential clinical usefulness as a tool for differential diagnosis, monitoring disease progression, and treatment response, and also for the development of biomarkers for complications such as dementia. Noninvasive in vivo neuroimaging techniques also offer an unprecedented opportunity to characterize the pathophysiological substrates underlying different manifestations of the disease.
In the past decade, seminal studies 4, 5, 6, 7 showed that coherent patterns of spontaneous neural oscillations are observed during “rest”. The analysis of these oscillations reveals regions with correlated and anticorrelated activity, organized into large‐scale intrinsic connectivity networks (ICNs). These networks display a highly robust pattern of connectivity, with high test–retest reliability 8, 9, 10, and a high correspondence with task‐related networks 11. Taken together, these data suggest that task‐free or resting‐state techniques are a useful tool to probe the brain's intrinsic connectivity architecture 12 with potential clinical applications. Of note, it has recently been demonstrated that the sites where invasive (i.e., deep‐brain) stimulation and those where noninvasive (transcranial magnetic stimulation or transcranial direct current stimulation) are effective in PD can be shown to belong to the same brain networks through the analysis of resting‐state data 13.
The number of studies addressing resting‐state functional connectivity has increased considerably in the last few years, and the clinical impact of this type of analysis is currently being established. For these reasons, in this review we describe recent neuroimaging studies addressing alterations in PD through a network approach, mainly focusing on resting‐state functional connectivity studies. We put special emphasis on studies that searched for connectivity changes underlying cognitive deficits in PD, as there are currently no validated biomarkers for predicting or following these highly frequent and disabling complications. The studies included employed different methodologies, from the analysis of individual circuits or subsystems to whole‐brain approaches, both through the assessment of ICNs and graph‐theoretical techniques.
Cognitive Deficits in PD
Despite considerable interindividual variation, the vast majority of patients with PD develop cognitive impairments over time. By 20 years of disease duration, up to 80% of patients develop dementia 14, with a mean time from onset of PD to dementia of 10 years 15. PD‐related cognitive deficits are heterogeneous 16, mainly affecting attention and executive functions 17, 18, 19, 20, memory 19, 21, psychomotor speed 19, 21, and visuospatial/visuoperceptual abilities 18, 21, 22. Clinical presentations, response to therapy, and prognostic implications indicate the existence of two overlapping cognitive syndromes in PD: frontostriatal deficits, mainly related to dopaminergic imbalances 23; and a posterior cortical syndrome, not related to dopamine deficiency. As the name implies, the latter syndrome is characterized by impairments with a putative posterior cortical basis, such as semantic fluency and visuospatial/visuoperceptual deficits 18. Importantly, the posterior cortical syndrome, possibly related to gray matter synucleinopathy and/or Alzheimer's disease‐type pathology 24, is associated with a higher risk of dementia 18, 25, 26. Neuroimaging is probably the best tool to try to disentangle the neural underpinnings of both syndromes, with potential impact on risk stratification once disease‐modifying treatments become available.
Resting‐State Connectivity Analyses
Resting‐state fMRI (RS‐fMRI) connectivity methods are based on the temporal correlations of spontaneous blood oxygen level‐dependent (BOLD) signal fluctuations between different brain areas 27, 28, 29. Figures 1 and 2 describe two of the most frequently used approaches for connectivity analyses in RS‐fMRI studies: seed‐based analysis and independent component analysis (ICA). Given that dopamine plays a prominent role in striatal connectivity 30 and that dopaminergic deficits are responsible for many of PD's main clinical manifestations, the majority of RS‐fMRI studies in PD have focused on the connectivity of striatal networks. More recently, other ICNs have also been evaluated 31, 32.
Figure 1.
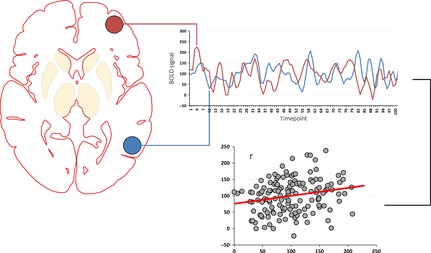
Seed‐based correlation techniques are straightforward and easily interpretable methods in functional connectivity analysis 96 that necessitate a priori hypotheses for seed definition. Briefly, the mean time courses of regions of interest (ROI)—representing structures or circuits of interest, or the main nodes of ICNs—are extracted. In seed‐to‐seed (or node‐to‐node) techniques, the mean time course of each ROI is correlated with the mean time courses of every other ROI, limiting the analysis to the circuits of interest. Alternatively, in seed‐to‐whole‐brain analyses, ROI time courses are used as regressors against the time courses of all voxels in the brain. Whole‐brain r‐correlation maps—in which the value assigned to each voxel is given by the correlation coefficient between its time series and the time series of the ROI in question—are thus generated, corresponding to the functional connectivity maps of each ROI. Subsequently, Fisher's r‐to‐z transformation is typically applied to ensure that the correlation coefficients are approximately normally distributed. The resulting connectivity maps are then analyzed using voxelwise statistical testing.
Figure 2.
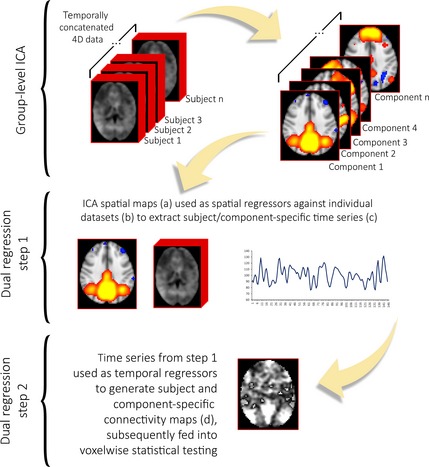
Independent component analysis (ICA) is a data‐driven procedure that identifies coherent spatial signal fluctuation patterns in the dataset, extracting maximally independent components associated with the underlying signal sources—such as ICN and spatially structured artifacts—while avoiding the potential biases in the a priori selection of ROIs 105, 107. The number of components estimated in ICA (i.e., its dimensionality reduction) is a possible source of variability in study results as there is no single best approach for characterizing the complex hierarchy of ICN neurobiology 104. Performing between‐subject ICA analysis is not a straightforward procedure, as it is difficult to establish a direct, one‐to‐one correspondence of ICNs identified with individual‐level ICAs 108. Most current resting‐state fMRI approaches involve performing group‐level ICA on the temporally concatenated datasets of all subjects—allowing the extraction of subject‐specific time courses and group‐common spatial maps 108. This is followed by the reconstruction of individual ICN maps through procedures such as dual regression or direct back‐reconstruction techniques 104, 108, 109, 110. These methods minimize the problem of intersubject ICN correspondence and takes advantage of the higher signal‐to‐noise ratio offered by analyzing several subjects conjointly 104.
Results from RS‐fMRI studies in PD are not always consistent; this may be related to the inclusion of small study samples and variable use of methodological approaches, including image preprocessing steps such as global signal regression 33. Additionally, head motion is often insufficiently reported and controlled for. Motion artifacts can bias connectivity estimates, and standard preprocessing methods may not be enough to correct them 34, 35. A discussion of state‐of‐the‐art procedures to reduce these artifacts is beyond the scope of this review, but this issue is especially relevant when studying patients with movement disorders. Also, dopaminergic neurotransmission influences ICN functional connectivity 36, 37 as well as network topology 38. Consequently, medication status (i.e., on‐state, off‐state, or drug‐naïve patients) certainly contributes to the variability in study findings. Finally, the manifestations of different clinical phenotypes of PD appear to have different functional substrates 39, 40. Clinical heterogeneity can therefore account for some of the variability in study findings.
Striatal Functional Connectivity in PD
Studies using seed‐to‐whole‐brain approaches have found reduced connectivity between the striatal nuclei, especially the putamen, and diffuse cortical/mesolimbic areas in patients with PD off medication 41, 42, 43. In patients on medication, reduced connectivity with subcortical regions and increased connectivity with motor/premotor cortical areas have been described 43, 44, 45. Baudrexel et al. 46 focused on subthalamic nucleus (STN) connectivity in off‐state patients with PD. The authors found increased connectivity between the STN and primary sensorimotor cortical regions. A recent study confirmed these findings in early, drug naïve as well as in off‐state moderate patients with PD 47.
A study by our group recently investigated frontostriatal connectivity changes associated with the presence of apathy in PD. Patients were assessed on medication. We found apathy to be associated with connectivity reductions, mainly involving the left limbic frontostriatal circuit (i.e., ventral striatum and orbitofrontal cortex) 48.
Using ICA and dual regression, Szewczyk‐Krolikowski et al. 49 described reduced connectivity between the basal ganglia network and widespread frontal, temporal, parietal cortical as well as striatal and brainstem regions in patients off medication compared with healthy controls as well as with patients on medication. These connectivity changes yielded an accuracy of 85% in differentiating patients from controls.
Finally, Kahan et al. 50 recently used a different approach to the study of resting‐state connectivity in corticostriatal–thalamic pathways in PD. The authors assessed a sample of patients who had undergone STN deep‐brain stimulation (STN‐DBS), acquiring RS‐fMRI data both with and without active stimulation. Instead of functional connectivity, authors investigated the effects of STN‐DBS on effective connectivity (which describes the causal influences of a region over another 51), estimated through dynamic causal modeling 52. They found STN‐DBS to reduce the strength of effective afferents and efferents of the STN and to increase the sensitivity of the striatum to cortical afferents, the sensitivity of the cortex to thalamic afferents, and the connectivity of the direct pathway. Furthermore, strengthening of the direct pathway explained the most beneficial effects of STN‐DBS.
Taken together, these study results indicate that dopamine deficits in PD lead to reduced overall functional corticostriatal connectivity and to increased connectivity in specific basal nuclei. Connectivity reductions mainly involve the portions of the striatum most affected by dopaminergic nigrostriatal denervation (i.e., the posterior putamen). Besides being related to the motor symptomology, functional connectivity changes are associated with nonmotor manifestations of PD such as apathy.
Default Mode Network Functional Connectivity in PD
The most studied cognitively relevant ICN in PD has been the default mode network (DMN). The DMN is mainly comprised of the precuneus/posterior cingulate cortex as well as medial prefrontal, inferior parietal and medial and lateral temporal cortical regions 53. Initially described by Shulman et al. as a group of areas with reduced activity during active tasks and increased activity during passive conditions 54, the DMN is hypothesized to be related to self‐referential processing 55. The deactivation of DMN regions during encoding is related to subsequent retrieval of learned information 56. Furthermore, DMN connectivity is relevant for externally directed attention and working‐memory task performance 57. Importantly, the overlap between DMN anatomy and the regions of hypometabolism in Alzheimer's disease (AD) led some authors to investigate pathological changes in this network. Subsequent studies showed patients with AD to have altered patterns of DMN activation/deactivation and abnormal functional connectivity between this network's main nodes 58, 59, 60. Data from such studies in healthy and pathological populations led to the hypothesis that the DMN can be used as a predictive tool in neuroscientific research 61, 62.
In PD, changes in the patterns of activation and deactivation of the DMN have been observed in task‐based analyses 63, 64. Also, a positive effect of dopaminergic medication on intra‐DMN connectivity has been suggested 65. Gorges et al. 66 used a seed‐to‐seed approach to RS‐fMRI DMN analysis and observed reduced functional connectivity between the medial PFC and the posterior cingulate cortex (PCC), as well as increased connectivity between left and right hippocampi. Comparing healthy controls and on‐state PD patients with and without visual hallucinations through ICA followed by dual regression, Yao et al. 67 found reduced intra‐DMN resting‐state functional connectivity in both PD groups. Patients with hallucinations displayed connectivity increases in the right frontal pole and in the precuneus/PCC, compared with patients without hallucinations.
Other Large‐Scale Intrinsic Connectivity Networks in PD
The analysis of resting‐state data reveals the existence of other ICNs thought to be related to a broad range of neural functions, from sensory/motor to higher order cognition. Although the networks described are similar across studies, a uniform nomenclature has not yet been proposed. The dorsal attention network (DAN) is postulated to subserve externally directed cognition—more specifically, top‐down allocation of attention 53, 68. The DAN is formed by the dorsolateral prefrontal cortex (PFC), frontal eye fields, inferior precentral sulcus, superior occipital gyrus, middle temporal motion complex, and superior parietal lobule 4, 69. The frontoparietal network (FPN) includes the lateral PFC, precuneus, inferior parietal lobule, medial superior PFC, and anterior insula. The FPN can flexibly connect to the DMN or the DAN depending on task nature and is hypothesized to mediate the dynamic balance between these networks 53, 70. Another network, the salience or cingulo‐opercular network, mainly comprised of the anterior insula, the dorsal anterior cingulate cortex (ACC) and subcortical limbic structures, is believed to be related to reward/motivation processing 71.
Shine et al. assessed a sample of patients with PD on medication, divided according to the presence or absence of visual hallucinations, using a seed‐to‐seed approach and without a healthy control group. Patients with hallucinations displayed reduced resting‐state connectivity between the ventral attention network and the DAN, and this reduction was associated with worse performance in the perceptual task. Patients with hallucinations also showed reduced functional connectivity between a DAN node (right dorsal ACC) and a DMN node (described as the left anterior interparietal lobule) 72. Additional task‐based fMRI analysis revealed that, when viewing monostable or bistable (ambiguous images that can be interpreted in two main ways) images, patients with hallucinations had reduced BOLD activation in areas belonging to the DAN. Furthermore, lower activation in the right frontal eye field (part of the DAN) was associated with increased misperceptions.
Recent studies have assessed the relationship between changes in ICN connectivity and cognitive measures. Using ICA, Tessitore et al. 32 found decreased intra‐DMN resting‐state connectivity in cognitively unimpaired patients with PD, assessed on medication, namely in the medial temporal lobe (associated with worse memory performance) and inferior parietal cortex (associated with visuospatial scores). In a study by our group 31, patients with PD on medication and a healthy control group were evaluated using seed‐to‐seed analyses as well as ICA and dual regression to assess changes in intra‐ and internetwork resting‐state functional connectivity. Seed‐to‐seed analyses showed that worse cognitive status was associated with reduced connectivity within the DAN and the DMN and reduced DAN‐FPN coupling. In ICA/dual regression analyses, PD patients with mild cognitive impairment (PD‐MCI) were seen to have reduced connectivity between the DAN and right frontoinsular regions; these connectivity reductions correlated with impairments in attention/executive functions. The anterior insula is increasingly being recognized as a brain hub involved in processes of network switch that are relevant for attention and executive functions 53, 73, 74. Importantly, recent studies found that patients with PD‐MCI have reduced insular dopaminergic D2 receptors and that this reduction correlates with impairments in executive functions 75. In PD patients with visual hallucinations, reduced insular gray matter (GM) density associated with reduced functional connectivity between regions of the ventral attention network and the DAN has been described 72. Combined with evidence that dopamine modulates resting‐state patterns of coupling between cognitively relevant networks such as the DAN, the DMN, and the FPN 76, and these data seem to indicate that ICN changes (likely mediated by insular dopaminergic denervation) play a role in dopamine‐related frontostriatal deficits in PD 77.
The association between changes in resting‐state DMN connectivity and cognitive functions not related to dopamine imbalances (e.g., visuospatial) described by Tessitore et al. 32 suggests that the posterior cortical syndrome (related to global cognitive decline) also has detectable resting‐state ICN correlates. Two recent studies seem to corroborate these findings 31, 78. In one study, we found that patients with PD‐MCI had changes in occipito‐parietal regions—namely cortical thinning, reduced connectivity with the DAN and loss of the pattern of anticorrelation with the DMN—which correlated with visuospatial deficits 31. In another study, Olde Dubbelink et al. 78 used synchronization likelihood as a measure of coupling, assessing patients with PD on medication in a longitudinal design. The authors describe resting‐state functional connectivity reductions, mainly involving posterior cortical regions, in association with global cognitive decline. They also describe a relationship between lower global mean connectivity levels and worsening cognitive status.
The observed association between posterior connectivity changes and structural degeneration 31 might indicate that disconnection is the result of primary cortical pathology. Nonetheless, axonal degeneration might antecede neuron cell body death in PD 79, 80, 81. In this context, neuroimaging techniques such as diffusion‐weighted imaging (DWI), which offers an in vivo indirect measure of microstructural white matter (WM) properties, have the potential to shed light on important aspects of PD‐related pathological process.
Alterations in WM microstructure have been consistently described in PD through neuroimaging, often involving diffuse brain areas 82, 83, 84, 85, 86, 87, 88, 89. Agosta et al. 89 found widespread WM fractional anisotropy (FA—a marker of WM microstructural organization that tends to be reduced in pathological processes) reductions in PD‐MCI subjects compared with healthy controls. Similarly, Melzer et al. 84 found that patients with MCI and dementia had diffuse FA decrements and mean diffusivity (MD—a microstructural parameter that tends to increase in WM disease) increments. Current evidence regarding the relationship between topographical WM changes and specific cognitive manifestations in PD is limited. Using a small patient sample and no control group, Zheng et al. 86 found that executive functions and language correlated with FA and, inversely, with MD in frontal WM tracts; attention was associated with DTI measures in widespread regions. Future studies, combining structural and functional connectivity techniques, could help clarify the role played by structural disconnection in the functional network alterations observed in PD.
Whole‐Brain Topology
Current neuroimaging techniques allow a complete, whole‐brain mapping of structural and functional interregional connections, that is, the connectome (Figure 3A) 90. The comprehensive study of large, complex datasets such as the human neuroimaging connectome necessitates systematic analytical approaches that provide quantifiable and biologically meaningful measures. In the context of complex network analysis, graph theory is a robust mathematical framework that can characterize the functional or structural properties of the brain by modeling it as a single network 91. Within this framework, functional neural networks—the graphs—are a collection of anatomical brain regions (nodes). In a functional graph, the connection (described in a graph as an edge) between a pair of nodes is defined by the temporal dependency of these nodes’ signal variations.
Figure 3.
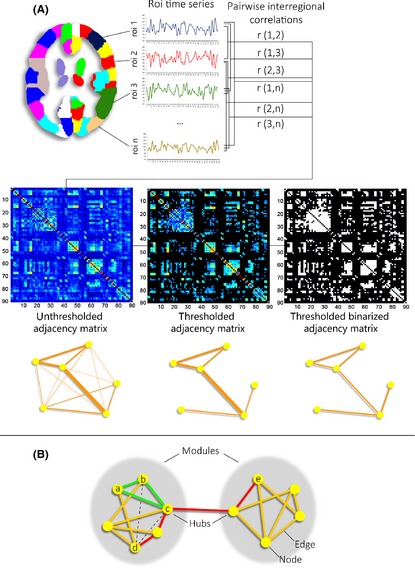
Panel A: Definition of functional brain networks. In its simplest form, the functional connectivity between a given pair of nodes is defined by the Pearson correlation between their respective time series. An adjacency matrix representing all internodal correlation coefficients is subsequently thresholded to discard weak, possibly noise‐related connections. There is no universally accepted approach for thresholding, however. The use of fixed strength thresholds can result in graphs with different connection density, making intersubject comparisons difficult 94. Fixed density thresholds, on the other hand, can be inappropriate in the presence of significant overall connectivity differences 94. The resulting graphs will be weighted if correlation strength is taken into account. Otherwise, binary graphs are generated. Panel B: Global and nodal network metrics. In the small network shown, the red line indicates the shortest path between nodes d and e. The characteristic path length of a node informs about how closely connected this node is to all other network nodes. It is given by the average shortest path length between itself and every other node, or, in its binary form, the average number of edges that need to be traversed in order to get from this to any other node 95. Network integration is given by the global characteristic path length (average of the characteristic path lengths of all nodes). The clustering coefficient of node a is represented by the number of triangles formed with its neighboring nodes (b, c, and d) 111. Only one triangle (green, a‐b‐c) is present out of three possible triangles (dashed lines, a‐b‐d and a‐c‐d), yielding a clustering coefficient of 1/3. The clustering coefficient describes how interconnected a node's neighbors are. The global clustering coefficient, given by the average of the clustering coefficients of all nodes in a network, is a measure of local connectedness or network segregation. A balance between global characteristic path length and clustering coefficients defines small‐world networks, characterized by high local specialization and some global shortcuts, allowing fast information transfer 111, 112. The human connectome displays small‐world topology in both functional and structural networks 112, 113. The degree of a node (number of input or output connections linked to it) describes this node's accessibility within the network 114. Degree in neural networks follows a heavy‐tailed distribution, indicating the existence of a set of highly connected or hub nodes 115. Hubs are hypothesized to be relevant for overall information transfer 116 and appear to be preferentially affected in several disorders 117. Finally, the measure of modularity indicates how well a network can be subdivided into well‐defined modules or communities made up of densely interconnected nodes with few intermodular connections, possibly representing the network's functional subcomponents. The small network shown contains two modules, connected by two connector hub nodes.
Nodes are the basic elements of a network assumed to represent its functional units. As neuroimaging methods can only probe the macroscalar organization of the connectome, network nodes should be defined by regions as functionally homogeneous as possible, with a coherent connectivity pattern 91. There is currently no consensual approach to define brain nodes through neuroimaging. As different parcellation strategies can yield different topological properties 92, networks obtained through different schemes are not quantitatively comparable 91. To further complicate the interpretability of graph theory studies, the neuroimaging modality employed and other methodological aspects—such as the use of binary or weighted graphs and the thresholding approach used—can influence the topology of the reconstructed networks 93, 94, 95, 96. Graph theory metrics inform on different global and local network properties; basic network measures are described in Figure 3B.
To this date, very few studies have evaluated patterns of resting‐state connectivity in PD using graph theory approaches, and most used RS‐fMRI. Lebedev et al. assessed drug‐naïve patients with PD through RS‐fMRI as well as with Ioflupane (123I) (DaTSCAN) imaging in a subsample. Worse performance in executive function tests was associated with lower nodal strength (sum of individual strengths of a node's links) in dorsal frontal and parietal regions. Additionally, this pattern correlated with nigrostriatal dopaminergic function. Memory performance, on the other hand, correlated with strength in prefronto‐limbic regions and was not associated with dopaminergic innervation 97. Assessing patients on medication, Göttlich et al. used different parcellation schemes and applied a density threshold range of 10–35% to construct binary networks. The authors found significantly higher normalized clustering coefficients and characteristic path lengths in the PD group at 10 and 15% density. No correlations, however, were performed between network parameters and clinical variables 98. In a study by our group, assessing on‐state patients and using a weighted network approach, no topological differences were found between healthy controls and the total PD sample. Stratifying the patient group according to cognitive status, patients with PD‐MCI were seen to have increased non‐normalized clustering as well as modularity and small‐world coefficients. In the overall PD sample, these measures correlated negatively with cognitive performance, namely in memory and visuospatial/perceptual functions. Additionally, network hubs displayed reduced centrality in patients with PD‐MCI, suggesting a reorganization of functional network traffic away from these brain regions 99. Assessing connectivity through wavelet correlation and using a weighted network approach, Skidmore et al. 100 found reduced local and global efficiency in a small sample of patients with PD off medication compared with controls. No correlations were performed with measures of disease severity.
In contrast with the RS‐fMRI studies described above, Olde Dubbelink et al. 101 used MEG to assess topological changes over time in a longitudinal design. Patients with PD were evaluated on medication, and baseline assessments included a drug‐naïve subsample. Longitudinal analyses revealed progressive reductions in normalized clustering coefficients at multiple frequency bands and reductions in normalized characteristic path lengths at the alpha2 band in the patient group. The apparent discrepancy observed between these clustering coefficient reductions and the increases described in RS‐fMRI studies may be related to the differential sensitivity to local connectivity displayed by different imaging modalities 102, 103.
Conclusions
The studies discussed in the present review show that resting‐state connectivity techniques, under a network perspective, are capable of identifying changes related to different clinical aspects of PD. In broad terms, these findings indicate that PD is accompanied by dopamine‐dependent functional connectivity disruptions in corticostriatal–thalamic–cortical networks that underlie both motor and nonmotor symptoms. The pattern of connectivity of other ICNs is also altered in PD. Within‐ and between‐network disruptions involving the DMN, the DAN, the FPN, and the ventral attention network seem to be associated with cognitive deficits and visual hallucinations. Dopaminergic and structural changes in the insula, a region involved in network switch, appear to be involved in these network abnormalities. General cognitive decline is also accompanied by long‐range functional connectivity reductions, possibly with a differential involvement of posterior cortical regions. Future studies combining structural and functional techniques should investigate whether alterations in structural connectivity contribute to these functional changes.
In graph‐theoretical analyses, the entire network organization is condensed into abstract topological parameters. The biological interpretation of the corresponding metrics, however, is often not straightforward. The combined use of methods that assess topographical changes, such as those discussed in the previous paragraph, can provide a more complete depiction of the reconfiguration of functional networks underlying clinical deficits in PD. The study of the connectome as a complex network is a recent field, and the relationship between different measures of network communication and brain function is only beginning to be unveiled. Advances in connectomics, including the use of multimodal approaches, the development of standardized procedures to reconstruct biologically consistent networks, as well as of mathematical models to interpret brain networks in physiologically meaningful ways, will determine the extent to which graph theory approaches become reliable tools from a clinical standpoint.
It is also clear that there is considerable variability in study results. Appropriate interpretation demands that sample characteristics be taken into account, especially with regard to treatment status and disease severity. Discrepant results are certainly due in part to the use of different methodological approaches, sensitive to different features of the pathological process and to different aspects of the complex interactions between functional networks. Susceptibility to confounds also varies according to the methodology used. Univariate approaches such as seed‐based correlation are insensitive to the statistical relationship between data points and are more susceptible to structured noise or to be confounded by spatial network overlap than multivariate methods such as ICA 104, 105. Seed‐based correlation is still useful, however, to answer specific research questions. Likewise, the potential effects of confounding factors such as motion artifacts on computed graph theory network metrics cannot be overstated. In light of recent publications, it is critical that new studies apply rigorous measures to control the effects of head motion and other non‐neural sources of signal variation, from subject exclusion to “cleanup” fMRI preprocessing procedures 35, 106.
In conclusion, neuroimaging network approaches are a promising tool in the study of PD, with the potential to shed light on relevant aspects of the neurodegenerative process and to provide useful biomarkers for more severe disease progression.
Conflict of Interest
The authors declare no conflict of interests.
Acknowledgments
This work was funded by the Spanish Ministry of Economy and Competitiveness [PSI2013‐41393 grant to C.J., H.C.B., and B.S.] and by the Generalitat de Catalunya [2014SG98].
References
- 1. Pont‐Sunyer C, Hotter A, Gaig C, et al. The Onset of Nonmotor Symptoms in Parkinson's disease (The ONSET PD Study). Mov Disord 2014;30:229–237. [DOI] [PubMed] [Google Scholar]
- 2. Bressler SL, Menon V. Large‐scale brain networks in cognition: emerging methods and principles. Trends Cogn Sci 2010;14:277–290. [DOI] [PubMed] [Google Scholar]
- 3. Pievani M, de Haan W, Wu T, et al. Functional network disruption in the degenerative dementias. Lancet Neurol 2011;10:829–843. [DOI] [PMC free article] [PubMed] [Google Scholar]
- 4. Fox MD, Snyder AZ, Vincent JL, et al. The human brain is intrinsically organized into dynamic, anticorrelated functional networks. Proc Natl Acad Sci U S A 2005;102:9673–9678. [DOI] [PMC free article] [PubMed] [Google Scholar]
- 5. Greicius MD, Krasnow B, Reiss AL, et al. Functional connectivity in the resting brain: a network analysis of the default mode hypothesis. Proc Natl Acad Sci U S A 2003;100:253–258. [DOI] [PMC free article] [PubMed] [Google Scholar]
- 6. Raichle ME, MacLeod AM, Snyder AZ, et al. A default mode of brain function. Proc Natl Acad Sci U S A 2001;98:676–682. [DOI] [PMC free article] [PubMed] [Google Scholar]
- 7. Biswal B, Yetkin FZ, Haughton VM, et al. Functional connectivity in the motor cortex of resting human brain using echo‐planar MRI. Magn Reson Med 1995;34:537–541. [DOI] [PubMed] [Google Scholar]
- 8. Shehzad Z, Kelly AMC, Reiss PT, et al. The resting brain: unconstrained yet reliable. Cereb Cortex 2009;19:2209–2229. [DOI] [PMC free article] [PubMed] [Google Scholar]
- 9. Patriat R, Molloy EK, Meier TB, et al. The effect of resting condition on resting‐state fMRI reliability and consistency: a comparison between resting with eyes open, closed, and fixated. NeuroImage 2013;78:463–473. [DOI] [PMC free article] [PubMed] [Google Scholar]
- 10. Thomason ME, Dennis EL, Joshi AA, et al. Resting‐state fMRI can reliably map neural networks in children. NeuroImage 2011;55:165–175. [DOI] [PMC free article] [PubMed] [Google Scholar]
- 11. Smith SM, Fox PT, Miller KL, et al. Correspondence of the brain's functional architecture during activation and rest. Proc Natl Acad Sci U S A 2009;106:13040–13045. [DOI] [PMC free article] [PubMed] [Google Scholar]
- 12. Bressler SL, Tognoli E. Operational principles of neurocognitive networks. Int J Psychophysiol 2006;60:139–148. [DOI] [PubMed] [Google Scholar]
- 13. Fox MD, Buckner RL, Liu H, et al. Resting‐state networks link invasive and noninvasive brain stimulation across diverse psychiatric and neurological diseases. Proc Natl Acad Sci U S A 2014;111:E4367–E4375. [DOI] [PMC free article] [PubMed] [Google Scholar]
- 14. Aarsland D, Kurz MW. The epidemiology of dementia associated with Parkinson disease. J Neurol Sci 2010;289:18–22. [DOI] [PubMed] [Google Scholar]
- 15. Hely MA, Morris JG, Traficante R, et al. The sydneymulticentre study of Parkinson's disease: progression and mortality at 10 years. J Neurol Neurosurg Psychiatry 1999;67:300–307. [DOI] [PMC free article] [PubMed] [Google Scholar]
- 16. Tremblay C, Achim AM, Macoir J, et al. The heterogeneity of cognitive symptoms in Parkinson's disease: a meta‐analysis. J Neurol Neurosurg Psychiatry 2013;84:1265–1272. [DOI] [PubMed] [Google Scholar]
- 17. Elgh E, Domellöf M, Linder J, et al. Cognitive function in early Parkinson's disease: a population‐based study. Eur J Neurol 2009;16:1278–1284. [DOI] [PubMed] [Google Scholar]
- 18. Williams‐Gray CH, Evans JR, Goris A, et al. The distinct cognitive syndromes of Parkinson's disease: 5 year follow‐up of the CamPaIGN cohort. Brain 2009;132:2958–2969. [DOI] [PubMed] [Google Scholar]
- 19. Muslimovic D, Post B, Speelman JD, et al. Cognitive profile of patients with newly diagnosed Parkinson disease. Neurology 2005;65:1239–1245. [DOI] [PubMed] [Google Scholar]
- 20. Owen AM. Cognitive dysfunction in Parkinson's disease: the role of frontostriatal circuitry. Neuroscientist 2004;10:525–537. [DOI] [PubMed] [Google Scholar]
- 21. Aarsland D, Brønnick K, Larsen JP, et al. Cognitive impairment in incident, untreated Parkinson disease: the Norwegian ParkWest study. Neurology 2009;72:1121–1126. [DOI] [PubMed] [Google Scholar]
- 22. Boller F, Passafiume D, Keefe NC, et al. Visuospatial impairment in Parkinson's disease. Role of perceptual and motor factors. Arch Neurol 1984;41:485–490. [DOI] [PubMed] [Google Scholar]
- 23. Gotham AM, Brown RG, Marsden CD. Levodopa treatment may benefit or impair ‘frontal’ function in Parkinson's disease. Lancet 1986;2:970–971. [DOI] [PubMed] [Google Scholar]
- 24. Nombela C, Rowe JB, Winder‐Rhodes SE, et al. Genetic impact on cognition and brain function in newly diagnosed Parkinson's disease: ICICLE‐PD study. Brain 2014;137:2743–2758. [DOI] [PMC free article] [PubMed] [Google Scholar]
- 25. Kehagia AA, Barker RA, Robbins TW. Neuropsychological and clinical heterogeneity of cognitive impairment and dementia in patients with Parkinson's disease. Lancet Neurol 2010;9:1200–1213. [DOI] [PubMed] [Google Scholar]
- 26. Robbins TW, Cools R. Cognitive deficits in Parkinson's disease: a cognitive neuroscience perspective. Mov Disord 2014;29:597–607. [DOI] [PubMed] [Google Scholar]
- 27. Fox MD, Raichle ME. Spontaneous fluctuations in brain activity observed with functional magnetic resonance imaging. Nat Rev Neurosci 2007;8:700–711. [DOI] [PubMed] [Google Scholar]
- 28. Logothetis NK, Wandell BA. Interpreting the BOLD signal. Annu Rev Physiol 2004;66:735–769. [DOI] [PubMed] [Google Scholar]
- 29. Logothetis NK. The underpinnings of the BOLD functional magnetic resonance imaging signal. J Neurosci 2003;23:3963–3971. [DOI] [PMC free article] [PubMed] [Google Scholar]
- 30. Surmeier DJ, Carrillo‐Reid L, Bargas J. Dopaminergic modulation of striatal neurons, circuits, and assemblies. Neuroscience 2011;198:3–18. [DOI] [PMC free article] [PubMed] [Google Scholar]
- 31. Baggio H‐C, Segura B, Sala‐Llonch R, et al. Cognitive impairment and resting‐state network connectivity in Parkinson's disease. Hum Brain Mapp 2015;36:199–212. [DOI] [PMC free article] [PubMed] [Google Scholar]
- 32. Tessitore A, Esposito F, Vitale C, et al. Default‐mode network connectivity in cognitively unimpaired patients with Parkinson disease. Neurology 2012;79:2226–2232. [DOI] [PubMed] [Google Scholar]
- 33. Schölvinck ML, Maier A, Ye FQ, et al. Neural basis of global resting‐state fMRI activity. Proc Natl Acad Sci U S A 2010;107:10238–10243. [DOI] [PMC free article] [PubMed] [Google Scholar]
- 34. Van Dijk KRA, Sabuncu MR, Buckner RL. The influence of head motion on intrinsic functional connectivity MRI. NeuroImage 2012;59:431–438. [DOI] [PMC free article] [PubMed] [Google Scholar]
- 35. Power JD, Barnes KA, Snyder AZ, et al. Spurious but systematic correlations in functional connectivity MRI networks arise from subject motion. NeuroImage 2012;59:2142–2154. [DOI] [PMC free article] [PubMed] [Google Scholar]
- 36. Cole DM, Beckmann CF, Oei NYL, et al. Differential and distributed effects of dopamine neuromodulations on resting‐state network connectivity. NeuroImage 2013;78:59–67. [DOI] [PubMed] [Google Scholar]
- 37. Esposito F, Tessitore A, Giordano A, et al. Rhythm‐specific modulation of the sensorimotor network in drug‐naive patients with Parkinson's disease by levodopa. Brain 2013;136:710–725. [DOI] [PubMed] [Google Scholar]
- 38. Achard S, Bullmore E. Efficiency and cost of economical brain functional networks. PLoS Comput Biol 2007;3:e17. [DOI] [PMC free article] [PubMed] [Google Scholar]
- 39. Zhang J, Wei L, Hu X, et al. Akinetic‐rigid and tremor‐dominant Parkinson's disease patients show different patterns of intrinsic brain activity. Parkinsonism Relat Disord 2015;21:23–30. [DOI] [PubMed] [Google Scholar]
- 40. Prodoehl J, Planetta PJ, Kurani AS, et al. Differences in brain activation between tremor‐ and nontremor‐dominant Parkinson disease. JAMA Neurol 2013;70:100–106. [DOI] [PMC free article] [PubMed] [Google Scholar]
- 41. Helmich RC, Derikx LC, Bakker M, et al. Spatial remapping of cortico‐striatal connectivity in Parkinson's disease. Cereb Cortex 2010;20:1175–1186. [DOI] [PubMed] [Google Scholar]
- 42. Luo C, Song W, Chen Q, et al. Reduced functional connectivity in early‐stage drug‐naive Parkinson's disease: a resting‐state fMRI study. Neurobiol Aging 2014;35:431–441. [DOI] [PubMed] [Google Scholar]
- 43. Agosta F, Caso F, Stankovic I, et al. Cortico‐striatal‐thalamic network functional connectivity in hemiparkinsonism. Neurobiol Aging 2014;35:2592–2602. [DOI] [PubMed] [Google Scholar]
- 44. Hacker CD, Perlmutter JS, Criswell SR, et al. Resting state functional connectivity of the striatum in Parkinson's disease. Brain 2012;135:3699–3711. [DOI] [PMC free article] [PubMed] [Google Scholar]
- 45. Yu R, Liu B, Wang L, et al. Enhanced functional connectivity between putamen and supplementary motor area in Parkinson's disease patients. PLoS ONE 2013;8:e59717. [DOI] [PMC free article] [PubMed] [Google Scholar]
- 46. Baudrexel S, Witte T, Seifried C, et al. Resting state fMRI reveals increased subthalamic nucleus‐motor cortex connectivity in Parkinson's disease. NeuroImage 2011;55:1728–1738. [DOI] [PubMed] [Google Scholar]
- 47. Kurani AS, Seidler RD, Burciu RG, et al. Subthalamic nucleus‐sensorimotor cortex functional connectivity in de novo and moderate Parkinson's disease. Neurobiol Aging 2015;36:462–469. [DOI] [PMC free article] [PubMed] [Google Scholar]
- 48. Baggio HC, Segura B, Garrido‐Millan JL, et al. Resting‐state frontostriatal functional connectivity in Parkinson's disease‐related apathy. Mov Disord 2015;30:671–679. [DOI] [PubMed] [Google Scholar]
- 49. Szewczyk‐Krolikowski K, Menke RAL, Rolinski M, et al. Functional connectivity in the basal ganglia network differentiates PD patients from controls. Neurology 2014;83:208–214. [DOI] [PMC free article] [PubMed] [Google Scholar]
- 50. Kahan J, Urner M, Moran R, et al. Resting state functional MRI in Parkinson's disease: the impact of deep brain stimulation on ‘effective’ connectivity. Brain 2014;137:1130–1144. [DOI] [PMC free article] [PubMed] [Google Scholar]
- 51. Stephan KE, Friston KJ. Analyzing effective connectivity with fMRI. Wiley Interdiscip Rev Cogn Sci 2010;1:446–459. [DOI] [PMC free article] [PubMed] [Google Scholar]
- 52. Kahan J, Foltynie T. Understanding DCM: ten simple rules for the clinician. NeuroImage 2013;83:542–549. [DOI] [PubMed] [Google Scholar]
- 53. Spreng RN, Sepulcre J, Turner GR, et al. Intrinsic architecture underlying the relations among the default, dorsal attention, and frontoparietal control networks of the human brain. J Cogn Neurosci 2013;25:74–86. [DOI] [PMC free article] [PubMed] [Google Scholar]
- 54. Shulman GL, Fiez JA, Corbetta M, et al. Common Blood Flow Changes across Visual Tasks: II. Decreases in Cerebral Cortex. J Cogn Neurosci 1997;9:648–663. [DOI] [PubMed] [Google Scholar]
- 55. Gusnard DA, Raichle ME. Searching for a baseline: functional imaging and the resting human brain. Nat Rev Neurosci 2001;2:685–694. [DOI] [PubMed] [Google Scholar]
- 56. Anticevic A, Cole MW, Murray JD, et al. The role of default network deactivation in cognition and disease. Trends Cogn Sci 2012;16:584–592. [DOI] [PMC free article] [PubMed] [Google Scholar]
- 57. Sala‐Llonch R, Peña‐Gómez C, Arenaza‐Urquijo EM, et al. Brain connectivity during resting state and subsequent working memory task predicts behavioural performance. Cortex 2012;48:1187–1196. [DOI] [PubMed] [Google Scholar]
- 58. Mevel K, Chételat G, Eustache F, et al. The default mode network in healthy aging and Alzheimer's disease.Int . J Alzheimers Dis 2011;2011:535816. [DOI] [PMC free article] [PubMed] [Google Scholar]
- 59. Greicius MD, Srivastava G, Reiss AL, et al. Default‐mode network activity distinguishes Alzheimer's disease from healthy aging: evidence from functional MRI. Proc Natl Acad Sci U S A 2004;101:4637–4642. [DOI] [PMC free article] [PubMed] [Google Scholar]
- 60. Rombouts SARB, Barkhof F, Goekoop R, et al. Altered resting state networks in mild cognitive impairment and mild Alzheimer's disease: an fMRI study. Hum Brain Mapp 2005;26:231–239. [DOI] [PMC free article] [PubMed] [Google Scholar]
- 61. Sandrone S. The brain as a crystal ball: the predictive potential of default mode network. Front Hum Neurosci 2012;6:261. [DOI] [PMC free article] [PubMed] [Google Scholar]
- 62. Sandrone S, Bacigaluppi M. Learning from default mode network: the predictive value of resting state in traumatic brain injury. J Neurosci 2012;32:1915–1917. [DOI] [PMC free article] [PubMed] [Google Scholar]
- 63. van Eimeren MT, Monchi O. Dysfunction of the Default Mode Network in Parkinson Disease. Arch Neurol 2009;66:877–883. [DOI] [PMC free article] [PubMed] [Google Scholar]
- 64. Ibarretxe‐Bilbao N, Zarei M, Junque C, et al. Dysfunctions of cerebral networks precede recognition memory deficits in early Parkinson's disease. NeuroImage 2011;57:589–597. [DOI] [PubMed] [Google Scholar]
- 65. Krajcovicova L, Mikl M, Marecek R, et al. The default mode network integrity in patients with Parkinson's disease is levodopa equivalent dose‐dependent. J Neural Transm 2012;119:443–454. [DOI] [PubMed] [Google Scholar]
- 66. Gorges M, Müller H‐P, Lulé D, et al. Functional connectivity within the default mode network is associated with saccadic accuracy in Parkinson's disease: a resting‐state FMRI and videooculographic study. Brain Connect 2013;3:265–272. [DOI] [PubMed] [Google Scholar]
- 67. Yao N, Shek‐Kwan Chang R, Cheung C, et al. The default mode network is disrupted in parkinson's disease with visual hallucinations. Hum Brain Mapp 2014;35:5658–5666. [DOI] [PMC free article] [PubMed] [Google Scholar]
- 68. Vossel S, Weidner R, Driver J, et al. Deconstructing the architecture of dorsal and ventral attention systems with dynamic causal modeling. J Neurosci 2012;32:10637–10648. [DOI] [PMC free article] [PubMed] [Google Scholar]
- 69. Fox MD, Corbetta M, Snyder AZ, et al. Spontaneous neuronal activity distinguishes human dorsal and ventral attention systems. Proc Natl Acad Sci U S A 2006;103:10046–10051. [DOI] [PMC free article] [PubMed] [Google Scholar]
- 70. Spreng RN, Stevens WD, Chamberlain JP, et al. Default network activity, coupled with the frontoparietal control network, supports goal‐directed cognition. NeuroImage 2010;53:303–317. [DOI] [PMC free article] [PubMed] [Google Scholar]
- 71. Sadaghiani S, D'Esposito M. Functional Characterization of the Cingulo‐Opercular Network in the Maintenance of Tonic Alertness. Cereb Cortex 2014; doi: 10.1093/cercor/bhu072. [Epub ahead of print]. [DOI] [PMC free article] [PubMed] [Google Scholar]
- 72. Shine JM, Halliday GM, Gilat M, et al. The role of dysfunctional attentional control networks in visual misperceptions in Parkinson's disease. Hum Brain Mapp 2014;35:2206–2219. [DOI] [PMC free article] [PubMed] [Google Scholar]
- 73. Seeley WW, Menon V, Schatzberg AF, et al. Dissociable intrinsic connectivity networks for salience processing and executive control. J Neurosci 2007;27:2349–2356. [DOI] [PMC free article] [PubMed] [Google Scholar]
- 74. Sridharan D, Levitin DJ, Menon V. A critical role for the right fronto‐insular cortex in switching between central‐executive and default‐mode networks. Proc Natl Acad Sci U S A 2008;105:12569–12574. [DOI] [PMC free article] [PubMed] [Google Scholar]
- 75. Christopher L, Marras C, Duff‐Canning S, et al. Combined insular and striatal dopamine dysfunction are associated with executive deficits in Parkinson's disease with mild cognitive impairment. Brain 2014;137:565–575. [DOI] [PMC free article] [PubMed] [Google Scholar]
- 76. Dang LC, O'Neil JP, Jagust WJ. Dopamine supports coupling of attention‐related networks. J Neurosci 2012;32:9582–9587. [DOI] [PMC free article] [PubMed] [Google Scholar]
- 77. Christopher L, Koshimori Y, Lang AE, et al. Uncovering the role of the insula in non‐motor symptoms of Parkinson's disease. Brain 2014;137:2143–2154. [DOI] [PMC free article] [PubMed] [Google Scholar]
- 78. OldeDubbelink KTE, Schoonheim MM, Deijen JB, et al. Functional connectivity and cognitive decline over 3 years in Parkinson disease. Neurology 2014;83:2046–2053. [DOI] [PubMed] [Google Scholar]
- 79. Burke RE, O'Malley K. Axon degeneration in Parkinson's disease. Exp Neurol 2013;246:72–83. [DOI] [PMC free article] [PubMed] [Google Scholar]
- 80. O'Malley KL. The role of axonopathy in Parkinson's disease. Exp Neurobiol 2010;19:115–119. [DOI] [PMC free article] [PubMed] [Google Scholar]
- 81. Dauer W, Przedborski S. Parkinson's disease: mechanisms and models. Neuron 2003;39:889–909. [DOI] [PubMed] [Google Scholar]
- 82. Hattori T, Orimo S, Aoki S, et al. Cognitive status correlates with white matter alteration in Parkinson's disease. Hum Brain Mapp 2012;33:727–739. [DOI] [PMC free article] [PubMed] [Google Scholar]
- 83. Koshimori Y, Segura B, Christopher L, et al. Imaging changes associated with cognitive abnormalities in Parkinson's disease. Brain Struct Funct 2015;220:2249–2261. [DOI] [PMC free article] [PubMed] [Google Scholar]
- 84. Melzer TR, Watts R, MacAskill MR, et al. White matter microstructure deteriorates across cognitive stages in Parkinson disease. Neurology 2013;80:1841–1849. [DOI] [PubMed] [Google Scholar]
- 85. Theilmann RJ, Reed JD, Song DD, et al. White‐matter changes correlate with cognitive functioning in Parkinson's disease. Front Neurol 2013;4:37. [DOI] [PMC free article] [PubMed] [Google Scholar]
- 86. Zheng Z, Shemmassian S, Wijekoon C, et al. DTI correlates of distinct cognitive impairments in Parkinson's disease. Hum Brain Map 2014;35:1325–1333. [DOI] [PMC free article] [PubMed] [Google Scholar]
- 87. Rae CL, Correia MM, Altena E, et al. White matter pathology in Parkinson's disease: the effect of imaging protocol differences and relevance to executive function. NeuroImage 2012;62:1675–1684. [DOI] [PMC free article] [PubMed] [Google Scholar]
- 88. Gattellaro G, Minati L, Grisoli M, et al. White matter involvement in idiopathic Parkinson disease: a diffusion tensor imaging study. AJNR Am J Neuroradiol 2009;30:1222–1226. [DOI] [PMC free article] [PubMed] [Google Scholar]
- 89. Agosta F, Canu E, Stefanova E, et al. Mild cognitive impairment in Parkinson's disease is associated with a distributed pattern of brain white matter damage. Hum Brain Mapp 2013;35:1921–1929. [DOI] [PMC free article] [PubMed] [Google Scholar]
- 90. Sporns O. Discovering the Human Connectome. Cambridge, MA: The MIT Press, 2012. [Google Scholar]
- 91. Rubinov M, Sporns O. Complex network measures of brain connectivity: uses and interpretations. NeuroImage 2010;52:1059–1069. [DOI] [PubMed] [Google Scholar]
- 92. Wang J, Wang L, Zang Y, et al. Parcellation‐dependent small‐world brain functional networks: a resting‐state fMRI study. Hum Brain Mapp 2009;30:1511–1523. [DOI] [PMC free article] [PubMed] [Google Scholar]
- 93. Liang X, Wang J, Yan C, et al. Effects of different correlation metrics and preprocessing factors on small‐world brain functional networks: a resting‐state functional MRI study. PLoS ONE 2012;7:e32766. [DOI] [PMC free article] [PubMed] [Google Scholar]
- 94. Van Wijk BCM, Stam CJ, Daffertshofer A. Comparing brain networks of different size and connectivity density using graph theory. PLoS ONE 2010;5:e13701. [DOI] [PMC free article] [PubMed] [Google Scholar]
- 95. Bullmore E, Sporns O. Complex brain networks: graph theoretical analysis of structural and functional systems. Nat Rev Neurosci 2009;10:186–198. [DOI] [PubMed] [Google Scholar]
- 96. Stam CJ. Modern network science of neurological disorders. Nat Rev Neurosci 2014;15:683–695. [DOI] [PubMed] [Google Scholar]
- 97. Lebedev AV, Westman E, Simmons A, et al. Large‐scale resting state network correlates of cognitive impairment in Parkinson's disease and related dopaminergic deficits. Front Syst Neurosci 2014;8:45. [DOI] [PMC free article] [PubMed] [Google Scholar]
- 98. Göttlich M, Münte TF, Heldmann M, et al. Altered resting state brain networks in Parkinson's disease. PLoS ONE 2013;8:e77336. [DOI] [PMC free article] [PubMed] [Google Scholar]
- 99. Baggio H‐C, Sala‐Llonch R, Segura B, et al. Functional brain networks and cognitive deficits in Parkinson's disease. Hum Brain Mapp 2014;35:4620–4634. [DOI] [PMC free article] [PubMed] [Google Scholar]
- 100. Skidmore F, Korenkevych D, Liu Y, et al. Connectivity brain networks based on wavelet correlation analysis in Parkinson fMRI data. Neurosci Lett 2011;499:47–51. [DOI] [PubMed] [Google Scholar]
- 101. OldeDubbelink KTE, Hillebrand A, Stoffers D, et al. Disrupted brain network topology in Parkinson's disease: a longitudinal magnetoencephalography study. Brain 2014;137:197–207. [DOI] [PubMed] [Google Scholar]
- 102. De Vico Fallani F, Richiardi J, Chavez M, et al. Graph analysis of functional brain networks: practical issues in translational neuroscience. Philos Trans R SocLond B Biol Sci 2014;369:20130521. [DOI] [PMC free article] [PubMed] [Google Scholar]
- 103. Tijms BM, Wink AM, de Haan W, et al. Alzheimer's disease: connecting findings from graph theoretical studies of brain networks. Neurobiol Aging 2013;34:2023–2036. [DOI] [PubMed] [Google Scholar]
- 104. Cole DM, Smith SM, Beckmann CF. Advances and pitfalls in the analysis and interpretation of resting‐state FMRI data. Front Syst Neurosci 2010;4:8. [DOI] [PMC free article] [PubMed] [Google Scholar]
- 105. Smith DV, Utevsky AV, Bland AR, et al. Characterizing individual differences in functional connectivity using dual‐regression and seed‐based approaches. NeuroImage 2014;95:1–12. [DOI] [PMC free article] [PubMed] [Google Scholar]
- 106. Murphy K, Birn RM, Bandettini PA. Resting‐state fMRI confounds and cleanup. NeuroImage 2013;80:349–359. [DOI] [PMC free article] [PubMed] [Google Scholar]
- 107. Beckmann CF, Smith SM. Probabilistic independent component analysis for functional magnetic resonance imaging. IEEE Trans Med Imaging 2004;23:137–152. [DOI] [PubMed] [Google Scholar]
- 108. Erhardt EB, Rachakonda S, Bedrick EJ, et al. Comparison of multi‐subject ICA methods for analysis of fMRI data. Hum Brain Mapp 2011;32:2075–2095. [DOI] [PMC free article] [PubMed] [Google Scholar]
- 109. Zuo X‐N, Kelly C, Adelstein JS, et al. Reliable intrinsic connectivity networks: test‐retest evaluation using ICA and dual regression approach. NeuroImage 2010;49:2163–2177. [DOI] [PMC free article] [PubMed] [Google Scholar]
- 110. Filippini N, MacIntosh BJ, Hough MG, et al. Distinct patterns of brain activity in young carriers of the APOE‐epsilon4 allele. Proc Natl Acad Sci U S A 2009;106:7209–7214. [DOI] [PMC free article] [PubMed] [Google Scholar]
- 111. Watts DJ, Strogatz SH. Collective dynamics of ‘small‐world’ networks. Nature 1998;393:440–442. [DOI] [PubMed] [Google Scholar]
- 112. Sporns O, Honey CJ. Small worlds inside big brains. Proc Natl Acad Sci U S A 2006;103:19219–19220. [DOI] [PMC free article] [PubMed] [Google Scholar]
- 113. Achard S, Salvador R, Whitcher B, et al. A resilient, low‐frequency, small‐world human brain functional network with highly connected association cortical hubs. J Neurosci 2006;26:63–72. [DOI] [PMC free article] [PubMed] [Google Scholar]
- 114. Tewarie P, Hillebrand A, van Dellen E, et al. Structural degree predicts functional network connectivity: a multimodal resting‐state fMRI and MEG study. NeuroImage 2014;97:296–307. [DOI] [PubMed] [Google Scholar]
- 115. Van den Heuvel MP, Sporns O. Rich‐club organization of the human connectome. J Neurosci 2011;31:15775–15786. [DOI] [PMC free article] [PubMed] [Google Scholar]
- 116. Van den Heuvel MP, Sporns O. Network hubs in the human brain. Trends Cogn Sci 2013;17:683–696. [DOI] [PubMed] [Google Scholar]
- 117. Crossley NA, Mechelli A, Scott J, et al. The hubs of the human connectome are generally implicated in the anatomy of brain disorders. Brain 2014;137:2382–2395. [DOI] [PMC free article] [PubMed] [Google Scholar]