

Abstract
Background/Aims
“Whole brain” infusions have emerged as a potential need with the promise of disease-modifying therapies for neurodegenerative diseases. In addition, several current clinical trials in brain cancer utilize direct delivery of drugs that are required to fill large volumes. Such requirements may not be well served by conventional single port catheters with their “point source” of delivery.
Our aim is to examine infusions into large volumes of heterogeneous tissue, aiming for uniformity of distribution.
Methods
A porous catheter (Porous Brain Infusion Catheter, “PBIC”) designed by Twin Star TDS, LLC., for brain infusions was developed for this study and compared with another CED catheter (SmartFlow™ NGS-NC-03 from MRI Interventions, a Step End-Port Catheter “SEPC”) in current use in clinical trials. The studies were in-vivo in porcine brain. A total of 8 pigs were used: the size of the pig brain limited the porous length to 15 mm. The placements of the tips of the two catheters were chosen to be the same (at the respective brain hemispheres).
Results
The PBIC and SEPC both performed comparably and well, with the PBIC having some advantage in effecting larger distributions: p ~ 0.045, with 5 infusions from each.
Conclusions
Given the performance of the PBIC, it would be highly appropriate to use the device for therapeutic infusions in human clinical trials to assess its capability for large volume infusions.
Keywords: In-vivo infusions, Convection-enhanced delivery, CED, porous catheter, Twin Star brain infusion catheter, Parkinson’s disease, porcine model, si-RNA, micro-RNA
1 Introduction
Convection enhanced delivery (CED), or direct controlled injection, was introduced [1] to treat central nervous system (CNS) diseases such as brain cancer or Parkinson’s disease with biological therapeutics that would otherwise not cross the blood-brain barrier (BBB). However, a number of factors including the devices used for delivery, have made it difficult to deliver the desired dose to a delineated target region, and this failure in delivery in turn may have resulted in the failure of pivotal clinical trials [2], [2,3], [4].
The Porous Brain Infusion Catheter (PBIC) was introduced with the expectation of several advantages over end-port catheters as well as then existing multiport catheters. We have studied this type of catheter both theoretically by constructing a mathematical model, as well as experimentally in intra-prostatic infusions, comparing with a needle. The purpose of this study is to compare its performance, for infusions where large volumes of distribution are required, with a catheter design that has also been shown to reduce backflow [5], and which is in extensive use in current clinical trials.
An important need for improved delivery has emerged in recent years with the promise of disease-modifying therapies, such as small interfering RNA (siRNA)-based strategies, for neurodegenerative diseases such as Parkinson’s or Huntington’s. With either direct delivery of these molecules, or through an adeno-associated viral (AAV) carrier, the global delivery of these agents to the brain is very desirable. Other target diseases include vanishing white matter disease (such as adrenal (and other) leukodystrophies), that current “point source” methods of delivery cannot address in a clinically useful way without placement of a large number of catheters. This emphasis on large volumes of distribution brings the delivery problem for neurodegenerative diseases (previously aimed at very focal regions) closer to the problem faced by brain tumor therapeutics delivered intraparenchymally, where distributing large volumes (144 mL and more) in at least the hemisphere of the tumor has been a goal for a number of years [6,7].
The PBIC is intended to be used to deliver therapeutic agents directly into heterogeneous tissue such as brain tumors. Its principal characteristic is to have a length of catheter surface that has many small diameter ports. Intuitively, at a given total rate of infusion of fluid (containing therapeutics in suspension), some of the following advantages may be hypothesized: (i) Faster flow rates should be possible without either backflow or excessive pressure at one place (e.g., the tip of an end-port catheter). This is because the pressure that is needed to drive the fluid in the tissue is distributed over an entire area of efflux. (We note that this pressure if excessive can perhaps damage the tissue or cause deleterious backflow. This pressure is quite distinct from the line pressure that is measured at the pump, which, in the case of most current catheters, almost entirely dominated by the pressure required for the fluid to overcome its viscosity in flowing through the lines and through the internal lumen of the catheter.) It should, however, be mentioned, that the newer generations of catheters with either “step” or “bullet nose” are also quite effective in limiting backflow, though the proposed advantage in lower pressures should continue to hold. (ii) Placement of catheters should not be as critical as for end-port catheters, since sinks, sulci, etc. are bridged, due again to the distribution of the ports and their small size or large resistance, so that the effective resistance to which a fluid particle is subject between the internal lumen and external tissue medium does not vary much with the resistance in the latter medium. We have previously shown this in a mathematical model, in gel experiments and in an in-vivo infusion. (iii) When attempting a large volume distribution, the infusate may be expected to have a cylindrical front, in comparison to a spherical one from an end-port if the backflow is strongly contained. Moreover, the radial outward advance of the front along the length of this cylinder may be expected to be rather uniform for the above reasons. The radius of a cylindrical front will (ideally) spread as the square root of the time of infusion while that of the sphere will go more slowly as the cube root of the time, because at a given flow rate it is the volume delivered that is proportional to the time of infusion. On the other hand, if there is considerable backflow in the end-port catheter, it might be argued that the front will also be roughly cylindrical. However, the pressure along the axis of such a catheter drops away from the tip so that the front is rather tear-drop shaped, and not as uniform as might be hoped for from the porous catheter. Finally, as a corollary of all the above, (iv) a large volume infusion particularly if a catheter trajectory can be found such that a cylindrical front can reach the required boundaries of the infusion within a short distance, should be facilitated and be more uniform by such a catheter. In fact, the very developments in end-port catheter designs that have effectively limited backflow [5], [8], also work against the intended application explored here. We desire a flow to commence from a large initial area for such large volume infusions: an end-port catheter with no backflow is not a priori optimal for such applications, in contrast to say an application where a very small cytoarchitectural region and only such a region (e.g., the subthalamic nucleus) is the desired target.
2 Materials and Methods
Infusion experiments were performed at the University of Virginia. The animal use committee at the University of Virginia approved all protocols (ACUC protocol number 3912). The general methods used for catheter placement and navigation to target have been described in [9], [10].
2.1 Catheters
The SEPC catheter (SmartFlow™, MRI Interventions Inc., Irvine, CA, USA) used in this study is shown in Figure 1A. It has a 3mm length tip with open end port, followed by a step to an 18 mm long central shaft of larger diameter, which then tapers to a 2.1 mm main shaft. The PBIC (Twin Star TDS, Lexington, KY, USA) used in these experiments has a 3-mm diameter and 30 cm total length with a step down to a porous segment of 1.5 mm diameter at the distal end (Figure 1B). Porous segment lengths available range from 1.0 – 5.0 cm. For this study, a length of 1.5 cm was used.
Figure 1.
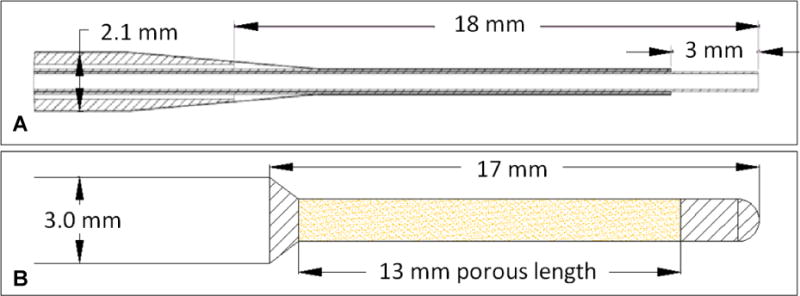
The two catheters (SEPC and PBIC) chosen for the study. The top sketch (A) shows the SEPC catheter dimensions, while the bottom (B) shows the PBIC device used in the comparative study.
2.2 MR contrast agent preparation
The MR reagent used was gadoteridol (ProHance™, Bracco Diagnostics, Monroe, New Jersey), diluted 1:200 with saline solution so that the final infused concentration was 2.5 mM. (This formulation was selected after pilot studies using comparing gadolinium-labeled albumin (Galbumin™, Biopal Inc., Worcester, MA, USA) at a concentration of 100 mg/mL in saline and 1:200 gadoteridol in saline.)
2.3 Magnetic Resonance Imaging
All imaging was conducted with a 3 Tesla Clinical MR scanner (Trio, Siemens, Malvern, PA) at the University of Virginia. High-resolution brain scans were obtained using a large flexible surface coil. A fast 3D IR-prepped gradient echo sequence (MPRAGE, TR = 2300 ms, TI = 900 ms, TE = 4.7 ms, flip angle = 9°, matrix = 192×192, FOV between 185×185 and 200×200 mm depending on animal size, slice thickness = 1.0 mm) was acquired in order to visualize the brain anatomy, plan the catheter placements, and to observe the distribution of gadolinium in the brain. A pair of standard 3D gradient echo sequences were acquired at two different flip angles (6° and 34°) for T1-mapping (3D-FLASH, TR = 21 ms, TE = 4 ms, matrix = 256×224, FOV between 200×175 and 250×218.75 mm, slice thickness = 2.0 mm).
2.4 In-vivo animal infusions
The animals used were two months old Yorkshire pigs weighing 9 – 11 kg. On the day of the infusion, each animal had free access to water for 12 hours before the experiment. Initial sedation was by intramuscular injection of ketamine (25mg/kg) and xylazine (1-2 mg/kg). Anesthesia was maintained by inhalation of isoflurane (≈ 1%) using a ventilator.
Pre-infusion imaging on the anesthetized animal was then performed in a 3 Tesla Clinical MR scanner to characterize the normal brain and plan for the infusions. The images were used to plan trajectories on the MRI console workstation based on the targets planned for the animal. The x-y coordinates for skull burr hole placement were measured relative to the inion.
The anesthetized animal was then placed on a surgical table and the scalp in the midline incised and retracted widely. Burr holes were placed bilaterally in the skull at locations determined by the pre-operative planning. A disposable MR-compatible trajectory guide (Navigus, Medtronic) was installed at each burr hole and secured to the skull using the screws provided. The wound was covered sterilely for repeat imaging and infusion procedures. The animal was then transferred to the MR scanner for targeting, placement of the catheters and infusions.
The animal infusions were in two groups: the first three pigs were used in pilot studies to determine the infusion protocols and details of the PBIC device to be used. The subsequent five animals all had bilateral infusions, with the PBIC placed in one hemisphere and the SEPC placed in the contralateral, both targeting the white matter above the thalamus. Both catheters were infused simultaneously using a ramped infusion protocol: at 5 μL/min for 30 min, then at 10 μL/min for another 30 min, and finally at 15 μL/min for 170 min, to infuse a total of 3 cc of infusate over 230 minutes.
After catheter insertion and prior to infusion, a set of baseline MR images (MPRAGE and 3D FLASH at two flip angles) were acquired. During the infusion, the MPRAGE T1-weighted acquisition was repeated at approximately 8-9 minute intervals. The dual flip angle 3D FLASH T1-mapping sequence was interspersed after approximately 30, 60, 120, 180, and 230 minutes.
Following completion of each infusion study, the animal was euthanized while under general anesthesia by intravenous administration of a combination of pentobarbital sodium and phenytoin sodium (Euthasol, Virbac AH, Inc., Ft. Worth TX).
2.5 Data analysis
The concentration of MR reagents was measured by a method described previously for in vivo infusions [9]. T1 maps were computed from each pair of 3D FLASH acquisitions at flip angles of 6 and 34 degrees using the variable nutation method [11,12]. (These references provide details of the algorithms used to infer accurate concentration maps from the imaging employed.) Gadolinium concentration, C, at each available time point was computed from the T1 maps using the equation 1/T1 = 1/T10 + R1C, where the tracer relaxivity R1 was assumed to be 3.8 L/mmol-sec. Here, T10, T1 are the values before and after the introduction of tracer, respectively.
The volume of distribution, Vd, was estimated as the volume of the voxels with a threshold concentration of at least 0.25 mmol/L of gadolinium tracer. Nearby CSF spaces (ventricle and subarachnoid) were hand segmented from the MPRAGE imaging and excluded from the distribution volume. This distribution volume was used to compute the ratio Vd/Vi, where Vi is the volume of fluid infused. By numerically integrating the concentration over the infusion volume, the total number of molecules, Nd (expressed as moles) that are visible under MR was obtained, and used to compute a ratio of measured to infused amount, Nd/Ni.
3 Results
The first three pigs, as stated, were used to optimize the device and protocol. We commenced with an oblique trajectory of catheter that maximized the length of catheter in tissue (and hence, for the PBIC the area of the porous region across which the infusion could occur). It was noted that the first pig suffered distress, but also that there was a lot of leakage into the CSF spaces from the positioning of the trajectory. In addition, a flow rate increase (ramping) was made every hour. In the second pig, a better trajectory (more oblique) and shorter ramping intervals were employed. It was found that the protocol and leakage into CSF were minimized now, but there was excessive leakage into ventricles. However, the pig suffered distress again. So we went to a shorter more vertical trajectory. This worked well (in Pig 3) so further comparative experiments were done using the optimized protocol and we report in more detail on these results below. No distress was observed throughout the further infusions.
Intra-operative MRI allowed the progression of the infusion to be observed at intervals of about 8 minutes. Coronal sections of the MR imaging acquired at three time points near the start of a typical infusion (animal #7) are shown in Figure 2. The original acquisitions have been re-sliced so that the trajectories of the two catheters are approximately parallel to the image plane, and the slice containing the catheter trajectories is shown. It can be seen from these early time points that the infusion from the PBIC (on the right side in these images) emanates radially from the entire length of the porous region. This uniform spread from the PBIC porous region was observed in all five subjects.
Figure 2.
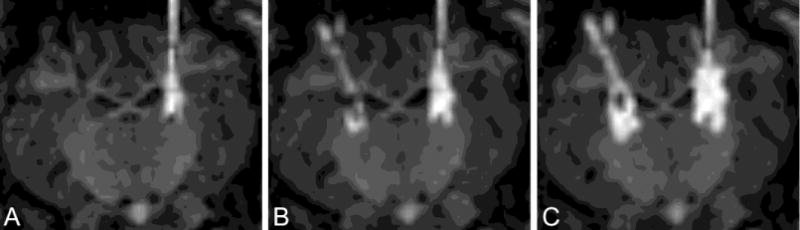
MR acquired at the start of one typical infusion (animal #7). Image A was acquired start of infusion, B after 8 minutes, and C after 26 minutes. SEPC is on the left, PIBC on the right. Images have been re-sliced to a coronal view in which both catheters lie approximately in the image plane.
Coronal sections of the MR imaging acquired at the end of the infusion for each animal are shown in Figure 3. As in Figure 2, the acquisitions have been re-sliced parallel to the catheter trajectories. The computed concentration maps for these sections are co-registered and overlaid on the MR images in the bottom row. The two catheters have been similarly positioned in each case, and both produced large infusions into brain parenchyma with limited backflow out of the tissue. While there are clearly some differences in shapes, it is difficult to tell from any single slice whether there is a measurable difference in performance. In order to compare the distributions over the entire volume of the brain, the volume of infusate distribution and the quantity of measurable tracer was computed for each distribution. The distribution volume is plotted against the infused volume in Figure 4A, and the amount of measured tracer versus the infused amount is displayed Figure 4B. Each line represents the progression of an individual infusion, with solid lines indicating the PBIC and dashed lines indicating the SEPC. In four of the five animals, the plots show greater distribution volume and amount of tracer from the PBIC.
Figure 3.
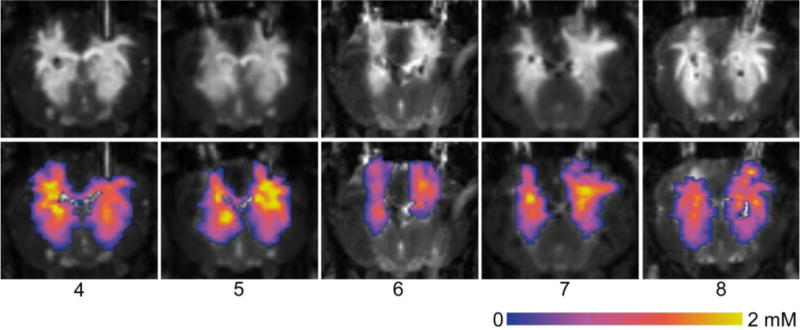
MR acquired at the end of infusion for each animal (#4 - #8). Images have been re-sliced to a coronal view in which both catheters lie approximately in the image plane. The top row shows the MPRAGE T1-weighted imaging. In the bottom row, the computed concentration maps have been overlaid on the images. The SEPC lies on the left and the PBIC on the right in each image.
Figure 4.
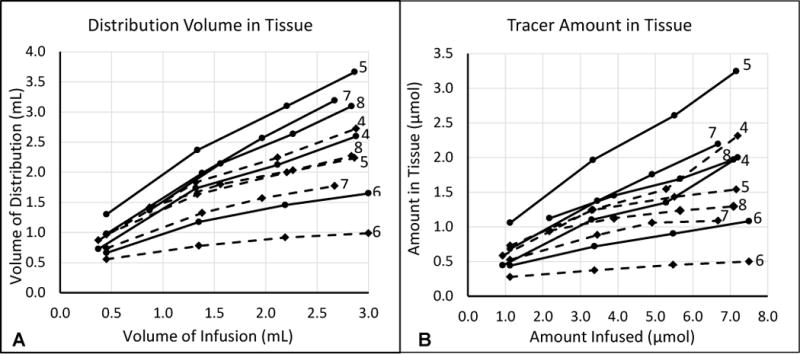
Plots of (A) distribution volume vs infused volume and (B) measured amount of tracer in tissue vs infused amount. Each line represents a single infusion. The solid lines show the measures from the porous catheter (PBIC), and the dashed lines show the measures from the MRII catheter (SEPC). Each line is labelled on the right with the animal number (4 – 8).
It is notable that most of the Vd profiles in Figure 4A show inflection points with subsequent reduction of the Vd growth rate. These points correlate with onset of escape of infusate into the cerebral ventricles and/or the subarachnoid space, with consequent reduction of delivery of infusate into the brain parenchyma. Nevertheless, the growth of infusate Vd continued in most infusions, except for the SEPC infusion in animal #6.
The final volumes and amounts measured for each infusion are compared in Table 1. Since the final measurements are not precisely aligned at the end of the infusion with the same total amount infused, the table shows relative measures, Vd/Vi and Nd/Ni, at the final measurement point. We should note that in all cases shown, the total infused volume and the protocol used remained fixed (as specified above). However, the reason the graphs do not extend to the total infused volume is due to excessive escape of infusate so that measurements within tissue became quite inaccurate. We therefore had to stop the measure of concentration profile at somewhat earlier time points. Even this low volume of 3 cc is about the limit that can be taken by the pig brain in an extended source infusion. The table also compares the slopes of these two relative measures, ΔVd/ΔVi and ΔNd/ΔNi with differences computed from the final two measurements. The slopes give an indication of how well the catheters are delivering additional infusate into tissue at the end of the infusion after the distribution has reached CSF boundaries. Both the final measurements and the slopes were greater from the PBIC catheter in all but one of the animals. Table 1 also contains the summary statistics of the infusions, grouped by catheter type. The means of each of the four measures were all much larger for the PBIC infusions than the SEPC means. However, there was large variance in this small sample size. Each of the measures was compared using a two-tailed paired t-test. are more significant for the distribution volumes than for the amounts of tracer within tissue. The volume measures (final Vd/Vi and its slope ΔVd/ΔVi) showed significance, with p-values of 0.047 and 0.043, respectively. The tracer molar measurements had greater differences in their means, but the SEPC infusions had high variance, yielding p-values of 0.084 for final Nd/Ni and 0.094 for ΔNd/ΔNi.
Table 1.
Comparison of relative volumes (Vd/Vi) and relative amounts (Nd/Ni) of tracer and their slopes (ΔVd/ΔVi and ΔNd/ΔNi) at the end of infusion. The p-values are from two-sided paired t-tests.
| Animal | Vd/Vi | Nd/Ni | Slope Vd | Slope Nd | ||||
|---|---|---|---|---|---|---|---|---|
| SEPC | PIBC | SEPC | PIBC | SEPC | PIBC | SEPC | PIBC | |
| 4 | 0.95 | 0.90 | 0.32 | 0.28 | 0.63 | 0.62 | 0.40 | 0.34 |
| 5 | 0.78 | 1.28 | 0.21 | 0.45 | 0.36 | 0.86 | 0.06 | 0.39 |
| 6 | 0.33 | 0.55 | 0.07 | 0.14 | 0.09 | 0.24 | 0.02 | 0.09 |
| 7 | 0.66 | 1.19 | 0.16 | 0.33 | 0.29 | 0.88 | 0.02 | 0.25 |
| 8 | 0.80 | 1.09 | 0.18 | 0.28 | 0.41 | 0.81 | 0.04 | 0.20 |
| Mean± SD | 0.70±0.23 | 1.00±0.29 | 0.19±0.09 | 0.30±0.11 | 0.36±0.20 | 0.68±0.27 | 0.11±0.16 | 0.25±0.12 |
| p | 0.047 | 0.084 | 0.043 | 0.094 | ||||
4 Conclusions
In-vivo infusions into porcine brain were carried out using two catheters, a porous catheter (PBIC) and a step catheter (SEPC). The average final slopes of the relative distribution volumes demonstrate a significantly greater final growth rate for the PBIC relative to the SEPC. This would argue that the distribution of infusion along the porous component of the PBIC does in fact result in improved continuing parenchymal delivery, even after losses of infusate begin to develop via the lower resistance CSF spaces. While such losses are not expected to occur as early during infusions into the much larger human brain, these findings suggest that the PBIC would be capable of distributing infusate to very large portions of the human brain even after the beginning of leakage of infusate into CSF. Furthermore, the potential consequences of delivery of infusate containing a therapeutic agent into CSF would also need to be considered.
A striking characteristic of these infusions, however, is the low ratio of the distributed to the infused volume. This is a consequence of the relatively large volume of infusion relative to the small size of the porcine brain, which is less than 1/7th the size of a human (average weight 180 gm versus a human’s 1,350). That is, even a total of 3 cc of infusion is enough to reach into the CSF spaces and continue to leak out of the tissue. This small brain size as noted above forced us to reduce the length of the porous region of the catheter to only 15 mm. While porcine brains have served very well in a number of studies that aim to understand infusions and CED [9], [8], [13], their size has proved to be a limitation to this study, the aim of which was to study large volumes of infusions which, in humans, have exceeded 30 cc from one catheter in brain cancer trials [14].
The PBIC was designed with infusions into heterogeneous, large regions in mind, while the SEPC was designed to limit backflow or “reflux”. Even though a “large” mammal was used to test their performance, the porcine brain was small enough that an earlier plan for a longer trajectory (2 cm) for catheter placement within brain parenchyma and larger volume (6 cc) had to be abandoned due to stress to the animal, and a shorter length (1.5 cm) and smaller total infused volume (3 cc over just under 4 hours) were used in the comparative studies. Human brain cancer infusions have used much longer trajectories (though with end port catheters) and much larger infusions at similar flow rates (over 36 - 48 cc per catheter and up to four catheters at an overall flow rate of 2 cc/hour for 3 – 4 days). Within the limitations of the study, both catheters produced significant distributions into brain parenchyma with relatively little loss due to backflow. The PBIC showed statistical significance in improving the distribution volume, and with a Cohen’s d greater than 1, there is likely to be a very significant difference in the total amount of tracer in tissue in a larger sample size. Human studies will be needed to assess its value for significantly larger volume infusions.
Table 2.
Comparison of fraction of contrast delivered to brain tissue.
| Quantity | PBIC (mean ± deviation) |
SEPC (mean ± deviation) |
p-value |
|---|---|---|---|
| Relative Amount in Tissue (Nd/Ni) | 0.3 ± 0.11 | 0.19 ± 0.09 | 0.08 |
| Relative Distribution Volume (Vd/Vi) | 1.02 ± 0.32 | 0.72 ± 0.23 | 0.03 |
| Final slope of Vd/Vi | 0.55 ± 0.23 | 0.32 ± 0.16 | 0.06 |
The p-values are from two-sided t-tests, corresponding to the assumption that there is no a priori reason to favor one device over the other. The difference between the ratios of the volumes and of the amounts of tracer is a result of the variance in the data from different infusions.
Acknowledgments
The studies reported in this paper were supported by research funds from the NIH (Grant # NS084701).
Footnotes
Mike Wilson, Scott Wilson, Rick Odland have a financial interest in the company Twin Star TDS which owns the PBIC used in this study. Twin Star TDS was purchased by Inventx LLC, Minneapolis, MN, USA.
References
- 1.Bobo R, Laske DW, Akbasak A, Morrison PF, Dedrick RL, Oldfield EH. Convection-enhanced delivery of macromolecules in the brain. Proc Natl Acad Sci U S A. 1994;91:2076–2080. doi: 10.1073/pnas.91.6.2076. [DOI] [PMC free article] [PubMed] [Google Scholar]
- 2.Sampson J, Archer GE, Pedain C, Wembacher-Schroder E, Westphal M, Kunwar S, Vogelbaum MA, Coan A, Herndon JE, Raghavan R, Brady ML, Reardon DA, Friedman AH, Friedman HS, Rodriguez-Ponce MI, Chang S, Mittermeyer S, Croteau D, Puri R. Poor drug distribution as a possible explanation for the results of the PRECISE trial. Journal of Neurosurgery. 2010;113:301–309. doi: 10.3171/2009.11.JNS091052. [DOI] [PubMed] [Google Scholar]
- 3.Morrison P, Lonser RR, Oldfield EH. Convective delivery of glial cell line–derived neurotrophic factor in the human putamen. Journal of Neurosurgery. 2007;107:74–83. doi: 10.3171/JNS-07/07/0074. [DOI] [PubMed] [Google Scholar]
- 4.Salvatore M, Ai Y, Fischer B, Zhang AM, Grondin RC, Zhang Z, Gerhardt GA, Gash DM. Point Source Concentration of GDNF May Explain Failure of Phase II Clinical Trial. Experimental Neurology. 2006;202:497–505. doi: 10.1016/j.expneurol.2006.07.015. [DOI] [PubMed] [Google Scholar]
- 5.Krauze M, Saito R, Noble C, Tamas M, Bringas J, Park JW, Berger MS, Bankiewicz K. Reflux-free cannula for convection-enhanced high-speed delivery of therapeutic agents. J Neurosurg. 2005;103:923–929. doi: 10.3171/jns.2005.103.5.0923. [DOI] [PMC free article] [PubMed] [Google Scholar]
- 6.Sampson J, Brady ML, Petry NA, Croteau D, Friedman AH, Friedman HS, Wong T, Bigner DD, Pastan I, Puri RK, Pedain C. Intracerebral infusate distribution by convection-enhanced delivery in humans with malignant gliomas: descriptive effects of target anatomy and catheter positioning. Neurosurgery. 2007;60:ONS89–98. doi: 10.1227/01.NEU.0000249256.09289.5F. discussion ONS98-89. [DOI] [PubMed] [Google Scholar]
- 7.Kunwar S, Chang S, Westphal M, Vogelbaum M, Sampson J, Barnett G, Shaffrey M, Ram Z, Piepmeier J, Prados M, Croteau D, Pedain C, Leland P, Husain SR, Joshi BH, Puri RK. Phase III randomized trial of CED of IL13-PE38QQR vs Gliadel wafers for recurrent glioblastoma. Neuro-Oncology. 2010;12:871–881. doi: 10.1093/neuonc/nop054. [DOI] [PMC free article] [PubMed] [Google Scholar]
- 8.Brady M, Raghavan R, Singh D, Anand PJ, Fleisher AS, Mata J, Broaddus WC, Olbricht WL. In vivo performance of a microfabricated catheter for intraparenchymal delivery. J Neurosci Methods. 2014;229:76–83. doi: 10.1016/j.jneumeth.2014.03.016. [DOI] [PubMed] [Google Scholar]
- 9.Brady M, Raghavan R, Chen Z, Broaddus W. Quantifying fluid infusions and tissue expansion in brain. IEEE Transactions on Biomedical Engineering. 2011;58:2228–2237. doi: 10.1109/TBME.2011.2128869. [DOI] [PubMed] [Google Scholar]
- 10.Emborg M, Joers V, Fisher R, Brunner K, Carter V, Ross C, Raghavan R, Brady M, Raschke J, Kubota K, Alexander A. Intraoperative intracerebral MRI-guided navigation for accurate targeting in nonhuman primates. Cell Transplant. 2010;19:1587–1597. doi: 10.3727/096368910X514323. [DOI] [PMC free article] [PubMed] [Google Scholar]
- 11.Deoni S, Peters TM, Rutt BK. Rapid combined T1 and T mapping using gradient recalled acaquisition in the steady-state. Magnetic Resonance in Medicine. 2003;49:515–526. doi: 10.1002/mrm.10407. [DOI] [PubMed] [Google Scholar]
- 12.Deoni S, Peters TM, Rutt BK. Determination of optimal angles for variable nutation proton magnetic spin-lattice, T1, and spin-spin T2 relaxation times measurement. Magnetic Resonance in Medicine. 2004;51:194–199. doi: 10.1002/mrm.10661. [DOI] [PubMed] [Google Scholar]
- 13.Brady ML, Raghavan R, Block W, Grabow B, Ross C, Kubota K, Alexander A, Emborg ME. The Relation between Catheter Occlusion and Backflow during Intraparenchymal Cerebral Infusions. Stereotactic and Functional Neurosurgery. 2015;93:102–109. doi: 10.1159/000367665. [DOI] [PMC free article] [PubMed] [Google Scholar]
- 14.Sampson J, Brady M, Raghavan R, Mehta AI, Friedman AH, Reardon DA, Petry NA, Barboriak DP, Wong TZ, Zalutsky MR, Lally-Goss D, Bigner DD. Colocalization of gadolinium-diethylene triamine pentaacetic acid with high-molecular-weight molecules after intracerebral convection-enhanced delivery in humans. Neurosurgery. 2011;69:668–676. doi: 10.1227/NEU.0b013e3182181ba8. [DOI] [PMC free article] [PubMed] [Google Scholar]