Text
Hematopoietic stem and progenitor cells (HSPCs) require a specific microenvironment - the hematopoietic niche - which regulates HSPC behaviour1,2. The location of this niche varies across species, but the evolutionary pressures that drive HSPCs to different microenvironments remain unknown. The niche is located in the bone marrow in adult mammals, whereas other locations are used in non-mammalian vertebrates, e.g. the kidney marrow in teleost fish. Here we show that, surprisingly, a melanocyte umbrella above the kidney marrow provides UV-protection to HSPCs in zebrafish. As mutants lacking melanocytes have normal steady state hematopoiesis in standard laboratory conditions, we hypothesized that melanocytes above the stem cell niche protect HSPCs against UV-induced DNA-damage. Indeed, after UV-irradiation unpigmented larvae show higher levels of DNA-damage in HSPCs based on staining for cyclobutane pyrimidine dimers and have reduced numbers of HSPCs based on cmyb expression. The umbrella of melanocytes associated with the hematopoietic niche is highly evolutionarily conserved in aquatic animals, including the sea lamprey, a basal vertebrate. During the transition from an aquatic to a terrestrial environment, HSPCs relocated into the bone marrow, which is protected from UV by the cortical bone around the marrow. Our studies reveal that melanocytes above the hematopoietic niche protect HSPCs from UV-induced DNA-damage in aquatic vertebrates, and suggest that during the transition to terrestrial life, UV-light was an evolutionary pressure affecting the hematopoietic niche location.
Many aspects of the hematopoietic niche have been elucidated3,4. Little is known, however, about the selective pressures during evolution that influenced the location of the niche in such diverse tissues such as the bones in mammals and the kidney in teleost fish. One year after Raymond Schofield’s hypothesis of the existence of a specialized niche for HSPCs in 19785, Edwin Cooper hypothesized that HSPCs evolved to reside in the bone marrow of terrestrial animals to seek protection from ionizing irradiation, with bone then fulfilling the protective role of water6. Although Cooper’s hypothesis is attractive, ionizing irradiation is mostly filtered out by Earth’s atmosphere and there is no direct evidence that HSPCs would be susceptible to DNA-damage by non-ionizing irradiation such as UVB light in vivo and that this vulnerability could determine the location and characteristics of the hematopoietic niche.
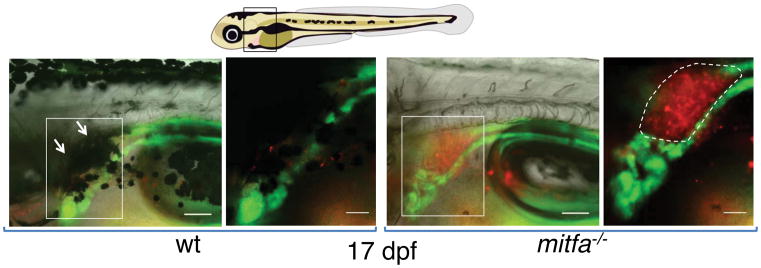
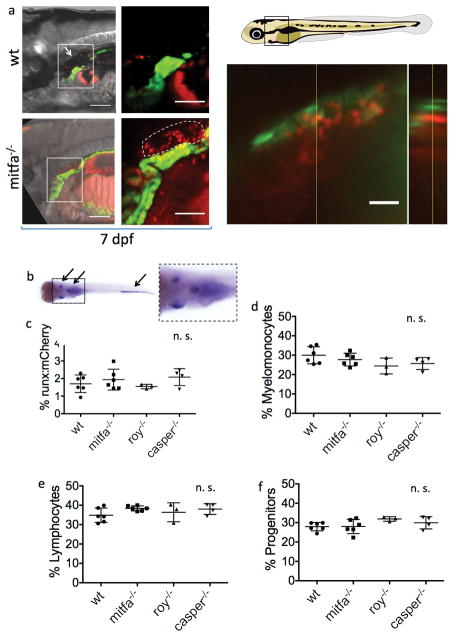
To better understand the definitive hematopoietic niche in zebrafish, we examined HSPCs in their surrounding tissues, using the Tg(runx:mCherry) line that specifically labels HSPCs7. We were intrigued to find that an umbrella of internal melanocytes located dorsal to the kidney marrow obscured visualization of HSPCs throughout development (Fig. 1, left panels, and Extended Data Fig. 1a upper left panels). HSPCs could more easily be observed in nacre mutants, which lack all melanocytes due to a mutation in the transcription factor mitfa (Fig. 1, right panels, and Extended Data Fig. 1a lower left panels; see also Extended Data Table 1). We confirmed the close spatial relationship of melanocytes with kidney HSPCs in larvae carrying the Tg(mitfa:GFP) and Tg(runx:mCherry) transgenes that label melanocytes and HSPCs, respectively (Extended Data Fig. 1a, upper right panel and Supplemental Information Video 1). To determine whether melanocytes serve as classical niche cells that support HSPC homing, expansion or maintenance, we compared HSPC numbers in mitfa−/− larvae and their pigmented siblings at 5 and 7.5 dpf by whole mount in situ hybridization for the expression of cmyb – a transcription factor and master regulator of vertebrate hematopoiesis. These time-points assess the homing of HSPCs into the kidney marrow and the initial expansion therein8. Equivalent numbers of cmyb+ HSPCs were present in pigmented and unpigmented siblings, and all larvae had the same staining intensity in the thymus, kidney and caudal hematopoietic tissue as a representatively stained pigmented larva (Extended Data Fig. 1b). We also evaluated adult hematopoiesis in different pigment deficient fish by analyzing the kidney marrow of 2–6 months old Tg(runx:mCherry) in casper mutants and their pigmented siblings (Extended Data Table 1) by flow cytometry. Neither HSPC abundance nor the relative abundance of blood progenitors, myelomonocytes or lymphocytes were affected by pigment loss (Extended Data Fig. 1c–f). In summary, we conclude that melanocytes are dispensable for steady-state hematopoiesis under laboratory lighting conditions.
Figure 1. Melanocytes are spatially associated with the zebrafish kidney marrow.
Zebrafish positive for Tg(cdh17:GFP) (green, labelling the kidney tubule) and Tg(runx:mcherry) (red, labelling HSPCs) are depicted at 17 dpf. The black-boxed area in the schematic embryo is enlarged in the subsequent brightfield panels. The white-boxed areas are enlarged in the corresponding fluorescent panels to the right, which show the head kidney containing the hematopoietic marrow (indicated by the dashed outline). The white arrows highlight the melanocyte umbrella. Scale bars represent 100 μm and 50 μm in the brightfield and fluorescent panels, respectively.
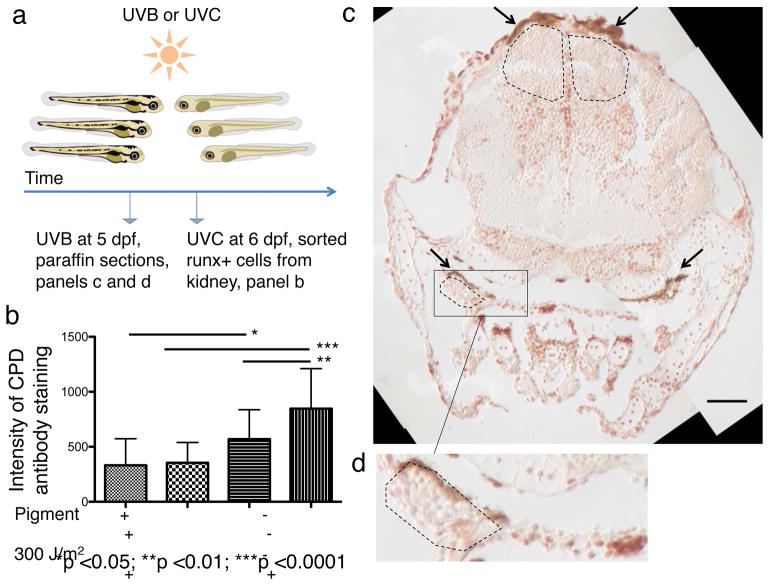
Since melanocytes form an opaque umbrella dorsal to the kidney marrow, we hypothesized that melanocytes shield HSPCs from UV-induced DNA damage, similar to their role in skin. To test this, we irradiated unpigmented mitfa−/− larvae and their pigmented siblings and assayed the most common form of UV-induced DNA damage, cyclobutane pyrimidine dimers (CPDs), in HSPCs. After UVC irradiation, kidney Tg(runx:mCherry)+ HSPCs were immediately isolated by fluorescence-activated cell sorting (FACS) (Fig. 2a) and stained with an antibody that recognizes CPDs. After irradiation HSPCs isolated from unpigmented larvae showed higher levels of DNA-damage than HSPCs isolated from pigmented larvae (Extended Data Fig. 2a); this difference was significant when the fluorescence per cell was quantified (p≤0.01, Fig. 2b). Since UVC-light is usually filtered out by Earth’s atmosphere, we next tested the biologically more relevant UVB-light, which also penetrates well into clear water. We exposed larvae to UVB and performed paraffin sections afterwards to assess the spatial association of melanocytes and CPD+ cells: Only very few CPDs were present directly below the melanocytes compared to the rest of the larva (Fig. 2c) and the thymus, an organ also protected by melanocytes, only showed CPD+ cells in unpigmented larvae (Fig. 2d and Extended Data Fig. 2c), confirming the known protective role of melanocytes against UV light9.
Figure 2. Melanocytes protect HSPCs from UV-induced DNA damage.
(a) Experimental layout. (b) Quantification of immunostain intensity per cell; statistics: ANOVA and post-hoc Bonferroni’s multiple comparison test, data are mean with s.d. (HSPCs from 5 kidneys for each condition; n=45, 33, 16, and 33 isolated cells, respectively); for dot plot see Extended Data Fig. 2b. (c) anti-CPD immunostain of a pigmented irradiated fish (transverse paraffin section). Black arrows indicate melanocytes. Dashed black lines indicate areas below the melanocytes with only few CPD+ nuclei. Scale bar represents 50 μm. (d) Magnification of the indicated area (thymus) in Fig. 2c.
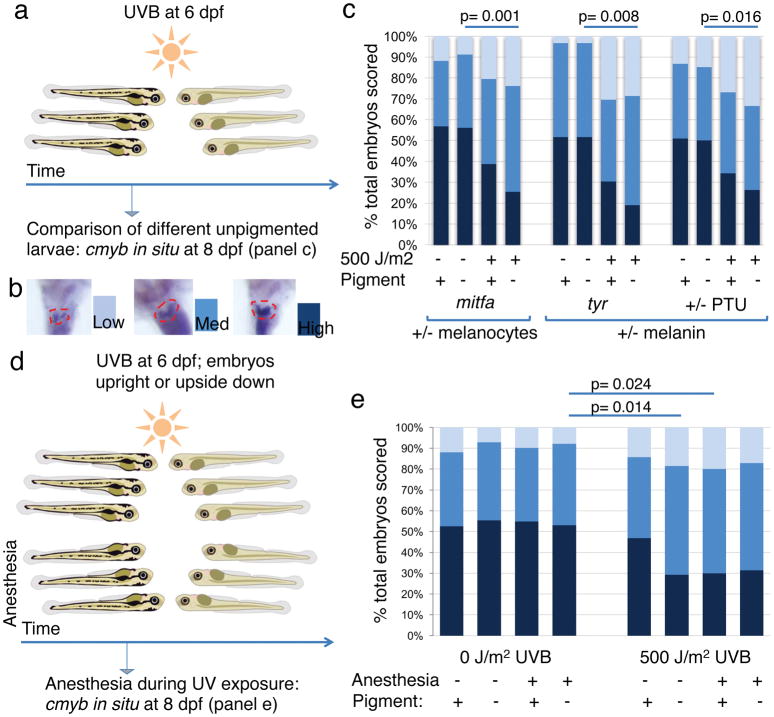
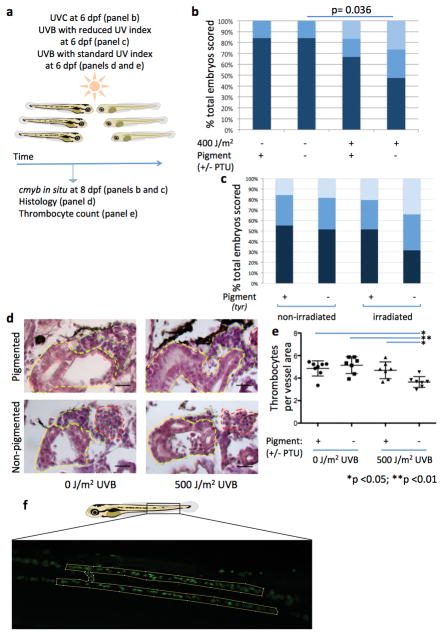
Based on the observation that HSPCs accumulate UV-induced DNA damage in unpigmented larvae, we evaluated the functional effects of UV irradiation on HSPCs in the presence or absence of the melanocyte umbrella by using mitfa−/− mutants and their pigmented siblings (Fig. 3a, b). Two days after UVB irradiation, unpigmented mitfa−/− larvae showed a significant decrease of HSPC numbers as assessed by cmyb staining compared to their non-irradiated siblings (p=0.001), while their pigmented siblings did not have a significant decrease in cmyb staining (Fig. 3c). This was also true in sandy (tyr−/−) mutants and larvae treated with phenylthiourea (PTU) that each have normal melanocyte numbers but cannot synthesize melanin (Extended Data Table 1; Fig. 3c, p=0.008 and p=0.016, respectively). We could replicate this effect with the more damaging UVC in PTU treated larvae as well as in tyr−/− mutants irradiated with the same UVB dose at a lower UV index for a longer period of time (Extended Data Fig. 3a–c). These results indicate that melanocytes containing melanin are required to prevent the detrimental effects on HSPCs caused by exposure to UV in zebrafish larvae.
Figure 3. UV exposure is detrimental to unprotected HSPCs.
(a) Experimental layout. (b) Scoring scheme for cmyb in situ in the zebrafish kidney (dashed red outline). (c) Relative distribution of HSPC abundance in various pigment deficient larvae. n=51, 57, 49, 67, 31, 31, 23, 21, 53, 54, 67, and 57 larvae in the respective stacked bar. (d) Experimental layout for experiment including anesthesia. (e) Relative distribution of HSPC abundance in the different treatment groups. n=59, 56, 51, 64, 49, 65, 50, and 35 larvae in the respective stacked bar. Chi-square test. dpf = days post fertilization.
We next assessed whether the orientation of the melanocyte umbrella was important for its protective function or whether a mechanism independent of optical shielding such as paracrine signalling could be involved. Larvae were anesthetized, causing them to turn on their back, thus moving the otherwise unperturbed umbrella of pigmented melanocytes out of the path of light and exposing the HSPCs to UV-irradiation from the ventral side (Fig. 3d). The cmyb staining in pigmented, anesthetized larvae was reduced to the same level as in unpigmented, non-anesthetized larvae after UVB treatment (Fig. 3e), and both were significantly lower than baseline (p=0.024 and p=0.014, respectively, compared to non-pigmented, non-irradiated, anesthetized). This shows that the orientation of the melanocyte umbrella is critical to prevent damage to HSPCs by UV light and suggests that melanocytes protect HSPCs through a purely optical shielding mechanism.
To confirm the adverse effect of UV light on an unprotected hematopoietic system we examined the cellularity of the kidney marrow and found that it was markedly decreased in non-pigmented, irradiated larvae compared to pigmented, irradiated siblings and non-irradiated controls (Extended Data Fig. 3d). In addition, the numbers of circulating Tg(CD41:GFP)+ thrombocytes was significantly lower in non-pigmented, irradiated larvae than in the other groups (Extended Data Fig. 3e, f), suggesting a reduced output of differentiated blood cells from unprotected HSPCs.
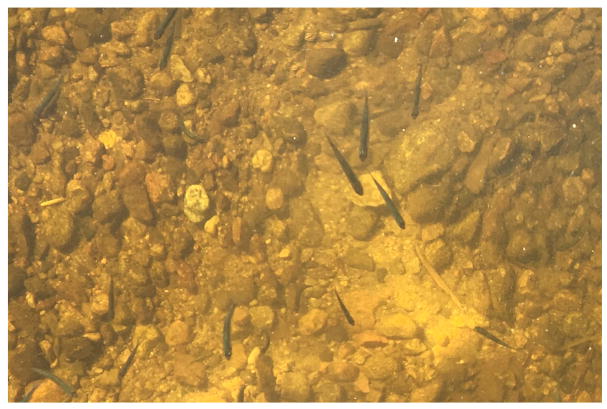
The observed adverse effect of UV light on HSPCs is consistent with earlier in vitro studies showing that much lower UVB doses of 100–200 J/m2 completely abrogated colony forming potential of human HSPCs10. We chose a UVB-dose that corresponds to a sunlight exposure of approximately 10–20 min at UV-indices (a measure of sunlight intensity) of 5–10; this dose corresponds to a UV exposure that would give a fair-skinned person a sunburn. Wild zebrafish are found in rice paddies and small, often clear pools11, and other fish species also swim close to the water surface in midday in clear water (Extended Data Fig. 4). Since UVB penetrates well into clear water12, HSPCs in fish would indeed be exposed to UV light in natural conditions and would thus benefit from an optical protection. Fish have evolved other protective mechanisms against the accumulation of UV-induced DNA damage, such as light-dependent photoenzymatic repair13 and the expression of a sunscreen compound, gadusol14. These findings highlight the importance of coping strategies against UV-induced DNA damage even in aquatic animals.
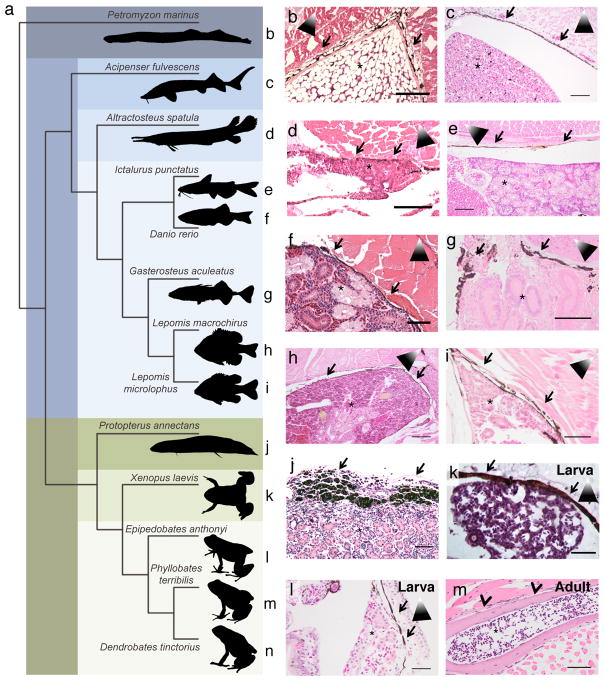
To test whether the protective melanocyte umbrella was specific to zebrafish larvae, we performed comparative histology along the evolutionary tree of fish and other vertebrates (Fig. 4a). The adult zebrafish kidney is covered with melanocytes, which can readily be identified on H&E stained histology slides (Fig. 4f; courtesy of the Zebrafish Atlas). We found that all teleost fish analyzed (Ictalurus punctatus (channel catfish), Gasterosteus aculeatus (stickleback), Lepomis macrochirus (blue gill), and Lepomis microlophus (redear sunfish), Fig. 4e, and g–i) had melanocytes covering the hematopoietic kidney marrow. This was also true in a member of the chondrostei, Acipenser fulvescens (lake sturgeon), and a member of the holostei, Atractosteus spatula (alligator gar) (Fig. 4c, d), that both diverged from teleost species about 250–350 million years ago15,16. Even the ancestral jawless vertebrate Petromyzon marinus at the base of vertebrate lineage (sea lamprey, post metamorphic stage), which diverged approximately 500 million years ago, showed melanocytes around its hematopoietic niche in the supraspinal organ17 (Fig. 4b). In more recently diverged aquatic members of the vertebrate lineage such as the sarcopterygian Protopterus annectans (West African lungfish), melanocytes also covered the kidney marrow (Fig. 4j). In aquatic tetrapod larvae, from the amphibians Xenopus laevis (African clawed frog) and Epipedobates anthonyi (Anthony’s poison arrow frog), a melanocyte umbrella was present above the hematopoietic niche in the liver and kidney, respectively (Fig. 4k, l). It is known that in terrestrial amphibians the adult hematopoietic niche is located in the bone marrow, which we confirmed in Phyllobates terribilis (golden poison frog) (Fig. 4m). Using the anuran amphibian Dendrobates tinctorius (Dyeing poison frog) (Fig. 4n) and analyzing its hematopoietic niche at different developmental time-points from tadpole to froglet (Extended Data Fig. 5a), we were able to show that the transition from a melanocyte-covered niche to the bone marrow occurred when the tadpoles first develop legs while still in an aquatic environment (Extended Data Fig. 5b–f). We then confirmed that cortical bone does indeed provide shielding against UV light by performing an anti-CPD immunostain of a hind leg of the D. tinctorius tadpole depicted in Extended Data Fig. 5e that was exposed to UVB light post mortem (Extended Data Fig. 6). This finding might indicate that the cortical bone around the bone marrow serves as a UV-protective layer in lieu of melanocytes, which might explain why all terrestrial animals have their hematopoietic niche in the bone marrow. Interestingly, some mammals have genetically programmed melanocytes in the spleen18, and these melanocytes might represent an evolutionary remnant of the melanocyte umbrella we discovered in zebrafish. Some frog species such as certain Rana species exhibit shifting sites of haematopoiesis in adulthood with the bone marrow serving as the main and the liver as a minor hematopoietic site19,20. In addition, seasonal variation can be observed in these species, with the liver being more hematopoietic during the winter and the bone marrow during the summer21, which might reflect an adaption to changing UV levels.
Figure 4. Melanocytes are present around the hematopoietic niche of aquatic animals.
(a) Phylogenetic tree based on cytochrome oxidase I sequences. Reference letters correspond between species and respective histology panel. (b to m) H&E staining of hematopoietic tissues. Kidneys were identified by the presence of tubules; hematopoietic activity was inferred by abundance of hematopoietic cells. Arrows indicate the melanocyte layer, arrowheads the cortical bone, asterisks the kidney or bone marrow, shaded triangles the orientation of the animal (kidney sections only; white tip towards dorsal aspect). Scale bars represent 50 μm in (f), (g), (i), and (l); 100 μm in (b) to (e), (h), (k), and m; 200 μm in (j).
We hypothesize that during the evolution of tetrapods, UV light was a selective pressure in HSPC niche location: Larvae in which HSPCs colonized the bone marrow before the transition from aquatic to terrestrial life were at an advantage due to the selective pressures from higher UV levels in terrestrial conditions, although other factors - for example a more hypoxic microenvironment - might have also contributed to this process. Our hypothesis is also consistent with the development of the bone marrow in early sarcopterygians (lobe-finned fish)22 and with the observation that traits of terrestrial animals were often acquired before the transition out of the water23–25. Our studies provide evidence for the hypothesis stated by Edwin Cooper in 19796 as to why HSPCs are located in the bone marrow of terrestrial animals, where they find shelter from harmful irradiation.
Methods
Zebrafish husbandry
Zebrafish maintenance and breeding was performed at 28.5°C with a 14h:10h light:dark cycle26. These standard laboratory conditions do not comprise exposure to UV light. All experiments were performed according to protocols approved by the Institutional Animal Care and Use Committees (IACUC) of Harvard University and Boston Children’s Hospital, or by the Regierungspräsidium Freiburg, and were in accordance with the German laws for animal care.
Frog methods
Epipedobates anthonyi, Phyllobates terribilis and Dendrobates tinctorius were reared in a captive colony. Animals were anesthetized with 20% benzocaine followed by euthanasia by cervical transection. Specimens were then placed in 4% paraformaldehyde. All poison frog protocols were approved by the Institutional Animal Care and Use Committee at Harvard University.
Statistics and Reproducibility
Due to animal welfare regulations in Germany, complete experiments involving zebrafish older than 5 dpf could only be performed once, since repeat experiments are not permissible once a statistically significant result has been obtained. Small-scale pre-experiments have been performed to estimate the effect strength in the assays performed, and the animal experiments were statistically planned and approved by the Regierungspräsidium Freiburg with sufficient numbers of animals to obtain statistically significant results. Confidence in the observed results and their reproducibility is strengthened by an experimental strategy, in which successive experiments not only investigate new biological questions, but are also based on and thus add supportive information to the preceding experiment (e.g. irradiation of different pigment mutants in Fig. 3c, anaesthesia experiment in Fig. 3e, or thrombocyte count in Extended Data Fig. 3e). The experiments in the Figures were performed as follows:
Fig. 1: Imaging experiments were repeated >3 times independently with similar results.
Fig. 2b: The experiment was performed once.
Fig. 2c: The experiment was performed twice with similar results.
Fig. 3c and e: The experiments were performed once.
Fig. 4b–m: Experimental results were confirmed in at least a second animal of the same species (except lungfish due to scarcity of material).
Extended Data Fig. 1: Panel a (and Suppl. Information Video 1): The experiment was performed at least twice with similar results. Panel b: The experiment was performed three times with similar results. Panel c–f: The experiment was performed twice with similar results.
Extended Data Fig. 2: Panel a and b: The experiment was performed once (same experiment as Fig. 2b). Panel c: The experiment was performed twice with similar results.
Extended Data Fig. 3: Panel b: The experiment was performed twice with similar results. Panel c: The experiment was performed once. Panel d–f: The experiments were each performed once (the same larvae were used for the thrombocyte count as in the histology experiments to spare animals).
Extended Data Fig. 4: N/A.
Extended Data Fig. 5: The experiment was performed once due to scarcity of material, but the analyses at different developmental time-points support each other.
Extended Data Fig. 6: The experiment was performed once due to scarcity of material.
Extended Data Fig. 7: N/A.
Experiments were conducted in a blinded fashion, whenever possible. Animals were randomly assigned to treatment and control groups.
Imaging
Using the recently developed transgenic reporter line Tg(Mmu.Runx1:NLS-mCherry)cz2010 (called Tg(runx:mCherry) in the manuscript) labelling HSPCs5, we imaged the location of HSPCs relative to the kidney tubule in a cross with Tg(cdh17:GFP)nz1 27 in zebrafish larvae at different developmental stages and also assessed the spatial relationship with melanocytes, labelled by the transgenic reporter line Tg(mitfa:GFP)w47 28. Fish were anesthetized with 0.168 mg Tricaine/ml egg water for the duration of the procedure and were imaged on a Zeiss CellObserver, Zeiss Examiner, or a Zeiss LSM700 system. For the thrombocyte count, Tg(CD41:GFP)la2 29 larvae where analyzed two days after irradiation by being imaged on a Zeiss Examiner with a 20X objective and a time-lapse of 10 sec was recorded. Afterwards, a z-projection was performed and the circulating thrombocytes were counted and normalized to the area of the vessel (Extended Data Fig. 3f); statistical analysis was performed using ANOVA with post-hoc Bonferroni. Image analysis and processing was performed with ImageJ, ZEN (Zeiss), and PowerPoint (Microsoft).
Flow cytometry
Kidney marrow was isolated from adult wild-type, mitfa−/−, roy−/− and casper−/− fish and analyzed as previously described30. For gating strategy see Supplementary Figure 1.
UVC and UVB irradiation
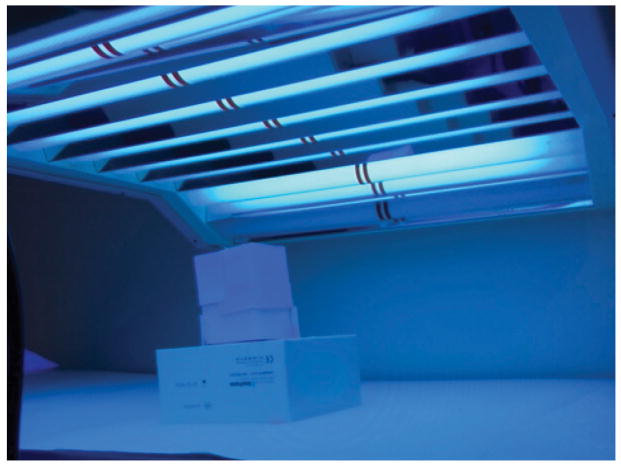
Pigmented and unpigmented larvae were placed in 6 cm petri dishes and egg water was added to a volume of 10 ml. For each irradiation dose, pigmented and unpigmented larvae were placed in the same dish to achieve identical UV exposure in pigmented and unpigmented fish. For UVC irradiation a Stratalinker 1800 (Stratagene) was used, for UVB irradiation an UV 801 BL unit (Waldmann GmbH, Germany) was used. The petri dish was placed in a cardboard container to reduce the amount of UV light reaching the larvae from the side (see experimental setup displayed in Extended Data Fig. 7). The administered dose of UVB corresponded to approximately 10 min at a UV index of 10; both a UV index of 90 for approx. 50 sec (e.g. Fig. 3c, e) as well as a UV index of 20 for approx. 5 min (Extended Data Fig. 3c) led to the same results; of note, even a UV index of 20 is slightly higher than usually encountered in natural conditions. The UV index was measured using a Solarmeter 6.5 (Solar Light Company, Inc.). The dose was also measured with UV-Sensor Variocontrol (Waldmann, Germany) and corresponded to 500 J/m2. Before and after the irradiation, larvae were kept in the dark at 28.5°C until the end of the experiment. After irradiation, larvae were transferred to a 10 cm dish containing 30–40 ml of egg water to maintain good water quality.
PTU treatment
To prevent pigmentation in wild-type TU embryos, embryos were treated with 150 μM 1-phenyl 2-thiourea (PTU; Sigma) at 24 hpf, a slightly reduced dose of PTU that consistently gave very good results31. To avoid interaction of PTU with the UV light, PTU was washed off and the embryo medium was replaced 12 hours before irradiation.
Anesthesia
To move the melanocytes out of the path of light, larvae were anesthetized immediately prior to the irradiation. Tricaine was added to the 6 cm petri dish at a final concentration of 0.168 mg Tricaine/ml egg water. After irradiation, Tricaine was immediately washed off and replaced with egg water.
FACS and anti-CPD antibody staining
Staining of single Tg(runx:mCherry)+ cells for UV induced DNA damage was performed according to a protocol adapted from Ema et al32. Immediately after UV irradiation, larvae were euthanized in Tricaine and transferred to ice water. The tails of the larvae were removed behind the swim-bladder and discarded, since only HSPCs in the kidney were of interest. 5 larval heads were pooled according to their pigment status, incubated with liberase at 37°C for 20 min in the dark. FBS was added to reach 10% to inhibit further digestion and larvae were dissociated by pipetting up and down. Debris was removed by pipetting through a 40 μm mesh filter. 10% formaldehyde was added to reach a 4% final concentration and cells were fixed for 10 min at room temperature. Afterwards, cells were spun down at 500 g for 5 min at 4°C and washed with PBS twice. Cells were sorted onto SuperFrost slides with attached 8-well silicone insulators containing 70–100 μl ultrapure water using a FACSAria (HSCRB FACS Core) with the 355 nm laser turned off. Slides were dried at room temperature, then put in an oven at approximately 70°C for 10 min. Slides were kept in a humidified chamber for the following steps. Cells were washed with PBS, incubated with PBS with 0.5% Triton X for 20 min, washed with PBS, DNA was denatured with 2 M HCl for 30 min at room temperature, washed with PBS, blocked with 10% NGS for 60 min, and incubated with the anti-CPD antibody TDM-2 (Cosmo Bio Co) at 1:500 in 2% NGS overnight at 4°C. The next day, cells were washed with PBS and kept in the dark for the subsequent steps. A goat anti-mouse antibody linked to AlexaFluor 488 (Invitrogen) at 1:500 in 2% NGS for 30 min at room temperature. Cells were washed with PBS, followed by incubation with 0.05 μg/ml DAPI in PBS for 5 min and washed again with PBS. Slides were analyzed on a CellObserver (Zeiss, Germany), mean fluorescence of each cell was measured, statistical analysis was performed using GraphPad Prism 5 software using a one-way ANOVA with a post-hoc Bonferroni’s multiple comparison test.
Paraffin sections
Directly after irradiation, larvae were euthanized in Tricaine followed by fixation in 4% formaldehyde. Larvae were embedded in paraffin wax, sectioned at 5–7 μm and immunohistochemistry was performed as described above with an additional proteinase K digestion step. The secondary biotinylated anti-mouse (Vector Lab) (1:200) was used followed by signal detection with VECTASTAIN ABC HRP Kit (Vector Lab).
Whole mount in situ hybridization (WISH)
WISH was performed as previously described33 with the addition of 0.2% glutaraldehyde to the 4% fixation step after permeabilization with proteinase K. The cmyb probe was used at 400 ng/ml. Staining with BCIP and NBT took approximately 4–6 h. Statistical analysis was performed using GraphPad Prism 5 software utilizing the Chi-Square-Test.
Histology
Fish specimens were euthanized and fixed in 4% formaldehyde for at least 24 hpf at 4°C. After fixation, samples were transferred to 70% ethanol and stored at 4°C until further processing. Samples were decalcified and afterwards embedded in paraffin wax. After hardening, samples were cut at a thickness of 4–10 μm on a microtome, transferred to charged glass slides and stained with hematoxylin and eosin and covered with a coverslip afterwards. The zebrafish histology slide (Figure 4f) was acquired from the Zebrafish Histology Atlas (http://bio-atlas.psu.edu/zf/view.php?s=250&atlas=18&z=1&c=9774,7525).
Data availability statement
The data that support the findings of this study are available from the corresponding author upon reasonable request. Source data for Figures 2 and 3 as well as Extended Data Figures 1, 2, 3, and 6 are provided with the paper.
Extended Data
Extended Data Figure 1. Melanocytes are spatially associated with the zebrafish kidney but dispensable for steady state hematopoiesis.
(a) Left panels: Zebrafish positive for Tg(cdh17:GFP) (green, labelling the kidney tubule) and Tg(runx:mcherry) (red, labelling HSPCs) are depicted at 7 dpf. The white-boxed areas are enlarged in the corresponding fluorescent panels to the right, which show the head kidney containing the hematopoietic marrow (indicated by the dashed outline). The white arrows highlight the melanocyte umbrella. Scale bars represent 100 μm and 50 μm in the brightfield and fluorescent panels, respectively. Upper right panel: The kidney marrow of a 6 dpf larva positive for Tg(mitfa:GFP) (green, labelling melanocytes) and Tg(runx:mcherry) (red, labelling HSPCs) is shown from a lateral view (left panel). The right panel shows an orthogonal view (transverse section). The scale bar represents 20 μm. Lower right panel: The black-boxed area in the schematic embryo on the lower right is enlarged in the brightfield panels to the left as well as the fluorescent panel on the upper right. (b) Whole mount in situ for cmyb at different time points, a representative larva at 5 dpf is shown. Arrows indicate - from cranial to caudal - the thymus, the kidney and the caudal hematopoietic tissue; the enlarged portion of the image (dashed boxes) shows the thymus and the kidney. The experiment was performed with n=10 wt, 10 mitfa−/− larvae at 5 dpf, and 10 wt, 7 mitfa−/− larvae at 7,5 dpf. (c) Flow cytometric analysis of the percentage of Tg(runx:mCherry) positive HSPCs as a proportion of live cells in the kidney marrow of adult fish. Data are mean (s.d.). n.s. = not significant. (d)–(f) Relative abundance of progenitors, myelomonocytes and lymphocytes in adult wild-type fish and mitfa, roy−/− and casper−/− pigment mutants as assessed by flow cytometry as previously described30. (c)–(f): n=6 wt, 6 mitfa−/−, 3 roy−/−, and 4 casper−/− fish, respectively. ANOVA, data are mean with s.d..
Extended Data Figure 2. Unprotected hematopoietic cells accumulate DNA-damage after UV irradiation.
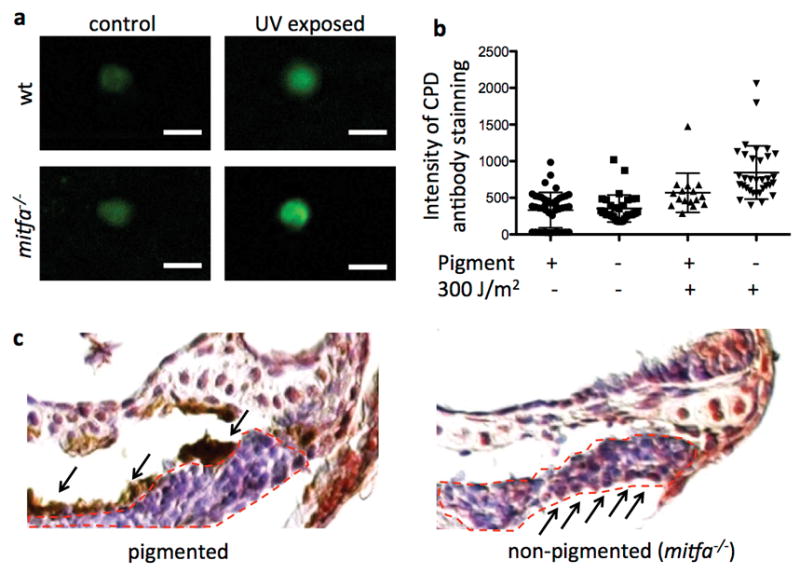
(a) Sorted Tg(runx:mCherry)+ cells after anti-CPD immunostain. Scale bars represent 10 μm. (b) Dot plot representation of data in Fig. 2b (quantification of immunostain intensity per cell), data are mean with s.d.; for statistics and p-values please refer to Fig. 2b. (c) Magnification of the thymus (dashed red outline) after anti-CPD immunostaining (counterstain with hemalum) after UVB irradiation at 5 dpf in pigmented and non-pigmented larvae, respectively; arrows from above indicate the melanocyte, arrows from below indicate examples of nuclei with DNA damage.
Extended Data Figure 3. UV light is detrimental to exposed hematopoiesis.
(a) Experimental layout. (b) Reduction of HSPCs in larvae with and without PTU-treatment as assessed by cmyb in situ after UVC irradiation. n=26, 26, 24, and 19 larvae in the respective stacked bar. Chi-square test. (c) Reduction of HSPCs in tyr−/− larvae and their pigmented siblings as assessed by cmyb in situ after UVB irradiation at a UV index of 20. n=38, 33, 29, and 38 larvae in the respective stacked bar. Results were not significant but notice that the pigmented irradiated group seemed to retain more HSPCs in this experiment than in the preceding experiments with a higher UV index. (d) Histology of the kidney marrow 2 days post irradiation. The yellow dashed outline represents the kidney tubules, the red the aorta and the green the hematopoietic marrow. Note the reduced area of the hematopoietic marrow in the non-pigmented, irradiated larvae (lower right panel). The scale bars represent 20 μm. (e) Abundance of Tg(CD41:GFP)+ thrombocytes 2 days after irradiation. Each data point represents thrombocyte numbers per vessel area individual larva. n= 8, 7, 7, and 7 larvae for treatment groups, respectively. Statistical significance was calculated with ANOVA and post-hoc Bonferroni’s multiple comparison test, data are mean with s.d. (f) Schematic of the analysis of the number of Tg(CD41:GFP)+ thrombocytes. The boxed area represents the analyzed area, in which the circulating cells were counted. The yellow outline represents the area of the vessel, which the number of circulating thrombocytes was normalized to. dpf= days post fertilization.
Extended Data Figure 4. Sunlight exposure in fish living in the wild.
Example of small fish swimming in clear and shallow water on a sunny day (photo taken at Titisee, Germany, July 2016). Field of view approximately 25–30 cm wide.
Extended Data Figure 5. HSPCs relocated into the bone marrow before the transition to a terrestrial environment.
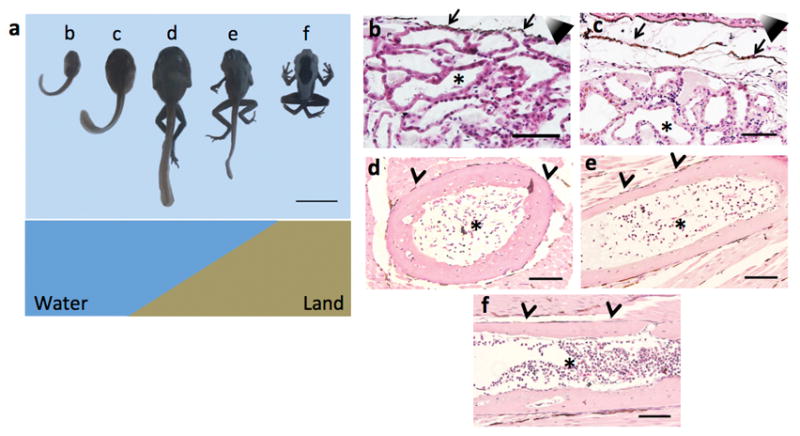
(a) The upper panel shows a developmental time-line of Dendrobates tinctorius; tadpoles were staged according to Gosner34. Animals (from left to right) represent Gosner stage 25, 30, 41, and 42 respectively, as well as a froglet 5 days after losing its tail. Each animal has a reference letter, which is referred to in the histology panels. The lower panel indicates the habitat of Dendrobates tinctorius at the different developmental stages. (b to f) Hematopoietic niches analyzed by H&E staining. Scale bar represents 100 μm in panels b to f and 1 cm in panel a.
Extended Data Figure 6. Cortical bone protects from UV induced DNA-damage.
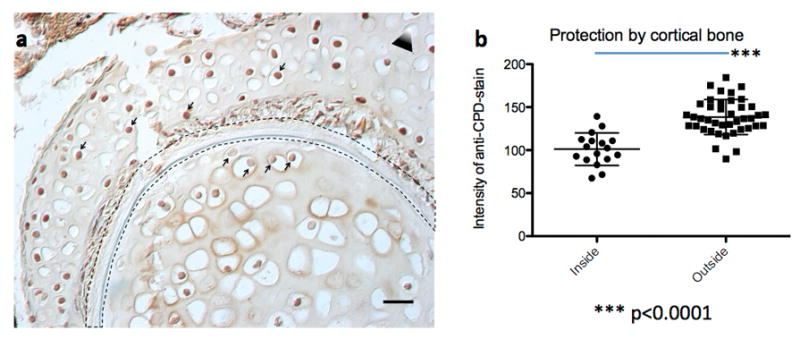
(a) Paraffin section of a Dendrobates tinctorius hind leg (from Extended Data Fig. 5a, specimen e) after irradiation with UVB post mortem; the leg was severed from the body and irradiated with UVB. The black dashed outlined represents the cortical bone. Notice the higher staining intensity of the anti-CPD antibody in nuclei within the muscle tissue compared to nuclei within the bone marrow. This part of the leg is not yet hematopoietic (compare to Extended Data Fig. 5e, which shows the hematopoietic marrow in the other leg) but contains chondrocytes. Notice that even the chondrocyte nuclei closest to the cortical bone are stained much less than the cells outside the cortical bone (arrows from below and from above, respectively). The triangle represents the direction of the UV source; white tip towards UV source. The scale bar represents 50 μm. (b) Quantification of grey scale values of nuclei inside (n=17) and outside (n=41) the cortical bone; each data point represents the mean grey value of a 16×16 pixel circle inside the nucleus, the difference is highly significant (unpaired two-tailed t-test, p<0.0001); data are mean with s.d..
Extended Data Figure 7. Experimental setup during irradiation.
Fish were placed in a petri dish inside the upper cardboard box to focus the light from above, since the Waldmann UV 801 BL unit has a curved lamp carrier. The lower cardboard box was used to place the larvae at the recommended distance from the lamps.
Extended Data Table 1.
List of causes for lack of pigmentation
| Unpigmented because of | Name | Mechanism |
|---|---|---|
| Chemical treatment | 1-phenyl 2-thiourea (PTU) | Blocking of the enzyme tyrosinase29 → melanocytes do not contain melanin |
| Genetic cause | nacre (mitfaw2) | Mutation in the transcription factor mitfa32 → melanocytes are absent |
| sandy (tyrtk20) | Mutation in the enzyme Tyrosinase33 → melanocytes do not contain melanin |
|
| roy (mpv17a9) | Mutation in the mpv17 mitochondrial inner membrane protein34 → iridophores are absent |
|
| casper (mitfaw2/w2; mpv17a9/a9) | double homozygous for nacre and roy34 → melanocytes and iridophores are absent |
Supplementary Material
Acknowledgments
We thank Doug Richardson at the Harvard Center for Biological Imaging for infrastructure and support. We thank Cathy MacGillivray at the HSCRB Histology Core and Joyce LaVecchio at the HSCRB Flow Cytometry Core for technical assistance. We thank Elisabeth van Italie in Marc Kirschner’s lab and Jennifer Cech in Catherine Peichel’s lab for generously providing Xenopus and stickleback samples. We thank the Zebrafish Atlas (http://zfatlas.psu.edu/, NIH grant R24 RR017441, Jake Gittlen Cancer Research Foundation, and PA Tobacco Settlement Fund) for provision of the adult zebrafish histology image. Any use of trade, product, or firm names is for descriptive purposes only and does not imply endorsement by the U.S. Government. This work was supported by HHMI and NIH grants 5P01 CA163222, R01 HL048801, P01 HL032262, U54 DK110805-01, R01 DK053298, U01 HL100001-05, and R24 DK092760 to L.I.Z.. D.E.F. acknowledges grant support from NIH (5P01 CA163222 and 2R01 AR043369) and the Dr. Miri and Sheldon G. Adelson Medical Research Foundation. E.J.H. was supported by 1K01DK111790-01. Further support came from the German Research Foundation (DFG-SFB850-A1, to W.D.) and the Excellence Initiative of the German Federal and State Governments (Centre for Biological Signalling Studies EXC 294, to WD). F.G.K. was supported by a postdoctoral fellowship of the German Cancer Aid (70110820), a return scholarship of the Forschungskommission, Faculty of Medicine, University of Freiburg, and an EXCEL-Fellowship of the Faculty of Medicine, University of Freiburg, funded by the Else-Kröner-Fresenius-Stiftung. N.S.J. was supported by the Great Lakes Fishery Commission. E.T. was supported by funding from Max Planck Gesellschaft and a Marie Curie Career Integration grant (631432), a Fritz Thyssen Stiftung and the DFG founded Research Training Group GRK2344 “MeInBio – BioInMe”. L.A.O. was supported by a Bauer Fellowship from Harvard University. J.M.G. was supported by T32 training grants (T32CA009172-39 and T32HL116324-03).
Footnotes
Online Content Methods, along with any additional Extended Data display items and Source Data, are available in the online version of the paper; references unique to these sections appear only in the online paper.
Supplementary Information is linked to the online version of the paper at www.nature.com/nature.
Author Contributions F.K.G. planned, executed or analyzed all the experiments. F.G.K. and L.I.Z. wrote the manuscript with the input of all authors. J.R.P. and E.T. helped with a subset of in situ experiments, J.M.G. with flow cytometry, E.J.H. with a subset of imaging experiments, and L.A.O. created the phylogenetic tree as well as the animal drawings. D.S., L.A.O., N.S.J., C.A. and U.W. provided essential materials and samples for the manuscript. W.D., C.M.N., D.E.F. and L.I.Z. supervised the project and gave input for experimental design. All authors discussed the results and commented on the manuscript.
The authors declare competing financial interests: details are available in the online version of the paper.
Readers are welcome to comment on the online version of the paper.
References and Notes
- 1.Ding L, Morrison SJ. Haematopoietic stem cells and early lymphoid progenitors occupy distinct bone marrow niches. Nature. 2013;495:231–235. doi: 10.1038/nature11885. [DOI] [PMC free article] [PubMed] [Google Scholar]
- 2.Kunisaki Y, et al. Arteriolar niches maintain haematopoietic stem cell quiescence. Nature. 2013 doi: 10.1038/nature12612. [DOI] [PMC free article] [PubMed] [Google Scholar]
- 3.Acar M, et al. Deep imaging of bone marrow shows non-dividing stem cells are mainly perisinusoidal. Nature. 2015;526:126–130. doi: 10.1038/nature15250. [DOI] [PMC free article] [PubMed] [Google Scholar]
- 4.Chen JY, et al. Hoxb5 marks long-term haematopoietic stem cells and reveals a homogenous perivascular niche. Nature. 2016;530:223–227. doi: 10.1038/nature16943. [DOI] [PMC free article] [PubMed] [Google Scholar]
- 5.Schofield R. The relationship between the spleen colony-forming cell and the haemopoietic stem cell. Blood Cells. 1978;4:7–25. [PubMed] [Google Scholar]
- 6.Horton JD. Development and differentiation of vertebrate lymphocytes: Review of the Durham symposium — September 1979. Dev Comp Immunol. 1980;4:177–181. [Google Scholar]
- 7.Tamplin OJ, et al. Hematopoietic Stem Cell Arrival Triggers Dynamic Remodeling of the Perivascular Niche. Cell. 2015;160:241–252. doi: 10.1016/j.cell.2014.12.032. [DOI] [PMC free article] [PubMed] [Google Scholar]
- 8.Murayama E, et al. Tracing Hematopoietic Precursor Migration to Successive Hematopoietic Organs during Zebrafish Development. Immunity. 2006;25:963–975. doi: 10.1016/j.immuni.2006.10.015. [DOI] [PubMed] [Google Scholar]
- 9.Kaidbey KH, Agin PP, Sayre RM, Kligman AM. Photoprotection by melanin--a comparison of black and Caucasian skin. J Am Acad Dermatol. 1979;1:249–260. doi: 10.1016/s0190-9622(79)70018-1. [DOI] [PubMed] [Google Scholar]
- 10.Azuma H, et al. Comparison of sensitivity to ultraviolet B irradiation between human lymphocytes and hematopoietic stem cells. Blood. 2000;96:2632–2634. [PubMed] [Google Scholar]
- 11.Engeszer RE, Patterson LB, Rao AA, Parichy DM. Zebrafish in The Wild: A Review of Natural History And New Notes from The Field. Zebrafish. 2007;4:21–40. doi: 10.1089/zeb.2006.9997. [DOI] [PubMed] [Google Scholar]
- 12.Tedetti M, et al. High penetration of ultraviolet radiation in the south east Pacific waters. Geophys Res Lett. 2007;34:L12610. [Google Scholar]
- 13.Mitchell DL, Meador JA, Byrom M, Walter RB. Resolution of UV-induced DNA damage in Xiphophorus fishes. Mar Biotechnol N Y N. 2001;3:S61–71. doi: 10.1007/s101260000000. [DOI] [PubMed] [Google Scholar]
- 14.Osborn AR, et al. De novo synthesis of a sunscreen compound in vertebrates. eLife. 2015;4:e05919. doi: 10.7554/eLife.05919. [DOI] [PMC free article] [PubMed] [Google Scholar]
- 15.Volff JN. Genome evolution and biodiversity in teleost fish. Heredity. 2005;94:280–294. doi: 10.1038/sj.hdy.6800635. [DOI] [PubMed] [Google Scholar]
- 16.Hurley IA, et al. A new time-scale for ray-finned fish evolution. Proc R Soc Lond B Biol Sci. 2007;274:489–498. doi: 10.1098/rspb.2006.3749. [DOI] [PMC free article] [PubMed] [Google Scholar]
- 17.Amemiya C, Saha N, Zapata A. Evolution and development of immunological structures in the lamprey. Curr Opin Immunol. 2007;19:535–541. doi: 10.1016/j.coi.2007.08.003. [DOI] [PMC free article] [PubMed] [Google Scholar]
- 18.Weissman I. Genetic and Histochemical Studies on Mouse Spleen Black Spots. Nature. 1967;215:315–315. doi: 10.1038/215315a0. [DOI] [PubMed] [Google Scholar]
- 19.de Abreu Manso PP, de Brito-Gitirana L, Pelajo-Machado M. Localization of hematopoietic cells in the bullfrog (Lithobates catesbeianus) Cell Tissue Res. 2009;337:301–312. doi: 10.1007/s00441-009-0803-0. [DOI] [PubMed] [Google Scholar]
- 20.Akiyoshi H, Inoue AM. Comparative histological study of hepatic architecture in the three orders amphibian livers. Comp Hepatol. 2012;11:2. doi: 10.1186/1476-5926-11-2. [DOI] [PMC free article] [PubMed] [Google Scholar]
- 21.Maslova MN, Tavrovskaia TV. The seasonal dynamics of erythropoiesis in the frog Rana temporaria. Zh Evol Biokhim Fiziol. 1993;29:211–214. [PubMed] [Google Scholar]
- 22.Sanchez S, Tafforeau P, Ahlberg PE. The humerus of Eusthenopteron: a puzzling organization presaging the establishment of tetrapod limb bone marrow. Proc R Soc B Biol Sci. 2014;281:20140299–20140299. doi: 10.1098/rspb.2014.0299. [DOI] [PMC free article] [PubMed] [Google Scholar]
- 23.NiedŸwiedzki G, Szrek P, Narkiewicz K, Narkiewicz M, Ahlberg PE. Tetrapod trackways from the early Middle Devonian period of Poland. Nature. 2010;463:43–48. doi: 10.1038/nature08623. [DOI] [PubMed] [Google Scholar]
- 24.Markey MJ, Marshall CR. Terrestrial-style feeding in a very early aquatic tetrapod is supported by evidence from experimental analysis of suture morphology. Proc Natl Acad Sci. 2007;104:7134–7138. doi: 10.1073/pnas.0701706104. [DOI] [PMC free article] [PubMed] [Google Scholar]
- 25.MacIver MA, Schmitz L, Mugan U, Murphey TD, Mobley CD. Massive increase in visual range preceded the origin of terrestrial vertebrates. Proc Natl Acad Sci. 2017;114:E2375–E2384. doi: 10.1073/pnas.1615563114. [DOI] [PMC free article] [PubMed] [Google Scholar]
References in the Extended Data
- 26.Westerfield M. The Zebrafish Book (Danio rerio) A guide for the laboratory use of Zebrafish. Institute of Neuroscience University of Oregon; 2000. [Google Scholar]
- 27.Diep CQ, et al. Identification of adult nephron progenitors capable of kidney regeneration in zebrafish. Nature. 2011;470:95–100. doi: 10.1038/nature09669. [DOI] [PMC free article] [PubMed] [Google Scholar]
- 28.Curran K, Raible DW, Lister JA. Foxd3 controls melanophore specification in the zebrafish neural crest by regulation of Mitf. Dev Biol. 2009;332:408–417. doi: 10.1016/j.ydbio.2009.06.010. [DOI] [PMC free article] [PubMed] [Google Scholar]
- 29.Lin HF, et al. Analysis of thrombocyte development in CD41-GFP transgenic zebrafish. Blood. 2005;106:3803–3810. doi: 10.1182/blood-2005-01-0179. [DOI] [PMC free article] [PubMed] [Google Scholar]
- 30.Traver D, et al. Transplantation and in vivo imaging of multilineage engraftment in zebrafish bloodless mutants. Nat Immunol. 2003;4:1238–1246. doi: 10.1038/ni1007. [DOI] [PubMed] [Google Scholar]
- 31.Karlsson J, von Hofsten J, Olsson PE. Generating transparent zebrafish: a refined method to improve detection of gene expression during embryonic development. Mar Biotechnol N Y N. 2001;3:522–527. doi: 10.1007/s1012601-0053-4. [DOI] [PubMed] [Google Scholar]
- 32.Ema H, et al. Adult mouse hematopoietic stem cells: purification and single-cell assays. Nat Protoc. 2006;1:2979–2987. doi: 10.1038/nprot.2006.447. [DOI] [PubMed] [Google Scholar]
- 33.Thisse C, Thisse B. High-resolution in situ hybridization to whole-mount zebrafish embryos. Nat Protoc. 2008;3:59–69. doi: 10.1038/nprot.2007.514. [DOI] [PubMed] [Google Scholar]
- 34.Gosner KL. A Simplified Table for Staging Anuran Embryos and Larvae with Notes on Identification. Herpetologica. 1960;16:183–190. [Google Scholar]
Associated Data
This section collects any data citations, data availability statements, or supplementary materials included in this article.
Supplementary Materials
Data Availability Statement
The data that support the findings of this study are available from the corresponding author upon reasonable request. Source data for Figures 2 and 3 as well as Extended Data Figures 1, 2, 3, and 6 are provided with the paper.


