

Abstract
When harvested, oysters represent a removal from the ecosystem of nutrients such as nitrogen (N) and carbon (C). A number of factors potentially affect nutrient content, but a quantitative understanding across the geographic range of the eastern oysters is lacking. The present study was designed to quantify the relationships among various metrics of farmed eastern oysters near its northern geographic range focusing on nutrient content. Hatchery-reared oysters were deployed in polyethylene bags at six sites, and were measured on multiple occasions from 2010-2012. A quadratic polynomial fit to the combined datasets for shell height indicated that on average a ‘cocktail’ size oyster (63 mm shell height) would be reached after 2 yr, and ‘regular’ size (76 mm) would require 3 yr. There were significant differences in growth rates and oyster nutrient content among the sites; means for %N in soft tissue ranged from 6.9 to 8.6, and 0.07 to 0.18 in shell. Percent N in soft tissue and shell were highest at two sites at the mouths of rivers with elevated dissolved inorganic N concentrations in the water. Grand means (all sites, seasons and years combined) of soft tissue N and C for regular size oysters were 7.3% and 38.5%, respectively; and for shell N and C were 0.13% and 12.0%, respectively. Our study extends the range of data on nutrient content of the eastern oyster to northern New England, and indicates that oyster size, seasonality, and nutrient concentration in ambient water potentially affect %N and %C content of oysters.
Keywords: shellfish aquaculture, nutrient assimilation, bioextraction, eutrophication, water quality
Introduction
Eutrophication of coastal waters and estuaries persists as a global problem (Boesch 2002; Bricker, Wicks & Woerner 2008; Kroeze, Hofstra, Ivens, Löhr, Strokal & van Wijnen 2013). Management of nutrients such as nitrogen (N) and phosphorus (P) that contribute to eutrophication typically has focused on control of land-based sources. Recent research, however, has begun to quantify the potential of bivalve shellfish aquaculture as a nutrient management tool (Bricker, Rice & Bricker 2014; Rose, Bricker, Tedesco & Wikfors 2014; Saurel, Ferreira, Cheney, Suhrbier, Dewey, Davis & Cordell 2014). Suspension-feeding bivalves such as oysters and mussels remove suspended particulates and associated nutrients from the water as they feed, and when harvested represent a direct removal of the assimilated nutrients from the ecosystem (Hammer 1996; Newell 2004; Lindahl, Hart, Hernroth, Kollberg, Loo, Olrog and Rehnstam-Holm 2005; Ferreira, Hawkins & Bricker 2007; Burkholder & Shumway 2011; Coen, Dumbauld & Judge 2011; Ferreira, Hawkins & Bricker 2011, Higgins, Stephenson & Brown 2011; Carmichael, Walton & Clark 2012b; Pollack, Yoskowitz, Hae-Cheol & Montagna 2013). Farmed (and wild) bivalves also potentially cause nutrient removal by enhancing burial in sediments, and in the case of nitrogen, increased denitrification rates (Newell, Fisher, Holyoke & Cornwell 2005; Pietros & Rice 2009; Carmichael et al. 2012b; Hollein & Zarnoch 2014; Hollein, Zarnoch & Grizzle 2015).
In the mid-Atlantic and northeastern US, eastern oyster (Crassostrea virginica) aquaculture is a rapidly growing industry and recent research has begun to quantify the potential role oyster farming might play in nutrient management (Newell & Mann 2012; STAC, 2013; Kellogg, et al. 2014; Rose et al. 2014). In the Great Bay Estuary where the present study was conducted, the major nutrient of concern is N (PREP 2013), and research is underway to assess the role oyster farming might play in its management.
Estimates of nutrient removal by farmed oysters are based on the nutrient content of individual oysters. The meager but growing literature indicates substantial spatial variability in N content of oysters but the causes or generality of such variability is not known (Grizzle & Ward 2011; Higgins et al. 2011). There are also temporal variations in nutrient content due to physiological changes in the oyster but these effects have not been well quantified in farmed oysters (Newell & Mann 2012; STAC 2013). Finally, more data on size-related variations in nutrient content are needed in order to make nutrient removal predictions for different harvest scenarios (Higgins et al. 2011). The present study was designed to quantify the relationships among various metrics of farmed eastern oysters near its northern geographic range focusing on nutrient content.
Materials and methods
Study area and field methods
Six sites were chosen to represent a range of ambient nutrient concentrations and other environmental conditions, and locations within the estuary: two oyster farm sites, Granite State Shellfish (GSS) at the mouth of the Oyster River and Little Bay Oyster Company (LBO) in Little Bay; Adams Point (AP) in Little Bay; the mouths of the Bellamy (BMY) and Squamscott Rivers (SQR); and Nannie Island (NI) in Great Bay (Fig. 1). Although we did not measure water quality parameters as part of the present study, we did compare our oyster data to water data available during the same 2.3 yr period from the the Piscataqua Region Estuaries Partnership (PREP) and the Great Bay National Estuarine Research Reserve’s System Wide Monitoring Program (see Grizzle, Ward, Peter, Cantwell, Katz & Sullivan 2014 for details). The aim here was to look for trends in oyster nutrient content and ambient water quality parameters in the study area.
Fig.1.
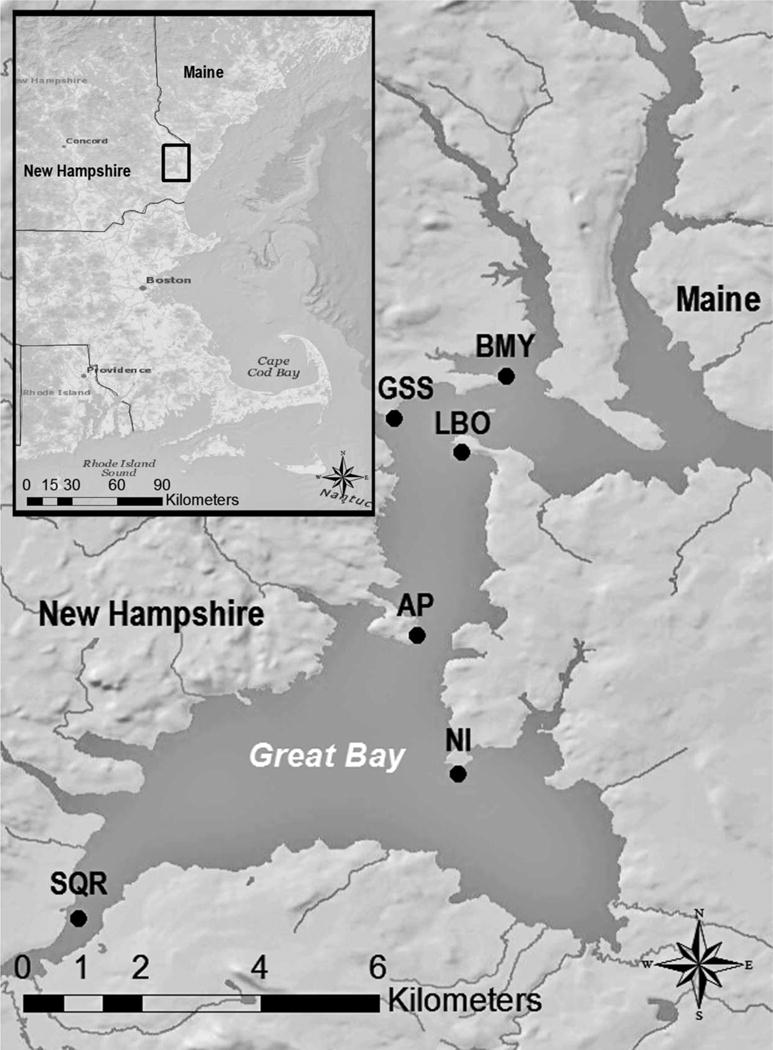
Six sites where oysters were deployed 2010-2012 (see text for details).
Two size classes (small: 19-42 mm initial shell height [0.3 yr old]; large: 28-79 mm initial shell height [1.3 yr old]) of hatchery-reared oysters were obtained from LBO in August 2010. Before deployment at the study sites, thirty (30) oysters were haphazardly selected from each of the two size classes, shell height and whole wet weight measured, then frozen and shipped to USEPA Atlantic Ecology Division laboratory for elemental analysis (see Laboratory Methods section).
At each of the six study sites, ~1,000 small size class oysters were deployed in a 9 mm mesh and ~200 large size class oysters in a 24 mm mesh flat (“envelope” style) polyethylene bag. The two bags were suspended side-by-side 10 cm off the bottom attached to plastic coated wire cages. Table 1 below summarizes the timeline of sampling and analyses for the study period August 2010 – November 2012; note that timing of sampling and sample size varied depending on oyster mortality, funding and other constraints.
Table 1.
Details on sampling and analysis of oysters by size class (small and large).
| Date | Measurement | # of oysters analyzed | Oyster age, by size class (yr) |
|---|---|---|---|
| 30 small | 0.3 for small | ||
| Aug 2010 | Size | 30 large | 1.3 for large |
| 28 small | 0.6 for small | ||
| Nov 2010 | Size | 30 large | 1.6 for large |
| 47 small | 1.0 for small | ||
| Apr 2011 | Soft tissue N and C | 30 large | 2.0 for large |
| 17 small | 1.7 for small | ||
| Nov 2011 | Size | 11 large | 2.7 for large |
| 30 small | 1.7 for small | ||
| Nov 2011 | Soft tissue N and C | 16 large | 2.7 for large |
| 8 small | 2.1 for small | ||
| Apr 2012 | Soft tissue N and C | 10 large | 3.1 for large |
| 22 small | 2.7 for small | ||
| Nov 2012 | Size | 25 large | 3.7 for large |
| 40 small | 2.7 for small | ||
| Nov 2012 | Soft tissue N and C | 40 large | 3.7 for large |
| 29 small | 2.7 for small | ||
| Nov 2012 | Shell N and C | 25 large | 3.7 for large |
Laboratory methods
Size measurements consisted of shell height (calipers to nearest mm), shell and soft tissue dry weight (5+ days at 60° C), and whole wet (fresh) weight (to nearest 0.1 g). For soft tissue N and C content (measured at USEPA laboratories, Narragansett, RI), the frozen oysters were re-measured (shell height), shucked (soft tissue) into aluminum pans, oven-dried at 60°C and weighed (soft tissue dry weight), and homogenized by mortar and pestle. The samples were analyzed following a standardized laboratory operating procedure using a Thermo-Finnigan Flash EA1112 CHN/O elemental analyzer which was calibrated prior to analysis with certified standards. Each tissue sample was analyzed in duplicate and the results reported as %N and %C. For shell N and C content (measured at UNH’s Water Quality Analysis Laboratory in the Department of Natural Resources & the Environment), a 1 cm wide section of shell was cut using a bandsaw along the length dimension at a point about 2 cm from the umbo of both valves, dried, weighed, and ground with a mortar and pestle until homogeneous. Ground samples were analyzed for %N and %C on an elemental analyzer (Perkin Elmer CHN 2400 Series II, Waltham, MA, USA) using high temperature combustion and thermal conductivity detection.
Data analysis
The effect of site on oyster growth was tested based on the final size data for each of the two size classes. All oysters used in the experiment came from the same population (i.e., initial sizes for both size classes were the same for all six study sites), and the experiment was run for the same time period (~2.3 yrs) for all six study sites. Thus, final size reflected overall growth variations; these data were examined using ANOVAs. Oyster growth also was assessed by plotting combined (all sites and seasons) size data over time and fitting appropriate models to the data; annual growth rates were determined for each site using linear regression.
Oyster soft tissue N and C content were analyzed across year, season, and site using ANOVAs and t-tests when appropriate. For all analyses, residuals were examined to ensure homogeneous variance and a normal distribution. Outliers were tested for and removed when appropriate. Oyster shell N and C content were only determined on the final sampling (Table 1), so those data were only analyzed by site. Shell %C was non-normally distributed despite transformations and analyzed with a non-parametric Kruskal-Wallis. Prior to analyses on tissue and shell chemistry, potential effects of oyster age were tested because oysters were from two distinct initial age groups (0.3 and 1.3 yr). No discernable effects of oyster age were evident, thus the two size/age classes were analyzed together. A Tukey’s HSD post hoc test was run to determine differences among means for ANOVAs. Statistical significance for all tests was set at an alpha level of 0.05 to control Type I error.
Results
Oyster growth and morphometrics
Oyster growth was assessed by combining data from all six sites for both size classes and fitting models to the plotted data, and by site and in the context of environmental differences. For shell growth, a quadratic polynomial fit to the combined (all sites, size classes, seasons) datasets for shell height indicated that, on average, a cocktail size oyster (63 mm) would be reached in the third growing season, and regular size (76 mm) would require a full 3 yrs (Fig. 2). However, there was wide variability among individual oysters on each sampling date with some almost reaching regular size in the second growing season. Growth as measured by whole wet weight and soft tissue DW showed similar trajectories and variability. However, because winter data (when both would have typically decreased) were not consistently available (see Table 1), they were not modeled.
Fig. 2.

Oyster growth as shell height using combined datasets from all sites, seasons, size classes. The gray shaded area around the fit line is 95% confidence interval. Open squares = small size class; Black inverted triangles = large size class.
Oyster growth also was assessed by site and size class by comparing final (Nov 2012) size metrics from the four sites for which complete datasets were available (oysters were lost during the final year at sites BMY and SQR). This assessment represented relative growth differences among the sites because each of the two size classes was drawn from the same population at the initiation of the study. Thus, the final sizes represented ~2.3 yrs of growth. Both size classes of oysters differed significantly among the sites, with slowest growth for both size classes at Site GSS and fastest at Site NI (Fig. 3). Although the data are not presented herein, the same overall trend was shown for whole wet weight and soft tissue dry weight.
Fig. 3.

Final shell heights (2.3 yrs of growth) by size class for four sites (no final data were available for BMY and SQR) with complete datasets. P values shown for overall ANOVAs by size class and significance groups based on Tukey test (p<0.05) indicated with lower case letters (normal font for small size class, italicized for large class).
The focus for the present study was on metrics usually reported in the aquaculture literature. Because shell height is the primary metric affecting marketability and selling price, other metrics were compared to it. Oyster shell height and whole oyster fresh (wet) weight data from the overall dataset (all years, sites, seasons combined) showed the expected nonlinear relationship, and a power function provided the best fit to the data (Fig. 4). In the New England region, most of the market is comprised of two size classes: < 76 mm (3 in) (‘petite’ or ‘cocktail’), and 76 to 102 mm (3 to 4 in; ‘regular’). Our data indicate an average petite oyster (assuming 65 mm height) would have a fresh weight of ~20 g; an average regular (86 mm) would be ~70 g (Fig. 4).
Fig. 4.

Relationship between shell height and whole oyster wet (fresh) weight for overall dataset (all sites, seasons and size classes combined). Best-fit power regression model shown.
Soft tissue dry weight (DW) showed the same general relationship to shell height (Fig. 5) as fresh weight (Fig. 4). An average petite oyster (assuming 65 mm height) would have a soft tissue DW of 0.48 g; an average regular (86 mm) would be 1.20 g (Fig. 4). Shell DW was only measured on oysters from the final sampling date only (see Table 1), so overall shell height range was not as wide as the other datasets. Based on these final size measurements, an average petite oyster (65 mm height) would have a shell DW of 19.4 g; an average regular (86 mm) would be 38.5 g (Fig. 6).
Fig. 5.

Relationship between shell height and soft tissue DW for overall dataset (all sites, seasons and size classes combined). Best-fit power regression model shown.
Fig. 6.

Relationship between shell height and shell DW for overall dataset (all sites, seasons and size classes combined Best-fit 2nd order polynomial regression model shown.
Oyster N and C content relative to oyster metrics
Oyster N and C content were measured in soft tissue and shell on an individual oyster basis. The data mainly were assessed by combining data from the overall dataset (all sites, seasons, and sizes) and assessing scatterplots produced from different combinations of oyster metrics. All plots showed no apparent pattern (and in some cases [e.g. %C of shell] little variability), except soft tissue %N relative to shell height and soft tissue DW. Shell height had a weak relationship modeled by the quadratic equation in Figure 7, with an overall trend of decreasing N content on either side of the maximum: 8.3%N for a petite oyster (shell height ~65 mm). The fitted model predicted 7.9%N for a 76 mm (regular) size oyster, and 5.6% for a jumbo (102 mm) oyster.
Fig. 7.

Relationship between shell height and soft tissue %N from overall dataset (all years, sites, seasons). Best-fit 2nd order polynomial regression model shown.
Soft tissue %N relative to soft tissue DW showed weak and widely variable positive trend for those individuals less than ~0.5 g However, in the range of 0.5 to 2.5 g DW there was a strong negative linear relationship with %N content decreasing from 9% to 6% (Fig. 8). These data strongly suggest that there is a substantial decrease in soft tissue N content as an oyster ages.
Fig. 8.

Relationship between soft tissue DW and soft tissue %N from overall dataset (all years, sites, seasons); linear model shown only for those individuals = or > 0.5 g DW.
Oyster N and C content by site
Soft tissue %N and %C varied widely and significantly among study sites, with the same general pattern for both nutrients: lowest at site LBO and highest at SQR (Fig. 9). Although no significant differences were found among the site means in %N and %C in the shell, the overall trends were similar to that for soft tissue (Fig. 9).
Fig. 9.

Soft tissue %N and %C by site using combined data from all years and seasons. P values shown are for an ANOVA testing the effect of site. Letters indicate significance among means (Tukeys).
Discussion
Oyster growth and morphometrics
Oyster growth was assessed by combining data from all six sites for both size classes and fitting models to the plotted data, and by site. The two major findings with respect to growth were that on average harvest-size oysters would be reached in the third growing season (Fig. 2), and there was wide variability among individual oysters on each sampling date. Annual growth rates of the eastern oyster typically vary widely across its range with fastest growth in the warmer regions, likely due to extended growing seasons (Kraeuter, Ford & Cummings 2007). For farmed oysters, deployment methods may also strongly affect growth (Comeau 2013). In her review, Shumway (1996) noted that market size (90 mm) could be attained in 2 yr in the Gulf of Mexico, compared to 4 or 5 yr in Long Island Sound. Recent studies reported market size oysters were attained in 2 yr in the Chesapeake (Harding, Mann & Southworth 2008; Harding, Mann, Southworth & Wesson 2010), similar to our findings for Great Bay.
Growth also varied widely among the six sites (Fig. 3). The smallest oysters at the end of the study (~2.3 yr growth period) for both size classes occurred at Site GSS, with similar growth occurring at the other sites. Although the data are not presented herein, the same overall trend was shown for whole wet weight and soft tissue dry weight. Growth of farmed and wild oysters typically varies widely among sites within an estuary, probably in many cases due to environmental variations (Shumway 1996; Brown, Butt, Shelton & Paynter 1998; Higgins et al. 2011; Carmichael et al. 2012a). Thus, significant among-site differences in growth were expected. Although we do not have sufficient environmental data to fully explain the oyster growth variations observed among the study sites, some comments can be made. In Grizzle et al. (2014) we summarized environmental data from several routine water quality monitoring sites near our oyster study sites. The major differences relevant to oyster growth among the monitoring sites were in tidal current speeds and chlorophyll a concentrations, and both were correlated with oyster growth.
Morphometric relationships in our study focused on how shell height, which typically determines harvest time and is the most widely reported oyster metric in general, was related to other metrics (Figs. 4 – 7). Combining data across all sites and seasons, an average petite oyster (assuming 65 mm height) would have a soft tissue DW of 0.48 g; an average regular (86 mm) would be 1.20 g. These values are slightly lower than those reported for soft tissue DW of farmed oysters in the Chesapeake Bay by Higgins et al. (2011). Reitsma, Murphy & Archer (2014) reported much heavier soft tissue DW (mean: 2.53 g) for regular size diploid oysters, but their triploids had similar values to ours and Higgins et al. (2011).
Shell DW was measured on oysters from the final sampling date only (Table 1), so overall shell height range was not as wide as the other datasets. Based on these final size measurements, an average petite oyster (65 mm height) would have a shell DW of 19.4 g; an average regular (86 mm) would be 38.5 g (Fig. 7). These values are very similar to those reported by Higgins et al. (2011) for farmed oysters, and much lower than Newell et al. (2005) for wild oysters which may typically have thicker and heavier shells than farmed oysters (Paynter & Dimichele, 1990; see discussion in Higgins et al., 2011; Newell & Mann, 2012). However, Reitsma et al. (2014) reported shell DW values for their wild oyster to be within the range reported for farmed (see Table 2). Moreover, it should be noted that farmed oysters can be grown using methods ranging from confinement in bags from seed-to-market size (as in the present study), to various combinations of gear and bottom seeding. And in some areas oyster aquaculture involves harvesting of wild-set oysters on leased bottom areas, with no grow-out gear at all. Thus, the trend of “farmed” oysters having thinner shells than wild may be dependent on culture methods used and perhaps other factors.
Table 2.
Summary data from relevant studies on N and C content of eastern oysters, including wild and farmed. Shaded data are from regular size farmed oysters.
| Shell
|
Soft Tissue
|
Whole Oyster
|
||||||||
|---|---|---|---|---|---|---|---|---|---|---|
| Height (mm) | Dry Wt. (g) | %C | %N | Dry Wt. (g) | %C | %N | Total C (g) | Total N (g) | ||
|
|
|
|
||||||||
| Wild Oysters | Study Region | Source | ||||||||
| 76 | 150 | 0.30 | 1 | 7 | 0.52 | Mid-Atlantic | Newell et al. 2005 | |||
| 83 | 46 | 0.26 | 2.42 | 8.2 | 0.31 | New England | Reitsma et al. 2014 | |||
|
| ||||||||||
| Farmed Oysters | ||||||||||
|
| ||||||||||
| 44 | 4.8 | 11.8 | 0.18 | 0.20 | 43.3 | 8.2 | 0.65 | 0.03 | Mid-Atlantic | Higgins et al. 2011 |
| 65 | 24.3 | 12.4 | 0.19 | 0.80 | 44.3 | 8.1 | 3.39 | 0.11 | Higgins et al. 2011 | |
|
| ||||||||||
| 86 | 37.6 | 12.4 | 0.17 | 1.58 | 45.1 | 7.3 | 5.38 | 0.18 | Higgins et al. 2011 | |
|
| ||||||||||
| 118 | 71.9 | 12.0 | 0.26 | 3.00 | 46.2 | 7.4 | 10.01 | 0.39 | Higgins et al. 2011 | |
| 76 | 2.4 - 4.4 | 8.6 | 0.20 - 0.38 | New England | Carmichael et al. 2012b | |||||
| 114 | 0.21 | 9.3 | Mid-Atlantic Gulf of Mexico | Kellogg et al. 20131 Dalrymple & Carmichael1 | ||||||
| 42 and 98 | 9.1-13.5 | |||||||||
|
| ||||||||||
| 852 | 47.4 | 0.26 | 2.70 | 7.9 | 0.32 | Massachusetts | Reitsma et al. 2014 | |||
| 833 | 35.7 | 0.21 | 2.36 | 8.0 | 0.26 | Reitsma et al. 2014 | ||||
| 874 | 22.3 | 0.32 | 1.36 | 8.5 | 0.19 | Reitsma et al. 2014 | ||||
|
| ||||||||||
| 65 | 19.4 | 12.0 | 0.12 | 0.48 | 38.0 | 8.3 | 2.51 | 0.06 | New England | Present study |
|
| ||||||||||
| 86 | 38.5 | 12.0 | 0.13 | 1.20 | 37.1 | 7.3 | 5.07 | 0.14 | Present study | |
|
| ||||||||||
| Shaded MEANS: | 36.3 | 12.1 | 0.22 | 1.84 | 41.1 | 7.8 | 5.23 | 0.22 | ||
Data taken from summary in STAC (2013)
cultured on-bottm
cultured off-bottm
off-bottm triploid
Oyster N and C content
Oyster N and C content were measured in soft tissue and shell on a per individual oyster basis at multiple times over the ~2.3 yr study period (Table 1). The data were assessed in three ways: combined (overall dataset) relative to various oyster metrics; by year, site, and season (spring and fall); and relative to environmental measurements.
The major overall finding relevant to oyster nutrient content was wide variability in most metrics, particularly soft tissue %N relative to shell height (Fig. 7) and soft tissue DW (Fig. 8). Shell height showed a weak relationship modeled by the quadratic equation shown in Figure 7, with an overall trend of decreasing N content on either side of the maximum: 8.3%N for a petite oyster (shell height ~65 mm). The model predicted 7.9%N for a 76 mm (regular) size oyster, and 5.6% for a jumbo (102 mm) oyster. Higgins et al. (2011) reported somewhat lower soft tissue %N in their ‘regular’ and ‘jumbo’ oysters (mean: 7.3%) compared to smaller sizes (mean: 8.1%), but not as wide a range as we found. Our finding of a strong decline from 9% to 6%N as soft tissue DW increased from 0.5 to 2.5 g (Fig. 8) has not to our knowledge been reported previously.
Soft tissue %N and %C varied widely and significantly among study sites, with the same general pattern for both nutrients: lowest at site LBO and highest at SQR (Fig. 9). Although no significant differences were found among the site means in %N and %C in the shell, the overall trends were similar to that for soft tissue (Fig. 10). In a preliminary 3-month study, we reported significant differences for soft tissue N and C content among the same six study sites (Grizzle & Ward 2011). Here we confirm this finding and quantify the site effect over a 2.3 yr study period. To our knowledge, no previous studies have found a site effect for nutrient content. As already noted, although we did not measure water quality parameters during the study, the two sites with highest N concentrations in soft tissue and shell were in the general area of routine water quality monitoring sites that had the highest mean dissolved inorganic N concentrations (see Grizzle et al. 2014 for details). Carmichael et al. (2012a) found a positive relationship between N loadings to the estuary and tissue N content for hard clams and softshell clams, but not oysters. In their review, Kellogg et al. 2014 noted the need for more site-specific data due to the reported wide variations in N content of oysters.
Fig. 10.

Shell %N and %C by site; note: shell data were only available for Nov 2012 sampling (see Table 1). P values shown for overall ANOVAs, etc. as in Fig. 9.
N and C content were also assessed by season (only spring and fall data were available) by combining the data from all sites and both size classes. There was a significant difference between seasons for %C but not %N, though both showed the same trend: lowest in spring, highest in fall (see Grizzle et al. 2014 for data). Soft tissue nutrient content was expected to vary by season due to changes in overall condition related to reproductive state and perhaps over-winter stress. Thompson, Newell, Kennedy & Mann (1996) found ~10% seasonal variation in protein content due to the oyster’s reproductive cycle. Although we are not aware of other studies on seasonality of oyster nutrient content, our data suggest it might be substantial.
Table 2 summarizes data from the present study for average N and C content on a per oyster basis (all sites and years combined), and compares our findings to previous research. Each of the studies in Table 2 differed somewhat in objectives and methods, so direct comparisons cannot be made for some metrics. Nonetheless, trends for regular size (shaded data in Table 2) oysters are clearly evident. Even though mean shell height only ranged from 83 – 87 mm, shell and soft tissue DW varied by >50%. Although %N in shell also varied by ~50%, soft tissue %N only ranged from 7.3 to 8.5. Thus, the wide range of mean total N (0.14 to 0.32g) for a regular size oyster appears to be largely a factor of variations in weight and N content in the shell. Another trend were differences in total N in wild oysters (mean: ~0.4 g) compared to farmed (0.22 g). Although few data are available for wild oysters, these differences may largely be due to the heavier shell weight sometimes reported for wild oysters (see discussion above).
It should be noted that Higgins et al. (2011) and the present study report data on percent and total nutrient content of different size classes of oysters. As might be expected, there is a strong positive relationship between oyster size and total nutrient content. Higgins et al. (2011) provided models that relate size to total nutrient content based on a wide range of oyster sizes from their study area. They also report mean data for two size classes (petites [65] and regulars [86 mm]) similar to our findings in the present study (Table 2). Although we found a negative relationship between size and %N in both soft tissue and shell (Figs. 7 and 8), the decrease across the size range sampled was much less than the increase in total mass of the oyster. Thus, our larger oysters still had substantially more total N (and C) compared to smaller oysters, and it seems reasonable to expect this to be the general trend.
Finally, although we did not measure water quality parameters as part of the present study, we did compare our oyster data to water data available during the same 2.3 yr period (see Grizzle, Ward, Peter, Cantwell, Katz & Sullivan 2014 for details). Data from the two water monitoring stations nearest our sites SQR and GSS had the highest mean dissolved inorganic N concentrations, which were the two stations with highest soft tissue N concentrations (Fig. 9), and SQR had the highest shell N concentration (Fig. 10).
Management implications
As noted above, N enrichment of Great Bay is a major concern of managers. Farmed oysters are directly involved in the movement of N through ecosystems via three physiological processes: filtration/assimilation, excretion, and biodeposition. Oysters also affect subsequent microbially mediated processes such as denitrification (Newell 2004; Newell & Mann 2012; Kellogg et al. 2014). The present study focused on the effects of filtration/assimilation by measuring N content in shell and soft tissue, which represents N removal from the ecosystem when oysters are harvested (”nutrient bioextraction”; Rose et al. 2014). Here we briefly consider our data in the overall context of N management in the Great Bay estuarine system.
The data herein were used in a companion study to assess the N bioextraction potential of oyster aquaculture in Great Bay on various scales (Bricker, Ferreira, Zhu, Rose, Galimany, Wikfors, Saurel, Miller, Wands, Trowbridge, Grizzle, Wellman, Rheault, Steinberg, Jacob, Davenport, Ayvazian & Tedesco 2015). Based on measured environmental data from two of the present study sites and other data typical of oyster farms in the area, the online FARM model (www.farmscale.org) predicted an average total N removal of 142 kg/ha/yr of (=0.35 metric ton/ac/yr) from the ecosystem via oyster harvest. A more direct approach using a mean of 0.14 g total N/regular size oyster (Table 2), and assuming a harvest of 1,000,000 oysters/ha/yr (which is probably near maximal), indicates a total N removal upon harvest from the Great Bay system of 140 kg N. In comparison, Higgins et al. (2011) estimated a total N removal of 132 kg/ha/yr based on data from farms in the Chesapeake Bay region. Thus, we think it reasonable to conclude that at the individual farm-scale realistic annual predictions of total N removal via harvest can be made. However, moving to larger spatial and temporal scales is more complicated.
Oyster aquaculture is a rapidly growing industry in New Hampshire with ~20 ha (50 ac) currently (2015) licensed for oyster aquaculture, but the potential areal extent is limited by a variety of constraints and has been estimated to probably not exceed 80 ha (Grizzle & Ward 2012). Assuming full production and harvest on only half the licensed bottom area (40 ha) per year, the probable maximum N removal via harvest would be ~5,600 kg. In comparison, the annual total N loadings to the Great Bay system have been estimated at ~1,250,000 kg (PREP 2013). Thus, 40 ha of bottom area in maximum production would remove <1% of the annual total N loadings to the Great Bay system. Although this analysis indicates oyster farming may not have a major role to play in estuary-wide management of N, we suggest that oyster farms could be quite important in this respect in Little Bay, that portion of the estuary where they occur (see Fig. 1). Moreover, and as noted above, oysters are involved in nutrient dynamics in several ways, and oyster harvest only involves removal of assimilated nutrients. Thus, it makes sense for managers to consider the full complexity of how oysters affect N movements in the ecosystem. Although our understanding of how processes such as oyster excretion and biodeposition affect overall N movements remains incomplete in many respects, N bioextraction via oyster harvest only represents a portion of the total N removal from the ecosystem (see reviews by Kellogg et al. 2014; Rose et al. 2014).
Conclusions and future studies.
Our study increases the geographic range of research on the nutrient content of farmed oysters to northern New England. Data are now available from Alabama in the Gulf of Mexico to New Hampshire. Focusing on N content of farmed oysters, the following conclusions seem reasonable based on research to date.
Considering all studies to date, the N content of farmed oysters may be expected to vary widely around the average values, and is likely affected by environmental conditions, oyster age/size, and physiological changes in the oyster that occur seasonally.
Based on studies in three geographic areas, the average %N content (relative to dry weight) of regular harvest size (~85 mm shell height) oysters was 0.22% of the shell and 7.8% of soft tissue.
Based on the same three studies, total N ranged from 0.14 g to 0.32 g per oyster of regular harvest size (~85 mm shell height), due mainly to differences in shell and soft tissue dry weight.
Based on two studies, %N content had a negative correlation with oyster size
Based mainly on the present study, %N content was highest in oysters grown in water that likely had the highest average dissolved inorganic N concentrations.
These findings suggest several areas for future research. More studies are needed on how oyster nutrient content is affected by ambient environmental conditions, different farming methods, different sizes of oysters, and oysters harvested at different times of the year. For some uses, mean values based on our current understanding may be sufficient. However, the reported range of 0.14 g to 0.32 g of total N content for oysters of very similar shell size (but widely different weight) strongly indicates that better understanding is needed on the variety of factors controlling oyster nutrient content.
Acknowledgments
This research was funded by the Ecological Services Research Program of the US Environmental Protection Agency, and the National Oceanic and Atmospheric Administration. Partial funding also was provided by the New Hampshire Agricultural Experiment Station; this is Scientific Contribution Number ________. This work was supported by the USDA National Institute of Food and Agriculture (Hatch Funds) Project #NH00545. We thank Jodie Potter and colleagues at UNH’s Water Quality Analysis Laboratory for nutrient analysis of the oyster shells, and Anna Gerber-Williams for helping us in the field and with preliminary data analyses. Will Carey from Little Bay Oyster Company provided the oysters used in the study.
References
- Boesch D. Challenges and opportunities for science in reducing nutrient over-enrichment of coastal ecosystems. Estuaries. 2002;25:744–758. [Google Scholar]
- Bricker SB, Wicks C, Woerner J. Effects of nutrient enrichment in the nation’s estuaries: a decade of change. Harmful Algae. 2008;8:21–32. [Google Scholar]
- Bricker SB, Rice KC, Bricker OP., III From headwaters to coast: influence of human activities on water quality of the Potomac River estuary. Aquatic Geochemistry. 2014 doi: 10.10007/s10498-014-9226-y. [DOI] [Google Scholar]
- Bricker SB, Ferreira JG, Zhu C, Rose JM, Galimany E, Wikfors G, Saurel C, Miller RL, Wands J, Trowbridge P, Grizzle R, Wellman K, Rheault R, Steinberg J, Jacob A, Davenport E, Ayvazian S, Tedesco M. An Ecosystem Services Assessment using bioextraction technologies for removal of nitrogen and other substances in Long Island Sound and the Great Bay/Piscataqua Region Estuaries. National Oceanic and Atmospheric Administration, National Centers for Coastal Ocean Science; Silver Spring, MD: United States Environmental Protection Agency, Office of Research and Development, Atlantic Ecology Division; Narragansett, RI: 2015. (NCCOS Coastal Ocean Program Decision Analysis Series No. 194). 220 pp + 3 appendices. [Google Scholar]
- Brown BL, Butt AJ, Shelton SW, Paynter KT. Growth and mortality of North Carolina-heritage oysters, Crassostrea virginica, in North Carolina and Chesapeake Bay. Journal of Applied Aquaculture. 1998;8:25–39. [Google Scholar]
- Burkholder JM, Shumway SE. Bivalve shellfish aquaculture and eutrophication. In: Shumway SE, editor. Shellfish Aquaculture and the Environment. Wiley-Blackwell; Hoboken, NJ: 2011. pp. 155–216. [Google Scholar]
- Carmichael RH, Shriver AC, Valiela I. Bivalve response to estuarine eutrophication: the balance between enhanced food supply and habitat alterations. Journal of Shellfish Research. 2012a;31:1–11. [Google Scholar]
- Carmichael RH, Walton W, Clark H. Bivalve-enhanced nitrogen removal from coastal estuaries. Canadian Journal of Fisheries and Aquatic Sciences. 2012b;69:1131–1149. [Google Scholar]
- Coen LD, Dumbauld BR, Judge ML. Expanding shellfish aquaculture: a review of the ecological services provided by and impacts of native and cultured bivalves in shellfish-dominated ecosystems. In: Shumway SE, editor. Shellfish Aquaculture and the Environment. Wiley-Blackwell; Hoboken, NJ: 2011. pp. 239–295. [Google Scholar]
- Comeau LA. Suspended versus bottom oyster culture in eastern Canada: comparing stocking densities and clearance rates. Aquaculture. 2013:410–411. 57–65. [Google Scholar]
- Ferreira JG, Hawkins AJS, Bricker SB. Management of productivity, environmental effects and profitability of shellfish aquaculture – the Farm Aquaculture Resource Management (FARM) model. Aquaculture. 2007;264:160–174. doi: 10.1016/j.aquaculture.2006.12l017. [DOI] [Google Scholar]
- Ferreira JG, Hawkins AJS, Bricker SB. The role of shellfish farms in provision of ecosystem goods and services. In: Shumway SE, editor. Shellfish Aquaculture and the Environment. Wiley-Blackwell; Hoboken, NJ: 2011. pp. 3–32. [Google Scholar]
- Grizzle R, Ward K. A Final Report to The Piscataqua Region Estuaries Partnership. Durham, NH: 2011. Experimental Quantification of Nutrient Bioextraction Potential of Oysters in Estuarine Waters of New Hampshire; p. 18. < http://www.prep.unh.edu/resources/pdf/experimental_quantification_of-unh-11.pdf>. [Google Scholar]
- Grizzle R, Ward K. Final Report submitted to: New Hampshire Department of Environmental Services. Portsmouth, NH: NOAA Fisheries; 2012. Diversifying shellfish aquaculture in coastal New Hampshire; p. 81. http://des.nh.gov/organization/divisions/water/wmb/shellfish/red-tide/documents/102012-jel-oysteraqfinal.pdf. [Google Scholar]
- Grizzle R, Ward K, Peter C, Cantwell M, Katz D, Sullivan J. Nitrogen and carbon content of farmed eastern oysters (Crassostrea virginica) in the Great Bay Estuary, New Hampshire Final Report to National Oceanic and Atmospheric Administration, National Ocean Service. NCCOS; Silver Spring, MD: 2014. p. 21. [Google Scholar]
- Hammer J. Improving water quality in a eutrophied fjord system with mussel farming. Ambio. 1996;25:356–362. [Google Scholar]
- Harding JM, Mann R, Southworth MJ. Shell length-at-age relationships in James River, Virginia, oysters (Crassostrea virginica) collected four centuries apart. Journal of Shellfish Research. 2008;27:1109–1115. [Google Scholar]
- Harding JM, Mann R, Southworth MJ, Wesson JA. Management of the Piankatank River, Virginia, in support of oyster (Crassostrea virginica) fishery repletion. Journal of Shellfish Research. 2010;29:867–888. [Google Scholar]
- Higgins CB, Stephenson K, Brown BL. Nutrient bioassimilation capacity of aquacultured oysters: quantification of an ecosystem service. Journal of Environmental Quality. 2011;40:271–277. doi: 10.2134/jeq2010.0203. [DOI] [PubMed] [Google Scholar]
- Hoellein TJ, Zarnoch CB. Effect of eastern oysters (Crassostrea virginica) on sediment carbon and nitrogen dynamics in an urban estuary. Ecological Applications. 2014;24:271–286. doi: 10.1890/12-1798.1. [DOI] [PubMed] [Google Scholar]
- Hollein TJ, Zarnoch CB, Grizzle RE. Eastern oyster (Crassostrea virginica) filtration, biodeposition, and sediment nitrogen cycling at two oyster reefs with contrasting water quality in Great Bay Estuary (New Hampshire, USA) Biogeochemistry. 2015;122:113–129. [Google Scholar]
- Kellogg ML, Cornwell JC, Owens MS, Paynter KT. Denitrification and nutrient assimilation on a restored oyster reef. Marine Ecology Progress Series. 2013;480:1–19. doi: 10.3354/meps10331. [DOI] [Google Scholar]
- Kellogg ML, Smyth AR, Luckenbach MW, Carmichael RH, Brown BL, Cornwell JC, Piehler MF, Owens MS, Dalrymple DJ, Higgins CB. Use of oysters to mitigate eutrophication in coastal waters. Estuarine, Coastal and Shelf Science. 2014;151:156–168. [Google Scholar]
- Kraeuter JN, Ford S, Cummings M. Oyster growth analysis: a comparison of methods. Journal of Shellfish Research. 2007;26:479–491. [Google Scholar]
- Kroeze C, Hofstra N, Ivens W, Löhr A, Strokal M, van Wijnen J. The links between global carbon, water and nutrient cycles in an urbanizing world – the case of coastal eutrophication. Science Direct: Current Opinion in Environmental Sustainability. 2013;5:566–572. [Google Scholar]
- Lindahl O, Hart R, Hernroth B, Kollberg S, Loo L, Olrog L, Rehnstam-Holm A. Improving marine water quality by mussel farming: a profitable solution for Swedish society. Ambio. 2005;34:131–138. [PubMed] [Google Scholar]
- National Oceanic and Atmospheric Administration (NOAA) Office of Ocean and Coastal Resource Management, National Estuarine Research Reserve System-wide Monitoring Program. Centralized Data Management Office, Baruch Marine Field Lab, University of South Carolina; 2004. http://cdmo.baruch.sc.edu. [Google Scholar]
- Newell RIE. Ecosystem influences of natural and cultivated populations of suspension-feeding bivalve mollusks: A review. Journal of Shellfish Research. 2004;23:51–61. [Google Scholar]
- Newell RIE, Mann R. Shellfish aquaculture: ecosystem effects, benthic-pelagic coupling and potential for nutrient trading. Virginia: 2012. (A report prepared for the Secretary of Natural Resources). [Google Scholar]
- Newell RIE, Fisher TR, Holyoke RR, Cornwell JC. Influence of eastern oysters on nitrogen and phosphorus regeneration in Chesapeake Bay, USA. In: Dame R, Olenin S, editors. The Comparative Roles of Suspension Feeders in Ecosystems. Vol. 47. Springer; Netherlands: 2005. pp. 93–120. (NATO Science Series). [Google Scholar]
- Paynter KT, Dimichele L. Growth of tray-cultured oysters (Crassostrea virginica Gmelin) in Chesapeake Bay. Aquaculture. 1990;87:289–297. [Google Scholar]
- Piehler MF, Smyth AR. Habitat-specific distinctions in estuarine denitrification affect both ecosystem function and services. Ecosphere. 2011;2(a):art12. doi: 10.1890/ES10-00082.1. [DOI] [Google Scholar]
- Pietros JM, Rice MA. The impacts of aquacultured oysters, Crassostrea virginica (Gmelin, 1791). on water column nitrogen and sedimentation: results of a mesocosm study. Aquaculture. 2009;220:407–422. [Google Scholar]
- Pollack JB, Yoskowitz D, Hae-Cheol K, Montagna PA. Role and value of nitrogen regulation provided oysters (Crassostrea virginica) in the Mission-Aransas Estuary, Texas, USA. PLOS ONE. 2013 doi: 10.1371/journal.pone.0065314. [DOI] [PMC free article] [PubMed] [Google Scholar]
- PREP (Piscataqua Region Estuaries Partnership) State of our estuaries. University of New Hampshire; Durham, NH: 2013. p. 47. [Google Scholar]
- Reitsma J, Murphy D, Archer AF. Marine Extension Bulletin. Woods Hole Sea Grant Program, Cape Cod Cooperative Extension; Barnstable, MA: 2014. Shellfish, nitrogen, and the health of our coastal waters; p. 4. [Google Scholar]
- Rheault RB, Rice MA. Food-limited growth and condition index in the eastern oyster, Crassostrea virginica (Gmelin 1791), and the bay scallop, Argopecten irradians irradians (Lamarck 1819) Journal of Shellfish Research. 1996;15:271–283. [Google Scholar]
- Rose JM, Bricker SB, Tedesco MA, Wikfors GH. A role for shellfish aquaculture in coastal nitrogen management. Environmental Science & Technology. 2014;48:2519–2525. doi: 10.1021/es4041336. [DOI] [PubMed] [Google Scholar]
- Saurel C, Ferreira JG, Cheney D, Suhrbier A, Dewey B, Davis J, Cordell J. Ecosystem goods and services from Manila clam culture in Puget Sound: a modelling analysis. Aquaculture Environment Interactions. 2014;5:255–270. [Google Scholar]
- Shumway SE. Natural environmental factors. In: Kennedy VS, Newell RIE, Eble AF, editors. The eastern oyster, Crassostrea virginica. Maryland Sea Grant; College Park, MD: 1996. pp. 467–514. [Google Scholar]
- STAC (Chesapeake Bay Program Scientific and Technical Advisory Committee) Evaluation of the Use of Shellfish as a Method of nutrient Reduction in the Chesapeake Bay. STAC Publication #13-005; Edgewater, MD: 2013. p. 65. [Google Scholar]
- Thompson RJ, Newell RIE, Kennedy VS, Mann R. Reproductive processes and early development. In: Kennedy VS, Newell RIE, Eble AF, editors. The eastern oyster, Crassostrea virginica. Maryland Sea Grant; College Park, MD: 1996. pp. 335–370. [Google Scholar]