Abstract
The feeding and drinking behaviours of sheep were monitored using RFID technology at a commercial pre-embarkation feedlot in Western Australia with the aim of characterizing feeding and drinking patterns of inappetent sheep that might allow them to be treated. Feeding and drinking behaviours of sheep were compared with their survival and change in body condition. Patterns of number of visits and the time spent at feed and water troughs were analyzed for a total of 8,206 sheep, representing four consignments that were monitored for a range of 6–31 d. Data for feeding and drinking behaviours were compared for the first 6 d. For animals that were alive at exit, 18.9% of sheep attended the feed trough for less than 0.25 h d−1 (15 min per day) on day 1; this decreased to only 2.4% of sheep by day 6. Of the sheep monitored, 0.93% died (n = 76); Salmonella spp. infection was the leading cause of death (n = 40; 52.6% of all deaths) across all months and was accompanied with inanition. There was marked variability in the average time spent at the feed trough for sheep that died eventually from salmonella/inanition (contributing to the lack of statistical difference in time spent at feed trough between sheep dying from different causes; P = 0.056). Over half (55%) of the animals diagnosed with salmonella/inanition spent an average of less than 0.50 h d−1 (30 min per day) and 45% less than 0.25 h d−1 at the feed trough. There was a negative correlation (r) in time spent at the feed trough overtime for individual sheep that died from salmonella/inanition, indicating that these individuals went off their feed. This pattern was not evident for animals that died from other causes (significant difference in r values between five categories of cause of death; P = 0.040). Characterization of feeding behaviour of sheep that died from salmonella/inanition therefore appears to require more than simply monitoring daily intake. There was no difference in time spent at water troughs between sheep that died or were alive at exit (average 0.30 ± 0.23 h d−1). This study reveals that the patterns of feeding and drinking behaviours during pre-embarkation feedlotting do not readily allow identification of animals that warrant singling out for veterinary care or alternative feed arrangements. This result highlights the need for experienced stockmanship in handling these animals.
Keywords: feedlot, inappetence, radio tracking, salmonellosis, sheep
INTRODUCTION
Australia exports 2 million sheep annually by live shipment, worth around AU$150 million (Meat and Livestock Australia, 2016). This industry is particularly important to the economies of sheep growing areas of Western Australia, providing market competition. Identifying optimal practice to maximize the health and well-being of these animals is important for industry sustainability (Stinson, 2008; Phillips and Santurtun, 2013; Foster and Overall, 2014). During the feedlotting and shipping periods of live export, complete and voluntary refusal to eat (persistent inappetence) has been identified as a major cause of mortality (43% of the 2% of total shipboard deaths) and is often associated with the onset of salmonellosis (20% of deaths) (Richards et al., 1989). Inappetence is defined as a reduction in or lack of appetite with consequent reduced feed intake (Blood and Studdert, 1999) and can lead to persistent inappetence (More, 2002). Identifying inappetent sheep has been limited to studies using marker bars to determine whether sheep approached the feeder or not each day (Richards et al., 1989; McDonald et al., 1990). This proved useful in determining the number of animals that were or were not feeding; however, it did not allow assessment of those sheep in terms of time spent at the feed trough and how this varied overtime. Further characterization of inappetent sheep is therefore required so that animals can be identified and removed and/or remediated early in the live export process, for better health and welfare outcomes (Foster and Overall, 2014). This study seeks to use radio frequency identification (RFID) technology to determine the feeding and drinking behaviours of sheep while at a commercial feedlot for comparison with their survival and change in body condition. These data were used to identify whether there are characteristic feeding or drinking patterns of inappetent sheep that might allow them to be singled out and treated.
MATERIALS AND METHODS
All experimental procedures were reviewed and approved by Murdoch University Animal Ethics Committee (Permit number R2598/13) in accordance with the Australian Code for the Care and Use of Animals for Scientific Purposes (2013).
Pre-embarkation Feedlot
Sheep were monitored at a registered pre-embarkation feedlot in proximity to the handling port at Fremantle, Western Australia. Normal feedlot management procedures were followed, with sheep destined for the live export trade brought from farm/market into the feedlot, where they were held before export. This feedlot period gives animals access to the pelleted feed that they are fed during shipment, therefore allowing animals to be monitored as they adjust to the diet. The pelletized feed used throughout the study was the same as used commercially in pre-embarkation feedlots and live export voyages (9.9 MJ of metabolisable energy, 12.1% crude protein, and 26.8% neutral detergent fibre/kg of DM).
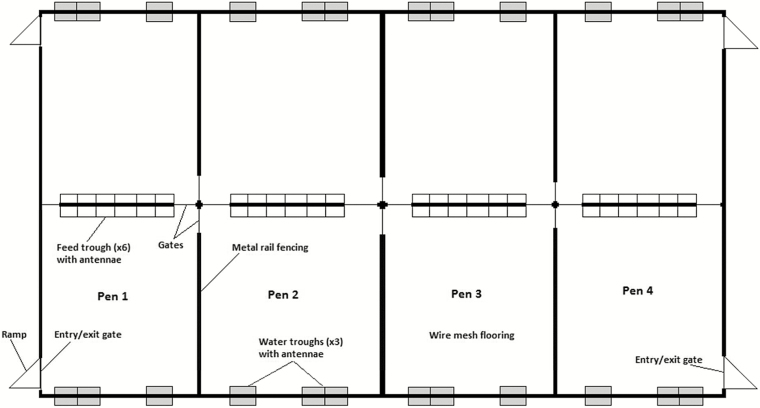
Sheep were monitored for frequency and duration of attendance at feed and water troughs. The feedlot shed where the monitoring system was installed contained eight pens separated by metal fencing and gates (Figure 1). Each pen was 10 × 25 m with a mesh floor supported by wooden beams. The outer walls and roof of the shed were constructed from corrugated metal. Outer walls were enclosed to a height of 0.7 m and then were open to the roof (height of 2.5 m). There were six feed troughs and three water troughs per pen, and pelletized feed and water was provided ad libitum through an automated system. Antennae were installed in feed and water troughs in one half of the shed, over four adjacent pens. The four pens fitted with antennae could hold up to 2,500 sheep under normal feedlot stocking rates of between 0.5 and 0.3 sheep/m2 (Department of Agriculture, Fisheries and Forestry, Australian Government 2011). Lights remained on in feedlot pens for the entire study as per normal feedlot practice.
Figure 1.
Design of the sheep shed at the commercial live export feedlot where this study was carried out (Fremantle, Western Australia). RFID antennae were placed on the feed and water troughs for four pens (1–4).
ALEIS Pty Ltd (Capalaba, Australia) constructed RFID detecting antennae, and 12 antennae were built into each 5 m trough to detect RFID ear tags (134.2 Hz, half duplex, passive, uniquely numbered identification) when in close proximity. A transmit cycle for each antenna took 80 ms (40 ms to transmit to the RFID tag and 40 ms to detect a response), and only one antenna per panel transmitted at any one time; therefore, it took 960 ms for every antenna in the panel to transmit once. The settings for proximity and timing were chosen based on observations of sheep eating, such that a recorded incident was taken to indicate the presence of a sheep’s head in the trough.
For installation of tracking antennae, each trough was modified by the removal of the sloping metal wall of the trough above the area holding the feed/water, and antennae were installed with connections through a central computer. The antennae detected a tag less than 350 mm away, which corresponds to a distance of less than 100 mm between the animal’s mouth and the leading edge of the trough. Although this does not guarantee an animal in that position was eating, the system was particularly designed to detect animals that were not attending the troughs and, therefore, were not accessing feed or water.
Each feeding/drinking event (the time an antenna transmitted and detected an animal tag at either the feed or water trough) was stored and collated to report the number of visits to the troughs (count) and the amount of time (h d−1) each individual attended the troughs.
Animals
After being trucked to the feedlot, depending on arrival time, sheep were either handled for ear tag placement immediately or after being held off-feed, overnight in a yard. Each sheep was body condition scored (BCS) by the same assessor as they were held in a race for ear tagging with an Allflex National Livestock Identification System (NLIS) electronic reusable RFID tag placed in the right ear, before entering monitoring pens. BCS was assessed by a single operator (as described by Jeffries, 1961) and was used in preference to body mass as BCS is not affected by gut fill.
Normal feedlot management procedures were followed, including a daily check through the shed and the removal of dead or moribund sheep. A veterinarian examined sheep to diagnose illness or conduct a postmortem to determine cause of death. Any clinical history prior to death was recorded. Dead sheep were examined for evidence of scouring and external injuries. The oral and nasal cavity and eyes were also examined. Tissue samples were taken for bacteriology and histopathology, including Salmonella spp. culture. Worm egg count was determined from faecal samples.
One day before, the sheep were due to exit the feedlot, sheep were again scored for body condition, and the RFID tags were removed.
Data Analyses
Because all consignments were monitored in the feedlot over at least 6 d, the first 6 d of data were analyzed for each. To determine whether individuals increased or decreased their time at the feed trough over the first 6 d in the feedlot, Pearson’s correlation coefficient (r) was calculated between feed rate and day for each animal using a correlation matrix (Microsoft Excel 2006, Redmond, Washington, USA).
The change in BCS (BCS exit–BCS entry) was calculated for sheep from the January, February, and June consignments, which were BCS by the same assessor. A mixed-model ANOVA was used to test whether the change in BCS was correlated with the average amount of time that sheep spent at the feeders (average over the entire duration that they were feedlotted). Feedlot pen and consignment were included as random factors and the duration of time in the feedlot (d) as a covariate.
Differences in mean time spent per day (h d−1) at feed and water troughs during the first 6 d were analyzed using a mixed-model ANOVA, including the fate of sheep (“alive” at exit from the feedlot; “died”), with consignment and pen included as random factors. Differences between types of sheep (breed or sex) could not be statistically analyzed due to inadequate representation across the four consignments.
Five main causes of death were identified among the consignments (trauma, tetany, salmonella, pneumonia, “other”), and feeding and drinking data were compared for these five categories. Nonparametric ANOVA was used to test whether there were significant differences in the average time spent at the feed trough (h d−1) and also the pattern of feeding (r) for animals that died from different causes (trauma n = 5, tetany n = 9, salmonella, n = 40, pneumonia n = 7, other n = 15).
Values are presented as means ± 1 SD throughout. Statistical differences were declared with P ≤ 0.05 with statistical analyses carried out using Statistica (StatSoft Inc, Tusla, OK, USA).
RESULTS
Between September 2011 and June 2012, a total of 8,206 sheep representing four consignments were monitored for a range of 6–31 d (Table 1). The sheep varied in breed (Merino, Dorper, Damara, and crossbreeds of these), sex (primarily castrated males, some entire males and occasional females), age (weaners to 2 yr old), and came from a total of 284 farm origins (Table 1).
Table 1.
Description of the four consignments of sheep monitored at the live export feedlot (Fremantle, Western Australia) between September 2011 and June 2012
| Pen | Type of sheep | Number of sheep | Days monitored | Number of different farm origins |
|---|---|---|---|---|
| Consignment 1: September, 2011 | ||||
| 1 | Merino and Merino cross Damara wethers | 504 | 31 | 82 |
| 2 | Merino wethers | 503 | 26 | 80 |
| 3 | Dorper ewe lambs | 738 | 16 | 1 |
| 4 | Dorper ram lambs | 711 | 16 | 1 |
| Consignment 2: January, 2012 | ||||
| 1, 2 | Merino wethers | 1,180 | 17 | 3 |
| 3, 4 | Merino | 1,134 | 15 | 11 |
| Consignment 3: February, 2012 | ||||
| 2 | Merino wethers | 607 | 22 | 4 |
| 3 | Merino rams and wethers | 357 | 7 | 2 |
| Consignment 4: June, 2012 | ||||
| 1 | Merino wethers | 634 | 7 | 35 |
| 2 | Merino wethers | 566 | 7 | 31 |
| 3 | Merino wethers | 736 | 7 | 35 |
| 4 | Merino wethers | 536 | 6 | 94 |
During the feedlot period, 76 individuals died (Table 2), representing 0.926% of the total number of sheep monitored. The highest death rate was for the January 2012 consignment. Of the sheep that died, 40 (52.6%) were diagnosed with Salmonella spp. infection accompanied with inanition. Specifically, these sheep spent less than 15 min at the feed trough on each of the 4 d before death (n = 38) or did not approach the feed trough at all on at least 3 of the 4 d prior to death (n = 2). Salmonella infection was the leading cause of death and was present across all consignments and these deaths occurred as early as 4 d and as late as 16 d at the feedlot. One group of Dorper ewe weaners in September 2011 had eight animals affected by transit tetany, diagnosed on clinical signs and blood analysis. Pleuropneumonia was confirmed in seven sheep in January 2012 and was present to some degree in the sheep from that group that were diagnosed with salmonella infection as the primary cause of death.
Table 2.
Cause of death of sheep grouped by five categories for each of four consignments at a commercial live export feedlot (Fremantle, Western Australia)
| September 2011 | January 2012 | February 2012 | June 2012 | ||
|---|---|---|---|---|---|
| 1 | Shearing trauma | 5 (0.20%) day 5–11 | |||
| 2 | Transit tetany | 8 (0.33%) day 2–8 | 1 (0.04%) day 6 | ||
| 3 | Salmonella | 9 (0.37%) day 4–13 | 25 (1.1%) day 7–14 | 4 (0.41%) day 11–16 | 2 (0.08%) day 5–6 |
| 4 | Pneumonia | 7 (0.30%) day 13–16 | |||
| 5 | Other | ||||
| Bloat | 1 (0.04%) day 2 | ||||
| Enterotoxaemia* | 1 (0.04%) day 9 | ||||
| Electrolyte† | 1 (0.04%) day 5 | ||||
| High worm egg count | 1 (0.10%) day 22 | ||||
| Mouth fistula | 1 (0.04%) day 8 | ||||
| Gall bladder | 2 (0.09%) day 14–17 | ||||
| Unknown | 7 (0.30%) day 2–15 | 1 (0.10%) day 22 | |||
Values are the number of sheep that died as counts and as a percentage of the total sheep in each consignment (brackets) and the days (d; time since entry to the feedlot) between which the deaths occurred.
*Clostridium perfringens infection.
†Hypomagnesia and hypocalcaemia.
Success of RFID Identification
Of the RFID tags used in this study, 99.8% were still in situ in the ear and still functioning at exit, as detected by a handheld RFID reader. For the remaining sheep, 13 were not recorded as approaching the feed or water troughs during the time they were at the feedlot (7–17 d; time differed between consignments). On the other extreme, one Merino wether was recorded a total of 10.3 h at the feed troughs over the first 2 d but was not recorded at the water troughs. Of these 14 sheep, 9 were recorded alive at exit, indicating that these tags were working. The ear tag of these sheep may have been in a position that could not be detected by the antennae (abnormally high or low on the ear) or they may not have approached the feed or water troughs. The fate of the other five sheep was unknown; all mortalities were checked and recorded, so these missing sheep may have mixed with another pen of sheep adjacent to the experimental pens.
Feeding and Drinking Patterns for Sheep Alive at Exit
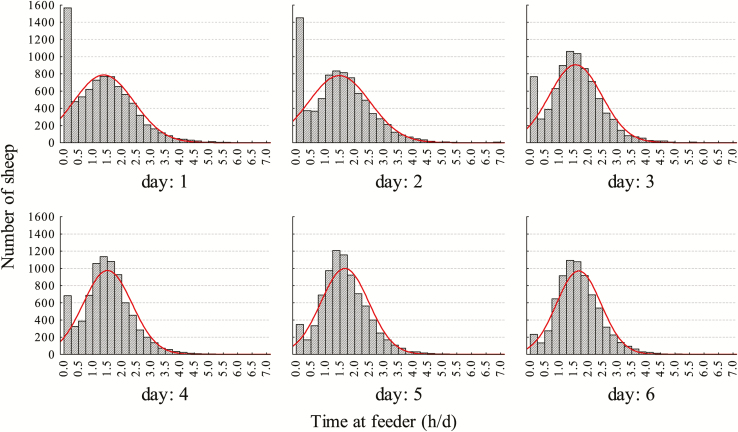
Although sheep did attend feed troughs throughout a 24 h period, there was a diurnal tendency for sheep to attend the feed troughs more frequently during the day than at night. There was a large number of animals (n = 1,533; 18.9% of the total monitored) that spent less than 15 min at the feeder on day 1; this number decreased to 196 (2.4%) animals by day 6 (Figure 2; Table 3). Sheep alive at exit spent an average of 1.59 ± 0.55 h d−1 at the feed trough over the first 6 d (Figure 3b) and visited the trough an average of 33.74 ± 12.32 times (Table 4). Most sheep alive at exit increased the time they spent at the feed trough over the first 6 d of monitoring, with positive r values (Figure 4b).
Figure 2.
Histograms showing the time sheep spent at the feeders (h d−1) for the first 6 d at the feedlot for animals that were alive at the end of their feedlot period.
Table 3.
Number of sheep that spent less than 15 min at the feeder over the first 6 d in a commercial feedlot as (a) the percentage of sheep alive at exit and (b) the count of sheep that died of different causes
| Day 1 | Day 2 | Day 3 | Day 4 | Day 5 | Day 6 | |
|---|---|---|---|---|---|---|
| a. Sheep alive at exit (% of n = 8130) | ||||||
| 18.9% | 17.3% | 2.3% | 7.9% | 3.9% | 2.4% | |
| b. Sheep that died while at the feedlot (of n = 76) | ||||||
| Trauma (n = 5) | 1 | 1 | 1 | 1 | ||
| Tetany (n = 9) | 7 | 8 | 1 | 4 | 2 | 1 |
| Salmonella (n = 40) | 17 | 23 | 18 | 24 | 24 | 28 |
| Pneumonia (n = 7) | 2 | 3 | 2 | 3 | 2 | 2 |
| Other (n = 15) | 6 | 12 | 2 | 5 | 4 | 6 |
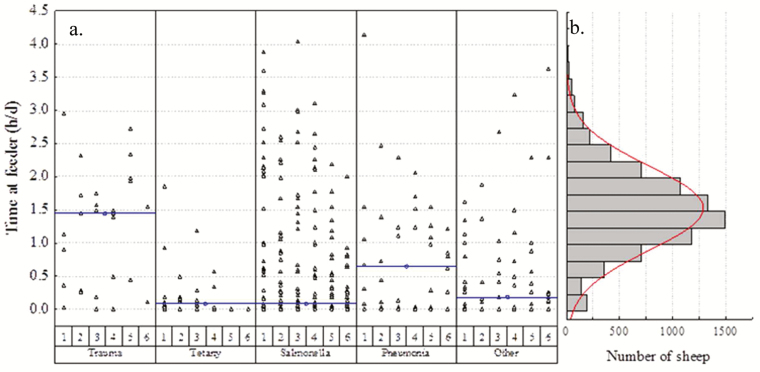
Figure 3.
Time spent at the feeder (h d−1) for sheep (a) that died from different causes (trauma n = 5, tetany n = 9, testing positive for salmonella, pneumonia n = 7, other n = 15). Each triangle represents an individual animal. The horizontal lines represent medians. (b) Histogram of the time spent at the feed trough (h d−1) averaged over the first 6 d for sheep that were alive at exit from the feedlot.
Table 4.
Mean ± 1 SD (maximum presented in brackets; all minimums were 0) feed time (h) and number of visits per day (count) at feed and water troughs for sheep that remained alive for the entire feedlot period and those that died while at the feedlot
| Day | Feed, h | Count | Water, h | Count |
|---|---|---|---|---|
| a. Sheep alive at exit | ||||
| Day 1 | 1.37 ± 1.04 (8.36) | 32.60 ± 24.12 (174) | 0.28 ± 0.35 (4.42) | 13.77 ± 11.72 (124) |
| Day 2 | 1.48 ± 1.05 (8.21) | 30.24 ± 21.52 (194) | 0.31 ± 0.36 (4.81) | 13.13 ± 10.61 (125) |
| Day 3 | 1.56 ± 0.90 (7.30) | 30.90 ± 18.53 (169) | 0.32 ± 0.37 (6.42) | 12.83 ± 10.14 (138) |
| Day 4 | 1.51 ± 0.83 (7.03) | 29.13 ± 16.76 (119) | 0.30 ± 0.40 (18.97) | 12.77 ± 9.83 (82) |
| Day 5 | 1.67 ± 0.82 (9.77) | 33.98 ± 18.62 (222) | 0.30 ± 0.32 (4.17) | 13.42 ± 10.36 (136) |
| Day 6 | 1.68 ± 0.76 (5.39) | 35.43 ± 17.61 (114) | 0.29 ± 0.31 (6.56) | 13.09 ± 10.06 (114) |
| Daily mean, h d−1 | 1.59 ± 0.55 (4.31) | 33.74 ± 12.32 (111) | 0.29 ± 0.23 (2.76) | 13.36 ± 6.60 (68) |
| Mean per visit, h | 0.05 ± 0.01 | 0.02 ± 0.01 | ||
| b. Sheep that died while at the feedlot | ||||
| Day 1 | 0.90 ± 1.12 (4.14) | 18.12 ± 21.28 (97) | 0.28 ± 0.32 (1.84) | 11.88 ± 9.19 (37) |
| Day 2 | 0.51 ± 0.76 (2.59) | 10.53 ± 14.13 (63) | 0.38 ± 0.59 (3.87) | 11.61 ± 9.34 (46) |
| Day 3 | 0.64 ± 0.92 4.05) | 12.29 ± 14.63 (61) | 0.40 ± 0.54 (3.22) | 11.34 ± 12.51 (69) |
| Day 4 | 0.65 ± 0.87 (3.23) | 11.26 ± 14.64 (59) | 0.37 ± 0.73 (4.89) | 10.90 ± 11.36 (54) |
| Day 5 | 0.55 ± 0.73 (2.74) | 10.90 ± 14.94 (68) | 0.27 ± 0.35 (2.29) | 10.32 ± 9.58 (39) |
| Day 6 | 0.36 ± 0.66 (3.63) | 8.19 ± 13.41 (66) | 0.35 ± 0.43 (2.26) | 11.30 ± 10.16 (45) |
| Daily mean, h d−1 | 0.39 ± 0.40 (1.73) | 8.30 ± 8.41 (44) | 0.53 ± 0.50 (2.11) | 13.15 ± 7.71 (35) |
| Mean per visit, h | 0.04 ± 0.02 | 0.04 ± 0.02 | ||
Data are shown for the first 6 d that sheep spent in the live export feedlot.
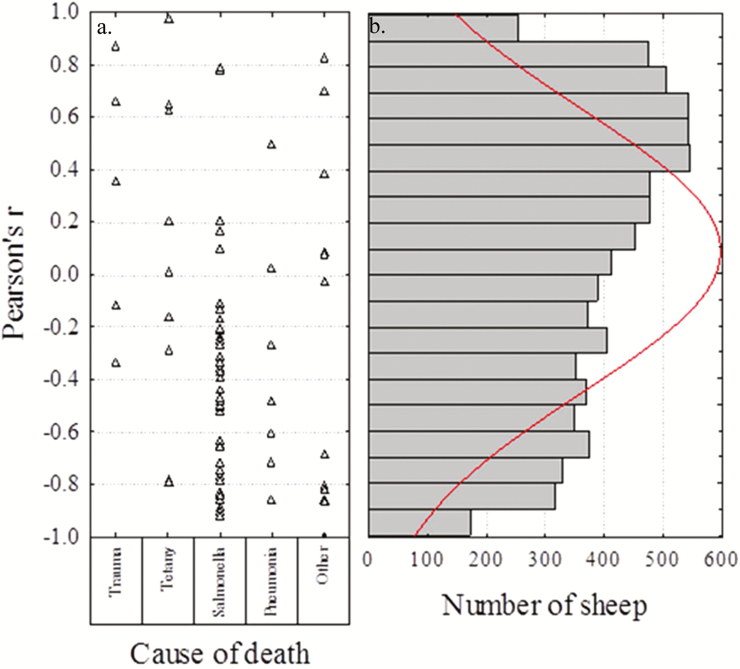
Figure 4.
Feeding pattern (correlation coefficient of time spent at the feed trough overtime during the first 6 d) for sheep in the feedlot. (a) Feeding pattern for sheep that died (trauma n = 5, tetany n = 9, testing positive for salmonella, pneumonia n = 7, other n = 14). Note that one sheep in the “other” category did not approach the feeder for 6 d, and therefore, a correlation coefficient for that animal could not be calculated. (b) Histogram showing the distribution of correlation coefficients for sheep alive at exit from the feedlot.
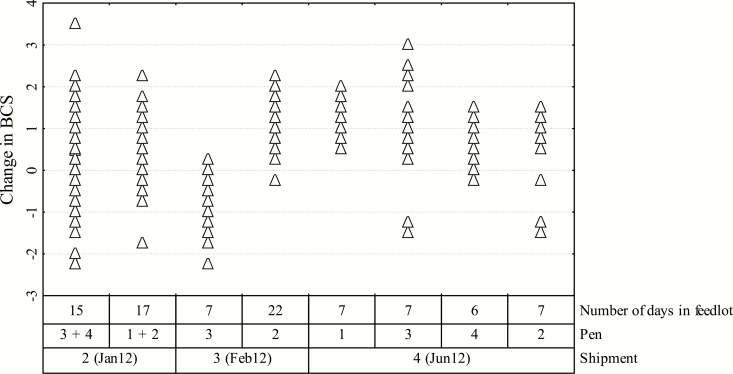
There was no effect of average time spent at the feed trough (F1, 1 < 0.01, P = 0.967), duration of time at the feedlot (F1, 1 < 0.01, P = 0.947), or sheep breed (F1, 2 < 0.01, P = 0.999) on the change in BCS, but there was a strong interaction effect of consignment and pen (F1, 5549 = 14.10, P < 0.001). For all consignments, there were large increases in BCS, but for one consignment (pen 3, February 2012), almost all individuals showed a decrease in BCS (Figure 5). These sheep were only in the feedlot for 8 d and were from two farms of origin. None of these sheep died while at the feedlot.
Figure 5.
Change in BCS (BCS on exit–BCS on entry) for individual sheep that remained alive at the feedlot in each pen for consignments 2, 3, and 4. Each triangle represents an individual, but there are many overlapping points.
Sheep alive at exit spent an average of 0.29 ± 0.23 h d−1 at the water trough, visiting them 13.36 ± 6.60 times per day (Table 4). Although sheep did attend water troughs throughout a 24 h period, there was a diurnal tendency for sheep to attend the water troughs more frequently during the day than at night.
Feeding and Drinking Patterns for Sheep That Died
Around half of the animals that eventually died while at the feedlot (n = 33; 43.4% of the 76 that died) spent less than 15 min at the feeder on day 1, and this value did not decrease overtime (Table 3). Of the animals that eventually died of salmonella while at the feedlot, 45% spent on average less than 15 min at the feeder over the first 6 d. Sheep that eventually died spent an average of 0.39 ± 0.40 h d−1 at the feed trough, which was significantly less than the average for sheep alive at exit (mixed-model ANOVA F1, 3 = 182.59, P < 0.001). They visited the feed trough an average of 8.30 ± 8.41 times. The median time spent at the feed trough was low for sheep that died from salmonella/inanition; however, there was high variation between these individuals (Figure 3a), which contributed to the lack of statistical difference in time spent at feed trough between sheep dying from different causes (Kruskal–Wallis test: H4, N=75 = 9.23, P = 0.056; Figure 3a). The majority (55%) of the 40 sheep that died from salmonella/inanition (compared with 4% of sheep alive at exit) spent less than 0.49 h d−1 at the feed trough (i.e., 2 SD below the mean for sheep alive at exit). The majority of sheep that died from salmonella/inanition (n = 40) also showed a decrease in feeding rate overtime (negative r values; Figure 4a). This pattern was not evident for animals that died from other causes, with significant differences in feeding pattern (r) between the five categories of cause of death (Kruskal–Wallis test: H4, N=75 = 10.00, P = 0.040).
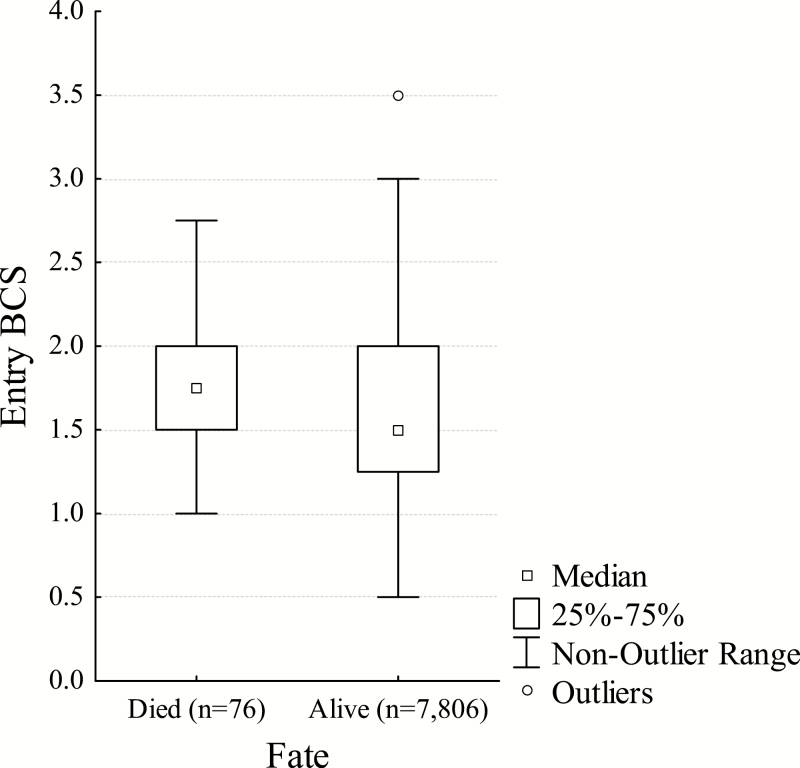
Sheep that eventually died while at the feedlot had higher BCS on entry compared with sheep that were alive on exit (Kruskal–Wallis test: H1, N=5,732 = 11.02, P < 0.001; Figure 6).
Figure 6.
Box plot of entry BCS for sheep that died and those that were alive at exit from the feedlot.
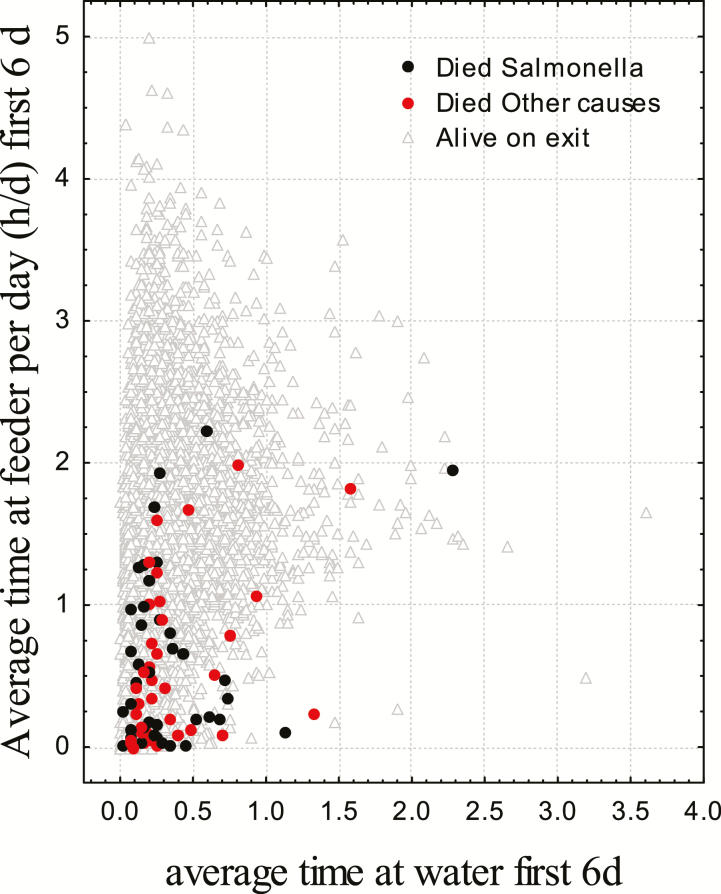
There was no difference in time spent at water troughs (mixed-model ANOVA F1, 4 = 1.66, P = 0.264) or the number of visits per day between sheep died or were alive at exit, and their drinking pattern was largely independent of average feeding time (Figure 7; r2 = 0.032; P < 0.001). There was a significant shipment × pen effect (mixed-model ANOVA F4, 8184 = 11.77, P < 0.001), which indicated that the time spent at the water troughs was longer for the January consignment (Table 4).
Figure 7.
Comparison between average time at the feeder and water troughs for sheep for their first 6 d in a commercial feedlot.
DISCUSSION
The RFID-tracking antennae used in this study were successful in monitoring the length of time that sheep spent at the feed and water troughs, with 99.8% of ear tags confirmed as present and working using the portable RFID reader at exit from the feedlot. Previous detection of inappetent sheep has been limited to the use of marker dyes and real-time observation. These methods are time consuming and, in the case of marker dyes, require frequent animal handling to record the marks (McDonald et al., 1990). With real-time observation, there is a risk of error in identifying individuals and their activities in large groups. As most sheep that do not adapt to feedlot feed are found to die during live shipment (Norris et al., 1989), tools such as the RFID identification system could be used during the feedlot process, allowing different feed or attention to be given to these sheep.
Overall mortality rates in the present study were low and this prevented meaningful statistical modeling on the relation of feeding patterns and risk of death. We recorded only 0.93% mortality of the 8,206 sheep monitored across four consignments. The main cause of death was salmonella infection. Postmortem results showing salmonella infection was also accompanied by a decrease in time that these sheep spent at the feed trough. The majority (55%) of animals testing positive for salmonella infection spent less than 0.49 h d−1 at the feeders (i.e., 2 SD below the mean for sheep alive at exit). Our result supports previous observations (Brownlie and Grau, 1967) that inappetent animals may be at greater risk of salmonellosis, and those affected by disease are inappetent. Norris et al. (1989) found sheep that failed to eat late in the feedlot period had 5.9 times greater risk of death due to salmonellosis than those that ate. Furthermore, Higgs et al. (1993) found death from salmonellosis exclusively in inappetent sheep.
There was a large degree of variability in the average time sheep spent at the feed trough. However, sheep that eventually died from salmonella/inanition decreased their time at the feed trough over the 6 d monitoring period. Characterization of feeding behaviour in sheep that eventually died from salmonella/ inanition is therefore likely to require monitoring the change in feed trough attendance overtime rather than just the average time spent at the feeder.
Although 55% of animals that died of salmonella/inanition spent <15 min/d at the feed trough, a high proportion of animals that were alive at exit showed similar inappetence: 18.9% of animals spent <15 min at the feed trough on day 1 down to 2.4% by day 6. Through the use of 24 h video surveillance, Rice et al. (2016) also recorded 18% of sheep were shy feeders, spending less than half an hour at the feed trough on day 2 or 3. Clearly, therefore, many animals refrain from eating in the short term. Therefore, there were limitations with using attendance at the feed trough as an alert for the presence of salmonella/inanition. Application of such a measure is more appropriate by day 3 onwards, when the majority of sheep had settled into their feeding habits.
Sheep that died had a higher entry BCS than sheep alive at exit, indicating that they were not necessarily in poorer condition. Richards et al. (1989) found that sheep that died from inanition had greater reserves of body fat than controls and sheep that died from other causes. We note, however, that the entry BCS of sheep included in our study was not high by industry standards.
Previous work investigating inanition has not considered water intake of the sheep. However, we recorded no difference in time spent at water troughs between sheep that died or were alive at exit. Postmortem examination of sheep diagnosed as dying from inanition found fluid in the rumen (Richards et al., 1989), which was presumed to indicate the animals were still drinking. However, this assumption may not be correct, in light of findings that dehydrated lambs had the same weight of gastrointestinal contents as those with access to water, suggesting that the capacity for increased water absorption from the gastrointestinal tract in response to water deprivation is limited (Jacob et al., 2006). Dehydration has not been reported as a particular issue along with the inappetence; the long survival time of animals not apparently accessing feed troughs indicated that the animals were still drinking because dehydration will hasten mortality compared with deaths due to inanition alone. During January, sheep that died spent longer at water troughs, possibly due to effects of fever associated with respiratory infection increasing thirst interacting with the high summer environmental temperature.
CONCLUSION
This monitoring system was useful in further characterizing inappetent sheep. Clearly, there were a high proportion of animals that were inappetent, taking a number of days to adjust to the pelleted feed at the feedlot. Therefore, identification of animals that are at risk of salmonella/inanition was somewhat masked by this background of inappetent sheep coupled with the large variation in average time that sheep died from salmonella/inanition spent at the feeder. The RFID tag monitoring system could be used with automatic drafting or other nonintrusive management to remove such animals for different feed or attention although the benefits of any such change in management would need to be weighed against the costs of disruption, and the technology is not suitable for general installation.
GLOSSARY
Anorexia: Complete absence of appetite and refusal of food (Radostits et al., 2000).
Inanition: The term is commonly considered to be an end-stage condition and has been used to describe deaths in export sheep attributed to prolonged reduction or cessation of feed intake resulting in a state of exhaustion (Richards et al., 1989).
Inappetence: “shy-feeding”, reduction in or lack of appetite with consequent reduced food intake (Blood and Studdert, 1999).
Persistent inappetence: complete and voluntary refusal to eat (More, 2002).
Starvation: prolonged deprivation of food and consequent effects on the body (Andreasson et al., 2007).
Footnotes
This project was conducted with funding from Meat and Livestock Australia, Project number W LIV 0142.
LITERATURE CITED
- Andreasson A., Arborelius L., Erlanson-Albertsson C., Lekander M.. 2007. A putative role for cytokines in the impaired appetite in depression. Brain Behav. Immun. 21:147–152. [DOI] [PubMed] [Google Scholar]
- Australian Government National Health and Medical Research Council.. 2013. Australian code for the care and use of animals for scientific purposes, 8th ed National Health and Medical Research, Australian Government, Canberra, Australian Capital Territory. [Google Scholar]
- Blood D. C. and Studdert V. P.. 1999. Saunders comprehensive veterinary dictionary. London: WB Saunders. [Google Scholar]
- Brownlie L. E. and F. H., Grau 1967. Effect of food intake on growth and survival of salmonellas and Escherichia coli in the bovine rumen. Microbiology 46:125–134. [DOI] [PubMed] [Google Scholar]
- Department of Agriculture, Fisheries and Forestry, Australian Government 2011. Australian standards for the export of livestock (version 2.3). Canberra, Australia: Department of Agriculture, Fisheries and Forestry, Australian Government; Available at www.daff.gov.au/livestockexportstandards. [Google Scholar]
- Foster S. F. and Overall K. L.. 2014. The welfare of Australian livestock transported by sea. Vet. J. 200:205–209. [DOI] [PubMed] [Google Scholar]
- Higgs A. R. E., Norris R. T., Richards and R. B.. 1993. Epidemiology of salmonellosis in the live sheep export industry. Aust. Vet. J. 70:330–335. [DOI] [PubMed] [Google Scholar]
- Jacob R. H., D. W., Pethick E., Ponnampalam J., Speijers and D. L., Hopkins 2006. The hydration status of lambs after lairage at two Australian abattoirs. Aust. J. Exp. Agric. 46:909–912. [Google Scholar]
- Jeffries B. C. 1961. Body condition scoring and its use in management. Tasmanian J. Agr. 32:19–21. [Google Scholar]
- McDonald C. L., Norris R. T., Speijers E. J., and Ridings H.. 1990. Feeding behaviour of Merino wethers under conditions similar to lot-feeding before live export. Animal Prod. Sci. 30:343–348. [Google Scholar]
- Meat and Livestock Australia 2016. Livelink august 2016; live export statisitcs. Sydney, Australia: Meat and Livestock Australia; Available at http://statistics.mla.com.au/. [Google Scholar]
- More S. 2002. LIVE. 112 Salmonellosis control and best-practice in live sheep export feedlots–final report. Sydney, Australia: Meat and Livestock Australia. [Google Scholar]
- Norris R. T., Richards R. B., and Dunlop R. H.. 1989. An epidemiological study of sheep deaths before and during export by sea from Western Australia. Aust. Vet. J. 66:276–279. [DOI] [PubMed] [Google Scholar]
- Phillips C. J. and Santurtun E.. 2013. The welfare of livestock transported by ship. Vet. J. 196:309–314. [DOI] [PubMed] [Google Scholar]
- Radostits O., Gay C., Blood D., and Hinchcliff K.. 2000. Veterinary medicine. London, Philadelphia (NY): Blaillier: a textbook of the diseases of cattle, sheep, pigs, goats and horses. Saunders, London, United Kingdom. [Google Scholar]
- Rice M, Jongman E.C., Borg S., Butler K.L., and Hemsworth P.H.. 2016. Characterisation of shy–feeding and feeding lambs in the first week in a feedlot. Appl. Anim. Behav. Sci. 179:39–45. [Google Scholar]
- Richards R.B., Norris R.T., Dunlop R.H., and McQuade N.C.. 1989. Causes of death in sheep exported live by sea. Aust. Vet. J. 66:33–38. [DOI] [PubMed] [Google Scholar]
- Stinson P.R. 2008. Two incidents that changed quality management in the Australian livestock export industry. Vet. Ital. 44:177–186. [PubMed] [Google Scholar]


