Earthquakes beneath a Californian volcano track fluid movement and outline a zone of partial melt in the deep and mid-crust.
Abstract
Although most volcanic seismicity is shallow (within several kilometers of the surface), some volcanoes exhibit deeper seismicity (10 to 30+ km) that may reflect active processes such as magma resupply and volatile transfer. One such volcano is Mammoth Mountain, California, which has also recently exhibited high rates of CO2 discharge at the surface. We perform high-resolution earthquake detection and relocation to reveal punctuated episodes of rapidly propagating seismicity at mid-crustal depths along a narrow fracture zone surrounding a body of partial melt. We infer that these earthquakes track dike intrusions or fluid pressure pulses associated with CO2 exsolution, suggesting that the deep plumbing system of Mammoth Mountain is an active conduit for fluid transport from the base of the crust to the surface.
INTRODUCTION
Lower to mid-crustal earthquakes (~10+ km below sea level) are an important feature of unrest in the roots of magmatic systems of volcanoes across a spectrum of composition and eruptive style. Swarms of deep earthquakes are sometimes the first indications of volcanic reawakening (1, 2) but are more often an infrequent aspect of normal background seismicity (3–5). While it is clear that these earthquakes are the manifestation of processes occurring in the deep crust, details of their generation are still poorly understood.
Deep earthquakes can be divided into two groups based on their spectral content and behavior. The first group consists of what are presumed to be stick-slip earthquakes that occur when the typically ductile lower crust becomes brittle under high strain rates and increased pore pressures (4, 6). Despite their unusual depths, these events have waveforms indistinguishable from typical tectonic earthquakes. The second group is called “long-period” (LP) earthquakes because they are enriched in lower frequencies (that is, 1 to 3 Hz) compared to those recorded for a brittle-failure earthquake with similar magnitude and location (7). These events are usually interpreted to reflect flow-induced resonance of fluid-filled cracks (8) or choked flow (9) of basaltic magma and its exsolved gases (primarily CO2).
Here, we examine recent deep swarms of both brittle-failure earthquakes and LPs beneath Mammoth Mountain, California. Mammoth Mountain is a dacitic dome complex with mafic periphery located on the southwestern rim of Long Valley Caldera, in eastern California. The last eruption at Mammoth Mountain itself was ~50 thousand years (ka) ago, and nearby Red Cones erupted ~8.5 ka ago (10). Recent unrest at the volcano began in 1989 with the onset of a shallow earthquake swarm (11, 12). Increased CO2 gas emissions and elevated 3He/4He ratios in fumarolic gases provided evidence for an underlying magmatic source (13). Surface emissions, combined with persistent, ongoing seismicity over a broad range of depths (14, 15), suggest that the system remains an active conduit for fluid transport.
RESULTS
We obtained precise locations for the deep seismicity beneath Mammoth Mountain from 1987 to 2017 using cross-correlation and double-difference techniques (16–18) to illuminate spatial and temporal patterns, with specific focus on lower to mid-crustal depths. The relocated hypocenters of deep (>8 km) brittle-failure earthquakes form a nearly vertical planar structure a few hundred meters thick striking northeast (NE)–southwest (Fig. 1 and movie S1). In a cross section along the trend, the seismicity separates into two branches wrapping around a largely aseismic core, with LPs clustering at its top and center. Each branch is tipped with a horizontal disc of seismicity that does not correspond to any layers in the velocity model used (table S1) and are elongated in the direction of the strike of the rest of the structure. The deepest earthquakes are located just above the Moho, estimated to be at a depth of 30 to 35 km in this area (19).
Fig. 1. Map and cross-sectional views of relocated seismicity.
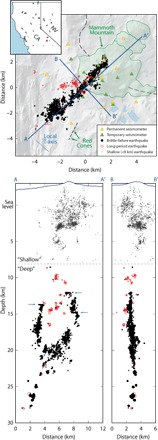
(Top) Map view of deep (8 km+) relocated seismicity. Epicenters fall along a NE striking zone. The outline of dome complex is shaded, and the black dashed line corresponds to the topographic outline of Long Valley Caldera (10). The blue dashed line corresponds to local least compressive stress (T axis) from shallow focal mechanisms (11). (Bottom) Depth cross sections parallel (A-A′) and perpendicular (B-B′) to the NE trend in seismicity. The structure is vertical, with two arms surrounding a nearly aseismic core that hosts most of LP earthquakes. Horizontal features are denoted with arrows. Below 8 km, symbol size scales with magnitude.
Although seismicity spans nearly 30 km vertically, compared with shallow (depths, <4 km) earthquakes, those deeper than ~4 km are comparatively rare (histogram in Fig. 2A). Earthquakes between 4 and 8 km are mostly limited to the “keel” of seismicity associated with the onset of activity in 1989–1990 (12). Mid-crustal (depth, ~8 to 18 km) LP activity clusters into two prolonged episodes from 1997–1999 and 2012–2014. On finer time scales, the LP activity varies from a few located events per day to spasmodic bursts with multiple events per minute. In contrast, the deep brittle-failure earthquakes since 2006 are concentrated in discrete swarms lasting 12 to 36 hours each, which individually show clear migration of hypocenters over the course of a few hours (Fig. 2, B to F, and movie S2). Seismicity in an individual swarm is active almost exclusively in a thin (hundreds of meters wide) band at the leading edge of a migrating front, which can propagate upward, downward, or both simultaneously.
Fig. 2. Spatiotemporal history of deep seismicity.
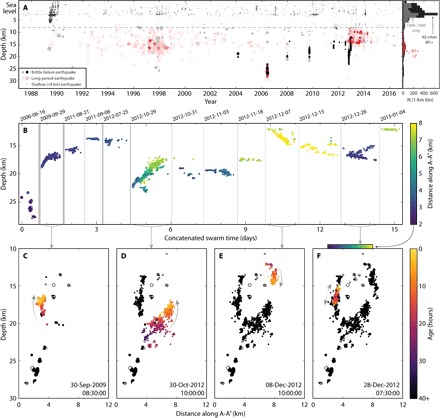
(A) Earthquake occurrence in the past 30 years by depth. Cataloged but not relocated seismicity is plotted at lower opacity. Shallow earthquakes are limited to >M1. Histogram at right bins M1+ earthquakes by depth, colored by type. (B) Expanded view of swarms with 20+ events illustrating migration in depth with time. Successive swarms are concatenated, with time between swarms removed; swarms are separated by vertical bars of thickness that scale to the amount of time removed, and start dates are listed along the top. Color is by location along A-A′ to highlight activity between branches; the color bar is copied below for reference to location within the cross section. (C to F) Views along A-A′ for four large swarms [arrows connecting from (B)] with color denoting time since date in the lower corner corresponding to the end of each swarm; arrows guide direction of migration over time.
During these swarms, we also observed distinct groups of earthquakes exhibiting reversed waveforms (that is, highly negative correlation) with respect to each other on multiple stations. Reversals occurred within minutes or seconds, among earthquakes located within tens of meters of each other, and during both upward and downward migration, suggesting that earthquakes occurred in nearly the same location on faults of similar orientation but with opposite senses of slip. Reversed focal mechanisms have been observed in swarms associated with basaltic intrusions (4, 20–24) and during industrial hydraulic fracture stimulation (25), where opening cracks produce a heterogeneous local stress field.
DISCUSSION
We propose that the earthquakes occurred along a preexisting, thin, nearly vertical fracture zone that enables rapid (kilometers per day), episodic fluid ascent from the lower to mid-crust (Fig. 3). The trend of the zone is nearly perpendicular to the local least compressive stress determined from shallower earthquake focal mechanisms (9). Under the assumption that the stress at depth is similar, this orientation would be favorable to the opening of cracks, consistent with both dike intrusion and opening of a fracture mesh (Fig. 3, insets) to explain reversed focal mechanisms. For the case of a narrow fracture mesh, the focal mechanisms are not perfectly opposite, which is permissible given the uncertainty in our fault plane solutions. In addition, we presume that the brittle-failure earthquakes primarily occurred on a network of preexisting faults, which slipped to accommodate crack opening.
Fig. 3. Annotated conceptual model overlaid on cross section A-A′.

Solid blue arrows note the direction of earthquake migration, which corresponds to the direction of inferred fluid motion. Dashed blue lines indicate gaps between swarms where flow may be aseismic, and horizontal barriers (depicted here as sills) inhibit flow. Fluids are presumably sourced from near-Moho depths and propagate along a preexisting fracture zone. Insets denote two possible views along B-B′ for a dike tip model (top) and a fracture mesh model (bottom) to explain the reversed focal mechanisms. The zone between the arms hosts LP earthquakes, likely of a more plastic rheology than the surrounding rock (for example, partial melt and higher temperatures). Volatiles eventually work toward the shallow subsurface where they may be stored (13, 14) before finally escaping to the surface.
The aseismic zone between the arms of brittle-failure earthquakes is evocative of a magma chamber core, surrounded by a halo of seismicity (26). The few LPs we were able to relocate are contained within this zone. Given that we infer that fluids are moving throughout the zone of seismicity and we only see LPs in the center of the zone, we propose that the spatial segregation of the two kinds of seismicity represents a contrast in rheology such as the presence of partial melt. Their temporal behavior also reflects a longer duration response to injection/pressure events over the span of nearly 2 years compared to the short-lived brittle-failure swarms (Fig. 2A).
The starting and ending points of swarms often correspond to small horizontal features, such as those noted at the top of each arm. Earthquakes in both the vertically and horizontally aligned features exhibit reversals, correlate well with each other, and are otherwise indistinguishable save for their locations. While it is possible that these earthquakes are delimiting conjugate planes to the rest of the structure, we favor the interpretation that these are sills, with seismicity clustered primarily at the bottom of the sill along a thin deformation zone of en echelon fractures of similar orientation to the arms of seismicity formed during emplacement (27). Downward migrating swarms might initiate when a pressure pulse finds a structural weakness at the bottom of a sill and follows a more favorable path downward instead of upward, perhaps due to a change in the local pressure gradient from higher lithostatic pressure in a ductile zone to a lower hydrostatic pressure in a nonductile zone. In addition, the sills themselves may also serve as impermeable barriers, temporarily halting migration.
The nature of the fluid phase remains uncertain. While periodic ascent of new magma may be necessary to keep the aseismic region at least partially molten, the spatial and temporal patterns of seismicity permit both an interpretation as intrusions of basaltic magma or pressure pulses from exsolved volatiles. Previous studies of deep magmatic intrusions relied on geodetic measurements to model the intrusion geometry as a dike (4, 22), but we observe no such deformation at Mammoth Mountain. Migration speeds within individual swarms of 1 to 10 cm/s are equivalent to dike propagation velocities at Kilauea and Iceland (4). If we consider instead pore pressure pulses transmitted along a vertical zone of high permeability (that is, the fracture zone itself), the migration velocities suggest permeability orders of magnitude higher than expected for mid-crustal depths, although still within the limit suggested by other swarms (28). CO2, from a deeper magmatic source and/or exsolved from the aseismic core itself, is a compelling candidate as a means of elevated fluid pressure. Experimental studies have shown that, once CO2 comes out of solution (for example, via shaking or depressurization), it does not easily redissolve (29), and CO2 emissions at Mammoth Mountain are, since 1989, quite high.
Although much of the evidence for fluid propagation beneath Mammoth Mountain is seismic, spatiotemporal gaps between swarms require a component of aseismic flow. Seismicity at these depths is generated under specific conditions rarely attained. This suggests that, for other systems, while fluids could traverse the mid-crust in a matter of days, the transport does not need to be seismic and may otherwise evade routine detection.
CONCLUSIONS
The recent deep earthquakes studied here form the first clear image of the root of the Mammoth Mountain plumbing system as a thin yet dynamic zone of fluid motion, capable of episodically transporting fluids from the lower to mid-crust on short time scales. Migrating swarms of brittle-failure earthquakes reveal a dike-like structure with two arms interspersed with small, sill-like discs. The zone between the arms is largely aseismic, save for swarms of LP earthquakes, which cluster in the middle and top of the zone. We interpret both types of earthquakes as occurring in response to fluids (for example, basaltic magma and volatiles) as they traverse through the lower crust. Mammoth Mountain has not erupted in the past 50,000 years, yet it remains a focus for the flux of fluids from depth. Other inactive systems may likewise remain permeable “chimneys” for millennia.
MATERIALS AND METHODS
Additional detections
Earthquake location and pick information from 1979 to 2017 at all depths were downloaded from the Northern California Earthquake Data Center (NCEDC) in a box surrounding Mammoth Mountain (Fig. 4, boundaries marked by a blue dotted line). Earthquakes were excluded if they had both a depth above 6 km and a magnitude of <M1. Pick information and waveforms for earthquakes with catalog locations deeper than 6 km below sea level from 1995 to 2017 were used to generate templates for finding additional detections in continuous data with a matched-filter approach (16) using the Python open-source package EQcorrscan (18). Waveforms and pick information from a temporary deployment of broadband seismometers around the summit during 2012–2014 (14) were used where available. We markedly reduced computational overhead by only searching for matches to a given template 24 hours before and after its occurrence; most of the seismicity at these depths occur in swarms or bursts lasting several hours, and we were primarily interested in improving detections during these swarms rather than fully documenting their occurrence (or apparent lack thereof) between swarms. We separately ran a subset of templates through a year of continuous data and found that ~70% of unique matches occurred during the bounds of the swarm the templates belonged to and closer to 98% of the highest quality matches. For this work, we used 1394 template events with 3 to 34 channels of data and used a detection threshold of 10*(median absolute deviation)—a measure of when a detection is well above the noise—in 1-hour chunks. Further, we required the average normalized cross-correlation coefficient for a detection to exceed 0.4, which was mostly enforced during periods where the median absolute deviation was artificially lowered due to missing data. Given previous observations of reversed waveforms at Mammoth Mountain (15), we explicitly allowed for negative matches. Under these criteria, we generated 6346 additional detections.
Fig. 4. Map of local permanent seismic network of Mammoth Mountain and nearby Long Valley Caldera.
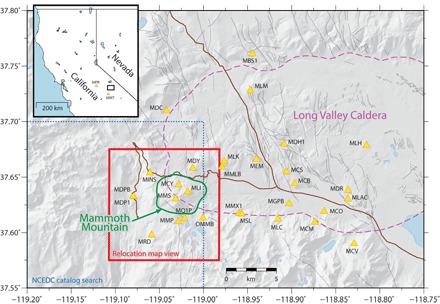
Temporary stations are not shown. The dotted blue box shows the extent of the original NCEDC earthquake catalog search, and the red box corresponds to the map view shown in Fig. 1. The inset map also shows two distant stations used in focal mechanism determination.
Precise relative relocation
We used HypoDD (17) to better constrain the locations of the cataloged and newly detected seismicity. We included both shallow and deep earthquakes, but those with depths shallower than 6 km were filtered to require ≥M1 so as not to dominate the inversion but still provide a common reference frame between shallow and deep seismicity. Differential times from analyst picks and subsample waveform cross-correlation were used for both P and S arrivals and assumed common starting location and pick times between new detections and their best matching catalog event. For cross-correlation differential times, we assigned weight as (cccmax)2 * min(1, 10*(cccmax − cccnextmax)), where cccmax is the absolute maximum normalized cross-correlation coefficient (minimum, 0.4), and cccnextmax is the next highest absolute peak in the cross-correlation function. This permits well-determined differential times to carry greater weight in the inversion while allowing yet punishing differential times that have a high chance of cycle skipping. In addition, allowing for negative cross-correlation coefficients enables more high-quality pairs between earthquakes with different focal mechanisms. We began the first iterations of the double-difference inversion with maximum weight on catalog differential times to define the macroscale structure and then increased the weight on waveform cross-correlation differential times in later iterations to resolve finer-scale features. We then required final earthquake locations to be constrained by at least 20 differential time pairs, although most of the best constrained locations have several hundred observations. Of the 9531 input events, 6491 were successfully relocated with HypoDD, and 4419 met the constraints for plotting. Finally, we further increased the explicit depth separation between shallow and deep events to 8 km for cleaner plotting in map view once it became clear where the shallowest LP events were finally located. The velocity model used for relocation is included in table S1 (30), with Vp/Vs = 1.6, as suggested by previous tomographic studies (14). Relocations presented here were insensitive to the choice of the velocity model. Figure S1 shows the small difference in relocations when using a higher Vp/Vs ratio of 1.73. The absolute locations of most of the seismicity at depth were shifted approximately 400 to 500 m, but all of the features we interpreted in the text remained intact.
Frequency content
We observed that there are two classes of deep earthquakes beneath Mammoth Mountain based on their frequency content. LP earthquakes are depleted in higher frequencies compared to brittle-failure earthquakes of the same magnitude and depth and, at Mammoth Mountain, have peak energy in the 2- to 5-Hz band. These earthquakes were flagged by an analyst as “L type” in the catalog. We further quantify the difference in frequency content between classes with the frequency index (FI) (31), a ratio of Fourier amplitude (A) in an upper frequency band to a lower frequency band
| (1) |
where brittle-failure earthquakes tend to have FI ≥ 0, and LP earthquakes have FI < 0. We used 5 to 10 Hz as the upper frequency band and 1 to 2.5 Hz as the lower frequency band over a 10.24-s window following the P wave and averaged the results from multiple stations. Figure 5 shows that the earthquakes form a bimodal distribution consistent with analyst labels. We used FI = 0 as the explicit cutoff between the two classes of seismicity in our discussion and figures.
Fig. 5. Example waveforms and histogram of earthquake frequency content.
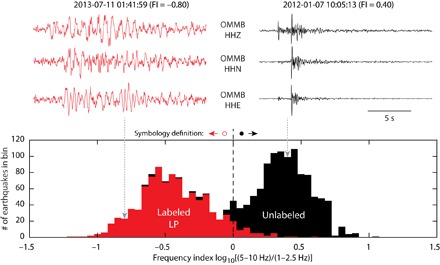
Waveforms from LP and brittle-failure earthquakes are located 241 m apart and recorded at the same broadband station (OMMB). Bins by FI [that is, ratio of high-frequency to low-frequency energy (31)] show a bimodal distribution separating LP seismicity (as labeled by an analyst) from brittle-failure seismicity. The dashed line indicates separation in symbology used in figures. Arrows denote the bins to which the earthquakes belong.
First motion focal mechanisms
Focal mechanisms were routinely determined on the basis of first-motion picks; however, few solutions exist at Mammoth Mountain for earthquakes below the 10-km depth due to the deterioration of focal sphere coverage with increasing depth and the small magnitudes of the earthquakes. P wave arrivals were commonly clear, and first motions were easily picked at three stations at the edge of the local network: MRD, MDC, and MCV (Fig. 4). First-order trends in possible focal mechanisms can be determined by looking at the different combinations of first-motion picks at these three stations (table S2). The two most common combinations by far have MDC with opposite polarity of MRD and MCV, consistent with a focal plane of strike and dip close to that of the trend of the relocated seismicity. We were able to determine representative double-couple focal mechanisms on a small number of relatively well-recorded earthquakes (Fig. 6). We used HASH (32) without P/S amplitudes, as most of our stations are a single component, and assumed relocated hypocenters.
Fig. 6. Representative first-motion double-couple focal mechanisms for brittle-failure earthquakes.
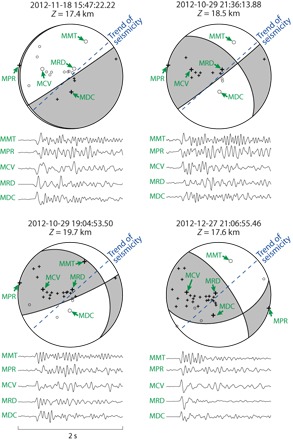
Below each mechanism is a subset of associated waveforms. Most solutions have a steeply dipping nodal plane close to the strike of the trend of seismicity but a wide variety in slip vectors. The bottom right mechanism is an example that does not follow this pattern.
Supplementary Material
Acknowledgments
We thank J. Lowenstern, S. Prejean, and three anonymous reviewers for the thorough and insightful reviews. Funding: This research was funded by the U.S. Geological Survey Mendenhall Research Fellowship Program. Author contributions: A.J.H.-E. performed the analyses based on the methodology by D.R.S. A.J.H.-E. prepared the initial draft and visualizations. All authors contributed to the conceptualization, interpretation, and editing of the manuscript. Competing interests: The authors declare that they have no competing interests. Data and materials availability: All raw data (including waveforms, initial locations, and pick information) are available through NCEDC (http://ncedc.org/) or Incorporated Research Institutions for Seismology (www.iris.edu/hq/; network code 8E), all codes used are open source, and all scripts/derived data are available upon request. Any use of trade, firm, or product names is for descriptive purposes only and does not imply endorsement by the U.S. government. All data needed to evaluate the conclusions in the paper are present in the paper and/or the Supplementary Materials. Additional data related to this paper may be requested from the authors.
SUPPLEMENTARY MATERIALS
Supplementary material for this article is available at http://advances.sciencemag.org/cgi/content/full/4/8/eaat5258/DC1
Fig. S1. Difference in relocations using different Vp/Vs ratios.
Movie S1. Three-dimensional rotation of cataloged and relocated hypocenters.
Movie S2. Migration of hypocenters in 30-min windows across A-A′.
Table S1. Velocity model used for relocation.
Table S2. Occurrence of combinations of first-motion picks.
REFERENCES AND NOTES
- 1.Power J. A., Stihler S. D., White R. A., Moran S. C., Observations of deep long-period (DLP) seismic events beneath Aleutian arc volcanoes; 1989–2002. J. Volcanol. Geotherm. Res. 138, 243–266 (2004). [Google Scholar]
- 2.R. A. White, Precursory deep long-period earthquakes at Mount Pinatubo: Spatio-temporal link to a basalt trigger, in Fire and Mud: Eruptions and Lahars of Mount Pinatubo, Philippines (Univ. of Washington Press, 1996), pp. 307–328. [Google Scholar]
- 3.Nichols M. L., Malone S. D., Moran S. C., Thelen W. A., Vidale J. E., Deep long-period earthquakes beneath Washington and Oregon volcanoes. J. Volcanol. Geotherm. Res. 200, 116–128 (2011). [Google Scholar]
- 4.White R. S., Drew J., Martens H. R., Key J., Soosalu H., Jakobsdóttir S. S., Dynamics of dyke intrusion in the mid-crust of Iceland. Earth Planet. Sci. Lett. 304, 300–312 (2011). [Google Scholar]
- 5.Hudson T. S., White R. S., Greenfield T., Ágústsdóttir T., Brisbourne A., Green R. G., Deep crustal melt plumbing of Bárðarbunga volcano, Iceland. Geophys. Res. Lett. 44, 8785–8794 (2017). [Google Scholar]
- 6.Greenfield T., White R. S., Building Icelandic igneous crust by repeated melt injections. J. Geophys. Res. 120, 7771–7788 (2015). [Google Scholar]
- 7.Pitt A. M., Hill D. P., Walter S. W., Johnson M. J. S., Midcrustal, long-period earthquakes beneath Northern California volcanic areas. Seismol. Res. Lett. 73, 144–152 (2002). [Google Scholar]
- 8.Chouet B., Resonance of a fluid-driven crack: Radiation properties and implications for the source of long-period events and harmonic tremor. J. Geophys. Res. 93, 4375–4400 (1988). [Google Scholar]
- 9.Julian B. R., Volcanic tremor: Nonlinear excitation by fluid flow. J. Geophys. Res. 99, 11859–11877 (1994). [Google Scholar]
- 10.W. Hildreth, J. Fierstein, Eruptive history of Mammoth Mountain and its mafic periphery, California (Professional Paper 1812, U.S. Geological Survey, 2016).
- 11.Prejean S., Ellsworth W., Zoback M., Waldhauser F., Fault structure and kinematics of the Long Valley Caldera region, California, revealed by high-accuracy earthquake hypocenters and focal mechanism stress inversions. J. Geophys. Res. 107, 2355 (2002). [Google Scholar]
- 12.Hill D. P., Prejean S., Magmatic unrest beneath Mammoth Mountain, California. J. Volcanol. Geotherm. Res. 146, 257–283 (2005). [Google Scholar]
- 13.Sorey M. L., Evans W. C., Kennedy B. M., Farrar C. D., Hainsworth L. J., Hausback B., Carbon dioxide and helium emissions from a reservoir of magmatic gas beneath Mammoth Mountain, California. J. Geophys. Res. 103, 15303–15323 (1998). [Google Scholar]
- 14.Dawson P., Chouet B., Pitt A., Tomographic image of a seismically active volcano: Mammoth Mountain, California. J. Geophys. Res. 121, 114–133 (2016). [Google Scholar]
- 15.Shelly D. R., Hill D. P., Migrating swarms of brittle-failure earthquakes in the lower crust beneath Mammoth Mountain, California. Geophys. Res. Lett. 38, L20307 (2011). [Google Scholar]
- 16.Shelly D. R., Moran S. C., Thelen W. A., Evidence for fluid-triggered slip in the 2009 Mount Rainier, Washington earthquake swarm. Geophys. Res. Lett. 40, 1506–1512 (2013). [Google Scholar]
- 17.Waldhauser F., Ellsworth W. L., A double-difference earthquake location algorithm: Method and application to the Northern Hayward Fault, California. Bull. Seismol. Soc. Am. 90, 1353–1368 (2000). [Google Scholar]
- 18.Chamberlain C. J., Hopp C. J., Boese C. M., Warren-Smith E., Chambers D., Chu S. X., Michailos K., Townend J., EQcorrscan: Repeating and near-repeating earthquake detection and analysis in Python. Seismol. Res. Lett. 89, 173–181 (2017). [Google Scholar]
- 19.Frassetto A. M., Zandt G., Gilbert H., Owens T. J., Jones C. H., Structure of the Sierra Nevada from receiver functions and implications for lithospheric foundering. Geosphere 7, 898–921 (2011). [Google Scholar]
- 20.Key J., White R. S., Soosalu H., Jakobsdóttir S. S., Multiple melt injection along a spreading segment at Askja, Iceland. Geophys. Res. Lett. 38, L05301 (2011). [Google Scholar]
- 21.Rubin A. M., Gillard D., Got J.-L., A reinterpretation of seismicity associated with the January 1983 dike intrusion at Kilauea Volcano, Hawaii. J. Geophys. Res. 103, 10003–10015 (1998). [Google Scholar]
- 22.Smith K. D., von Seggern D., Blewitt G., Preston L., Anderson J. G., Wernicke B. P., Davis J. L., Evidence for deep magma injection beneath Lake Tahoe, Nevada-California. Science 305, 1277–1280 (2004). [DOI] [PubMed] [Google Scholar]
- 23.Smith K. D., Kent G. M., von Seggern D. P., Driscoll N. W., Eisses A., Evidence for Moho-lower crustal transition depth diking and rifting of the Sierra Nevada microplate. Geophys. Res. Lett. 43, 10738–10744 (2016). [Google Scholar]
- 24.J. A. Hutchinson, Relocation and analysis of the 2007 Nechako, B.C., seismic swarm: Evidence for magmatic intrusion in the lower crust, thesis, Western Washington University, Bellingham, WA (2012). [Google Scholar]
- 25.Rutledge J. T., Phillips W. S., Mayerhofer M. J., Faulting induced by forced fluid injection and fluid flow forced by faulting: An interpretation of hydraulic-fracture microseismicity, Carthage Cotton Valley Gas Field, Texas. Bull. Seismol. Soc. Am. 94, 1817–1830 (2004). [Google Scholar]
- 26.Moran S. C., Seismicity at Mount St. Helens, 1987–1992: Evidence for repressurization of an active magmatic system. J. Geophys. Res. 99, 4341–4354 (1994). [Google Scholar]
- 27.Kavanagh J. L., Menand T., Sparks R. S. J., An experimental investigation of sill formation and propagation in layered elastic media. Earth Planet. Sci. Lett. 245, 799–813 (2006). [Google Scholar]
- 28.Ingebritsen S. E., Manning C. E., Permeability of the continental crust: Dynamic variations inferred from seismicity and metamorphism. Geofluids 10, 193–205 (2010). [Google Scholar]
- 29.Crews J. B., Cooper C. A., Experimental evidence for seismically initiated gas bubble nucleation and growth in groundwater as a mechanism for coseismic borehole water level rise and remotely triggered seismicity. J. Geophys. Res. 119, 7079–7091 (2014). [Google Scholar]
- 30.Fliedner M. M., Klemperer S. L., Christensen N. I., Three-dimensional seismic model of the Sierra Nevada arc, California, and its implications for crustal and upper mantle composition. J. Geophys. Res. 105, 10899–10921 (2000). [Google Scholar]
- 31.H. Buurman, M. E. West, Seismic precursors to volcanic explosions during the 2006 eruption of Augustine volcano, in The 2006 Eruption of Augustine Volcano, Alaska, J. A. Power, M. L. Coombs, J. T. Freymueller, Eds. (Professional Paper 1769, U.S. Geological Survey, 2010). [Google Scholar]
- 32.Hardebeck J. L., Shearer P. M., A new method for determining first-motion focal mechanisms. Bull. Seismol. Soc. Am. 92, 2264–2276 (2002). [Google Scholar]
Associated Data
This section collects any data citations, data availability statements, or supplementary materials included in this article.
Supplementary Materials
Supplementary material for this article is available at http://advances.sciencemag.org/cgi/content/full/4/8/eaat5258/DC1
Fig. S1. Difference in relocations using different Vp/Vs ratios.
Movie S1. Three-dimensional rotation of cataloged and relocated hypocenters.
Movie S2. Migration of hypocenters in 30-min windows across A-A′.
Table S1. Velocity model used for relocation.
Table S2. Occurrence of combinations of first-motion picks.


