

Abstract
The molecular program by which embryonic ectoderm is induced to form neural tissue is essential to understanding normal and impaired development of the central nervous system. Xenopus has been a powerful vertebrate model in which to elucidate this process. However, abundant vitellogenin (yolk) proteins in cells of the early Xenopus embryo interfere with protein detection by high-resolution mass spectrometry (HRMS), the technology of choice for identifying these gene products. Here, we systematically evaluated strategies of bottom-up proteomics to enhance proteomic detection from the neural ectoderm (NE) of X. laevis using nanoflow high-performance liquid chromatography (nanoLC) HRMS. From whole embryos, high-pH fractionation prior to nanoLC-HRMS yielded 1319 protein groups vs 762 proteins without fractionation (control). Compared to 702 proteins from dorsal halves of embryos (control), 1881 proteins were identified after yolk platelets were depleted via sucrose-gradient centrifugation. We combined these approaches to characterize protein expression in the NE of the early embryo. To guide microdissection of the NE tissues from the gastrula (stage 10), their precursor (midline dorsal-animal, or D111) cells were fate-mapped from the 32-cell embryo using a fluorescent lineage tracer. HRMS of the cell clones identified 2363 proteins, including 147 phosphoproteins (without phosphoprotein enrichment), transcription factors, and members from pathways of cellular signaling. In reference to transcriptomic maps of the developing X. laevis, 76 proteins involved in signaling pathways were gene matched to transcripts with known enrichment in the neural plate. Besides a protocol, this work provides qualitative proteomic data on the early developing NE.
Keywords: Mass spectrometry, proteomics, neural ectoderm, Xenopus laevis

INTRODUCTION
Formation of the vertebrate central nervous system begins with the induction of embryonic cells of the ectoderm to a neural fate. Amphibians have long been used as models for the study of neural ectoderm (NE) induction.1–3 The South African clawed frog (Xenopus laevis) offers particular advantages for basic biological and translational studies on normal and impaired development (reviewed in refs 4–7). Embryos of Xenopus laevis develop externally to the mother, are much larger (1–1.5 mm in diameter) than those of mouse or fish, develop rapidly (~15 h from fertilization to neurulation), and are amenable to surgical and molecular interventions.8 Furthermore, these embryos undergo stereotypical development: The Xenopus laevis NE arises predominantly from the midline dorsal-animal cell of the 32-cell embryo9 (see Figure 1). While considerable progress has been made in characterizing morphological and molecular processes during NE induction and their significance to development (reviewed in refs 10 and 11), the comprehensive suite of molecules underpinning neural tissue development is yet to be determined.
Figure 1.
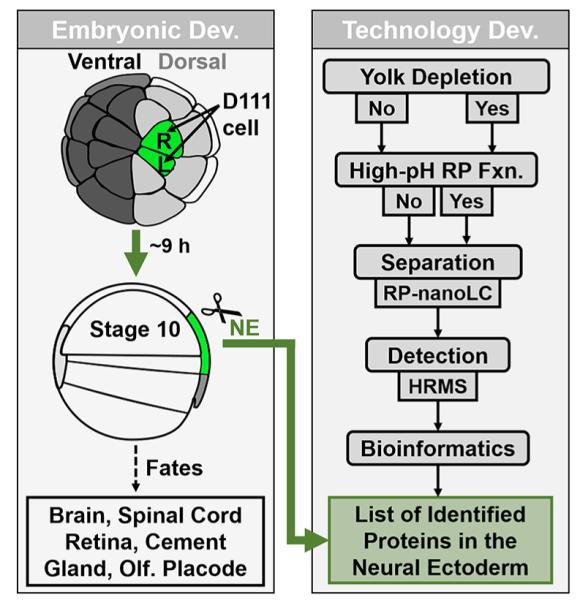
Workflow for the proteomic characterization of the neural ectoderm (NE) fated cell clones in Xenopus laevis. (Left panel) Labeling of the NE precursor cells, the left and right midline dorsal-animal (D111) cells of the 32-cell embryo. (Right panel) Analytical steps for protein detection integrating yolk depletion by density gradient centrifugation, high-pH reversed-phase (RP) fractionation (Fxn.) of peptides and separation by low-pH RP nanoflow liquid chromatography (nanoLC) prior to detection by high-resolution mass spectrometry (HRMS).
Much of our knowledge on neural development comes from decades of innovative embryological manipulations and molecular biological studies, many using X. laevis. Embryonic explant-based screening of growth factors revealed that antibone morphogenetic protein (BMP) factors and Wnt (wingless) and fibroblast growth factor (FGF)signaling are involved in neural induction.2 Knock-down and overexpression studies found maternally expressed transcription factors, such as sox11, zic2, foxD5, and geminin, to induce the expression of neural genes later in development.1,3 More recently, comprehensive transcriptomic and proteomic analyses of ectodermal cells generated from human induced pluripotent stem cells corroborated the involvement of Wnt/β-catenin, the transforming growth factor (TGF-β) superfamily, and nuclear factor κB (NF-κB) signaling pathways during ectodermal cell differentiation.12 Moreover, there is emerging evidence that small molecules also can impact neural tissue development. For example, purine has been found to trigger the expression of eye field transcription factors and eye development.13 Likewise, the small molecules (metabolites) acetylcholine, methionine, threonine, and histidine have been shown to alter neural vs epidermal tissue fates in X. laevis.14 These results highlight the importance of studying a broad variety of molecules to understand the intricacy of neural induction, ranging from genes and transcripts to proteins and metabolites.
Technological innovations provided new insights into the spatial and temporal organization of these molecules in X. laevis. Using polymerase chain reaction, microarrays, RNA-Seq, and recently, next-generation sequencing, transcriptional changes were found to unfold as the cleavage stage embryo develops to gastrulae15 and then neurulae.16,17 In parallel, shotgun (bottom-up) proteomics by high-resolution mass spectrometry (HRMS) augmented transcriptomic data with information on the expression of thousands of proteins18,19 and their post-translational modification (e.g., phosphorylation)20 in the early developing whole embryo. For example, iTRAQ-based quantification of ~4000 proteins captured sudden changes upon midblastula transition as the X. laevis progressed from a fertilized egg to stage 22 embryo,21 when many primary organ precursors are formed. Recent studies have found surprising complexity in mRNA-protein dynamics,19,22 thus calling for the dual use of mRNA sequencing and proteomics by HRMS to better understand embryonic development.
Improvements in HRMS sensitivity ushered proteomic investigations to single cells, providing previously unavailable insights into cell and developmental biology. Using nanoflow liquid chromatography (nanoLC) HRMS, nucleocytoplasmic partitioning was probed for ~9000 different proteins by microdissecting nuclei from X. laevis oocytes, revealing passive retention, rather than active transport, to be responsible for maintaining the nuclear and cytoplasmic proteomes.23 Additionally, recent advances in single-cell HRMS (reviewed in refs 24 and 25) uncovered proteomic26,27 and metabolomic14,28–30 differences between identified cells that form the dorsal-ventral, animal-vegetal, or left–right axis in 8-, 16-, or 32-cell X. laevis embryos. Remarkably, metabolomic or proteomic cell heterogeneity was only partially detectable at the level of transcripts.31 These single-cell proteomic data provide information on the translation of genes that are important to neural fate determination, including geminin and isthmin.26 Because these molecular cell differences are unaccounted for during traditional whole-embryo measurements, there is a need for new approaches that can provide tissue- or cell-type specific information on molecular changes during development.
To address this knowledge gap, we developed a tissue-specific HRMS-based methodology that allows the characterization of protein expression in NE-fated cell clones of the X. laevis gastrula. After classical cell fate mapping of the clones, the labeled tissues were microdissected. The proteins were extracted and detected via a bottom-up (shotgun) approach, whereby proteotypic peptides were generated by tryptic digestion and identified using discovery HRMS. For deeper coverage of the gene-encoded proteome, we systematically tested methodologies to reduce the concentration of abundant proteins extracted from the tissues, which typically challenge identification, and to simplify peptide complexity prior to HRMS. The resulting methodology allowed ~2300 protein groups and ~150 phosphorylated proteins to be identified (without phosphoprotein enrichment) from the NE-fated tissue of the early gastrula-stage embryo. By complementing information on mRNA expression, these proteomic data raise possibilities for follow-up studies to better understand molecular mechanisms of NE induction in the vertebrate embryo.
RESULTS AND DISCUSSION
Abundant Yolk Challenges Protein Detection in Xenopus Tissues.
The purpose of this study was to characterize proteins that are expressed in the neural ectoderm (NE), which is a prerequisite for the formation of the central nervous system. We selected X. laevis as the model, for which decades of research have identified many genes with important roles in neural tissue induction. For example, induction of the NE depends on an intricate interplay between transcription factors (e.g., sox11, zic2, foxD5, and geminin), secreted proteins (e.g., anti-BMP factors), and signaling pathways, such as Wnt and FGF (see reviews in ref 11). Because of complex dynamics between transcription and translation in developing embryos,19 there is a high need for the direct analysis of proteins to better understand molecular mechanisms of tissue induction, which we provide in this study.
To characterize protein production in NE-fated tissues, we here integrated classical embryological microsurgery with untargeted proteomics by HRMS. Figure 1 illustrates our experimental approach. It begins with the labeling of the NE-fated cell clones by an inert fluorescence tracer in the 32-cell embryo, namely a dextran-conjugated fluorescent dye (Alexa Fluor 488). After culturing the embryo to stage 10, the labeled cell clones were dissected and processed for bottom-up proteomic analysis: Proteins were extracted and digested to peptides, and peptides were detected by nanoLC-HRMS. To improve protein identification, we tested two distinct strategies. High-pH reversed-phase (Hp-RP) fractionation was implemented to reduce peptide complexity prior to nanoLC-HRMS. The other approach used gradient-based fractionation to reduce the abundance of yolk platelets prior to HRMS.
As a control, a standard bottom-up proteomic workflow was applied on whole embryos (Figure 2). Proteins were extracted from n = 5 embryos (stage 10) in the lysis buffer, digested, and 1 μg of the resulting peptides (confirmed by a Total Peptide Assay) were analyzed by nanoLC-nanoESI-HRMS (see Methods). A total of 3592 peptides were identified, which could be assigned to 782 different protein groups against the X. laevis proteome (see Methods). A comprehensive list of the identified proteins is provided in Supplementary Table 1 (Table S1). Calculated label-free quantification (LFQ) intensities suggested that detected proteins occupied an ~5 log-order dynamic range (Figure 2A), highlighting significant molecular complexity. In the lower domain of concentration range, representative proteins included gene products with important roles during development. For example, protein phosphatase 2 regulatory subunit A (Ppp2r1a), a protein involved in the FGF signaling pathway, is essential for embryonic patterning,17 and profilin-1 (Pfn-1), which binds to actin to regulate the structure of the cytoskeleton, is essential for cell migration during development.32 In the middle domain of the concentration range, transcription factors were detected, including staphylococcal nuclease domain containing protein 1 (Snd1) and high mobility group box 2 (Hmgb2), which are involved in cellular proliferation.33,34 The middle–high domain of the concentration window was populated by common house-keeping proteins, such as glyceraldehyde-3-phosphate dehydrogenase (Gapdh) and fructose-bisphosphate aldolase (Aldoa and Aldoc), which are key to the glycolysis pathway, and ribosomal proteins that regulate protein translation. At highest concentrations, the different chains of vitellogenin were detected (Vtga1, Vtga2, Vtgb1, and Vtgb2). Based on the calculated LFQ intensities, which approximate protein abundances,35 these yolk proteins accounted for ~87% of the total protein abundance in the embryo. In agreement with this result, yolk proteins are known to account for ~90% of the total protein content of the X. laevis egg, which provides a source of rich nutrients for the early developing embryo.36
Figure 2.

Challenges in protein identification in Xenopus laevis tissues. (A) Calculated label-free quantification (LFQ) intensities revealing a broad dynamic range of protein concentration, exacerbated by an overabundance of vitellogenin (Vtg) a2 and b1 proteins. (B) Comparison of peptide spectral matches (PSMs) by yolk and non-yolk proteins, revealing significant interference during data-dependent acquisition of PSMs. Percent yolk PSMs represents the number of PSMs from the Vtg chains compared to the total number of PSMs and is binned across separation time.
These abundant vitellogenin proteins were expected to interfere with the detection of other proteins. In addition to being present at high concentration, yolk proteins are appreciably large, thus giving rise to numerous peptides upon tryptic digestion, each with high abundance. For example, in silico digestion by trypsin predicts Vtga2 (~200 kDa) to yield at least ~100 peptides with >5 amino acids in length (no missed cleavages, no modifications), and this peptide complexity is further expanded by variable modifications. Figure 2B evaluates detection of peptide signals in the control sample. The yolk proteins gave rise to a massive spectral background covering the entire span of the separation window: ~15–65% of peptide spectral matches (PSMs) were attributed to Vtga1, Vtga2, Vtgb1, and Vtgb2 as nanoLC separation unfolded. During data-dependent acquisition (DDA) of PSMs, peptide signals from these overabundant proteins were expected to challenge the identifications of non-yolk proteins by interfering with ion generation during ESI, saturating the duty cycle during MS or MS/MS events and/or biasing MS/MS transitions against peptide signals present at lower signal intensity.
High-pH Reversed-Phase Fractionation Improved Protein Identification.
For protein identifications to improve, the experimental workflow necessitated a revision. Encouraged by the success of orthogonal separations in reducing peptide complexity, we adapted high-pH reversed-phase (RP) fractionation prior to low-pH nanoLC. After proteins were extracted from whole X. laevis embryos (stage 10) and digested by trypsin, ~43 μg of peptides (confirmed by a Total Peptide Assay) were sequentially eluted from a C18 column at high pH using increasing concentrations of acetonitrile (7.5%, 15.0%, 22.5%, 30.0%, and 50.0%). Embryos were processed without peptide fractionation as a control. The resulting peptide samples were analyzed (1 μg/run) in technical duplicate using low-pH nanoLC-nanoESI-HRMS, as described earlier.
Detection performance was compared between these approaches (Figure 3A). Cumulatively, 1319 proteins were identified between the 5 fractions vs 767 proteins from the control (Figure 3A), representing an ~70% improvement in identifications by fractionation. A comprehensive list of identified proteins is provided in Table S2. Fractionation uncovered nearly all proteins that also were detected in the control, including many transcription factors (e.g., Hmgb2, transcription factor A, or Tfam) as well as proteins involved in translation (e.g., eukaryotic translation initiation factor 3 subunits a and e, or Eif3a and Eif3e, respectively), some with known enrichment in neural tissues (e.g., fascin actin-bundling protein 1, or FSCN1, and proliferation-associated 2G4, or Pa2g4). Importantly, 567 proteins were only detectable by high-pH fractionation, but not in the control. Representative proteins included the high mobility group box 3 (Hmgb3) and purine-rich element binding protein A (Pura), which are known to be expressed in neural tissues (as reported on Xenbase).37
Figure 3.

High-pH reversed-phase fractionation for enhancing protein detection. (A) Comparison of number of proteins identified by fractionation (Fxn.) vs the control (Ctrl.). Representative transcription factors are highlighted. (B) Comparison of protein abundances based on log-transformed and mean-normalized LFQ intensities. Lower mean concentration for proteins that were exclusively quantified by fractionation (Excl.) suggested sensitivity improvement. Each data point corresponds to a different protein. Dashed lines indicate the mean. Statistical significance is marked at **p < 0.01. (C) Comparison of number of peptides identified between the high-pH fractions. Numbers in parentheses give the percentage portion of yolk-related peptides for each fraction.
Quantitative performance was assessed based on calculated LFQ intensities. Figure 3B compares protein quantities between equal amounts of protein digest using log10-transformed and mean-normalized LFQ intensities. Proteins that were only quantifiable by fractionation had a significantly lower distribution mean than the control, revealing higher detection sensitivity upon fractionation. We ascribe these qualitative and quantitative improvements to a combination of factors. As shown in Figure 3C, each of the 5 fractions allowed a complementary set of peptides to be identified. Therefore, fractionation efficiently reduced peptide complexity over the temporal domain of separation, which in turn improved the duty cycle of DDA for identifying PSMs. However, although fractionation enhanced protein identification, it could not lower the abundance of yolk proteins. Between 3% and 18% of peptides that were identified in the respective fractions corresponded to yolk proteins (see Figure 3C). Moreover, LFQ estimated the vitellogenin proteins (forms a1, a2, b1, and b2) to amass to ~84% of the total protein abundance in the extracted sample with vtga2 and b1 present in ~4 log-order higher concentration than the mean (see Figure 3B). It follows that abundant yolk proteins likely still interfered with the identification of other proteins.
Yolk Depletion Enhanced Protein Identification.
As an alternative, we evaluated depletion of abundant vitellogenin proteins to improve identification (Figure 4). In Xenopus, yolk is compartmentalized in platelets within each cell of the embryo.36 Therefore, depleting the tissue of these organelles should reduce the concentration of the yolk proteins. We tested this approach by adapting sucrose density-gradient centrifugation into the workflow by modifying a recent protocol (see Methods).18 To test the workflow toward the NE-fated cell clones, which are formed in the dorsal-animal half of the embryo and requires fluorescent labeling with dissection, we tested this approach to a pool of dorsal-animal halves that were isolated from n = 5 embryos at stage 10. Figure 4A depicts the process of yolk depletion. After processing the tissue in the yolk depletion buffer, the homogenate was centrifuged to obtain 3 layers that were readily discernible by visual inspection: lipids, proteins, and yolk were segregated in agreement with the previous protocol.18 To minimize protein losses, the protein and lipid layers were mixed, and the resulting aliquot was transferred into a separate tube, where proteins were purified by precipitation in chloroform/methanol. As control, dorsal halves of the embryos were processed in the lysis buffer (without yolk depletion). In follow-up experiments, the control, yolk-depleted sample, and the yolk layer were separately analyzed. A total of 1 μg peptide mixture was measured in technical duplicate from each sample using nanoLC-HRMS.
Figure 4.

Yolk depletion for improving protein detection. (A) Workflow for depleting yolk platelets using sucrose gradient centrifugation. Scale bars = 2 mm. (B) Comparison of number of proteins identified by the control and yolk depletion. (C) Comparison of protein abundances in the control and yolk-depleted aliquots (Depl.) based on log-transformed and mean-normalized LFQ intensities. Proteins exclusively quantified by yolk depletion had a significantly lower mean, revealing sensitivity improvement. Statistical significance is marked at **p < 0.01. (D) Representative signaling pathways by the proteins identified commonly in the control and exclusively by yolk depletion (see pathways in text).
These data were used to test whether yolk depletion aided the detection of non-yolk proteins. Based on LFQ, the yolk pellet was enriched in vitellogenin proteins to ~97% abundance. The yolk-depleted supernatant contained ~29% yolk proteins by LFQ as compared to ~87% yolk in the control (Figure 4A). While not exhaustive, this extent of depletion significantly improved protein identifications. Compared to 702 identified proteins in the control, the yolk-depleted protein sample yielded 1881 proteins with 1215 of these proteins only identifiable upon depletion (Figure 4B). A comprehensive list of identified proteins is tabulated in Table S3. The mean of the LFQ distribution was significantly lower for the proteins exclusively identified by depletion than in the control (see Figure 4C). Therefore, yolk depletion significantly improved the sensitivity of protein identification.
Gene ontology annotation by PANTHER provided information to query the molecular roles of the identified proteins. As shown in Figure 4D, 51 of the proteins that were identified after yolk depletion are known members of important signaling pathways, thus providing validation for the biological significance of our proteomics data. The pathways of cytoskeletal regulation by Rho GTPases, Wnt, integrin, fibroblast growth factor (FGF) included 10–20 proteins/pathway. About 5–10 proteins were assigned to the cadherin (Cadh), Ras, and platelet-derived growth factor (PDGF) pathways. The insulin growth factor (IGF), Notch, bone morphogenetic proteins (BMPs), and transforming growth factor β (TGF-β) signaling pathways were detected with 2–5 proteins/pathway coverage. Notably, coverage of these pathways was significantly improved upon yolk depletion. These proteins included mitogen activated protein kinase (Mapk1), Mapk kinase (Map2k), P21 protein activated kinase 2 (PAK2), and ribosomal protein S6 kinase A3 (Rps6a3) that are essential mediators of growth factor signaling. Moreover, the Notch and BMP pathways were only represented by proteins that were detectable after yolk depletion. Detection of these developmentally significant pathways demonstrated sufficient sensitivity for assessing protein expression in X. laevis.
Protein Detection from NE-Fated Clones.
Last, we applied this methodology to characterize protein production as the induction of the NE starts in the stage 10 embryo (Figure 5). The experiments began with lineage tracing of the midline dorsal-animal cell of the 32-cell stage embryo, called the D111 cell (by Jacobson nomenclature,38 also known as the A1 cell by the Nakamura nomenclature39); this cell reproducibly gives rise to the NE in X. laevis.9 To label the NE-fated tissue, the left and right D111 cells were injected with ~1 nL of 0.5% (w/v) fluorescent dextran, and the embryos were cultured to stage 10. Figure 5A shows the fluorescently marked D111 cells and their progeny in the right half of the stage 10 embryo using epifluorescence microscopy supplemented with bright-field imaging. The labeled tissues were microdissected and pooled from n = 5 different embryos for proteomic analysis, yielding ~100 μg of total protein material. To maximize protein identifications in these samples, yolk platelets were depleted, and digested proteins were Hp-RP fractionated. To improve detection by enhancing ionization efficiency and MS/MS sequence coverage via selective chemical modification (reviewed in ref 40), peptides were tagged with tandem mass tags (TMT, Thermo) before measurement of 1 μg of peptide mixture in technical duplicate using nanoLC-HRMS.
Figure 5.

Proteomic analysis of neural ectoderm (NE)-fated cell clones. (A) Merged epifluorescence and bright-field images showing the fluorescently labeled D111 cells in the 32-cell embryo and their clones in the midline of the hemisected early gastrula (stage 10), adjacent to the blastocoel (BL). Scale bars = 175 μm. Key: V, ventral; D, dorsal; R, right; L, left; AN, animal; VG, vegetal. (B) Dynamic range of 2,318 proteins quantified in the D111 cell clones (gray data), highlighting members of important signaling pathways. Key: Each data point (gray or colored) corresponds to a different protein. (C) General representation of key FGF pathway proteins and interactions via direct binding and/or activation (solid lines) and predicted regulatory interplay (dotted lines). Transcript-level neural enrichment is highlighted in color (see Table 1 for the color key).
The resulting data provided rich information on proteins expressed in the early NE. A total of 2363 protein groups were identified in the clones. Based on LFQ, 2318 of these proteins were quantified across an ~5-log-order range in concentration, revealing a comparably broad quantitative dynamic range of expression to the whole embryo. A comprehensive list of the identified proteins is provided in Table S4. It is worth noting that identification of ~2400 proteins from 1 μg peptides analyzed per run per fraction (5 μg total measured across 5 fractions) using sucrose-gradient-based yolk depletion in this study indicates sensitivity improvement over a recently optimized protocol, in which the use of mammalian Cell-PE LB lysing buffer (NP40) and filter-aided protein sample processing (FASP) enabled the identification of 4957 proteins by analyzing 30 μg of peptide mixture across 15 fractions with each measured in technical triplicate.41
Without phospho-enrichment employed in this study, the high-resolution MS/MS data also allowed us to detect 147 phosphorylated proteins with 262 phosphorylation sites confidently identified (site probability >0.9). For example, the high mobility group protein AT-hook 2 (Hmga2), which is required for neural crest cell specification in X. laevis,42 was detected phosphorylated at serine 113 and 117 (S113, S117). Moreover, 21 of these phosphoproteins are reported in PhosphoSitePlus to have known mammalian homologues with 26 matching phosphorylation sites to our data (see Table S4). Other proteins are highlighted in Figure 5B. These gene products represented the Wnt, TGF-β, integrin, and growth factor pathways, which were also detected upon yolk depletion.
Notably, the combined approach of yolk depletion with high-pH fractionation significantly deepened pathway coverage. For the Wnt pathway, 33 proteins were identified, which included Wnt10A, lymphoid specific helicase (Hells), the Wnt pathway signal transducer catenin β-1 (Ctnnb1), and histone deacetylase 1 (Hdac1), which promotes neural induction by restricting mesodermal fate.43 Interestingly, eight Wnt pathway proteins were detected to be phosphorylated including the myristoylated alanine-rich C kinase substrate (MARCKS), which is essential for controlling cell motility during gastrulation.44 Phosphorylation sites for three Wnt pathway proteins were confidently identified from the HRMS data (site specific probability >0.9) and could be matched to mammalian protein homologues. Specifically, we detected phosphorylation for MARCKS at threonine 123 (T123), proteasome subunit α type-3 (Psma3) at S250, and two splice variants of ribosomal protein lateral stalk subunit P2 (Rplp2) at residues S102, S105, and S120, S123, respectively. Another key protein identified in the NE clones was Smad2, the intracellular signal transducer and transcriptional modulator activated by TGF-β. In addition, 17 detected proteins were involved in Rho GTPase and integrin pathways, which are involved in cytoskeletal regulation and cell migration during gastrulation.45,46 These pathways included the vasodilator simulated phosphoprotein (Vasp), myosin heavy chain (Myh9, 10, and 11), integrin β1 (Itgb1), paxillin (Pxn), and actin related protein complexes (Arpc 2, 3, 4, and 5).
The data also represented components of the FGF signaling pathway, an important player during neural induction,47,48 thus validating protein identifications. Following GO annotation, 19 proteins were assigned to this pathway with multiple functional aspects of the signaling cascade, ranging from kinases and phosphatases to adapter proteins. For example, we detected the growth-factor receptor bound protein 2 (Grb2), Grb2 associated protein (Gab1), and 14-3-3 proteins (ζ and ε), which interact with cell surface receptors and signaling pathway mediators to regulate and facilitate signal transduction.49 As shown in Figure 5C, protein–protein interactions can be anticipated based on the canonical FGF pathway50 or regulatory interplays predicted using the STRING51 database. The data set also included 43 transcription factors, including Hmgb 2 and 3, which are dynamically expressed in neural stem cells,34 the cell type derived from the D111 cell lineage. Remarkably, Hmgb2 along with seven other transcription factors were found to be phosphorylated. These phospho-TFs included Zic5 (zinc finger protein 5), which acts downstream of the canonical Wnt pathway to regulate cell proliferation during midbrain development in zebrafish.52 Zic5 was detected phosphorylated at tyrosine 3 (Y3) and threonine 5 (T5) in our data; however, these phosphorylation sites are not known to be conserved in the mammalian form of Zic5. Knowledge of these proteins and their phosphorylation is important to understand gene regulatory networks during development.
Our data can be used to gain insights into the relationship between mRNA and protein production during development of the NE. The proteins that we identified in the D111 clones can be cross-referenced to quantitative information on gene expression in embryonic tissues and the developing whole embryo, for example, via Xenbase.37 Coincidentally, a molecular atlas, EctoMap, recently mapped spatial and temporal transcription between distinct ectodermal domains of X. laevis in addition to the whole embryo,16 providing an excellent resource for such mRNA-protein comparisons. In theory, this comparison is feasible for any gene product that is common between these data sets, including the 2363 proteins that were detected in the NE clones derived from the D111 cell in this study.
As proof of concept, we queried transcriptional enrichment of the NE for only a subset of genes. Using EctoMap,16 we searched the mRNA enrichment database for the neural plate in the stage 12.5 embryo, which arises from the NE of the stage 10 embryo, the subject of our experiments. The analysis was limited to the 94 genes (119 proteins) that we detected as proteins from signaling pathways or transcriptional factors. The results are summarized in Table 1. Of the 43 proteins annotated as transcription factors that were detected by HRMS, 37 were reported transcriptionally enriched in the neural plate compared to the whole embryo. These matches with the mRNA data validate our proteomics data on the NE clones. Furthermore, these agreements between transcriptomic data and our proteomic results open the possibility to future quantitative studies on mRNA-protein dynamics in the developing NE. Transcriptional enrichment also was reported for 76 proteins that are members of essential signaling pathways (see earlier). As an example, Figure 5C overlays transcriptional enrichment for detected proteins that were assigned to the FGF signaling pathway (see earlier), suggesting neural enrichment of regulatory proteins (e.g., serine/threonine protein phosphatases and the 14-3-3 proteins).
Table 1.
EctoMap-based16 Enrichment Analysis of Transcripts in the Neural Plate (NP) for Proteins Detected from Essential Signaling Pathways or Transcriptional Regulation: Wnt/Cadherin (Cadh), Growth Factor (GF), Notch, Transforming Growth Factor (TGF) β, Integrin, and Transcription Factorsa

|
Relative expression (Rel. Expr.) is reported against the whole embryo (WE) based on EctoMap. Numbers in parentheses mark the number of detected protein isoforms.
CONCLUSIONS
This study demonstrates that proteomic analysis of identified tissues provides complementary data to transcriptomics to facilitate the understanding of molecular mechanisms underlying tissue induction and maintenance during development of vital organs, such as the central nervous system. Xenopus laevis has provided significant insights into cellular and molecular events during normal and impaired embryonic development (reviewed in refs 4–7). However, the abundance of yolk proteins (vitellogenins) in cells of the early embryo hinders HRMS detection of proteins, particularly those present in low–medium abundance. To bridge HRMS to cell and developmental biology of Xenopus, we systematically tested analytical strategies to alleviate interferences from abundant yolk signals. The combination of sucrose-gradient-based depletion of yolk platelets and high-pH RP fractionation efficiently improved protein identification and quantification in X. laevis using nanoLC-nanoESI-HRMS. Combined with continuous developments in HRMS technology for Xenopus, such as multiplexing quantification23 and ultrasensitive detection,26,53,54 the methodologies tested here afford possibilities to study developmental processes with progressively deeper molecular coverage, even at the level of single cells.26,27,55
Integration of classical embryology and discovery proteomics by HRMS offers previously unavailable molecular insights into the control of embryonic development. Whole-embryo analyses already provide important clues about the dynamics of transcription and translation of the genome and post-translational modifications during development (see refs 18, 19, 21, and 56). Here we demonstrated that improvements in HRMS sensitivity and reproducible cell fates in Xenopus laevis extend these investigations to a defined population of cells. This approach yields molecular information for a given cell or tissue phenotype that would be potentially lost or difficult to interpret in classical measurements that pool large populations of cells to whole embryos.
As proof of principle, we fate-mapped the D111 cell in the 32-cell X. laevis embryo to guide the microdissection of the NE-fated cell clones in the stage 10 embryo. Yolk depletion with high-pH fractionation prior to nanoLC-HRMS allowed 2363 proteins to be identified in these tissues by analyzing 1 μg peptides per run over 5 fractions, in measured in technical duplicate. These performance metrics suggest sensitivity improvements over a recently optimized protocol that used NP40-based lysis and filter-aided sample preparation (FASP) to identify 4957 proteins by analyzing 30 μg peptides across 15 fractions with each measured in technical triplicate. Proteins that were identified in our study included many transcription factors that illustrate the sensitivity of the technology. Furthermore, many gene products corresponded to transcripts with known enrichment in the NE and molecular pathways with essential contribution to neural development, thus validating the proteomics data for these clones. The integration of proteomic and transcriptomic technologies, such as HRMS and next-generation sequencing, promises to advance our understanding of normal and impaired biological processes during vertebrate embryonic development.
METHODS
Materials and Reagents.
Unless otherwise noted, LC-MS grade solvents (for HRMS), reagent-grade chemicals, TPCK-modified trypsin (for HRMS), and Alexa Fluor 488 (green fluorescent dextran) were purchased from Fisher Scientific (Pittsburgh, PA). Calcium nitrite, cysteine, Trizma hydrochloride, and Trizma base were purchased from Sigma-Aldrich (St. Louis, MO).
Solutions.
For culturing embryos, 100% (w/v) and 50% (w/v) Steinberg’s solutions (SS) were prepared according to standard protocols.57 The “lysis buffer” was prepared to contain 150 mM NaCl, 20 mM Tris-HCl, 5 mM EDTA, and 1% sodium dodecyl sulfate (SDS). The“yolk depletion buffer” was adapted with modification from ref 18 to contain 250 mM sucrose, 1% nonidet P-40 (NP-40), 5 mM EDTA, 20 mM Tris-HCl, 10 μM combretastatin 4A, and 10 μM cytochalasin D; Tris-HCl was chosen to minimize HEPES contamination during nanoLC-HRMS in this work.
Animal Care and Maintenance.
Adult male and female frogs (Xenopus laevis) were obtained from Nasco (Fort Atkinson, WI) and maintained in a breeding colony. Protocols regarding the maintenance and handling of X. laevis were approved by the George Washington University Institutional Animal Care and Use Committee (IACUC #A233). Standard protocols were followed to obtain embryos using gonadotropin-induced natural mating of male and female frogs for analytical method development and by in vitro fertilization for tissue dissections.57 Embryos were dejellied using 2% (w/v) cysteine solution and then cultured and staged according to the Nieuwkoop and Faber (NF) nomenclature following established protocols.57 Two-cell embryos in which stereotypical pigmentation marked the future dorsal-ventral axis were selected as described elsewhere38 and cultured to stage 6 (32-cell).9 The D111 cells were labeled with green fluorescent dextran using a microinjector (Warner Instruments, Hamden, CT). The labeled embryos were raised in 100% SS to stage 10. The embryos were monitored with a stereomicroscope under epifluorescence (model SMZ18 with GFP-B 480 filter, Nikon Instruments Inc., Melville, NY). The labeled cells or tissues were dissected in a 2% (w/v) agarose-coated Petri dish containing 50% SS, collected in LoBind Eppendorf tubes, and snap-frozen on dry ice. The samples were stored at –80 °C until further processing.
Bottom-Up Proteomic Workflow.
Two protein extraction protocols were compared in this work, one with yolk protein depletion18 and without26 (control). In the control protocol, embryonic samples were lysed in 300 μL of lysis buffer with sonication for 5 min. In the yolk depletion protocol, embryonic samples were lysed in 300 μL of yolk depletion buffer, incubated on ice for 10 min, and centrifuged at 4500 × g at 4 °C, for 4 min as described elsewhere.18 The pellet (yolk platelets) and the supernatant (yolk-depleted) were transferred into separate microcentrifuge tubes, and 1% SDS was added to the supernatant. The pelleted yolk was also resuspended in 200 μL of lysis buffer before further processing.
Once extracted, proteins from both protocols were processed following standard bottom-up proteomic workflows as follows: Proteins were reduced (5 μL of 0.5 M dithiothreitol, 60 °C for 30 min) and alkylated (15 μL of 0.5 M iodoacetamide treatment in the dark at room temperature for 20 min) before the reaction was quenched (5 μL of dithiothreitol). Next, proteins were purified by overnight precipitation in chilled (−20 °C) acetone for the control sample and chloroform-methanol mixture for the yolk depleted sample, followed by centrifugation at 10,000 × g for 10 min at 4 °C. The pellet was rinsed once with chilled acetone for the control sample. The resulting pellets were suspended in 50 mM ammonium bicarbonate, and the total protein concentration was determined by the bicinchoninic acid (BCA) assay (Thermo).Last, proteins were digested with trypsin (protein:enzyme = 1:50) overnight at 37 °C. Peptide concentration was quantified using the Colorimetric Peptide Assay (Thermo).For enhanced peptide detection, peptides extracted from the NE cell clones were tagged with tandem mass tags (TMT, Thermo).
To reduce peptide complexity, protein digests were fractionated under high pH in spin columns following vendor recommendations (Pierce Kit #84868, Thermo). A total of ~100 μg peptide mixture were fractionated using 0.1% (v/v) trimethylamine containing acetonitrile at 7.5%, 15%, 22.5%, 30%, and 50% (v/v), and each fraction was dried in a vacuum concentrator. Unfractionated peptide samples were desalted using C18 spin columns (Pierce #89870, Thermo). Unlabeled peptides were reconstituted in 2% acetonitrile (0.1%, v/v formic acid), whereas labeled peptides were dissolved in 5% acetonitrile (0.1%, v/v formic acid).
Liquid Chromatography Mass Spectrometry.
A total of 1 μg of peptide mixture (confirmed by the Total Peptide Assay) was separated on a C18 column at 200 nL/min (75 μm inner diameter, 2 μm particle size with 100 Å pores, 50 cm length, Acclaim PepMap 100, Thermo). Separation used a nanoflow liquid chromatography system (Dionex Ultimate 3000 RSLCnano, Thermo) providing a 120 min gradient mixture from Buffer A (2% ACN, 0.1% FA) and Buffer B (100% ACN, 0.1% FA). Untagged peptides were loaded using 100% Buffer A and eluted via a multistep gradient that ramped Buffer B as follows: from 2% to 7% in 15 min, to 15% in 35 min, to 40% in 70 min, and to 80% in 5 min, then the eluent composition was held for 2 min, before returning it to 2% in 15 min for equilibration over 15 min. TMT-tagged peptides were separated using a similar multistep gradient supplying Buffer B as follows: 3% for 10 min, then ramped to 40% in 110 min, to 80% in 5 min, returned to 3% in 10 min for equilibration over 15 min.
Peptides were detected by nanoESI-HRMS. The electrospray was generated at 2.5 kV using a pulled fused silica capillary as emitter (10 μm tip, New Objective, Woburn, MA). Peptides were detected and sequenced using an orbitrap-quadrupole-ion trap tribrid high-resolution mass spectrometer (Orbitrap Fusion, Thermo) executing DDA. Untagged and tagged peptides were detected under slightly different experimental settings. For untagged samples, precursor ions were surveyed at 120,000 FWMH resolution in the orbitrap mass analyzer (MS1) with the following parameters: maximum injection time (IT), 50 ms; automatic gain control (AGC), 4 × 10⁵; microscans, 1. Precursor ions with intensity >1 × 10⁴ counts were selected with a 1.6 Da mass window and fragmented by higher energy collision dissociation (HCD) in nitrogen at 32% normalized collision energy (NCE). Fragment ions were detected in the ion trap: scan rate, rapid; maximum IT, 70 ms; AGC, 1 × 10⁴ counts; microscans, 1. Fragmented ions were dynamically excluded for 60 s before being reconsidered for fragmentation. For the tagged samples, ions were surveyed at 60,000 FWMH resolution in the orbitrap mass analyzer (MS1) with following settings: maximum IT, 50 ms; AGC, 2 × 10⁵ counts; microscans, 1. Tandem MS was activated with collision-induced dissociation (CID) in helium at 35% NCE. Fragment ions were detected in the ion trap with rapid scan rate with the following settings: maximum IT, 50 ms; AGC, 5 × 10⁴ counts; microscans, 1. Multinotch MS3 fragmentation was triggered on the top 10 MS2 fragments with HCD in nitrogen (65% NCE). MS3 spectra were acquired at 15,000 FWMH in the orbitrap (maximum IT, 120 ms; AGC, 1 × 10⁵ counts; microscans, 1). Fragment ions were dynamically excluded for 60 s before being reconsidered for fragmentation.
Data Analysis.
Primary mass spectrometry data were processed in MaxQuant 1.5.7.4 running the Andromeda (version 1.5.6.0) search engine.35 The MS–MS/MS data were searched against the SwissProt Xenopus laevis proteome (downloaded from UniProt58 on 10/15/2017) supplemented with the mRNA-derived PHROG database (ver. 1.0) from ref 18. The following search parameters were applied: digestion, tryptic; number of missed cleavages, maximum 2; minimum number of unique peptides, 1; fixed modification, cysteine carbamidomethylation; variable modification, methionine oxidation; maximum mass deviation for main search of precursor masses, 4.5 ppm; de novo mass tolerance for tandem mass spectra, 0.25 Da; minimum score for modified peptides, 40; minimum δ score for modified peptides, 8. For TMT-tagged peptides additional search parameters were: sample type, reporter ion MS3; label, TMT. In the NE clones, phosphorylated proteins were identified using the search parameters: variable phosphorylation of serine, threonine, and tyrosine; variable oxidation of methionine; minimum δ score for modified peptides, 8; phosphorylation localization probability filtered to >0.9 and sites probability >0.9. Proteins were quantified using label-free quantification (LFQ) by MaxLFQ.35 Peptide and protein identifications were filtered to <1% false discovery rate (FDR) against a reversed-sequence database. Protein identifications were grouped by gene names based on the parsimony principle unless SwissProt58 or the mRNA-derived database19 provided evidence of isoforms.
Ontology annotation of gene classes and pathways were performed against Xenopus tropicalis using the PANTHER database version 13.0.59 Protein expression information was queried on Xenbase,37 EctoMap 1.3,16 or data available from the primary literature. Gene and protein names are reported following the Xenopus Gene Nomenclature Guidelines (http://www.xenbase.org, RRID: SCR_003280). Protein interactions were predicted using STRING version 10.551 with the following settings: organism, X. tropicalis; medium confidence score, 0.4; clustering, k-means; clustering level, 2. Protein phosphorylation sites were cross-referenced with homologous protein sequences from mammals using PhosphoSitePlus.60
Safety.
Capillaries and needles, which pose needle-stick hazard, must be handled with care. Standard safety protocols were followed during the handling of animals, dissected tissues, and chemicals.
Supplementary Material
ACKNOWLEDGMENTS
Parts of this work were funded by the National Institute of General Medical Sciences grant 1R35GM124755 (to P.N.), the National Science Foundation grant DBI-1455474 (to P.N. and S.A.M.), the American Society for Mass Spectrometry Research Award (to P.N.), and the DuPont Young Professor Award (to P.N.). The content of the reported work is the sole responsibility of the authors and does not necessarily represent the official views of the funding sources.
ABBREVIATIONS
- HRMS
high-resolution mass spectrometry
- ESI
electrospray ionization
- LC
liquid chromatography
- LFQ
label-free quantification
- NE
neural ectoderm
Footnotes
ASSOCIATED CONTENT
Supporting Information
The Supporting Information is available free of charge on the ACS Publications website at DOI: 10.1021/acschemneur-o.7b00525.
A comprehensive list of proteins identified and quantified from whole embryos, dorsal halves, and the neural ectoderm tissue (XLSX)
AUTHOR INFORMATION
P.N., S.A.M., and A.B.B. designed the research; S.A.M. provided the embryos; A.B.B measured the samples; A.B.B., C.L-B., and P.N. analyzed the data; P.N. and A.B.B. interpreted the results and wrote the manuscript. All authors commented on the manuscript.
Notes
The authors declare no competing financial interest.
REFERENCES
- (1).Gaur S, Mandelbaum M, Herold M, Majumdar HD, Neilson KM, Maynard TM, Mood K, Daar IO, Moody SA Neural transcription factors bias cleavage stage blastomeres to give rise to neural ectoderm. Genesis (2016) 54, 334–349. [DOI] [PMC free article] [PubMed] [Google Scholar]
- (2).Kuroda H, Wessely O, De Robertis EM Neural induction in Xenopus: requirement for ectodermal and endomesodermal signals via chordin, noggin, β-catenin, and cerberus. PLoS Biol. (2004) 2, e92. [DOI] [PMC free article] [PubMed] [Google Scholar]
- (3).Grant PA, Yan B, Johnson MA, Johnson DLE, Moody SA Novel animal pole-enriched maternal mRNAs are preferentially expressed in neural ectoderm. Dev. Dyn (2014) 243, 478–496. [DOI] [PubMed] [Google Scholar]
- (4).Duncan AR, Khokha MK Xenopus as a model organism for birth defects congenital heart disease and heterotaxy. Semin. Cell Dev. Biol (2016) 51, 73–79. [DOI] [PMC free article] [PubMed] [Google Scholar]
- (5).Kaltenbrun E, Tandon P, Amin NM, Waldron L, Showell C, Conlon FL Xenopus: an emerging model for studying congenital heart disease. Birth Defects Res. (2011) 91, 495–510. [DOI] [PMC free article] [PubMed] [Google Scholar]
- (6).Sater AK, Moody SA Using Xenopus to understand human disease and developmental disorders. Genesis (2017) 55, e22997. [DOI] [PubMed] [Google Scholar]
- (7).Hardwick LJA, Philpott A An oncologist’s friend: how Xenopus contributes to cancer research. Dev. Biol (2015) 408, 180–187. [DOI] [PMC free article] [PubMed] [Google Scholar]
- (8).Dickinson AJG, Lowery LA Xenopus as a model for developmental biology. Semin. Cell Dev. Biol (2016) 51, 53–53. [DOI] [PubMed] [Google Scholar]
- (9).Moody SA Fates of the blastomeres of the 32-cell-stage Xenopus embryo. Dev. Biol (1987) 122, 300–319. [DOI] [PubMed] [Google Scholar]
- (10).Ozair MZ, Kintner C, Brivanlou AH Neural induction and early patterning in vertebrates. Wiley Interdiscip. Rev.-Dev. Biol (2013) 2, 479–498. [DOI] [PMC free article] [PubMed] [Google Scholar]
- (11).Pera EM, Acosta H, Gouignard N, Climent M, Arregi I Active signals, gradient formation and regional specificity in neural induction. Exp. Cell Res (2014) 321, 25–31. [DOI] [PubMed] [Google Scholar]
- (12).Qu Y, Zhou B, Yang W et al. Transcriptome and proteome characterization of surface ectoderm cells differentiated from human iPSCs. Sci. Rep (2016) 6, 32007. [DOI] [PMC free article] [PubMed] [Google Scholar]
- (13).Masse K, Bhamra S, Eason R, Dale N, Jones EA Purine-mediated signalling triggers eye development. Nature (2007) 449, 1058–1062. [DOI] [PubMed] [Google Scholar]
- (14).Onjiko RM, Moody SA, Nemes P Single-cell mass spectrometry reveals small molecules that affect cell fates in the 16-cell embryo. Proc. Natl. Acad. Sci. U. S. A (2015) 112, 6545–6550. [DOI] [PMC free article] [PubMed] [Google Scholar]
- (15).Ding Y, Colozza G, Zhang K, Moriyama Y, Ploper D, Sosa EA, Benitez MDJ, De Robertis EM Genome-wide analysis of dorsal and ventral transcriptomes of the Xenopus laevis gastrula. Dev. Biol (2017) 426, 176–187. [DOI] [PMC free article] [PubMed] [Google Scholar]
- (16).Plouhinec JL, Medina-Ruiz S, Borday C, Bernard E, Vert JP, Eisen MB, Harland RM, Monsoro-Burq AH A molecular atlas of the developing ectoderm defines neural, neural crest, placode, and non-neural progenitor identity in vertebrates. PLoS Biol. (2017) 15, e2004045. [DOI] [PMC free article] [PubMed] [Google Scholar]
- (17).Lange L, Marks M, Liu JH, Wittler L, Bauer H, Piehl S, Blass G, Timmermann B, Herrmann BG Patterning and gastrulation defects caused by the t(w18) lethal are due to loss of Ppp2r1a. Biol. Open (2017) 6, 752–764. [DOI] [PMC free article] [PubMed] [Google Scholar]
- (18).Wuhr M, Freeman RM, Presler M, Horb ME, Peshkin L, Gygi SP, Kirschner MW Deep proteomics of the Xenopus laevis egg using an mRNA-derived reference database. Curr. Biol (2014) 24, 1467–1475. [DOI] [PMC free article] [PubMed] [Google Scholar]
- (19).Peshkin L, Wuhr M, Pearl E et al. On the relationship of protein and mRNA dynamics in vertebrate embryonic development. Dev. Cell (2015) 35, 383–394. [DOI] [PMC free article] [PubMed] [Google Scholar]
- (20).Presler M, Van Itallie E, Klein AM, Kunz R, Coughlin ML, Peshkin L, Gygi SP, Wuhr M, Kirschner MW Proteomics of phosphorylation and protein dynamics during fertilization and meiotic exit in the Xenopus egg. Proc. Natl. Acad. Sci. U. S. A (2017) 114, E10838–E10847. [DOI] [PMC free article] [PubMed] [Google Scholar]
- (21).Sun LL, Bertke MM, Champion MM, Zhu GJ, Huber PW, Dovichi NJ Quantitative proteomics of Xenopus laevis embryos: expression kinetics of nearly 4000 proteins during early development. Sci. Rep (2015) 4, 4365. [DOI] [PMC free article] [PubMed] [Google Scholar]
- (22).Vogel C, Marcotte EM Insights into the regulation of protein abundance from proteomic and transcriptomic analyses. Nat. Rev. Genet (2012) 13, 227–232. [DOI] [PMC free article] [PubMed] [Google Scholar]
- (23).Wuhr M, Guttler T, Peshkin L et al. The nuclear proteome of a vertebrate. Curr. Biol (2015) 25, 2663–2671. [DOI] [PMC free article] [PubMed] [Google Scholar]
- (24).Lombard-Banek C, Portero EP, Onjiko RM, Nemes P New-generation mass spectrometry expands the toolbox of cell and developmental biology. Genesis (2017) 55, e23012. [DOI] [PMC free article] [PubMed] [Google Scholar]
- (25).Comi TJ, Do TD, Rubakhin SS, Sweedler JV Categorizing cells on the basis of their chemical profiles: progress in single-cell mass spectrometry. J. Am. Chem. Soc (2017) 139, 3920–3929. [DOI] [PMC free article] [PubMed] [Google Scholar]
- (26).Lombard-Banek C, Moody SA, Nemes P Single-cell mass spectrometry for discovery proteomics: quantifying translational cell heterogeneity in the 16-cell frog (Xenopus) embryo. Angew. Chem., Int. Ed (2016) 55, 2454–2458. [DOI] [PMC free article] [PubMed] [Google Scholar]
- (27).Lombard-Banek C, Reddy S, Moody SA, Nemes P Label-free quantification of proteins in single embryonic cells with neural fate in the cleavage-stage frog (Xenopus laevis) embryo using capillary electrophoresis electrospray ionization high-resolution mass spectrometry (CE-ESI-HRMS). Mol. Cell. Proteomics (2016) 15, 2756–2768. [DOI] [PMC free article] [PubMed] [Google Scholar]
- (28).Onjiko RM, Plotnick DO, Moody SA, Nemes P Metabolic comparison of dorsal versus ventral cells directly in the live 8-cell frog embryo by microprobe single-cell CE-ESI-MS. Anal. Methods (2017) 9, 4964–4970. [DOI] [PMC free article] [PubMed] [Google Scholar]
- (29).Onjiko RM, Portero EP, Moody SA, Nemes P In situ microprobe single-cell capillary electrophoresis mass spectrometry: metabolic reorganization in single differentiating cells in the live vertebrate (Xenopus laevis) embryo. Anal. Chem (2017) 89, 7069–7076. [DOI] [PMC free article] [PubMed] [Google Scholar]
- (30).Onjiko RM, Morris SE, Moody SA, Nemes P Single-cell mass spectrometry with multi-solvent extraction identifies metabolic differences between left and right blastomeres in the 8-cell frog (Xenopus) embryo. Analyst (2016) 141, 3648–3656. [DOI] [PMC free article] [PubMed] [Google Scholar]
- (31).Flachsova M, Sindelka R, Kubista M Single blastomere expression profiling of Xenopus laevis embryos of 8 to 32-cells reveals developmental asymmetry. Sci. Rep (2013) 3, 2278. [DOI] [PMC free article] [PubMed] [Google Scholar]
- (32).Sato A, Khadka DK, Liu W, Bharti R, Runnels LW, Dawid IB, Habas R Profilin is an effector for Daam1 in non-canonical Wnt signaling and is required for vertebrate gastrulation. Development (2006) 133, 4219–4231. [DOI] [PubMed] [Google Scholar]
- (33).Rajasekaran D, Jariwala N, Mendoza RG, Robertson CL, Akiel MA, Dozmorov M, Fisher PB, Sarkar D Staphylococcal nuclease and tudor domain containing 1 (SND1 Protein) promotes hepatocarcinogenesis by inhibiting monoglyceride lipase (MGLL). J. Biol. Chem (2016) 291, 10736–10746. [DOI] [PMC free article] [PubMed] [Google Scholar]
- (34).Abraham AB, Bronstein R, Chen EI, Koller A, Ronfani L, Maletic-Savatic M, Tsirka SE Members of the high mobility group B protein family are dynamically expressed in embryonic neural stem cells. Proteome Sci. (2013) 11, 18. [DOI] [PMC free article] [PubMed] [Google Scholar]
- (35).Cox J, Hein MY, Luber CA, Paron I, Nagaraj N, Mann M Accurate proteome-wide label-free quantification by delayed normalization and maximal peptide ratio extraction, termed MaxLFQ. Mol. Cell. Proteomics (2014) 13, 2513–2526. [DOI] [PMC free article] [PubMed] [Google Scholar]
- (36).Jorgensen P, Steen JAJ, Steen H, Kirschner MW The mechanism and pattern of yolk consumption provide insight into embryonic nutrition in Xenopus. Development (2009) 136, 1539–1548. [DOI] [PMC free article] [PubMed] [Google Scholar]
- (37).Karimi K, Fortriede J, Lotay V Xenbase: a genomic, epigenomic and transcriptomic model organism database. Nucleic Acids Res. (2018) 46, D861. [DOI] [PMC free article] [PubMed] [Google Scholar]
- (38).Jacobson M, Hirose G Clonal organization of the central nervous system of the frog. Clones stemming from individual blastomeres of the 32- and 64-cell stages. J. Neurosci (1981) 1, 271–284. [DOI] [PMC free article] [PubMed] [Google Scholar]
- (39).Nakamura O, Kishiyam K Prospective fates of blastomeres at the 32 cell stage of Xenopus laevis embryos. Proc. Jpn. Acad (1971) 47, 407–412. [Google Scholar]
- (40).Arnott D, Liu PS, Molina P, Phu L, Sandoval WN Ivanov A, Lazarev A Manipulating the mass spectrometric properties of peptides through selective chemical modification. Sample Preparation in Biological Mass Spectrometry (2011)19–40Dordrecht; Springer. [Google Scholar]
- (41).Peuchen EH, Sun LL, Dovichi NJ Optimization and comparison of bottom-up proteomic sample preparation for early-stage Xenopus laevis embryos. Anal. Bioanal. Chem (2016) 408, 4743–4749. [DOI] [PMC free article] [PubMed] [Google Scholar]
- (42).Macri S, Simula L, Pellarin I, Pegoraro S, Onorati M, Sgarra R, Manfioletti G, Vignali R Hmga2 is required for neural crest cell specification in Xenopus laevis. Dev. Biol (2016) 411, 25–37. [DOI] [PubMed] [Google Scholar]
- (43).Liu P, Dou X, Liu C et al. Histone deacetylation promotes mouse neural induction by restricting Nodal-dependent mesendoderm fate. Nat. Commun (2015) 6, 6830. [DOI] [PubMed] [Google Scholar]
- (44).Iioka H, Ueno N, Kinoshita N Essential role of MARCKS in cortical actin dynamics during gastrulation movements. J. Cell Biol (2004) 164, 169–174. [DOI] [PMC free article] [PubMed] [Google Scholar]
- (45).Montero JA, Heisenberg CP Adhesive crosstalk in gastrulation. Dev. Cell (2003) 5, 190–191. [DOI] [PubMed] [Google Scholar]
- (46).Ridley AJ Rho GTPase signalling in cell migration. Curr. Opin. Cell Biol (2015) 36, 103–112. [DOI] [PMC free article] [PubMed] [Google Scholar]
- (47).Brafman D, Willert K Wnt/β-catenin signaling during early vertebrate neural development. Dev. Neurobiol (2017) 77, 1239–1259. [DOI] [PMC free article] [PubMed] [Google Scholar]
- (48).Streit A, Berliner AJ, Papanayotou C, Sirulnik A, Stern CD Initiation of neural induction by FGF signalling before gastrulation. Nature (2000) 406, 74–78. [DOI] [PubMed] [Google Scholar]
- (49).Gardino AK, Yaffe MB 14–3-3 proteins as signaling integration points for cell cycle control and apoptosis. Semin. Cell Dev. Biol (2011) 22, 688–695. [DOI] [PMC free article] [PubMed] [Google Scholar]
- (50).Ornitz DM, Itoh N The fibroblast growth factor signaling pathway. Wiley Interdiscip. Rev.-Dev. Biol (2015) 4, 215–266. [DOI] [PMC free article] [PubMed] [Google Scholar]
- (51).Szklarczyk D, Franceschini A, Wyder S et al. STRING v10: protein-protein interaction networks, integrated over the tree of life. Nucleic Acids Res (2015) 43, D447–D452. [DOI] [PMC free article] [PubMed] [Google Scholar]
- (52).Nyholm MK, Wu S, Dorsky RI, Grinblat Y The zebrafish zic2a-zic5 gene pair acts downstream of canonical Wnt signaling to control cell proliferation in the developing tectum. Development (2007) 134, 735–746. [DOI] [PubMed] [Google Scholar]
- (53).Sun LL, Zhu GJ, Zhao YM, Yan XJ, Mou S, Dovichi NJ Ultrasensitive and fast bottom-up analysis of femtogram amounts of complex proteome digests. Angew. Chem., Int. Ed (2013) 52, 13661–13664. [DOI] [PMC free article] [PubMed] [Google Scholar]
- (54).Choi SB, Zamarbide M, Manzini MC, Nemes P Tapered-tip capillary electrophoresis nano-electrospray ionization mass spectrometry for ultrasensitive proteomics: the mouse cortex. J. Am. Soc. Mass Spectrom (2017) 28, 597–607. [DOI] [PubMed] [Google Scholar]
- (55).Sun LL, Dubiak KM, Peuchen EH, Zhang ZB, Zhu GJ, Huber PW, Dovichi NJ Single cell proteomics using frog (Xenopus laevis) blastomeres isolated from early stage embryos, which form a geometric progression in protein content. Anal. Chem (2016) 88, 6653–6657. [DOI] [PMC free article] [PubMed] [Google Scholar]
- (56).Presler M, Van Itallie E, Klein AM, Kunz R, Coughlin ML, Peshkin L, Gygi SP, Wühr M, Kirschner MW Proteomics of phosphorylation and protein dynamics during fertilization and meiotic exit in the Xenopus egg. Proc. Natl. Acad. Sci. U. S. A (2017) 114, E10838–E10847. [DOI] [PMC free article] [PubMed] [Google Scholar]
- (57).Sive HL, Grainger RM, Harland RM Early development of Xenopus laevis: a laboratory manual, Cold Spring Harbor Laboratory.(2000)Cold Spring Harbor; NY. [Google Scholar]
- (58).Bateman A, Martin MJ, O'Donovan C et al. UniProt: the universal protein knowledgebase. Nucleic Acids Res. (2017) 45, D158–D169. [DOI] [PMC free article] [PubMed] [Google Scholar]
- (59).Mi HY, Huang XS, Muruganujan A, Tang H, Mills C, Kang D, Thomas PD PANTHER version 11: expanded annotation data from Gene Ontology and Reactome pathways, and data analysis tool enhancements. Nucleic Acids Res. (2017) 45, D183–D189. [DOI] [PMC free article] [PubMed] [Google Scholar]
- (60).Hornbeck PV, Zhang B, Murray B, Kornhauser JM, Latham V, Skrzypek E PhosphoSitePlus, 2014: mutations, PTMs and recalibrations. Nucleic Acids Res. (2015) 43, D512–D520. [DOI] [PMC free article] [PubMed] [Google Scholar]
Associated Data
This section collects any data citations, data availability statements, or supplementary materials included in this article.