

Abstract
Background
Caffeine can exacerbate tremor. Reducing caffeine intake or switching to decaffeinated beverages can lessen tremor. Unaffected relatives of ET cases often have mild, subclinical tremor. One question is whether the coffee and tea consumption pattern in these individuals differs from that of controls.
Methods
We ascertained coffee and tea intake using a structured questionnaire, and compared use in unaffected first-degree relatives of ET cases (FD-ET) to use in age-matched controls (Co). Three measures of relative caffeinated coffee+tea to decaffeinated coffee+tea were constructed. Caffeine index 1 = (cups of caffeinated coffee+tea) – (cups of decaffeinated coffee+tea) consumed on the day of evaluation. Caffeine index 2 = (cups of caffeinated coffee+tea) – (cups of decaffeinated coffee+tea) consumed in a typical month. The percentage of coffee and tea that was caffeinated in a typical month was also calculated.
Results
There were 263 individuals (190 FD-ET, 73 Co). Caffeine index 1 in FD-ET was less than one-half that of Co (p = 0.001). Caffeine index 2 was similarly lower in FD-ET than Co (p = 0.027). The percentage of coffee and tea that was caffeinated in a typical month was also significantly lower in FD-ET than Co (p = 0.018).
Conclusion
The balance of caffeinated to decaffeinated beverages is different in FD-ET than controls. These data raise several intriguing questions. Among these is whether relatives of ET cases modify their caffeine consumption before disease onset.
Keywords: Essential tremor, epidemiology, clinical, diet, caffeine, coffee
Introduction
Studies in normal individuals indicate that drinking coffee and tea may produce or exacerbate slight hand tremor [1], thereby impinging on hand dexterity during a range of occupational and non-occupational tasks [2–6]. To lessen tremor, individuals may reduce caffeine consumption or switch to caffeine-free beverages. Similarly, among individuals with more severe tremor (e.g., essential tremor, ET), one study demonstrated cases consumed less caffeine than controls, likely as a dietary modification in response to tremor [7].
ET is often familial [8–10]; first-degree relatives of ET cases are five-times more likely to develop ET than members of the population [11]. In addition to ET, relatives of ET cases are also more likely to exhibit very mild (i.e., low-level) tremor than are relatives of control subjects; tremor in these ET relatives, who are classified as unaffected because their tremor is very mild, likely represents a partial expression of the disease or an early, subclinical phase of disease [12,13].
One question is whether the caffeine consumption pattern in unaffected relatives of ET cases is similar to that of controls. If not, and if it were lower, it would imply that these relatives could be modifying (i.e., reducing) their caffeine consumption. This, in turn, would have several potential implications: (1) on some level they are symptomatic, (2) on some level, their low-level tremor is concerning to them, and (3) the burden of tremor in ET families extends even down to those with mild, subclinical tremor.
We compared coffee and tea consumption of first-degree relatives of ET cases (FD-ET) to that of age-matched controls (Co); none complained of tremor on a detailed screen and none had ET. We hypothesized that FD-ET might consume less caffeinated coffee and tea and more decaffeinated coffee and tea than Co.
Methods
Introduction
FD-ET and their spouses (i.e., Co) were screened for enrollment in an environmental epidemiological study of ET (May 2016 – March 2018) [14].
ET cases had been ascertained from study advertisements to members of the International Essential Tremor Foundation, enrollees in current ET research studies at Yale University, and the clinical practice of the Yale Movement Disorders Group [14]. The study was advertised as one of “lifestyle habits in essential tremor families”.
Screening unaffected FD-ET
The screening process for unaffected FD-ET was as follows. First, ET cases informed the investigator of all reportedly-unaffected living first-degree relatives age ≥40. With permission, these family members were contacted by telephone, during which they were consented (using a protocol approved by the Yale University Institutional Review Board) and interviewed. During the interview, a 12‐item tremor screening questionnaire [15] was administered and they were asked about a prior diagnosis of ET. They also completed and mailed four hand‐drawn spirals (two right, two left), which were rated by a senior movement disorders neurologist (E.D.L.) using the following scale: 0, 0.5, 1, 1.5, 2, 3 (see definitions and examples in Louis et al) [16].
FD-ET were initially categorized as unaffected if they met each of the following criteria: (1) they did not report tremor during the 12‐item telephone‐administered tremor screening questionnaire [15], (2) they had never been assigned an ET diagnosis by a treating physician, and (3) each of their four screening spirals were assigned scores <2.0.
In-person clinical evaluation of FD-ET
FD-ET were invited for an in-person clinical evaluation if initially categorized as unaffected. The evaluation was conducted by trained interviewers in enrollees’ homes and included questionnaires and a videotaped neurological examination.
Caffeine intake was assessed for two time periods. First, FD-ET were asked about the number of cups of caffeinated coffee, caffeinated tea, decaffeinated coffee, and decaffeinated tea they had consumed that day. Second, as part of the Willett Food Frequency Questionnaire [17], they were also asked how many cups they typically (i.e., during the prior one year period) consumed in a month. This questionnaire has been used widely for dietary research. More specifically, data on coffee and caffeine intake have been the specific subject of numerous studies, indicating that the data derived from these questions is considered robust [18–20]. Indeed, results are highly reproducible with high correlations between results obtained 12 months apart (for coffee, r = 0.80 and for tea, r = 0.86) and valid because they are consistent with dietary records of coffee and tea consumption in validation studies (for coffee, r = 0.74 – 0.75 and for tea, r = 0.83 – 0.90) [21]. For our analyses, ordinal categories of intake (e.g., 1 per month, 1 per day, 2 per day) were converted into continuous measures (e.g., 1, 30, 60).
The Cumulative Illness Rating Scale (CIRS) (range = 0–42 [maximum co-morbidity]) [22], a measure of medical co-morbidity, was administered. Depressive symptoms were assessed using the Beck Depression Inventory (21 items rated from 0–3; total score = 0–63 [maximal symptoms])[23].
The videotaped neurological examination [24] included a detailed assessment of tremor and other movement disorders [25]. E.D.L. reviewed videotaped examinations, and the severity of postural and kinetic arm tremors was rated on 12 examination items using a reliable scale [26]. As reviewed [16,27], ratings were 0, 0.5, 1.0, 1.5, 2, 3 and 4; these resulted in a total tremor score (range = 0–46 [maximum]) [25].
FD-ET were re-evaluated for a potential ET diagnosis based on review of questionnaires and videotaped neurological examination data. Diagnoses of ET were assigned based on published diagnostic criteria (moderate [rating = 2] or greater amplitude kinetic tremor during three or more activities or head tremor in the absence of Parkinson’s disease, dystonia or another known cause [e.g., medication-induced tremor]) [24,26,28].
Final inclusion of FD-ET
FD-ET were included if they were initially categorized as unaffected (see above) and if they were not diagnosed with ET based on the in-person evaluation.
Parallel screening and evaluating Co
Co were also screened, if available. Each then underwent the same screening process, in person questionnaire, and videotaped examination described above. They were included in these analyses if (1) they were initially categorized as unaffected, (2) reported no family history of ET, and (3) they were not diagnosed with ET during the in-person evaluation.
Final sample
We screened 493 individuals; 367 were initially categorized as unaffected. We further excluded 52 who were diagnosed with ET based on published diagnostic criteria and another 37 who were considered to have borderline ET – i.e., they did not fully meet strict diagnostic criteria for ET (defined above) based on the in-person evaluation but were nonetheless considered by the study clinician to have clinical features that aligned them more with ET than normal [29]. We also excluded 15 with incomplete information on caffeine consumption, leaving a final sample of 263 (190 FD-ET, 73 Co).
Study power
Pilot data on caffeine index 1 (described below) from our first 40 enrollees (20 FD-ET, 20 Co) showed a >50% reduction in FD-ET compared to Co. Our sample size (190 FD-ET, 73 Co) provided >99% power to detect a ≥50% reduction in caffeine index 1 in FD-ET (assuming alpha = 0.05 and two-sided statistical tests). Similarly, for caffeine index 2 (described below), power was >98% to detect a ≥50% reduction in FD-ET. However, given the wide standard deviations in cups of coffee and tea consumed, the study was not well powered to detect this magnitude of difference in these outcomes (study power = 48% for each). Hence, prior to further enrollment, we designated caffeine index 1 and caffeine index 2 as our primary comparison variables and coffee and tea consumption as secondary variables. A third variable, percentage of coffee and tea that was caffeinated each month was added later as a third primary comparison variable.
Statistical analyses
For continuous variables, normality was assessed (Kolmogorov Smirnov test); when the distribution was not normal (p<0.05), non-parametric tests were used (e.g., Mann-Whitney test, Spearman’s r). We compared FD-ET to Co in terms of demographic and clinical features (Table 1).
Table 1.
Demographic and clinical features of 190 FD-ET vs. 73 Co
| FD-ET n = 190 |
Co n = 73 |
Significance | |
|---|---|---|---|
| Current age in years | 57.1 ± 9.9 [57.0] | 56.6 ± 9.5 [55.0] | 0.93 a |
| Female gender | 127 (66.8) | 27 (37.0) | <0.001 b |
| Education in years | 16.9 ± 2.4 [16.0] | 16.6 ± 3.0 [16.0] | 0.28 a |
| White race | 182 (95.8) | 71 (97.3) | 0.73 c |
| English language | 185 (97.4) | 69 (94.5) | 0.27 c |
| Current cigarette smoker | 2 (1.1) | 0 (0.0) | 1.00 c |
| Number of prescription medications | 1.8 ± 2.0 [1.0] | 2.4 ± 2.7 [2.0] | 0.42 a |
| Cumulative Illness Rating Scale score | 4.2 ± 3.2 [4.0] | 3.8 ± 3.6 [3.0] | 0.12 a |
| Beck Depression Inventory | 4.5 ± 4.5 [4.0] | 4.5 ± 4.6 [3.0] | 0.72 a |
| Hours of sleep per night | 6.9 ± 1.2 [7.0] | 6.9 ± 1.0 [7.0] | 0.81 a |
| Total tremor score | 6.7 ± 2.2 [6.5] | 5.8 ± 2.2 [5.5] | 0.003 a |
| Cups caffeinated coffee today | 0.47 ± 0.79 [0.0] | 0.81 ± 1.08 [0.0] | 0.027 a |
| Cups caffeinated tea today | 0.06 ± 0.26 [0.0] | 0.17 ± 0.51 [0.0] | 0.086 a |
| Cups decaffeinated coffee today | 0.09 ± 0.37 [0.0] | 0.00 ± 0.00 [0.0] | 0.037 a |
| Cups decaffeinated tea today | 0.03 ± 0.20 [0.0] | 0.03 ± 0.17 [0.0] | 0.95 a |
| Caffeine index 1 | 0.41 ± 0.90 [0.0] | 0.94 ± 1.14 [1.00] | 0.001 a |
| Cups caffeinated coffee per month | 37.06 ± 43.90 [28.9] | 43.63 ± 39.81 [30.0] | 0.16 a |
| Cups caffeinated tea per month | 14.99 ± 31.81 [2.0] | 14.88 ± 25.61 [4.3] | 0.53 a |
| Cups decaffeinated coffee per month | 7.89 ± 24.29 [0.0] | 3.13 ± 10.32 [0.0] | 0.25 a |
| Cups decaffeinated tea per month | 11.29 ± 26.61 [2.0] | 7.52 ± 21.70 [0.0] | 0.028 a |
| Caffeine index 2 | 32.87 ± 60.34 [28.0] | 47.85 ± 45.96 [53.4] | 0.027 a |
| Percentage coffee and tea that was caffeinated per month | 73.0 ± 33.1 [91.8] | 82.1 ± 29.2 [98.0] | 0.018 |
Values are mean ± standard deviation [median] or number (percent).
Mann-Whitney test.
Chi-square test.
Fisher’s exact test.
In order to assess the intake of both coffee and tea as well as caffeinated to non-caffeinated beverages, two simple measures of relative caffeinated coffee+tea to decaffeinated coffee+tea were constructed. Caffeine index 1 = (cups of caffeinated coffee+tea) – (cups of decaffeinated coffee+tea) consumed on the day of evaluation. Caffeine index 2 = (cups of caffeinated coffee+tea) – (cups of decaffeinated coffee+tea) consumed in a typical month. We also calculated the percentage of coffee and tea that was caffeinated each month (i.e., 100 × [caffeinated coffee and tea consumption each month]/[all coffee and tea consumption each month]). Our rationale for using both types of metrics is that the percentage provides the relative contribution of caffeinated to total beverage (e.g., 73.0%) but the difference (Caffeine index 1 and Caffeine index 2) provides the absolute value in number of cups per day. The absolute values allow for (1) comparisons with prior studies that similarly report the number of cups consumed per day and (2) provide a clear numerical metric of the actual number of cups that the two groups are consuming.
We used Spearman’s correlation coefficients to examine the correlations between continuous variables (e.g., caffeine indices 1 and 2 and percentage of coffee and tea that was caffeinated each month). We also performed gender-stratified analyses, and analyses that only included the first enrollee from those families in which more than one individual was enrolled.
Results
There were 263 individuals (190 FD-ET, 73 Co) who belonged to 170 and 70 families, respectively. Hence, in large measure, individuals were not from the same families.
FD-ET and Co were similar in age and most demographic factors (e.g., education, race, language, cigarette smoking); however, they differed by gender (p<0.001, Table 1). The two groups were also similar in terms of number of prescription medications, CIRS score, Beck Depression Inventory scores and hours of sleep per night. Tremor ratings were overall very low (i.e., 0–1 range, Figure 1). Despite this, the total tremor score was higher in FD-ET than Co (p = 0.003, Table 1).
Figure 1. Spiral drawn by FD-ET.
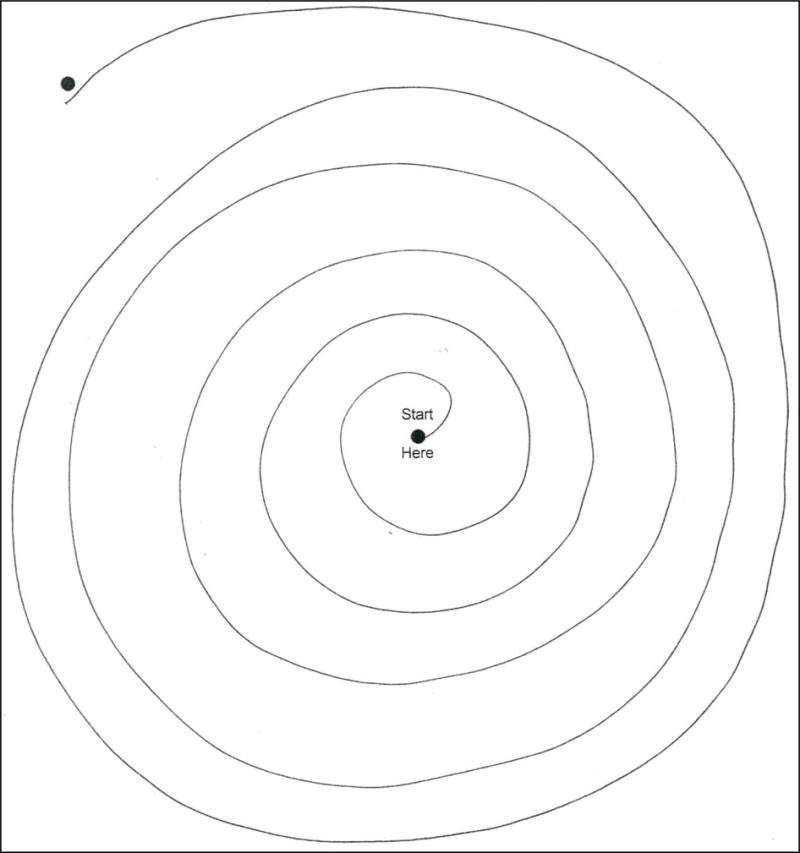
Spiral drawn by a FD-ET reveals mild tremor. Tremor rating = 1, with the tremor most evident in the lower right quadrant (between 3 o’clock and 4 o’clock if this were a clock face).
Caffeine index 1 in FD-ET was on average less than one-half that of Co (i.e., respective means = 0.41 vs. 0.94), a difference that was significant (p = 0.001, Table 1, Figure 2). Caffeine index 2 in FD-ET was on average 31.3% lower than that of Co (i.e., respective means = 32.87 vs. 47.85), a difference that was significant (p = 0.027, Table 1, Figure 3). The percentage of coffee and tea that was caffeinated in a typical month was also significantly lower in FD-ET (p = 0.018).
Figure 2. Caffeine index 1 in FD-ET vs. Co.
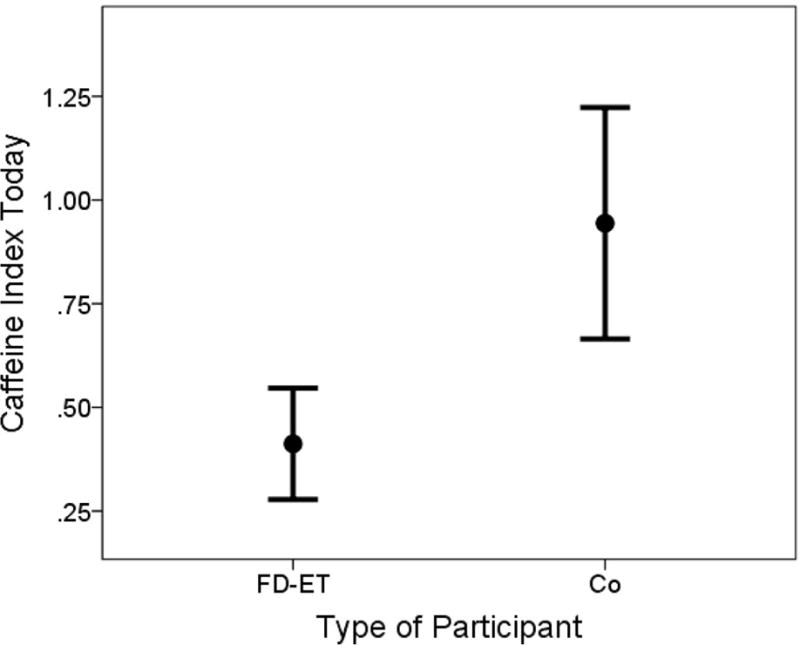
Lines represent 95% confidence intervals and filled-circles represent means.
Figure 3. Caffeine index 2 in FD-ET vs. Co.
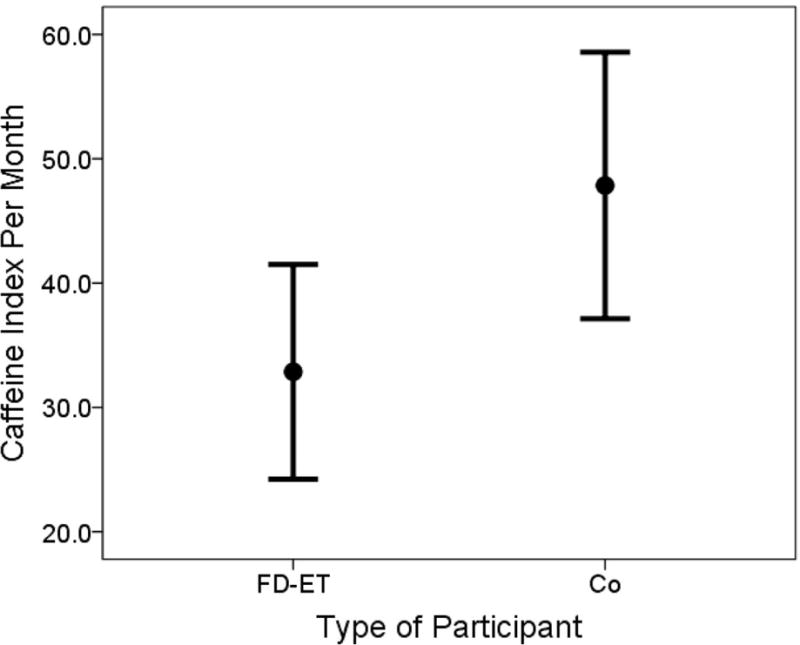
Lines represent 95% confidence intervals and filled-circles represent means.
Overall, the difference between FD-ET and Co was modest. For example, on the day of testing, Co reported on average having had approximately one cup of caffeinated beverage (i.e., tea + coffee); in FD-ET, this was approximately one-half cup (Table 1). In terms of monthly consumption, Co reported on average having approximately 60 cups of caffeinated beverage (i.e., approximately 2 cups per day of coffee + tea); in FD-ET, this was approximately 50 cups of caffeinated beverage (i.e., approximately 1.67 cups per day of coffee + tea). But when one considered the combined effects of reduced caffeine consumption and increased non-caffeinated coffee and tea consumption, caffeine index 2 was approximately double that of FD-ET.
FD-ET and Co differed by gender (Table 1); however, in gender-stratified analyses the differences between FD-ET and Co followed a similar pattern, with a change in the balance of caffeinated to decaffeinated beverages in FD-ET (data not shown), indicating that gender could not have confounded the association between caffeinated beverage consumption and group.
Caffeine index 1 correlated significantly with caffeine index 2 (Spearman’s r = 0.40, p<0.001), indicating that the two reports were internally consistent. Both indices correlated with the percentage of coffee and tea that was caffeinated in a typical month (respective Spearman’s r = 0.38, p < 0.001 and r = 0.68, p < 0.001).
Neither caffeine index correlated with the total tremor score in FD-ET (Spearman’s r = 0.07, p = 0.32 and Spearman’s r = 0.06, 0.32, respectively). Similarly, there was no correlation in FD-ET between percentage of coffee and tea that was consumed in a typical month and total tremor score (Spearman’s r = 0.10, p = 0.41).
Some individuals were from the same families. In a sensitivity analysis that included the first enrollee in each family (i.e., 170 of 190 FD-ET and 70 of 73 Co), results were similar to those of the main analysis - 170 FD-ET had a lower caffeine index 1 than 70 controls (p = 0.003), a marginally lower caffeine index 2 than controls (p = 0.07) and a lower percentage of coffee and tea that was caffeinated in a typical month (p = 0.039).
Discussion
We assessed coffee and tea intake in 263 individuals, comparing FD-ET to age-matched Co. Both caffeinated and decaffeinated beverages were assessed for two time periods: the day of evaluation and more chronically (in a typical month). None of the study subjects self-reported tremor or met criteria for ET on examination. Three indices that measured caffeinated vs. decaffeinated intake indicated significant differences between FD-ET and Co. The implications of these data will be discussed further below.
FD-ET had more tremor than controls; though the difference was small, it was significant. It is possible that FD-ET reduced their caffeine consumption and increased consumption of decaffeinated drinks in response to mild tremor. Another possibility is that the observed difference was a matter of preference alone. This is less likely as the two groups were similar in numerous other respects (e.g., age, education, smoking, hours of sleep per night) so it would be difficult to imagine why they would selectively differ by caffeine consumption, unless one group had other symptoms that would dictate a reduction (e.g., palpitations, gastro-esophageal reflux). It is important to point out that our study was not longitudinal; we cannot attribute a causal relationship between tremor and a reduction in caffeine intake. Further studies are clearly needed.
Neither caffeine index correlated with the tremor severity in FD-ET. While this argues against the notion that FD-ET reduced caffeine consumption due to tremor, there are other explanations. First, the lack of correlation could be due to low variance in total tremor scores, which among these normal individuals had a narrow range (0.5–12) and in a full 50% of the sample only ranged from 4–7. Equally likely is that some FD-ET, tremor scores would have been high despite the reduction in caffeine, while in the others, tremor scores would have been lower due to the reduction in caffeine. Without longitudinal data, there is no way to assess tremor scores pre- and post- any hypothetical reductions in caffeine intake.
What are the implications of our findings? First, it is possible that individuals with a genetic predisposition for ET who at the same time deny having tremor, may on some level be acknowledging the presence of tremor by modifying their behavior. This raises the point that there may be a range of different levels at which individuals acknowledge their symptoms and disease. Second, individuals with mild ET ascertained from the population often attribute their tremor to nervousness or chemical (e.g., caffeine) exposure rather than disease; this same process may be extending to their relatives, who attribute tremor to caffeine-shakes rather than early ET. For epidemiological screens, the inclusion of a question as to whether individuals have reduced their use of caffeine might ascertain additional cases with mild tremor. Another interesting question is, when does this disease “start”? None of the FD-ET complained of tremor on a 12-item screen and none were diagnosed with ET. Additionally, after a videotaped examination, none met diagnostic criteria for ET or for borderline ET. Nonetheless, given the higher prior probability of having tremor (i.e., as first-degree relatives of ET cases), on some level they may have viewed themselves as gene carriers or as individuals whose hands shake more in the setting of caffeine consumption (i.e., having a predisposition for the disease rather than having the disease per se).
The focus of the current analyses was caffeine consumption. This is because these analyses address a specific research question about the potential relationship between caffeine, a tremor-producing dietary entity, and presumed exacerbation of tremor. That is, because of caffeine’s unique pharmacological properties, we were interested in the specific relationship between this dietary entity and tremor. By contrast, we were not concerned with data on other nutrients (e.g., vitamins) or food groups (e.g., fat, protein, carbohydrates) as these are not known to produce or exacerbate tremor.
Despite enrolling more than 250 individuals, given the wide standard deviations in cups of coffee and tea consumed, the study was not well-powered to detect small difference in these measures. It was, however, powered to detected differences in our three primary indices. Future studies (1) would need larger samples to detect differences in cups of coffee and tea consumed and (2) should explore potential reasons for modifications of caffeine consumption, and (3) should include prospective designs.
One must also consider the possibility of recall bias. This occurs when information provided on exposure differs between cases and controls. For example, a case may report their exposure experience differently than a control. Usually, blinding participants to study hypotheses minimizes this possibility. The current study was advertised as one of “lifestyle habits in essential tremor families”. It was not advertised as a study to assess reductions in caffeine consumption in first-degree relatives of ET cases compared to controls; hence, our participants were blinded to study hypothesis.
In summary, the balance of caffeinated to decaffeinated beverages is different in FD-ET than controls. These data suggest that on some level, low-level tremor could be concerning to FD-ET. It also suggests that on some level the tremor could be symptomatic and that the burden of tremor in ET families might extend, on some level, even down to the level of those with subclinical tremor.
Figure 4. Percentage of coffee and tea that was caffeinated in FD-ET vs. Co.
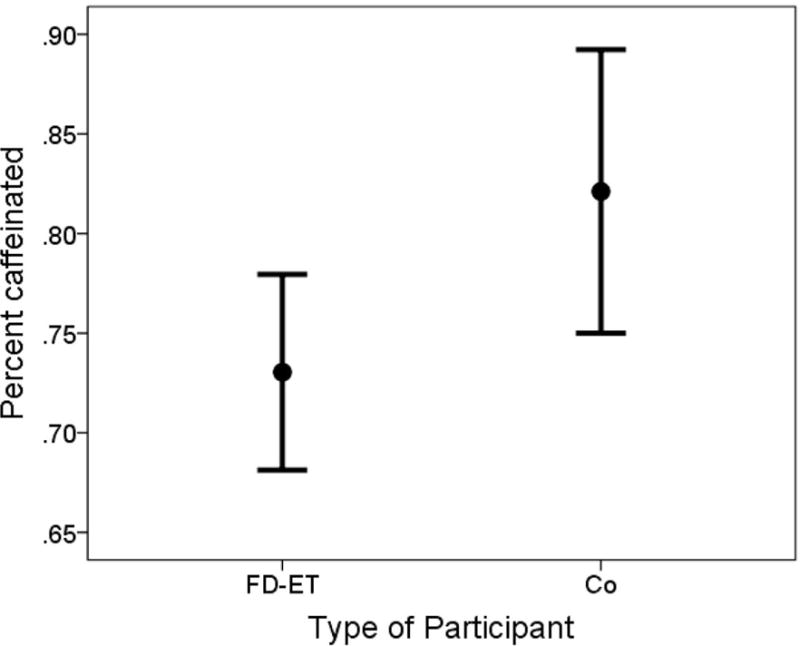
Lines represent 95% confidence intervals and filled-circles represent means.
Acknowledgments
Funding
This study was supported by the National Institutes of Health, R01 NS094607.
Footnotes
None of the authors has any conflicts of interest.
References
- 1.Koller W, Cone S, Herbster G. Caffeine and tremor. Neurology. 1987;37:169–172. doi: 10.1212/wnl.37.1.169. [DOI] [PubMed] [Google Scholar]
- 2.Arnold RW, Springer DT, Engel WK, Helveston EM. The effect of wrist rest, caffeine, and oral timolol on the hand steadiness of ophthalmologists. Ann Ophthalmol. 1993;25:250–253. [PubMed] [Google Scholar]
- 3.Shirlow MJ, Mathers CD. A study of caffeine consumption and symptoms; indigestion, palpitations, tremor, headache and insomnia. Int J Epidemiol. 1985;14:239–248. doi: 10.1093/ije/14.2.239. [DOI] [PubMed] [Google Scholar]
- 4.Fargen KM, Turner RD, Spiotta AM. Factors that affect physiologic tremor and dexterity during surgery: A primer for neurosurgeons. World Neurosurg. 2016;86:384–389. doi: 10.1016/j.wneu.2015.10.098. [DOI] [PubMed] [Google Scholar]
- 5.Urso-Baiarda F, Shurey S, Grobbelaar AO. Effect of caffeine on microsurgical technical performance. Microsurgery. 2007;27:84–87. doi: 10.1002/micr.20311. [DOI] [PubMed] [Google Scholar]
- 6.Jacobson BH, Winter-Roberts K, Gemmell HA. Influence of caffeine on selected manual manipulation skills. Percept Mot Skills. 1991;72:1175–1181. doi: 10.2466/pms.1991.72.3c.1175. [DOI] [PubMed] [Google Scholar]
- 7.Louis ED, Jurewicz EC, Applegate L, Luchsinger JA, Factor-Litvak P, Parides M. Semiquantitative study of current coffee, caffeine, and ethanol intake in essential tremor cases and controls. Mov Disord. 2004;19:499–504. doi: 10.1002/mds.20035. [DOI] [PubMed] [Google Scholar]
- 8.Bain PG, Findley LJ, Thompson PD, Gresty MA, Rothwell JC, Harding AE, Marsden CD. A study of hereditary essential tremor. Brain. 1994;117(Pt 4):805–824. doi: 10.1093/brain/117.4.805. [DOI] [PubMed] [Google Scholar]
- 9.Testa CM. Key issues in essential tremor genetics research: Where are we now and how can we move forward? Tremor Other Hyperkinet Mov (N Y) 2013;3 doi: 10.7916/D8Q23Z0Z. pii: tre-03-105-1843-1. [DOI] [PMC free article] [PubMed] [Google Scholar]
- 10.Tio M, Tan EK. Genetics of essential tremor. Parkinsonism Relat Disord. 2016;22(Suppl 1):S176–178. doi: 10.1016/j.parkreldis.2015.09.022. [DOI] [PubMed] [Google Scholar]
- 11.Louis ED, Ford B, Frucht S, Barnes LF, M XT, Ottman R. Risk of tremor and impairment from tremor in relatives of patients with essential tremor: a community-based family study. Ann Neurol. 2001;49:761–769. doi: 10.1002/ana.1022. [DOI] [PubMed] [Google Scholar]
- 12.Louis ED, Dogu O, Ottman R. Subclinical tremor in normal controls with versus without a family history of essential tremor: data from the United States and Turkey. Eur J Neurol. 2010;17:607–611. doi: 10.1111/j.1468-1331.2009.02875.x. [DOI] [PMC free article] [PubMed] [Google Scholar]
- 13.Louis ED, Ford B, Frucht S, Ottman R. Mild tremor in relatives of patients with essential tremor: what does this tell us about the penetrance of the disease? Arch Neurol. 2001;58:1584–1589. doi: 10.1001/archneur.58.10.1584. [DOI] [PubMed] [Google Scholar]
- 14.Louis ED, Badejo FM, Cristal AD, Meyers J, Hernandez N, Chen KP, Naranjo KV, Park J, Clark LN. Early head tremor in essential tremor: A case series and commentary. Tremor Other Hyperkinet Mov (N Y) 2017 Mar 25;7:453. doi: 10.7916/D8KW5MRG. [DOI] [PMC free article] [PubMed] [Google Scholar]
- 15.Louis ED, Ford B, Lee H, Andrews H. Does a screening questionnaire for essential tremor agree with the physician’s examination? Neurology. 1998;50:1351–1357. doi: 10.1212/wnl.50.5.1351. [DOI] [PubMed] [Google Scholar]
- 16.Louis ED, Zhao Q, Meng H, Ding D. Screening for action tremor in epidemiological field surveys: Assessing the reliability of a semi-quantitative, visual, template-based scale for rating hand-drawn spirals. Tremor Other Hyperkinet Mov (N Y) 2012;2 doi: 10.7916/D8QZ28QP. pii: tre-02-46-177-2. [DOI] [PMC free article] [PubMed] [Google Scholar]
- 17.Willett WC, Sampson L, Stampfer MJ, Rosner B, Bain C, Witschi J, Hennekens CH, Speizer FE. Reproducibility and validity of a semiquantitative food frequency questionnaire. Am J Epidemiol. 1985;122:51–65. doi: 10.1093/oxfordjournals.aje.a114086. [DOI] [PubMed] [Google Scholar]
- 18.Lucas M, O’Reilly EJ, Pan A, Mirzaei F, Willett WC, Okereke OI, Ascherio A. Coffee, caffeine, and risk of completed suicide: results from three prospective cohorts of American adults. World J Biol Psychiatry. 2014;15:377–386. doi: 10.3109/15622975.2013.795243. [DOI] [PMC free article] [PubMed] [Google Scholar]
- 19.Lucas M, Mirzaei F, Pan A, Okereke OI, Willett WC, O’Reilly EJ, Koenen K, Ascherio A. Coffee, caffeine, and risk of depression among women. Arch Intern Med. 2011;171:1571–1578. doi: 10.1001/archinternmed.2011.393. [DOI] [PMC free article] [PubMed] [Google Scholar]
- 20.de Koning L, Malik VS, Rimm EB, Willett WC, Hu FB. Sugar-sweetened and artificially sweetened beverage consumption and risk of type 2 diabetes in men. Am J Clin Nutr. 2011;93:1321–1327. doi: 10.3945/ajcn.110.007922. [DOI] [PMC free article] [PubMed] [Google Scholar]
- 21.Salvini S, Hunter DJ, Sampson L, Stampfer MJ, Colditz GA, Rosner B, Willett WC. Food-based validation of a dietary questionnaire: the effects of week-to-week variation in food consumption. Int J Epidemiol. 1989;18:858–867. doi: 10.1093/ije/18.4.858. [DOI] [PubMed] [Google Scholar]
- 22.Linn BS, Linn MW, Gurel L. Cumulative illness rating scale. J Am Geriatr Soc. 1968;16:622–626. doi: 10.1111/j.1532-5415.1968.tb02103.x. [DOI] [PubMed] [Google Scholar]
- 23.Beck AT, Steer RA, Ball R, Ranieri W. Comparison of Beck Depression Inventories -IA and -II in psychiatric outpatients. J Pers Assess. 1996;67:588–597. doi: 10.1207/s15327752jpa6703_13. [DOI] [PubMed] [Google Scholar]
- 24.Louis ED, Hernandez N, Ionita-Laza I, Ottman R, Clark LN. Does rate of progression run in essential tremor families? Slower vs faster progressors. Parkinsonism Relat Disord. 2013;19:363–366. doi: 10.1016/j.parkreldis.2012.10.005. [DOI] [PMC free article] [PubMed] [Google Scholar]
- 25.Louis ED, Jiang W, Pellegrino KM, Rios E, Factor-Litvak P, Henchcliffe C, Zheng W. Elevated blood harmane (1-methyl-9H-pyrido[3,4-b]indole) concentrations in essential tremor. Neurotoxicology. 2008;29:294–300. doi: 10.1016/j.neuro.2007.12.001. [DOI] [PMC free article] [PubMed] [Google Scholar]
- 26.Louis ED, Ford B, Bismuth B. Reliability between two observers using a protocol for diagnosing essential tremor. Mov Disord. 1998;13:287–293. doi: 10.1002/mds.870130215. [DOI] [PubMed] [Google Scholar]
- 27.Louis ED, Barnes L, Wendt KJ, Ford B, Sangiorgio M, Tabbal S, Lewis L, Kaufmann P, Moskowitz C, Comella CL, Goetz CC, Lang AE. A teaching videotape for the assessment of essential tremor. Mov Disord. 2001;16:89–93. doi: 10.1002/1531-8257(200101)16:1<89::aid-mds1001>3.0.co;2-l. [DOI] [PubMed] [Google Scholar]
- 28.Louis ED, Ottman R, Ford B, Pullman S, Martinez M, Fahn S, Hauser WA. The Washington Heights-Inwood Genetic Study of Essential Tremor: methodologic issues in essential-tremor research. Neuroepidemiology. 1997;16:124–133. doi: 10.1159/000109681. [DOI] [PubMed] [Google Scholar]
- 29.Louis ED, Ottman R, Clark LN. Clinical classification of borderline cases in the family study of essential tremor: an analysis of phenotypic features. Tremor Other Hyperkinet Mov (N Y) 2014 Feb 10;4:220. doi: 10.7916/D8CF9N23. [DOI] [PMC free article] [PubMed] [Google Scholar]