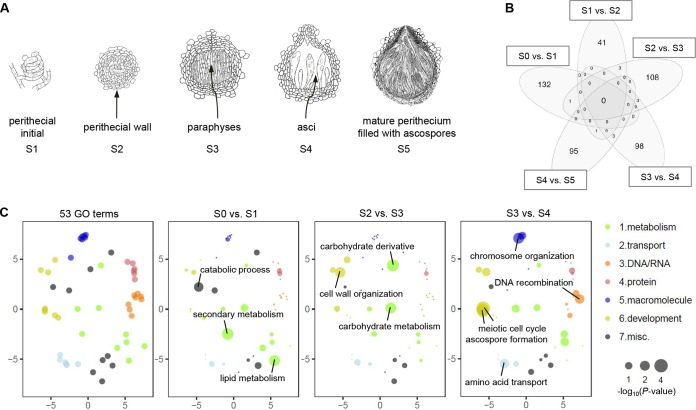
FIG 1 .
Transcriptome of F. graminearum perithecia. (A) Emergence of new tissues at the defined developmental stages during perithecial formation (S1 to S5 [not drawn to scale]). (B) Venn diagram showing the number of differentially expressed (DE) genes between two successive developmental stages (>4-fold; 5% FDR). Note that most of the DE genes were unique in each comparison. (C) Functional enrichment analyses for DE genes between two successive developmental stages. Fifty-three GO terms—which can be broadly categorized into 7 biological processes—were assessed for degree of functional enrichment and were projected to two-dimensional semantic spaces. Only GO terms with a P value of <0.05 are depicted in each panel.

