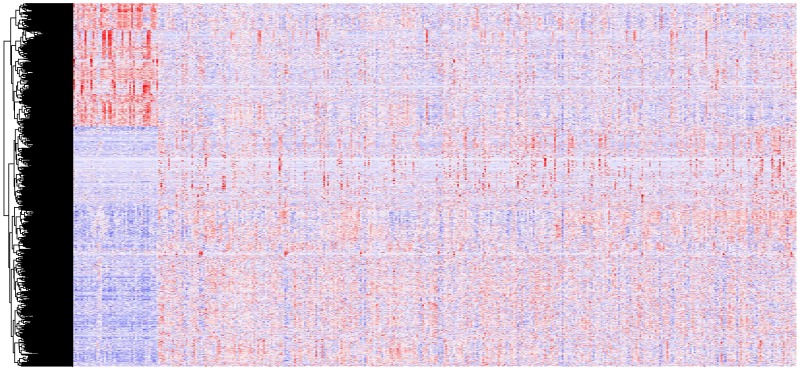
Figure 1. A heat map drawn to show differential lncRNA expression in OSCC and normal tissue samples from the TCGA datasets, which were analyzed with R software.
Representative genes of each cluster were selected and represented as a heat map. Genes shown in red are upregulated and genes in blue are downregulated. The magnitude of the regulation is illustrated by the intensity of the color.

