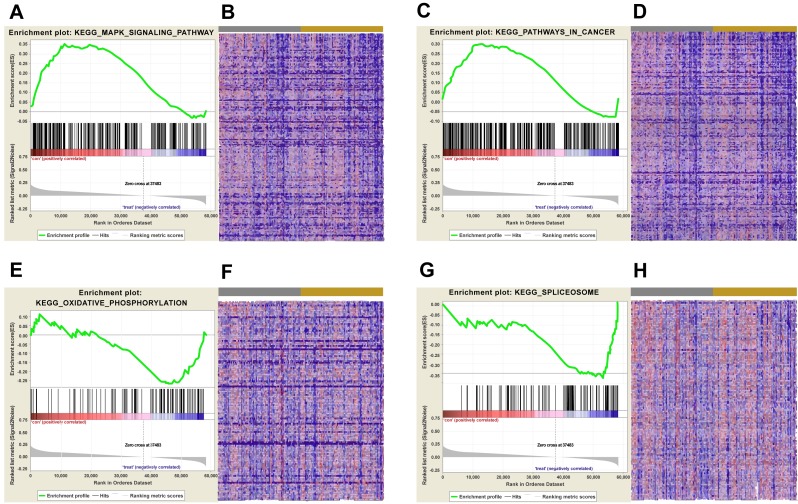
Figure 5. KEGG pathway enrichment analysis of lncRNA AC012456.4.
(A) Enrichment of genes in the KEGG MAPK SIGNALING PATHWAY by GSEA. (B) Heat map of core enrichment genes in the gene set KEGG MAPK SIGNALING PATHWAY. (C) Enrichment of genes in KEGG PATHWAYS IN CANCER by GSEA. (D) Heat map of core enrichment genes from the gene set KEGG PATHWAYS IN CANCER. (E) Enrichment of genes in KEGG OXIDATIVE PHOSPHORYLATION by GSEA. (F) Heat map of core enrichment genes from the gene set KEGG OXIDATIVE PHOSPHORYLATION. (G) Enrichment of genes in KEGG SPLICEOSOME by GSEA. (H) Heat map of core enrichment genes from the gene set KEGG SPLICEOSOME. The GSEA software was used to calculate enrichment levels.

