

Summary
Replay of hippocampal place cell sequences has been proposed as a fundamental mechanism of learning and memory. However, the standard interpretation of replay has been challenged by reports that similar activity is observed before experience (“preplay”). By this account, pre-existing temporal sequences are mapped onto new experiences, without learning sequential structure. Here we employed high density recording methods to monitor hundreds of place cells simultaneously while rats explored multiple novel environments. While we observed large numbers of synchronous spiking events prior to experience, they were not temporally correlated with subsequent experience. Multiple measures differentiated pre-experience and post-experience events, that taken together defined the latter but not the former as trajectory-depicting. The formation of events with these properties was prevented by administration of a NMDA-receptor antagonist during experience. These results suggest that the sequential structure of behavioral episodes is encoded during experience and re-expressed as trajectory events.
Introduction
Hippocampal replay is a phenomenon that occurs mainly during sharp-wave/ripple (SWR) events in the hippocampal LFP, in both awake and sleep states, in which place-responsive neurons are active in precise sequences1-5. Sequences can reflect previous behavioral trajectories3 but also future behavioral trajectories to remembered goal locations6, and SWR disruption studies indicate roles in both retrieval and consolidation of memory7-9. These functions may critically support the well established hippocampal roles in navigation 10,11, and episodic memory 12-15.
The standard interpretation is that replay arises from the sequential ordering imposed on place cells by behavioral experience as an animal moves around16-18, suggesting a memory mechanism16-19. However, it was recently reported that neuronal sequences recorded prior to experience matched the sequential order in which neurons responded subsequently20-22. This “preplay” was reported to occur on the same temporally condensed timescale as replay. The interpretation was that the hippocampus utilizes preexisting temporal sequences to structure the recruitment of cells during behavior. However, an unexpected corollary is that there is no reason to distinguish replay and preplay. Thus, the observation of preplay challenges the notion that replay sequences are learned from experience23.
In order to investigate the dependence of place-cell sequences on experience and on molecular mechanisms associated with learning, we developed an experimental approach combining several features. First, we focused on exploration of novel environments, since novelty promotes both synaptic plasticity and learning. Second, we focused on the simple behavior of running on linear tracks. This hippocampus-independent behavior reliably drives place field responses and offline place-cell sequences (eg 3,5), while allowing the manipulation of molecular mechanisms against a constant behavioral background. Third, we used high density recording methods in order to maximize the number of units recorded across multiple environments, and across multiple days, and combined this methodology with delivery of a highly selective NMDA receptor antagonist, to probe the contribution of molecular mechanisms associated with memory formation.
Results
To investigate the role of experience in the encoding and retrieval of spatial memory, we applied high density electrophysiological recording techniques while animals engaged in exploration of three novel spatial environments in succession. A miniaturized microdrive holding 40 independently adjustable tetrodes (160 channels) was implanted in four rats, with tetrodes targeted bilaterally to dorsal hippocampal area CA1. Across multiple recording days, spike data, local field potentials and behavioral position data were collected, and on average 61 (s.e.m=4.6) putative excitatory hippocampal neurons with place fields were isolated for each recording epoch5. Each recording day (Fig. 1a) began with a rest period (“Sleep 1”) followed by exploration of a novel track (“Run 1”), immediately after which followed a second rest period (“Sleep 2”), followed by two additional novel tracks (“Run 2” and “Run 3”), and a final rest period (“Sleep 3”). The Sleep 2 period was designed to allow the uptake of a drug injected systemically at the beginning of the period, however our initial analyses were restricted to non-drug or saline periods. For each track, firing rate as a function of position was calculated for each active unit to define its place field for that track. For saline sessions, comparison across tracks demonstrated that place cells completely remapped from track to track (Figure 1b; Supplementary Figure 1), while running speeds and firing rates were the same for all three tracks (Supplementary Figure 2 and 3).
Figure 1. No Sequentially Structured Events Prior To Experience.
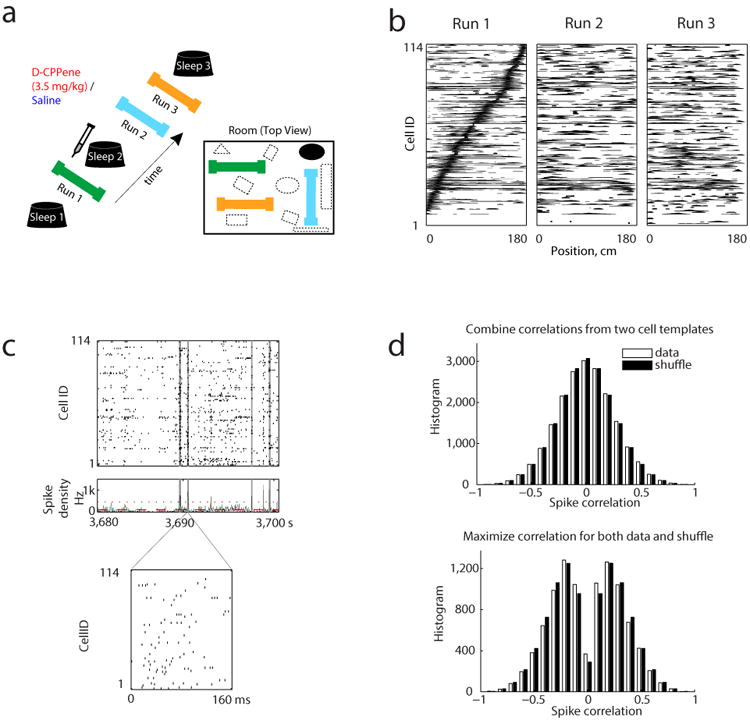
(a) Experimental protocol: (left) Timeline, (bottom right) Recording room layout. (b) Place field rate maps of 114 place cells from one session arranged by their peak firing positions on Track 1. (c) Raster plot (top) and spike density (middle) of 114 simultaneously recorded place cells of a candidate event during Sleep 1. Red dotted line and dashed line represent respectively the thresholds for detecting candidate events and for defining their boundaries. Grey shaded areas represent the time window of candidate events. Bottom plot, spikes emitted during a candidate event shown at expanded time scale. (d) Distribution of spike correlations of 9803 candidate events during Sleep 1. Open bars indicate spiking events versus the original place fields templates; filled bars indicate spiking events versus 5000 shuffled templates scaled down 5000 times. Top, both place fields templates in two running directions were included. Bottom, only the biggest absolute spike correlation resulted from two templates for each candidate event and shuffle were included.
Absence of temporally sequenced events prior to experience
Candidate population events were identified as periods of increased spike density across all recorded units (figure 1c), restricted to times when the animal's speed was below 5 cm/s (see Methods). 86% of candidate events occurred when the animal was at the top or bottom 1/5th of the track, which was where the animals tended to pause to consume food, groom, rest and turn around. Previous reports of preplay utilized measures of the correlation within candidate events between the times of spikes and the rank ordered place field positions of the cells that produced them, as measured during subsequent behavioral testing. Therefore, we initially examined the same measure (Spearman's rank order correlation; see Methods). The histogram of correlations for Sleep 1 candidate events was compared to the histogram for 5000 shuffled data sets, normalized by the number of shuffles (figure 1d). However, there were two alternative methods in the implementation of this procedure, and we considered both. Because there were two running directions on the track, and given the directionality of place cells on the linear track, therefore there were two separate templates available to calculate a rank correlation for each candidate event.
In the first method, we considered both directional templates, generating 2 × the number of candidate events for the actual data, and 2 × 5000 × the number of candidate events for the shuffles. As shown in the upper panel of figure 1d, the histograms of the actual data, and of the shuffles normalized by the number of shuffles, were both unimodal and centered on zero, and appeared to completely overlap. The similarities of the two histograms were evaluated via four different statistical tests. We first proved that the absolute values of the correlations in the actual data and the shuffled data came from distributions with equal variances (Levene's test of homogeneity of variance: p=0.44). We then reported that the absolute values of the correlations were no greater in the actual data than in the shuffled data (median: 0.174 versus 0.172; one-tailed Wilcoxon rank-sum test, p=0.08). Finally we assessed the flanks of the distributions of the absolute values of correlation between the actual data and the shuffled data. The actual data did not have longer tails that associate with greater absolute values of correlation than the shuffled data (one-tailed Kolmogorov-Smirnov test: p=0.122; Monte-Carlo P-value>0.1 with criteria of absolute correlation >0.5 or 0.6 or 0.7, see Methods).
In the second method, we considered only the directional template for each candidate event that maximized the absolute correlation. We likewise chose the best template for each shuffle. Thus there were 1 × the number of candidate events for the actual data, and 1 × 5000 × the number of candidate events for the number of shuffles. As shown in the lower panel of figure 1d, in this case both the actual and normalized shuffle histograms were bimodal, with peaks pushed away from zero, due to systematic maximization of the absolute correlation by selecting the template with the largest absolute value. However, these histograms again appeared to overlap completely, and the absolute values were again statistically no greater in the actual data than in the shuffled data (median: 0.245 versus 0.258; one-tailed Wilcoxon rank-sum test, p=1) with equal variances (Levene's test of homogeneity of variance: p=0.77). The absolute values of correlation did not have longer tails in the actual data than in the shuffled data (one-tailed Kolmogorov-Smirnov test: p=0.998; Monte-Carlo P-value>0.9 with criteria of absolute correlation >0.5 or 0.6 or 0.7, see Methods).
The above results demonstrate the importance of using matching procedures for actual and shuffled data, since the shapes of the distribution differed greatly depending on the method. With neither method did we observe, as in the original reports, a bimodal actual distribution and a unimodal shuffle distribution, with numbers of events equal to 1 × the number of candidate events and 1 × the number of shuffles × the number of candidate events, respectively. These numbers suggest that in the original preplay papers a choice of template was made for each event, but the unimodal shuffle distribution is inconsistent with this procedure. We conducted several further tests on our data to control for possible deviations from the original reports. Our results were not changed when the numbers of cells were subsampled to match the numbers of cells in the original reports (Supplementary Figure 4a). Furthermore, while it might be argued that poor cluster quality might account for our negative finding through the introduction of noise, we in fact determined that the great majority of the units were well clustered, using the L-ratio test (Sleep 1: 435/442, 98%; Supplementary Figure 4b; see Methods). We additionally subsampled from the population to include only those cells with an L-ratio less than or equal to the mean value, with no change in the result (Supplementary Figure 4c).
Trajectory events observed after experience
Given the absence of structure during Sleep 1 that anticipated the subsequent ordering of place fields on the track, we hypothesized that experience led to the establishment of new structure in the activity of place cells during population spiking events. To better analyze this structure, we applied Bayesian position decoding24 (see Methods) to candidate events divided into non-overlapping 20ms time bins, and examined the properties of the decoded position posterior probabilities within each candidate event for both Sleep 1 and Run 1 (figure 2). Note that both sets of decoded events used the same cells, with the same place fields (those measured during Run 1), in order to understand how the structure of activity changed as a function of experience. We first visualized, for one session, the best positively and negatively correlated candidate events, for Sleep 1 (figure 2a) and for Run 1 (figure 2b). The structure of the events differed strikingly between the two epochs, with Sleep 1 events exhibiting no discernible patterns while Run 1 events exhibited clear line-like depictions of trajectories from one end of the track to the other. We then quantified, for all the Sleep 1 (figure 2c, red) and Run 1 (figure 2c, blue) candidate events from all sessions, six different measures of sequence structure: (i) the weighted correlation, defined as Pearson's product-moment correlation weighted by the decoded posterior probability25 (see Methods); (ii) the maximum jump distance within each event between two successive estimates of peak position; (iii) the slope of the best linear fitted trajectory of the posterior probabilities24; (iv) the replay score24, which measures concentration of posterior probability within a line depicting a direct trajectory along the entire track; (v) the sharpness, defined as the amount of posterior probability concentrated near the peak; and (vi) the position occupancy, defined as the fraction of the track depicted by peak decoded posterior probabilities. These quantifications revealed systematic differences in structure between Sleep 1 and Run 1 candidate events. The apparently small differences in slope and position occupancy suggested that it was not because Sleep 1 events represented static locations that they failed to produce correlated events. More strikingly, we found that Run 1 events were more correlated (positively or negatively), had smaller jumps, and were more sharply defined and more concentrated around the linear path along the track. A unifying account of these factors is that they are all properties of the depiction of trajectories through space, and so we hypothesized that Run 1 candidate events encoded trajectories along the track whereas Sleep 1 candidate events did not.
Figure 2. Position Depiction Within Candidate Events During Sleep 1 and Run 1.
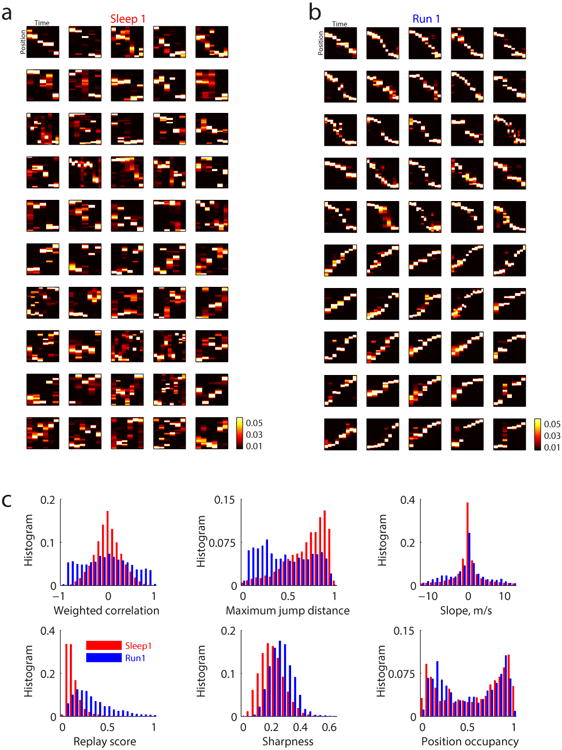
(a) Top 25 positively and top 25 negatively correlated events of Track 1 in Sleep1 using the same 114 cells from Figure 1. Each subplot is the decoding of a candidate event with the y axis representing position and spanning the full length of the track (1.8 meters), and the x axis representing time for which each pixel is 20 ms wide. The scale of decoded posterior probabilities is shown in the colorbar. (b) Top 25 positively and top 25 negatively correlated events of Track 1 in Run 1 using the same 114 cells from Figure1. Scales are the same as in a). (c) Quantifications of 9818 candidate events during Sleep 1 and 4438 candidate events during Run 1. Median ± s.e.m, Sleep 1 versus Run 1: 0.17 ± 0.00 versus 0.40 ± 0.00 for absolute weighted correlation, 0.75 ± 0.00 versus 0.43 ± 0.00 for maximum jump distance, 1.25 ± 0.07 versus 2.5 ± 0.06 for slope, 1.00 ± 0.00 versus 0.27± 0.00 for replay score, 0.19± 0.00 versus 0.26± 0.00 for sharpness, 0.61± 0.00 versus 0.51± 0.00 for position occupancy, all with p<10-10 from Wilcoxon rank sum test.
In order to test statistically the hypothesis of trajectory depiction for different tracks in different conditions, we developed an analysis that measured events in terms of the two strongest differentiating factors, correlation and jump distance, and varied them independently (figure 3). Specifically, we considered all combinations of two thresholds, one on the weighted correlation, and one on the maximum jump distance, and asked how many candidate events passed both thresholds, and compared this number to the distribution of numbers for 5000 shuffled data sets (using the column cycle shuffle, see Methods). This comparison yielded a matrix of significance values, as shown in figure 3a, for Sleep 1 (left matrix) and Run 1 (right matrix) events. Whereas neither threshold by itself separated Sleep 1 and Run 1, except for very high values of the correlation threshold, the joint application of correlation and jump distance thresholds defined a quadrant-shaped region, where Sleep 1 events were highly nonsignificant and Run 1 events were highly significant (green box, figure 3a). We defined these events as “trajectory events”.
Figure 3. Trajectory Events Found Only After Experience.
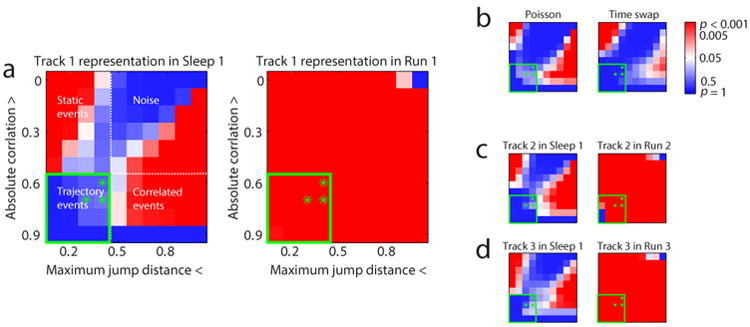
(a) Significance matrix under parameter space of absolute weighted correlation and maximum jump distance. No significant trajectory events (lower left quadrant) of Track 1 experience were detected during Sleep 1, but were present during Run 1. P-values under the green stars denoted detection thresholds are in Supplementary table 1. (b) Significance matrix of control datasets (see Methods) of Track 1 representation in Sleep 1 generated by Poisson simulation (left) and time swap (right). (c and d) Significance matrix of Track 2 and Track 3 representation in Sleep 1 and the current run epoch.
We speculated that the upper left and lower right quadrants of the Sleep 1 matrix might correspond to spurious significance that was not indicative of pre-existing spatial or temporal arrangement of place fields, but rather corresponded to alternative sources of non-uniformity. To test this hypothesis, we generated data sets for which temporal structure was either absent by construction or removed, but in which other forms of structure were preserved. First, we hypothesized that non-uniformity in firing rates might have given rise to significance. Therefore we created Poisson spike trains for each cell for each Sleep 1 candidate event, using for each cell the firing rate averaged across all candidate events (figure 3b, left). The resulting matrix bore a remarkable similarity to the actual Sleep 1 matrix (figure 3a, left), particularly with respect to the lower-right correlated region, suggesting that the non-uniform distribution of firing rates might alone account for the pattern of significance in the Sleep 1 data. Second, we hypothesized that non-uniformity in the distribution of place fields might have given rise to significance. Therefore we generated shuffled candidate events, in which the time bins within each event were swapped randomly, while preserving within each time bin the distribution of posterior probabilities across positions (figure 3b, right). This shuffle also produced a similar pattern of significance to the actual Sleep 1 data. Together these analyses suggested that, when using Bayesian decoding, spurious events were likely to be found if analyzed using thresholds on either correlation or maximum jump distance alone.
We similarly analyzed activity in either Sleep 1 that would be related to Runs 2 and 3, using the templates from the respective runs (figures 3c and 3d). These data demonstrate the complete absence of trajectory depiction in Sleep 1 for any of the three subsequent tracks. We use the trajectory quadrant in the remainder of the paper, to quantify the extent to which trajectory events were observed, under various conditions (with the full set of matrices for all conditions given in Supplementary figure 5). We further considered a trio of specific threshold pairs close to the boundary of the trajectory quadrant (green stars in figures 3 thru 7), that allowed us both to check the sensitivity of the quadrant boundary, and to sample from that part of the quadrant with the least stringent constraints and hence the greatest number of data points, and these significance values for all conditions in the paper are presented in Supplementary table 1.
Figure 7. Changes In Drug Efficacy Were Unlikely To Account For Preserved Retrieval Under D-CPPene.

The timeline shown indicates that when looking at the last 30 minutes of Sleep 2, and the first 30 minutes of Sleep 3, significant trajectory events of Run 1 are retrieved post administration of D-CPPene minutes before rats experience Run 2, and are also retrieved minutes after the completion of Run 3.
Trajectory event encoding was dependent on NMDA receptors
NMDA receptors have long been identified as a key mechanism underlying many forms of synaptic plasticity 26, that have been implicated directly in the formation of hippocampally dependent memories 15,27,28. We hypothesized that if the formation of trajectory events represents the encoding of memory, then it should exhibit a similar pattern of NMDA receptor dependence. We further hypothesized that because NMDA receptor blockade spares the retrieval of previously formed memories15,27-29, the retrieval of trajectory events should similarly be independent of NMDA receptor activation. To investigate these hypotheses, we injected the systemic NMDA receptor antagonist D-CPPene (Supplementary Figure 6) at the beginning of Sleep 2. D-CPPene, the most active enantiomerically pure competitive NMDA antagonist with increased potency and selectivity over other CPP derivatives, is effective for at least 3 hours at the dose used, thus well into Sleep 3 30,31. As for the previously described saline dose, D-CPPene administration did not significantly affect running speed, or average firing rates of the recorded neurons (Supplementary Figure 2, 7).
To first determine if NMDAR antagonism affected the hippocampal representation of space, we examined the place-selective firing characteristics of the recorded units. Place fields of cells under D-CPPene spanned the track as under saline (figure 4a, Supplementary Figure 8), however they were slightly more diffuse, as measured by sparsity32, compared to place fields during pre-drug exploration (Supplementary Figure 7). These very subtle effects on place field structure were in stark contrast to the effects of D-CPPene on trajectory depiction during candidate events. We examined candidate events occurring during stopping periods on the three novel tracks: Runs 1, 2 and 3. During Run 1, which was prior to the injection of drug, clear depictions of linear trajectories were evident in both groups (figure 4b). Indeed, both groups exhibited significance using the quadrant analysis of thresholds on correlation and jump distance defining trajectory events (figure 4e). By contrast, the best correlated events under D-CPPene lacked any apparent structure (figures 4c, d), while under saline the structure was equivalent to Run 1. Moreover, using the quadrant analysis of trajectory events, whereas under saline both Runs 2 and 3 were highly significant for trajectory events, under D-CPPene both runs were not significant (Figure 4 f and g). Thus, in the presence of D-CPPene in Runs 2 and 3, trajectory events were not observed, indicating that despite exhibiting relatively normal place fields, place cells were unable to organize in a sequential pattern reflecting the spatial memory of the running trajectory. To control for population differences in instantaneous place representation not captured by individual place fields, we performed Bayesian position decoding during running behavior 24. The error between the reconstructed position and the actual position was increased under D-CPPene (figure 5a, red lines, Kruskal-Wallis test: H(2)=3270.74, p<10-10), although position estimation was significantly better than chance (figure 5a, dotted black lines, Wilcoxon rank sum test: p<10-10 for all three runs). To determine if this position error alone could account for the absence of trajectory depiction in candidate events, we added noise to saline spike trains to match the position reconstruction error during running (figure 5a, blue lines; Supplementary figure 9, blue for original position reconstruction under saline; see Methods). In striking contrast to the real candidate events under D-CPPene, these degraded spike trains produced clear trajectories (figure 5b, middle and bottom rows) and significant trajectory depiction (figure 5c, middle and bottom rows). A similar pattern of results was observed when using a subset of saline cells with diffuse place fields with sparsity more than 0.5 (Supplementary figure 10). Thus, although position representation during behavior was degraded somewhat under D-CPPene, this degradation did not account for the complete loss of trajectory-depicting structure in D-CPPene candidate events.
Figure 4. NMDAR Antagonism Spares Place Fields But Abolishes Replay.

(a) Place field rate maps of 114 place cells and 111 place cells from two sessions arranged by their peak firing positions on Track2 during Run2 after administration of saline and D-CPPene respectively. (b, c, and d) Top 7 correlated events expressed during Run 1, Run 2 and Run 3 on a saline day (top) and a D-CPPene day (bottom; red box, red dashed box denotes D-CPPene day before drug administration). (e, f, and g) Significance matrix of trajectory events for each run and each condition.
Figure 5. Trajectory Events Under Degraded Saline Place Field Decoder.

(a) Position decoding for each Run using original place fields for D-CPPene days (red) and original/degraded place fields for saline days (blue). For the pre-drug epoch, saline position decoding matches that of D-CPPene and so is included without degradation, as a baseline comparison. For subsequent epochs, noise has been added to the saline epochs until the position decoding matches that of the D-CPPene group. Black and dashed black lines are the decoding qualities at chance level for saline or D-CPPene days. Median ± s.e.m of construction error, Wilcoxon rank sum test: 4.34 ± 0.25 versus 4.86± 0.25, original saline versus D-CPPene in Run 1, p=0.08; 12.68 ± 0.40 versus 13.23± 0.43, saline versus D-CPPene in Run 2, p=0.42; 20.28 ± 0.44 versus 16.94± 0.46, degraded saline versus D-CPPene in Run 3, p<10-10. All the decoding error curves are significantly better than chance (p<10-10). (b) Top seven correlated events expressed during saline Runs using original or degraded saline place field decoder. (c) Corresponding significance matrix for trajectory events.
Trajectory event retrieval was independent of NMDA receptors
To determine whether a distinction between encoding and retrieval existed for the effect of NMDA receptor antagonism on trajectory events, we examined decoded position during candidate events occurring in Sleep 3, using spike trains and place fields obtained from either Runs 1, 2 or 3. In this way we quantified the occurrence of trajectory events of Runs 1, 2 or 3 during Sleep 3, while NMDA receptors remained blocked by D-CPPene or alternatively under saline (Fig. 6). Under saline, significant numbers of trajectory events were observed in Sleep 3 for all three prior experiences (Figs 6b-g, upper panels). Under D-CPPene, consistent with the earlier results for awake replay, trajectory events were not observed in Sleep 3 for either post-injection Run (i.e. Runs 2 and 3; Figs 6c,d,f,g, lower panels). However, in striking contrast to these results, trajectory events of Run 1 were strongly observed in Sleep 3 under D-CPPene (Fig 6b, lower panel; Fig. 6e, lower panel). Thus, trajectory events were observed under the blockade of NMDAR-dependent synaptic plasticity, for behavioral episodes experienced prior to the blockade. This distinction between encoding and retrieval is further illustrated by examining the 30 minutes of sleep immediately preceding Run 2, or the 30 minutes immediately following Run 3 (Fig. 7). Each of these periods was immediately proximate to a period during which the presence of D-CPPene prevented the encoding of new memory. For example, trajectory events were not observed in Run 2 under D-CPPene (Figs. 4c,f, lower panels), whereas by contrast during the 30 minutes immediately preceding, trajectory events of Run 1 were observed (Fig. 7, left-hand side). Likewise, whereas trajectory events were not observed during Run 3 under D-CPPene (Figs. 4d, g, lower panels), by contrast during the 30 minutes immediately following, trajectory events of Run 1 were observed (Fig. 7, right-hand side). Thus, the abolition of trajectory events was highly selective even within similar time periods, with a requirement for NMDAR activation in the encoding of sequence memories but not for the retrieval of sequence memories that had already been encoded. In a final analysis of sequence retrieval, we noted that in saline controls there was an apparent recency effect, with the rate of trajectory events for Runs 1 and 2 apparently reduced compared to rate of trajectory events for Run 3 (figure 8, blue curves). By contrast, the rate of trajectory events of Run 1 under D-CPPene demonstrated the opposite pattern (figure 8, red curves). These data suggest the interpretation that, for the D-CPPene sessions, Run 1 was the last experience that had been encoded.
Figure 6. NMDA Receptor Function is not Required for Replay Retrieval.

(a) Experimental timeline. Sleep 3 began at an average of 2.5hrs into the recordings and continued for another 2.5hrs. (b, c and d) Top 7 correlated events of Track 1, Track 2, and Track 3 during Sleep 3 under saline (top) and D-CPPene (bottom). (e, f and g) Corresponding significance matrix for trajectory events.
Figure 8. Retrieved Trajectory Events Over Time.

Rate of Run 1, Run 2, and Run 3 retrieved trajectory events in a 45 min period during Sleep 3 across all animals under saline (blue) and D-CPPene conditions. Corresponding bars illustrate the average number of retrieved trajectory events in a 5min period for each run and each condition (errorbar denotes s.e.m.) under detection thresholds of absolute correlation greater than 0.6 and maximum jump distance less than 0.4. Boxplot at the top, rate of retrieved trajectory events between Saline and D-CPPene, Wilcoxon rank sum test: p=0.07 for Run 1, p=1.73*10-4 for Run 2, p=1.22*10-11 for Run 3. Box edges are the 25th (q1) and 75th (q3) percentiles of the data. Black line in the box shows the median. Red crosses mark the biggest or smallest outlier. Outliers are defined as values larger than q3 + 1.5*(q3 – q1) or smaller than q1 – 1.5*(q3 – q1). The black whiskers extend to the most extreme data points not considering outliers.
Discussion
We have investigated the experience dependence of offline place cell sequences. Previously, these sequences have been reported both following experience (“replay”) but also preceding any experience (“preplay”). The conceptual challenge of preplay is that if the sequences pre-exist, then replay, as measured in the hippocampus, cannot be interpreted as evidence of learning or memory formation. However, in this study we find no evidence for the existence of preplay sequences, using similar quantification methods to the original reports20-22, but with much larger numbers of simultaneously recorded units. Following the preplay literature22, we have tested for preplay in multiple subsequent environments, with the same result. In order to further understand these data, we took advantage of the large number of cells recorded simultaneously, and recently developed decoding methods, to measure the fine spatio-temporal structure of both pre-experience and post-experience events. These methods revealed that post-experience events were better correlated, less jumpy, more sharply defined and more linear; we have summarized these findings with the designation “trajectory events”. Thus, in contrast to the original reports that may not have had the cell counts to resolve such differences, we find that experience results in a dramatic reorganization of place cell activity, to reflect the contingencies between places in the experienced environment that define behavioral trajectories.
These findings have implications for the mechanism by which hippocampal cells acquire place fields. If preplay sequences dominated, then any given place cell would potentially have to become associated with the arbitrary set of inputs at the location where the cell has been “pre-ordained” to fire. Whereas, recent studies suggest that the input to all hippocampal cells is spatially modulated33, in accordance with a model whereby place cells begin with a place field and learn the contingencies between places, expressed as sequences, only through experience. Further, we recently dissociated place field responses including intact phase precession during the first run in a novel environment, from theta sequences emerging later34. Our present data strongly support this model, since we find no evidence for a pre-existing temporal order for place cells. 31,35
Having found that trajectory events require experience for their formation, we examined the role of NMDA receptors as a possible molecular mechanism for sequence formation, and determined that they were required for the encoding but not the retrieval of trajectory events. Curiously, NMDAR blockade has been reported to have little 35,36 or no 31 effect on place field formation in novel environments over time periods at least as long as the 20-30 minute track exposure times we have examined, a result that we replicated. This starkly contrasts with the well-established role of NMDARs in spatial learning 27,28. For example, Morris and colleagues recently tested naïve rats in a novel watermaze task, matching the novelty condition in our study, and reported that while controls acquired asymptotically direct paths by the fourth of ten trials, that is, with approximately 2 minutes of experience distributed over just 11 minutes, rats under NMDAR blockade showed no improvement37. Hence, place fields by themselves do not reliably predict memory function. Increased sophistication has been achieved with studies of pairwise reactivation of place cells, with pioneering early studies demonstrating the importance of NMDARs 35, however pairwise studies have yielded a complex picture with respect to NMDA receptor dependence, in which the dependence has been reported for some task aspects and not others 38, or for some pairwise measures of reactivation and not others 39. Pairwise measures are inconsistent in the presence of sequential structure3,40, and so are unlikely to identify trajectory events reliably, a problem exacerbated by diversity in sequence structure2,4-6,41. Our data suggest that larger scale recordings are necessary to characterize the establishment of trajectory events.
Finally, we might consider what kind of information is acquired and encoded during the experience-dependent formation of trajectory events. It has been demonstrated that, provided the logical contingencies between locations in an environment are known or have at least been sampled, the hippocampus is capable of generating place-cell sequences in an order that has never been experienced2,4,5,24,41, and sequences that depict as yet never experienced trajectories6,41, in particular, novel paths to a remembered goal6. Together these results raise the possibility that the encoding process for trajectory events may not consist of recording or reinforcing specific sequences of experience for veridical playback, but rather the learning of underlying contingencies in environments. In this sense, replay sequences might be thought of as constructive attempts to read out information from a learned cognitive map11, where the underlying contingencies are learned from experience and stored in the synaptic matrix, but where specific retrieval events can be modified uniquely to suit the requirements of the current task. In this way, hippocampal replay provides a model system that can reconcile the mnemonic14 and constructive 42 aspects of the brain's episodic memory system43.
Online Methods
Experimental Overview and Pre-Training
A total of 4 male Long Evans rats weighing 450 – 550 grams, 10-20 weeks old were used in this study. All procedures were approved by the Johns Hopkins University Animal Care and Use Committee and followed US National Institutes of Health animal use guidelines. Animals were first habituated to daily handling and food deprived to 85-90% of their baseline weight and pre-trained to run back and forth on a 1.8m linear track to receive a liquid chocolate-flavored reward (Carnation). The tracks had two reward delivery wells at the ends. Rats were trained on a separate linear track designated for training and in a room different from the recording room. Each training session lasted 30-45 min or when rats completed 20-30 laps. Rats only received a reward if they completed a full lap. Following recovery from surgery animals were food-deprived again and retrained on the training linear track with recording cables attached for approximately two days before recording sessions began.
Surgical Implantation and Tetrode Adjustment
Rats were trained for 2-3 weeks and surgically implanted with a microdrive array (25-30g) with 40 independently moveable, gold-plated tetrodes, 20 on each hemisphere. Tetrodes were gold plated to an impedance of <150 MOhms prior to surgery. Each tetrode consisted of groups of four twisted 17.8 μm platinum/10% iridium wires from Neurolalynx bundled together. Tetrodes were aimed at dorsal hippocampal region CA1 (4.00mm AP and 2.8mm ML) and a bone screw attached to the skull served as the ground. Placement of tetrodes and recordings were performed as previously described 5. The tetrodes were slowly lowered into the CA1 pyramidal layer over a 1 week period using characteristic EEG patterns (ripples and sharp waves) and neural firing patterning as guide into the pyramidal cell layer.
Behavior and Pharmacology
The rat's position was tracked using two LED diodes (red and green) mounted on the microdrive and detected by an overhead camera capturing the behavior at 60Hz. A recording day began with a 1hr pre-sleep session, and was followed by running on a novel linear track during Run 1. Rats received either a saline or 3.5 mg/kg i.p. injection of D-CPPene (D-4-[(2E)-3-Phosphono-2-propenyl]-2-piperazincecarboxylic acid, Tocris Bioscience), and slept or remained at quiet rest during sleep session 2 for a period of 45 min. Data collection and analysis were not performed blind to this condition. Rats ran on two more novel linear tracks during Runs 2 and 3 for a period of 30-45 min each. The recording day ended with a long late sleep/quiet rest session of at least 2hrs in duration. All tracks were equally novel at the time of recording, and rats did not experience the same track twice. Each track was 1.8 m long, 6 cm wide, with two 15 cm long end areas each 13 cm wide where the reward delivery wells were located. If rats were injected with D-CPPene the next recording would take place 48 hours later to make sure that the drug had completely washed out.
D-CPPene is a potent and competitive NMDA receptor antagonist. D-CPPene is an analogue of D-CPP, 2.2 times more potent than D-CPP and 4.7 times more potent than the racemic mixture DL-CPP (Lowe et al., 1990). The calculated potencies indicate that a lower concentration of D-CPPene is required to saturate the NMDA receptors and the dissociation constants reveal that less drug is required to occupy 50% of the receptor and produce the physiologic effect (Lowe et al.,1990). Kentros et al. determined the effect of a 10 mg/kg dose of DL-CPP by examining the effects of DL-CPP on primed-burst potentiation in awake, freely moving rats and report that DL-CPP blocks primed-burst potentiation at 90 min and 180 min after systemic administration, and is no longer effective after 24 hrs31. Given the chemical characteristics and reported potencies of each analogue, the 3.5 mg/kg dose of D-CPPene administered systemically in this study would equate to a 16.5 mg/kg dose of DL-CPP. We can then infer that in our experimental design, D-CPPene was effective for at least 180min, when animals were well into sleep 3.
Neural Analysis
In total seven saline sessions and seven D-CPPene sessions from four rats were included in the study, each rat contributed at least one saline and one D-CPPene session. Track 1 representation in Sleep 1 was accessed using a subset of four saline sessions and four D-CPPene sessions from four rats. Unless otherwise noted, all other group analysis were based on seven recording sessions under either saline or D-CPPene conditions. No statistical methods were used to predetermine sample sizes, but our sample sizes are similar to those generally employed in the field.
Data Acquisition
All data was collected using the Digital Lynx data acquisition system (Neuralynx). Analog neural signals were digitized at 32556 Hz. Spike threshold crossings (50 μV) were recorded at 32556 Hz. Continuous local field potential data were digitally filtered between 0.1 and 500 Hz and recorded at 3256 Hz. Cells were isolated manually using the spike waveform clustering program XCLUST (xclust2, Matt A. Wilson). Putative inhibitory neurons were excluded on the basis of spike width. Well isolated clusters were confirmed with Lratio < 0.05, with values calculated using the peak amplitude of each waveform as the feature set 43, 6. Briefly, the Lratio value of cluster C is
where ns is the total number of spikes recorded on the tetrode throughout the recording epoch, i ∉ C is the set of spikes which are not members of cluster C, and is the cumulative distribution function of the χ2 distribution with df = 4.
Place Fields
Position was linearized and binned into 2.5 cm bins. Directional place fields were calculated as the number of spikes fired in a particular position bin and running direction divided by the time spent in that bin, smoothed with a Gaussian kernel with a standard deviation of 5 cm, and identified when the peak firing rate of the pyramidal cell along the position bins was no less than 1 Hz. The place field size was defined as the total area of position bins where the firing rates were no less than 1 Hz. Sparsity was calculated as a measure of spatial selectivity, to determine how diffuse the place cell firing was along the linear track:
where f is the firing rate, and the expectations are calculated across all positions. Place cell average firing rate were calculated as the mean firing rate across all the position bins for each cell (Supplementary figure 3 and 7). Place cell remapping index was defined as the Pearsons' linear correlation coefficient between place cell's peak firing positions on the current running track and the cell order from either the same or a different track (Supplementary figure 3 and 7, e.g. 1->3 denotes place cells on track 3 ordered by the firing order of the same cell on track 1).
Decoding Run
Probability based decoding of position information was performed as previously described 24. The posterior probability of the animal's position (pos) across M total position bins given a time window (τ) containing neural spiking (spikes) is
where
and fi(pos, dirk) is the place field of one running direction of the i-th unit, assuming independent rates and Poisson firing statistics for all N units and a uniform prior over position. A time window of 250 ms was used to estimate the rat's position on a behavioral timescale. A time window of 20 ms was used to estimate position during candidate population events. Position reconstruction error during the run was defined as the distance between animal's current location and the peak decoded position in each 250 ms decoded time bin while the speed of the animal is more than 5 cm/s. Chance level of reconstruction error was determined by performing the same calculation except substituting the peak decoded positions with random positions.
Place Cell Ensemble Activity Analysis
Place cell ensemble activity was examined during stopping periods where the speed of the animal was less than 5 cm/s. Candidate population events were identified during periods of increased spike density, with peaks greater than 3 standard deviations above the mean in the smoothed histogram (Gaussian kernel, standard deviation of 10 ms). Start and end boundaries for each candidate population event were defined where the smoothed histogram crossed the mean. Only candidate events with 100 to 500 ms duration were included in the study. Numbers of candidate events for each rat and each session under different epochs were detailed in Supplementary table 2.
Spike correlation of each candidate event was calculated as the Spearman's rank order correlation between the time of spikes and the ranked peak firing positions of the corresponding place cells. Because there were two running directions along a linear track and place cells are direction selective, we calculated spike correlations using two templates of place cell ranked peak firing positions, each corresponding to a running direction. A small portion of candidate events (15 out of 9803 in Sleep 1) was excluded because the place cells that emitted spikes during those events had the same peak firing positions, and consequently real number correlation values could not be obtained from them. The shuffled data were created through randomly shuffle cell identities for 5000 times. The absolute values of spike correlations between original and shuffled datasets were compared, either when combing two values from both templates (Fig. 1d, top) or only used the maximum value (Fig. 1d, bottom), and the statistical significance for this comparison was evaluated using Levene's test, one-tailed Wilcoxon rank sum test, one-tailed Kolmogorov-Smirnov test and Monte-Carlo P-values. The Monte-Carlo P-value was calculated as (n + 1)/(r + 1), where r is the total number of shuffles and n is the number of shuffles that produce more events with absolute spike correlations more than 0.5 or 0.6 or 0.7 than the actual data. The same quantification on down-sampled place cells was done by randomly choosing 15 place cells for each recording session (Supplementary figure 4a) or by choosing place cells that had Lratio equal to or less than the median value (Supplementary figures 4b,c).
Sequential structure of candidate events was estimated through the decoded posterior probabilities with six different measurements. (i) Weighted correlation: decoded probabilities (prob) were assigned as weights of position estimates to calculate the correlation coefficient between time (T) and decoded position (P):
where weighted covariance between time and decoded position is
and weighted means of time and decoded position are
(ii) Maximum jump distance was defined as the maximum distance between peak decoded positions in neighboring decoded time windows for each candidate event normalized by the length of the track. The decoded slope (iii) and replay score (iv) were defined as described in (Davidson et al, 2009): The likelihood (R) that the decoded candidate event (duration of n time bins) is along the fitted line with slope (V) and starting location (ρ) was calculated as the averaged decoded probability in a 30 cm vicinity along the fitted line:
Where Δt is the moving step of the decoding time window (20 ms), and the value of d was empirically set to 15 cm for small local variations in slope (for those time bins k when the fitted line would specify a location beyond the end of the track, the median probability of all possible locations is taken as the likelihood). To determine the most likely slope for each candidate event, we densely sampled the parameter space of V and ρ to find the values that maximize R. (v) Sharpness was defined maximum decoded posterior probability for each candidate event. (vi) Position occupancy was defined as the percentage of the track that was covered by the peak decoded positions of all the decoded time bins.
Trajectory events were defined as candidate events that obtained both strong weighted correlation (corr) and small maximum jump distance (dis) in the decoding (green stars in Fig. 3-7, corr > 0.6 & dis < 0.4, corr > 0.7 & dis < 0.4, corr > 0.7 & dis < 0.3). In order to access whether significant number of trajectory events can be observed under different conditions, we calculated the number of candidate events that passed both correlation and jump distance thresholds under all combinations, and compared them with the distribution of numbers from 5000 shuffled data sets that were generated through column-cycle shuffle24, which was done by circularly shift posterior probabilities of each decoded time bin by a random distance. The Monte-Carlo P-value was calculated as (n + 1)/(r + 1), where r is the total number of shuffles and n is the number of shuffles that produce more trajectory events that met the criteria than the actual data. We subsequently represented P-values under all combinations of two thresholds in a color-coded matrix (significance matrix), where a P-Value below 0.05 was considered significant and marked in red. To validate the detection thresholds for trajectory events, we generated two different control datasets as follows: (i) Poisson simulation: the spike train for each place cell was generated under homogeneous Poisson process, with the firing rate for each cell given by the mean firing rate across all candidate events; (ii) Time swap: the posterior probability distribution of every 20 ms decoded time bins were randomly swapped with each other within each candidate event. Trajectory events should be absent in the control datasets, as both of them theoretically lack temporal sequential structures (Figure 3).
In order to match the position reconstruction error during running between saline and D-CPPene sessions, we gradually added noise to the spike trains of saline sessions until the “degraded” decoding quality was worse or at least equal than the D-CPPene sessions tested by Wilcoxon rank sum test. This was done by first binning spikes into every 20 ms bins, and then further dividing each 20 ms bin into 20 sub bins (each sub bin is 1 ms), and randomly shuffling cell identities for the spikes within all the even number sub bins except the 20th for Run 2 (effectively shuffle 45% of the spikes), and within all the odd number sub bins as well as the 20th for Run 3 (effectively shuffle 55% of the spikes). Cell identities were shuffled in the same manor for both behavior decoding and the decoding of candidate events. The decoding quality during Run 1 in D-CPPene was as good as in saline days so no degraded decoder was needed for saline Run 1 (Supplementary Figure 9). Degrading the saline decoder by using only the subset of place fields with sparsity value greater than 0.5 yielded similar results (Supplementary Figure 10).
Supplementary Material
Acknowledgments
This work was supported by the Alfred P. Sloan Foundation (D.J.F.), the National Institute for Mental Health (D.J.F.) and the National Science Foundation (D.S.)
Footnotes
Author Information: The authors declare no competing financial interests.
References
- 1.Wilson MA, McNaughton BL. Reactivation of hippocampal ensemble memories during sleep. Science. 1994;265:676–679. doi: 10.1126/science.8036517. [DOI] [PubMed] [Google Scholar]
- 2.Diba K, Buzsaki G. Forward and reverse hippocampal place-cell sequences during ripples. Nat Neurosci. 2007;10:1241–1242. doi: 10.1038/nn1961. doi:nn1961[pii]10.1038/nn1961. [DOI] [PMC free article] [PubMed] [Google Scholar]
- 3.Lee AK, Wilson MA. Memory of sequential experience in the hippocampus during slow wave sleep. Neuron. 2002;36:1183–1194. doi: 10.1016/s0896-6273(02)01096-6. doi:S0896627302010966[pii] [DOI] [PubMed] [Google Scholar]
- 4.Karlsson MP, Frank LM. Awake replay of remote experiences in the hippocampus. Nat Neurosci. 2009;12:913–918. doi: 10.1038/nn.2344nn.2344[pii]. [DOI] [PMC free article] [PubMed] [Google Scholar]
- 5.Foster DJ, Wilson MA. Reverse replay of behavioural sequences in hippocampal place cells during the awake state. Nature. 2006;440:680–683. doi: 10.1038/nature04587. doi:nature04587[pii]10.1038/nature04587. [DOI] [PubMed] [Google Scholar]
- 6.Pfeiffer BE, Foster DJ. Hippocampal place-cell sequences depict future paths to remembered goals. Nature. 2013;497:74–79. doi: 10.1038/nature12112. [DOI] [PMC free article] [PubMed] [Google Scholar]
- 7.Girardeau G, Benchenane K, Wiener SI, Buzsaki G, Zugaro MB. Selective suppression of hippocampal ripples impairs spatial memory. Nat Neurosci. 2009;12:1222–1223. doi: 10.1038/nn.2384. doi:nn.2384[pii]10.1038/nn.2384. [DOI] [PubMed] [Google Scholar]
- 8.Ego-Stengel V, Wilson MA. Disruption of ripple-associated hippocampal activity during rest impairs spatial learning in the rat. Hippocampus. 2010;20:1–10. doi: 10.1002/hipo.20707. [DOI] [PMC free article] [PubMed] [Google Scholar]
- 9.Jadhav SP, Kemere C, German PW, Frank LM. Awake Hippocampal Sharp-Wave Ripples Support Spatial Memory. Science. 2012 doi: 10.1126/science.1217230. doi:science.1217230[pii]10.1126/science.1217230. [DOI] [PMC free article] [PubMed] [Google Scholar]
- 10.Olton DS, Samuelson RJ. Remembrance of places past: spatial memory in rats. J Exp Psychol Anim Behav Process. 1976;2:97–116. [Google Scholar]
- 11.O'Keefe J, Nadel L. The Hippocampus As A Cognitive Map. Clarendon; 1978. [Google Scholar]
- 12.Gaffan D. Scene-specific memory for objects: a model of episodic memory impairment in monkeys with fornix transection. J Cogn Neurosci. 1994;6:305–320. doi: 10.1162/jocn.1994.6.4.305. [DOI] [PubMed] [Google Scholar]
- 13.Wood ER, Dudchenko PA, Eichenbaum H. The global record of memory in hippocampal neuronal activity. Nature. 1999;397:613–616. doi: 10.1038/17605. [DOI] [PubMed] [Google Scholar]
- 14.Scoville WB, Milner B. Loss of recent memory after bilateral hippocampal lesions. J Neurol Neurosurg Psychiatry. 1957;20:11–21. doi: 10.1136/jnnp.20.1.11. [DOI] [PMC free article] [PubMed] [Google Scholar]
- 15.Steele RJ, Morris RG. Delay-dependent impairment of a matching-to-place task with chronic and intrahippocampal infusion of the NMDA-antagonist D-AP5. Hippocampus. 1999;9:118–136. doi: 10.1002/(SICI)1098-1063(1999)9:2<118∷AID-HIPO4>3.0.CO;2-8. [DOI] [PubMed] [Google Scholar]
- 16.Suzuki WA. Encoding new episodes and making them stick. Neuron. 2006;50:19–21. doi: 10.1016/j.neuron.2006.03.029. doi:S0896-6273(06)00226-1[pii]10.1016/j.neuron.2006.03.029. [DOI] [PubMed] [Google Scholar]
- 17.Miller EK, Wilson MA. All my circuits: using multiple electrodes to understand functioning neural networks. Neuron. 2008;60:483–488. doi: 10.1016/j.neuron.2008.10.033. doi:S0896-6273(08)00898-2 [pii]10.1016/j.neuron.2008.10.033. [DOI] [PubMed] [Google Scholar]
- 18.Carr MF, Jadhav SP, Frank LM. Hippocampal replay in the awake state: a potential substrate for memory consolidation and retrieval. Nat Neurosci. 2011;14:147–153. doi: 10.1038/nn.2732. doi:nn.2732[pii]10.1038/nn.2732. [DOI] [PMC free article] [PubMed] [Google Scholar]
- 19.Sadowski JH, Jones MW, Mellor JR. Ripples make waves: binding structured activity and plasticity in hippocampal networks. Neural Plast. 2011;2011:960389. doi: 10.1155/2011/960389. [DOI] [PMC free article] [PubMed] [Google Scholar]
- 20.Dragoi G, Tonegawa S. Preplay of future place cell sequences by hippocampal cellular assemblies. Nature. 2011;469:397–401. doi: 10.1038/nature09633. doi:nature09633[pii]10.1038/nature09633. [DOI] [PMC free article] [PubMed] [Google Scholar]
- 21.Dragoi G, Tonegawa S. Development of schemas revealed by prior experience and NMDA receptor knock-out. eLife. 2013;2:e01326. doi: 10.7554/eLife.01326. [DOI] [PMC free article] [PubMed] [Google Scholar]
- 22.Dragoi G, Tonegawa S. Distinct preplay of multiple novel spatial experiences in the rat. Proc Natl Acad Sci U S A. 2013;110:9100–9105. doi: 10.1073/pnas.1306031110. [DOI] [PMC free article] [PubMed] [Google Scholar]
- 23.Dragoi G, Tonegawa S. Selection of preconfigured cell assemblies for representation of novel spatial experiences. Philos Trans R Soc Lond B Biol Sci. 2014;369:20120522. doi: 10.1098/rstb.2012.0522. [DOI] [PMC free article] [PubMed] [Google Scholar]
- 24.Davidson TJ, Kloosterman F, Wilson MA. Hippocampal replay of extended experience. Neuron. 2009;63:497–507. doi: 10.1016/j.neuron.2009.07.027. doi:S0896-6273(09)00582-0[pii]10.1016/j.neuron.2009.07.027. [DOI] [PMC free article] [PubMed] [Google Scholar]
- 25.Wu X, Foster DJ. Hippocampal replay captures the unique topological structure of a novel environment. The Journal of neuroscience : the official journal of the Society for Neuroscience. 2014;34:6459–6469. doi: 10.1523/JNEUROSCI.3414-13.2014. [DOI] [PMC free article] [PubMed] [Google Scholar]
- 26.Malenka RC, Bear MF. LTP and LTD: an embarrassment of riches. Neuron. 2004;44:5–21. doi: 10.1016/j.neuron.2004.09.012. [DOI] [PubMed] [Google Scholar]
- 27.Morris RG. Synaptic plasticity and learning: selective impairment of learning rats and blockade of long-term potentiation in vivo by the N-methyl-D-aspartate receptor antagonist AP5. J Neurosci. 1989;9:3040–3057. doi: 10.1523/JNEUROSCI.09-09-03040.1989. [DOI] [PMC free article] [PubMed] [Google Scholar]
- 28.Shapiro ML, Caramanos Z. Nmda Antagonist Mk-801 Impairs Acquisition but Not Performance of Spatial Working and Reference Memory. Psychobiology. 1990;18:231–243. [Google Scholar]
- 29.Bannerman DM, Good MA, Butcher SP, Ramsay M, Morris RG. Distinct components of spatial learning revealed by prior training and NMDA receptor blockade. Nature. 1995;378:182–186. doi: 10.1038/378182a0. [DOI] [PubMed] [Google Scholar]
- 30.Lowe DA, Neijt HC, Aebischer B. D-CPP-ene (SDZ EAA 494), a potent and competitive N-methyl-D-aspartate (NMDA) antagonist: effect on spontaneous activity and NMDA-induced depolarizations in the rat neocortical slice preparation, compared with other CPP derivatives and MK-801. Neurosci Lett. 1990;113:315–321. doi: 10.1016/0304-3940(90)90604-8. [DOI] [PubMed] [Google Scholar]
- 31.Kentros C, et al. Abolition of long-term stability of new hippocampal place cell maps by NMDA receptor blockade. Science. 1998;280:2121–2126. doi: 10.1126/science.280.5372.2121. [DOI] [PubMed] [Google Scholar]
- 32.Jung MW, Wiener SI, McNaughton BL. Comparison of spatial firing characteristics of units in dorsal and ventral hippocampus of the rat. J Neurosci. 1994;14:7347–7356. doi: 10.1523/JNEUROSCI.14-12-07347.1994. [DOI] [PMC free article] [PubMed] [Google Scholar]
- 33.Lee D, Lin BJ, Lee AK. Hippocampal place fields emerge upon single-cell manipulation of excitability during behavior. Science. 2012;337:849–853. doi: 10.1126/science.1221489. [DOI] [PubMed] [Google Scholar]
- 34.Feng T, Silva D, Foster DJ. Dissociation between the Experience-Dependent Development of Hippocampal Theta Sequences and Single-Trial Phase Precession. The Journal of neuroscience : the official journal of the Society for Neuroscience. 2015;35:4890–4902. doi: 10.1523/JNEUROSCI.2614-14.2015. [DOI] [PMC free article] [PubMed] [Google Scholar]
- 35.McHugh TJ, Blum KI, Tsien JZ, Tonegawa S, Wilson MA. Impaired hippocampal representation of space in CA1-specific NMDAR1 knockout mice. Cell. 1996;87:1339–1349. doi: 10.1016/s0092-8674(00)81828-0. doi:S0092-8674(00)81828-0[pii] [DOI] [PubMed] [Google Scholar]
- 36.Ekstrom AD, Meltzer J, McNaughton BL, Barnes CA. NMDA receptor antagonism blocks experience-dependent expansion of hippocampal “place fields”. Neuron. 2001;31:631–638. doi: 10.1016/s0896-6273(01)00401-9. doi:S0896-6273(01)00401-9[pii] [DOI] [PubMed] [Google Scholar]
- 37.Morris RG, Steele RJ, Bell JE, Martin SJ. N-methyl-d-aspartate receptors, learning and memory: chronic intraventricular infusion of the NMDA receptor antagonist d-AP5 interacts directly with the neural mechanisms of spatial learning. Eur J Neurosci. 2013;37:700–717. doi: 10.1111/ejn.12086. [DOI] [PubMed] [Google Scholar]
- 38.Dupret D, O'Neill J, Pleydell-Bouverie B, Csicsvari J. The reorganization and reactivation of hippocampal maps predict spatial memory performance. Nat Neurosci. 2010;13:995–1002. doi: 10.1038/nn.2599nn.2599[pii]. [DOI] [PMC free article] [PubMed] [Google Scholar]
- 39.Gerrard JL, Burke SN, McNaughton BL, Barnes CA. Sequence reactivation in the hippocampus is impaired in aged rats. J Neurosci. 2008;28:7883–7890. doi: 10.1523/JNEUROSCI.1265-08.2008. [DOI] [PMC free article] [PubMed] [Google Scholar]
- 40.Quirk MC, Wilson MA. Interaction between spike waveform classification and temporal sequence detection. J Neurosci Methods. 1999;94:41–52. doi: 10.1016/s0165-0270(99)00124-7. doi:S0165-0270(99)00124-7[pii] [DOI] [PubMed] [Google Scholar]
- 41.Gupta AS, van der Meer MA, Touretzky DS, Redish AD. Hippocampal replay is not a simple function of experience. Neuron. 2010;65:695–705. doi: 10.1016/j.neuron.2010.01.034. doi:S0896-6273(10)00060-7[pii]10.1016/j.neuron.2010.01.034. [DOI] [PMC free article] [PubMed] [Google Scholar]
- 42.Hassabis D, Kumaran D, Vann SD, Maguire EA. Patients with hippocampal amnesia cannot imagine new experiences. Proc Natl Acad Sci U S A. 2007;104:1726–1731. doi: 10.1073/pnas.0610561104. doi:0610561104[pii]10.1073/pnas.0610561104. [DOI] [PMC free article] [PubMed] [Google Scholar]
- 43.Tulving E. Episodic memory: from mind to brain. Annual review of psychology. 2002;53:1–25. doi: 10.1146/annurev.psych.53.100901.135114. [DOI] [PubMed] [Google Scholar]
Associated Data
This section collects any data citations, data availability statements, or supplementary materials included in this article.