

Abstract
A critical issue in many neuroimaging studies is the comparison between brain maps. Nonetheless, it remains unclear how one should test hypotheses focused on the overlap or spatial correspondence between two or more brain maps. This “correspondence problem” affects, for example, the interpretation of comparisons between task-based patterns of functional activation, resting-state networks or modules, and neuroanatomical landmarks. To date, this problem has been addressed with remarkable variability in terms of methodological approaches and statistical rigor. In this paper, we address the correspondence problem using a spatial permutation framework to generate null models of overlap, by applying random rotations to spherical representations of the cortical surface, an approach for which we also provide a theoretical statistical foundation. We use this method to derive clusters of cognitive functions that are correlated in terms of their functional neuroatomical substrates. In addition, using publicly available data, we formally demonstrate the correspondence between maps of task- based functional activity, resting-state fMRI networks and gyral-based anatomical landmarks. We provide open-access code to implement the methods presented for two commonly-used tools for surface based cortical analysis. This spatial permutation approach constitutes a useful advance over widely-used methods for the comparison of cortical maps, thereby opening new possibilities for the integration of diverse neuroimaging data.
INTRODUCTION
The spatial dependence in maps of brain activity, morphology, or connectivity impacts statistical inference and the interpretation of neuroimaging studies. It is well-understood that incorrect estimation of spatial smoothing and related statistical tests may result in inflated false negative or false positive rates in functional magnetic resonance imaging (fMRI) analyses (Eklund et al. 2016; Slotnick 2017; K. Mueller et al. 2017). However, a related issue that has received less attention arises in the comparison between brain maps. Specifically, it remains unclear how to evaluate the possibility that two or more brain maps are partially convergent or overlapping. Here, we call this “the correspondence problem”.
The extent of overlap or convergence between brain maps is a critical issue in many published and ongoing studies of cortical organization. For example, maps of intrinsic resting state fMRI connectivity may overlap with maps of white matter connectivity derived from diffusion imaging data (Honey et al. 2010; Honey et al. 2009; Hagmann et al. 2008; Skudlarski et al. 2008; Horn et al. 2014), or task-based fMRI activation across studies (Smith et al. 2009). Structural covariance, derived from correlations between regions in morphological properties, has largely been interpreted based on the extent of overlap with patterns of intrinsic fMRI connectivity (Kelly et al. 2012; Seeley et al. 2009), white matter connectivity (Gong et al. 2012) and longitudinal maturational coupling (Alexander-Bloch et al. 2013; Raznahan, Lerch, et al. 2011). Shared neurobiological substrates for cognitive functions are often inferred on the basis of overlap between patterns of fMRI activation between different tasks (Otto et al. 2014; Wesley & Bickel 2014; van Belle et al. 2014; Xu et al. 2013), as are shared (or distinct) cellular or developmental origins on the basis of overlap between morphological phenotypes such as cortical thickness and surface area (Maingault et al. 2016; Raznahan, Shaw, et al. 2011). Finally, differences between distinct demographic or clinical cohorts are often inferred in reference to divergent patterns of brain morphology (Douaud et al. 2014) or function (Goksan et al. 2015; Baliki et al. 2014; Zaki et al. 2016). Yet, despite numerous examples where investigators compare spatial patterns between experiments or conditions, there is currently no standardized statistical method for testing convergence.
The manner in which hypotheses about convergence are tested varies remarkably in terms of methodological approach and statistical rigor across studies. For example, it is not uncommon to simply visualize two maps side by side as evidence of convergence or divergence. Areas of overlap are sometimes highlighted (for example, the conjunction of two independently statistically significant maps). While suggestive, these approaches neglect the possibility, especially for spatially diffuse maps, that such overlap is due to chance and not statistically significant. Statistics such as the spatial correlation between maps are also used to quantify the extent of convergence between maps, and the reported statistical significance of these correlation is in some cases greatly inflated by failing to take into consideration the spatial non- independence of brain maps. In other cases a correction for the spatial degrees of freedom is derived via Gaussian random field theory (Smith et al. 2009; Casanova et al. 2007; Bäuml et al. 2015). Another approach is to use the partial correlation between brain maps after regressing out the shared relationship with anatomical distance (Honey et al. 2009; Horn et al. 2014).
A particular area greatly affected by the correspondence problem is the comparison of community structures (for example, clustering solutions, functional modules, anatomical parcellations or network partitions). The application of community detection algorithms to different datasets is often followed by an attempt to assess whether the resulting community structures are similar or distinct from each other. Examples from the literature include the following comparisons: resting-state and task-based fMRI networks (Kelly et al. 2012); ICA components across different cognitive tasks (Xu et al. 2013); and resting-state modules between clinical groups (Glerean et al. 2016; Achard et al. 2012). Group-wise permutation approaches can explicitly test hypotheses about differences between groups in community structure (Alexander-Bloch et al. 2012), but this approach cannot be extended to the straightforward comparison of the spatial properties of two such structures. Although statistics such as the adjusted Rand index (Hubert & Arabie 1985) and mutual information (Meilă 2007) can quantify the extent of overlap, there is no standard way to interpret the significance of these statistics that takes into consideration the spatial dependence of brain maps.
A standardized approach to the correspondence problem would help to address several open questions in neuroscience, which hinge on the degree of spatial alignment between different maps of cortical organization. For example, although superficially similar tasks tend to activate similar brain regions, it remains unclear if and how the brain’s diverse cognitive and affective capabilities are grouped with reference to statistically-significant spatial overlap in their activation maps. Being able to cluster cognitive tasks into sets that show an overlapping brain activation, above and beyond the intrinsic spatial dependence in fMRI data, would represent a major step forward in the definition of core functional modules within the brain. A closely related question involves the degree of spatial correspondence between spontaneous fluctuations in activity within the resting brain (Beckmann et al. 2005) and the coordinated changes in cortical activity that are induced by tasks (Toro et al. 2008). Again, a solution to the correspondence problem would help to resolve this question in a way that controls for the inherent spatial smoothness of shifting brain activity during both rest and tasks. Furthermore, with a rigorous means of quantifying how statistically surprising any given correspondence is, it would be possible to distinguish between brain networks that show differing degrees of alignment between rest and task-induced states. These issues are central to the detection and definition of a core set of dissociable brain networks for targeted investigation in clinical and basic neuroscience (Fornito & E. T. Bullmore 2015). Finally, standardized techniques to control for spatial smoothness in the comparison of brain maps would directly inform longstanding questions regarding the correspondence (or lack thereof) of functional and macroanatomical boundaries within the cortex. To date, this correspondence has been examined for a selected sub- set of cognitive tasks and macroanatomical gyral boundaries (Frost & Goebel 2012), but this question would benefit from examination throughout the entire cortical sheet across a wide range of cognitive domains simultaneously.
In this paper, we address the correspondence problem using a spatial permutation framework to generate null models of overlap, by applying random rotations to spherical representations of the cortical surface. Our work builds upon initial implementations of spatial permutation (Vandekar et al. 2015; Gordon et al. 2016), in several notable directions. First, we develop a theoretical statistical framework for studying questions relating to overlapping surface maps, which is used to demonstrate how the spatial permutation test controls Type I error. Second, we show the applicability of spatial permutation methods across multiple varieties of correspondence tests, including (i) the relationships amongst meta-analytic patterns of functional activation as defined by the Neurosynth platform (Yarkoni et al. 2011) and (ii) the relationship between canonical cortical parcellations defined with reference to resting state functional connectivity (Yeo et al. 2011) vs. gyral based anatomy (Desikan et al. 2006). The former of these analyses provides a means of determining if sub-groups of cognitive functions (Poldrack & Yarkoni 2016; Poldrack et al. 2011) are clustered in terms of their anatomical substrates above and beyond potential confounding effects of spatial dependence – thereby providing a powerful synthesis of structure- function relationships as charted across decades of functional neuroimaging literature. The latter of these analyses addresses a long-running debate regarding the inter-relationship between morphological and functional boundaries in the human cortex (Ronan & Fletcher 2014). Collectively, the Yeo and Desikan atlases have been used in over four thousand prior neuroimaging studies (PubMed, 2018), making it especially valuable to understand their relationship with each other and with spatial patterns of cortical activation across diverse cognitive tasks (Yarkoni et al. 2011). The method that we use to compare these atlases can be used to the significance of the overlap between any two community structures, which meets a growing need given the rapid proliferation of network-based approaches in neuroimaging science. The ability to ask if and how any two parcellations or modular depictions of the brain are aligned would more effectively exploit the current diversification of available imaging modalities and techniques for parcellation, clustering and community detection (Eickhoff et al. 2017).
We provide code to perform spatial comparison of cortical maps within two popular pipelines for surface-based cortical analysis (FreeSurfer and CIVET, https://github.com/spin-test), so these methods can be easily applied and extended in future work.
METHODS
Data
Meta-analytic patterns of functional activation were derived using Neurosynth (http://neurosynth.org) (February, 2015 release), which includes automated meta-analyses of imaging coordinates associated with >3,300 terms in >10,900 studies. We focused the analysis on cognitively relevant maps by filtering for terms that are included in the cognitive atlas (http://www.cognitiveatlas.org/concepts/) (Poldrack & Yarkoni 2016; Poldrack et al. 2011), which resulted in 120 terms. We used the reverse inference maps, comprised of z-scores corresponding to the likelihood that a term is used in a study given the presence of activation in a region (Yarkoni et al. 2011). Compared to the forward inference maps (corresponding to the likelihood that a region reported is active in studies that include a given term), the reverse inference maps are more selective in excluding regions that are diffusely involved in most cognitive tasks. These maps were each projected onto the FreeSurfer average surface by nearest neighbor interpolation (fsaverage5, which contains 10242 vertices per hemisphere), using a mid- gray surface, which lies 50% of the distance between the white and pial surfaces.
As benchmark representations of anatomical regions and functional networks, we used the Desikan Atlas (Desikan et al. 2006) and the Yeo Atlas (Yeo et al. 2011), respectively. The Desikan Atlas, distributed with FreeSurfer (v5.3.0), was derived by manually identifying 34 cortical regions of interest using gyral-based landmarks in 40 human brain MRI scans. The Yeo Atlas was derived from a mixture model of 1000 resting-state fMRI scans after scans were aligned using surface-based realignment. Each vertex was assigned to one of 7 resting-state networks.
Rotational permutation
Spatial permutation of brain maps was performed using angular permutations of spherical projections of the cortical surface. The coordinates corresponding to all of the vertices were rotated at angles uniformly chosen between zero and 360 degrees, about each of the x (left-right), y (anterior-posterior) and z (superior-inferior) axes. For each permutation, the same rotation was applied to every vertex, so the spatial features of the original map were preserved but in a rotated frame. Please see Figure 1 for a schematic of the permutation method, as applied to the Desikan Atlas. For opposite hemispheres, the same rotations were applied about the left-right axis of rotation, while opposite (negative) rotations were applied about the superior-inferior axis and the anterior-posterior axis, in order to preserve the contralateral symmetry of the rotated maps. When non-cortical regions (mid-cut or corpus collosum) were rotated into cortical space, these vertices were not included in the calculation of the test statistic (the “correspondence statistic”). For statistical comparisons that necessitated a one-to-one correspondence between the permuted vertices and the original vertices, each vertex in the original coordinate space was compared to the nearest vertex in rotated coordinate space, as determined by Euclidean distance. We used several different correspondence statistics depending on the specific experimental context, however, the significance of these statistics was always derived relative to the empirical distribution determined by the spatial permutation procedure. Please see animation for a schematic of the null distribution generated in a simplified 2-dimensional case.
Figure 1.
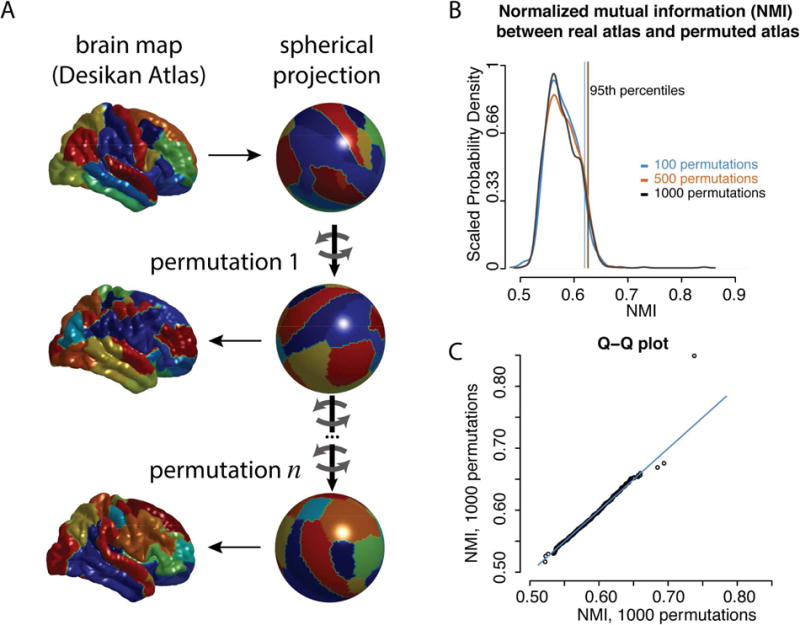
A schematic of the permutation procedure. A) As an illustration, the Desikan atlas is shown in the original space (top left) and spherical space (top right). Each color corresponds to different regions. The spherical coordinates are rotated (mid right, bottom right) and the projected back onto the anatomical surface (mid left, bottom left). B) The degree of similarity between the original parcellation and the rotated parcellations were estimated using the normalized mutual information (NMI). The probability density distributions of this statistic are shown for 100, 500, and 1000 rotations, as well as lines marking the 95th percentile of each distribution. C) A Q-Q plot of the two independent distributions of 1000 rotations each.
Theoretical basis of the spatial permutation test
Briefly, consider each brain surface map as spatial function, X(v), , where denotes the unit sphere. The correspondence statistic between two such maps is given by ψ(X ∘ R, Y), where X ∘ R = X(Rv) denotes a rotation applied to the surface, which determines the alignment between the surfaces. Conditional on the observed functions X(v), Y(v), we assume the null hypothesis
where Unif( ) denotes the uniform distribution on the set of rotation matrices. In words, the null hypothesis states that the observed anatomical or functional correspondence provides no information about the alignment of the surfaces. In order to perform a test of H0, first let ψ(X ∘ Robs, Y) be the nonrandom observed correspondence of the surfaces under anatomical alignment. The spatial permutation procedure computes the p-value
| (1) |
and rejects H0 if p< α for some predetermined rejection threshold α. The integral (1) is taken across all possible alignments in 3-dimensional space. We use Monte Carlo integration to empirically estimate this quantity. Equation (1) is equal to the probability of observing a statistic as or more extreme than the observed statistic under the null hypothesis H0.
The theoretical support for the spatial permutation test depends on how the test is interpreted. In general, the validity of a permutation test stems from the exchangeability of the permuted observations under the null hypothesis. For example, in a simple test of a difference in the means between two groups, the group labels are permuted and the group difference is recalculated to generate a null distribution. In this case, the observations must be exchangeable under the null hypothesis; in other words, they are assumed to come from the same underlying probability distribution. This assumption is likely violated in the case of spatial statistics of brain imaging data such as the correlation of two brain maps, because of the spatial structure of the data. In contrast, if the null hypothesis of the spatial permutation test is true, a random alignment (derived by applying random rotations of the spherical surface) plausibly explains the extent of association between the maps, which implies that the observed correspondence is not significantly different from chance. It is important to note that we condition on the values of the surfaces, so that the brain maps are not are interpreted as random variables; thus, we do not require that the points on the surface to be exchangeable. Rather, it is the rotational alignment itself that is treated as a random variable in the generation of the null distribution of the correspondence statistic with the spatial permutation procedure.
For a more formal treatment of the theory underlying the spatial permutation test, please see Section 1 of the Supplemental Materials.
Cognitive clusters of meta-analytic patterns of activation (Neurosynth data)
Pearson’s r was used as the correspondence statistic to quantify the degree of relatedness between the patterns of activation for the 120 cognitive terms, represented by a 120×120 correlation matrix. For example, each element of the first row of the correlation matrix indicated the correlation between the activation map for the first cognitive term with the activation map of on the other cognitive terms. The structure of this correlation matrix was investigated in two ways. First, the overall structure was visualized using complete linkage hierarchical clustering, with the distance between the maps calculated as 1 – r (Figure 2a). This approach does not allow for inferences as to which if any of the correlations are statistically significant, although one would expect that any significant correlations would be closely clustered by the hierarchical clustering procedure.
Figure 2.
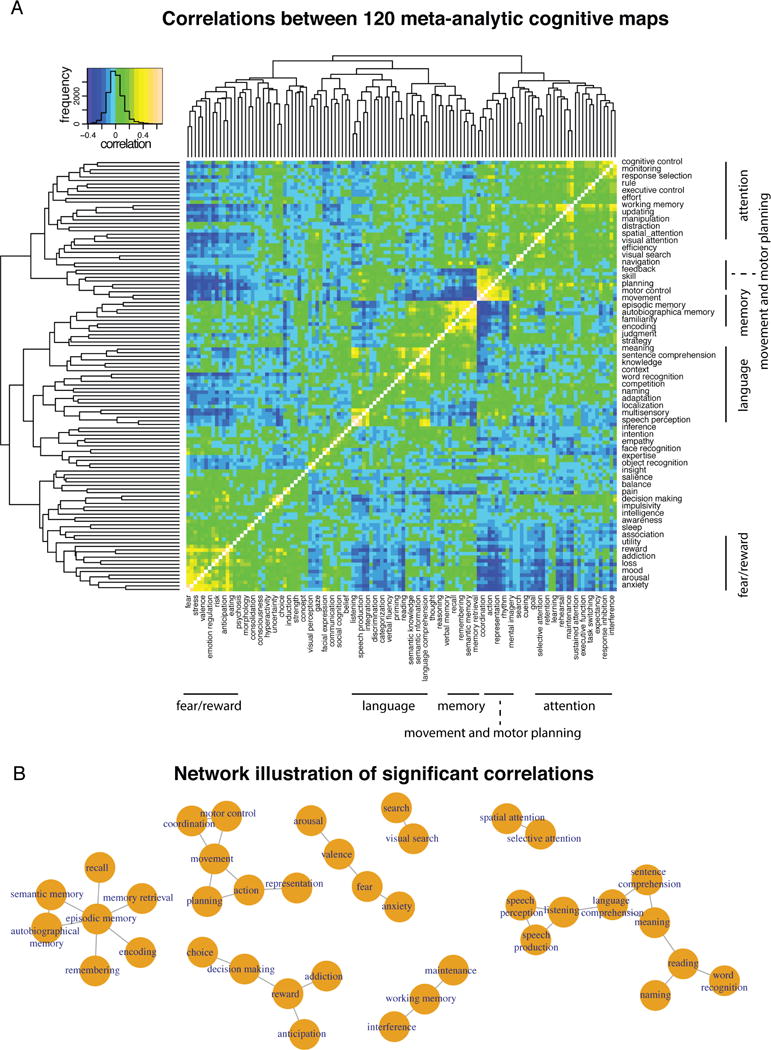
Correlation structure and significant correlations between Neurosynth meta-analytic activation patterns associated with 120 cognitive terms. A) Heat-map shows 120×120 correlation matrix. Terms are organized according to hierarchical clustering, with the resulting dendrogram shown to the top and to the left of the correlation matrix. Colors correspond to correlation coefficient, as shown in color key on top left. The color key also shows the frequency distribution of the correlations that comprise the matrix. Labels of the terms are shown to the right and to the bottom of the matrix, with the odd number labels shown on the bottom and the even number labels shown on the right (the order of the terms is “fear”, “anxiety”, “stress”, “arousal”, “valence,” etc.). B) Network illustration where the significant connections are illustrated as edges between the terms, which are illustrated as nodes. The resulting network is comprised of 8 disconnected components; edges exist within each component’s nodes, but there are no edges between components.
To test the statistical significance of the correlations, we used the spatial permutation approach described above to generate 1000 rotational permutations of the data. For each permutation, we generated a 120×120 permuted correlation matrix (the correlations between the permuted data and the original data). The permuted correspondence statistic was the single highest magnitude element of this permuted correlation matrix (not including the diagonal elements which indicate the correlations between a map and itself). This approach of using the maximum of the permuted correlation matrix as the correspondence statistic provides family-wise control for multiple comparisons (Westfall & Young 1993). The correspondence statistics from 1000 permutations were used to generate a null-distribution to test the significance of the original correlations, and P-values were calculated for each of the original correlations based on the frequency with which the magnitude of the permuted correspondence statistics equaled or exceeded that of the original correlation. Because the null distribution was generated so as to provide family-wise control for multiple comparisons, a nominal value of P < 0.05 was used as a cut off for statistical significance. To visualize significant correlations, we used network representation where nodes are cognitive terms and edges are the significant correlations between their pattern of activation (Figure 2b).
Overlap between anatomical, gyral-based parcels (Desikan Atlas) and resting-state functional parcels (Yeo Atlas)
For the overlap between the Desikan and Yeo atlases, the correspondence statistic was the normalized mutual information, NMI (Kvalseth 1987):
where A and B are the partitions, i.e., assignments of vertices to parcels (where parcel refers to the resting state networks that comprise the Yeo Atlas and the anatomical regions that comprise the Desikan Atlas, respectively); CA is the number of parcels in partition A; CB is the number of parcels in partition B; N is the number of vertices, which is the same in both partitions; Nij is the overlap between A’s parcel i and B’s parcel j, i.e. the number of vertices that they have in common; Ni. is the total number of vertices in A’s parcel i; N.j is the total number of vertices in B’s parcel j; and this calculation follows the convention that 0×log(0)=0. The NMI ranges from 0 to 1, where 0 signifies that the partitions are totally independent and 1 that they are identical. See the discussion for an explanation of some of the terminology involved in the analysis of partitions, parcellations and functional clusters.
To test the statistical significance of the degree of the NMI between the Desikan atlas and the Yeo atlas, we generated 1000 rotational permutations of the data as described above. For each permutation, the NMI was re-estimated. The P-value was calculated as the frequency that which the permuted NMI estimates equaled or exceeded the actual NMI.
Additionally, we performed a post hoc analysis to determine which regions appeared to contribute disproportionately to the observed overlap. We generated a 34×7 confusion matrix, quantifying the overlap (in terms of total number vertices) between each region and each resting- state network. For each region and each network (41 total tests), the correspondence statistic was the pseudo-X2 testing whether each region was equally distributed between networks (weighted based on the total size of each network) and whether network was equally distributed between regions (weighted based on the size of each region). This statistic is called a pseudo- X2 to emphasize that it is not expected to be X2 distributed; rather, the null distribution is empirically determined by the permutation procedure. This analysis used FDR-correction for multiple comparisons correction (q<0.05) (see Table 1).
Table 1.
The “confusion matrix” between the Desikan Atlas and the Yeo Atlas, which shows the number of vertices that are shared between each of the 34 anatomical regions of the Desikan Atlas (rows) and each of the 7 resting state networks of the Yeo Atlas (columns), in order to clarify which regions and networks contribute differentially to the globally significant correspondence between the Atlases (see Results).
| Visual Network (Yellow) | Somatomotor Network (Red) | Dorsal-attention Network (Dark Blue) | Ventral-attention Network (Maroon) | Limbic Network (Orange) | Frontoparietal Network (Light Blue) | Default-mode Network (Green) | Vertices in each Region (Sum over Networks) | P-value (permutation test) | |
|---|---|---|---|---|---|---|---|---|---|
| Bank superior temporal sulcus | 0 | 72 | 0 | 64 | 0 | 0 | 118 | 254 | 0.917 |
|
|
|||||||||
| Caudal anterior cingulate | 0 | 0 | 0 | 93 | 0 | 29 | 24 | 146 | 0.510 |
|
|
|||||||||
| Caudal middle frontal gyrus | 0 | 0 | 81 | 0 | 0 | 246 | 128 | 455 | 0.404 |
|
|
|||||||||
| Cuneus | 206 | 0 | 0 | 0 | 0 | 0 | 0 | 206 | 0.078 |
|
|
|||||||||
| Entorhinal cortex | 0 | 0 | 0 | 0 | 90 | 0 | 0 | 90 | 0.019 |
|
|
|||||||||
| Fusiform gyrus | 360 | 0 | 60 | 0 | 185 | 0 | 0 | 605 | 0.163 |
|
|
|||||||||
| Inferior parietal gyrus | 138 | 0 | 178 | 17 | 0 | 273 | 489 | 1095 | 0.774 |
|
|
|||||||||
| Inferior temporal gyrus | 1 | 0 | 175 | 0 | 231 | 83 | 46 | 536 | 0.187 |
|
|
|||||||||
| Isthmus cingulate | 50 | 0 | 0 | 0 | 0 | 10 | 177 | 237 | 0.547 |
|
|
|||||||||
| Lateral occipital cortex | 745 | 0 | 18 | 0 | 0 | 0 | 0 | 763 | 0.005 |
|
|
|||||||||
| Lateral orbitofrontal gyrus | 0 | 0 | 0 | 21 | 276 | 112 | 112 | 521 | 0.185 |
|
|
|||||||||
| Lingual gyrus | 506 | 0 | 0 | 0 | 0 | 0 | 0 | 506 | 0.077 |
|
|
|||||||||
| Medial orbitofrontal gyrus | 0 | 0 | 0 | 0 | 185 | 0 | 123 | 308 | 0.196 |
|
|
|||||||||
| Middle temporal gyrus | 0 | 0 | 74 | 38 | 22 | 56 | 422 | 612 | 0.438 |
|
|
|||||||||
| Parahippocampal gyrus | 98 | 0 | 2 | 0 | 55 | 0 | 49 | 204 | 0.639 |
|
|
|||||||||
| Paracentral gyrus | 0 | 347 | 0 | 95 | 0 | 0 | 0 | 442 | 0.398 |
|
|
|||||||||
| Pars opercularis | 0 | 0 | 27 | 161 | 0 | 107 | 36 | 331 | 0.520 |
|
|
|||||||||
| Pars orbitalis | 0 | 0 | 0 | 0 | 0 | 28 | 83 | 111 | 0.616 |
|
|
|||||||||
| Pars triangularis | 0 | 0 | 0 | 94 | 0 | 60 | 111 | 265 | 0.828 |
|
|
|||||||||
| Pericalcarine cortex | 224 | 0 | 0 | 0 | 0 | 0 | 0 | 224 | 0.067 |
|
|
|||||||||
| Postcentral gyrus | 0 | 1114 | 35 | 6 | 0 | 0 | 0 | 1155 | 0.003 |
|
|
|||||||||
| Posterior cingulate | 0 | 46 | 0 | 138 | 0 | 85 | 70 | 339 | 0.859 |
|
|
|||||||||
| Precentral gyrus | 0 | 853 | 251 | 222 | 0 | 10 | 0 | 1336 | 0.172 |
|
|
|||||||||
| Precuneus | 147 | 40 | 118 | 96 | 0 | 141 | 416 | 958 | 0.965 |
|
|
|||||||||
| Rostral anterior cingulate | 0 | 0 | 0 | 0 | 9 | 0 | 123 | 132 | 0.396 |
|
|
|||||||||
| Rostral middle frontal gyrus | 0 | 0 | 0 | 99 | 39 | 647 | 192 | 977 | 0.119 |
|
|
|||||||||
| Superior frontal gyrus | 0 | 148 | 90 | 306 | 3 | 211 | 747 | 1505 | 0.716 |
|
|
|||||||||
| Superior parietal gyrus | 265 | 169 | 833 | 0 | 0 | 25 | 0 | 1292 | 0.061 |
|
|
|||||||||
| Superior temporal gyrus | 0 | 0 | 90 | 99 | 0 | 223 | 871 | 0.698 | |
|
|
|||||||||
| Supramarginal gyrus | 0 | 169 | 254 | 386 | 0 | 177 | 66 | 1052 | 0.714 |
|
|
|||||||||
| Frontal pole | 0 | 0 | 0 | 0 | 35 | 0 | 8 | 43 | 0.086 |
|
|
|||||||||
| Temporal pole | 0 | 0 | 0 | 0 | 86 | 0 | 0 | 86 | 0.019 |
|
|
|||||||||
| Transverse temporal gyrus | 0 | 116 | 0 | 0 | 0 | 0 | 0 | 116 | 0.226 |
|
|
|||||||||
| Insula | 0 | 216 | 0 | 373 | 1 | 31 | 14 | 635 | 0.266 |
|
|
|||||||||
| Vertices in each Network (Sum over Regions) | 2740 | 3749 | 2196 | 2299 | 1316 | 2331 | 3777 | 18408 | – |
|
|
|||||||||
| P-value (permutation test) | 0.018* | 0.004* | 0.078 | 0.056 | 0.258 | 0.009* | 0.046 | – | – |
The column labels (e.g. “visual network [yellow]”) are per the original description of the Yeo Atlas, with the colors corresponding to the colors in Figure 3b. For the networks in the Yeo Atlas, the correspondence statistic is the pseudo-X2 statistic for a test of whether each network is randomly distributed between the regions of the Desikan atlas (the last row of the table shows the P-value from the permutation test of the significance of this statistic). For the regions of the Desikan atlas, the correspondence statistic is the pseudo-X2 statistic for a test of whether each region is randomly distributed between networks of the Yeo atlas (the last column of the table shows the P-value from the permutation test of the significance of this statistic). These statistics are called pseudo-statics because they are not expected to be follow X2 distribution; rather, the P-values are determined based on the empirical distribution generated by the permutation procedure.
significant after FDR correction for multiple comparisons
Overlap of meta-analytic patterns of activation (Neurosynth data) with anatomical, gyral-based parcels (Desikan Atlas) and resting-state functional parcels (Yeo Atlas)
For the test of overlap between the Yeo atlas and the 120 Neurosynth maps, the correspondence statistic was the pseudo-X2 transformation of the Wilk’s lambda from a Multivariate Analysis of Variance (MANOVA) (Krzanowski 1990), treating the Neurosynth maps as the multivariate outcome and the Yeo Atlas labels as the independent variable. Significance of the observed correspondence statistic was determined with reference to the null distribution generated by 1,000 rotational permutations of the data as described above.
As a post hoc analysis to investigate which of the 120 Neurosynth maps contributed disproportioinately the global correspondence, we performed 120 separate tests where the correspondence statistics were the pseudo-F-statistics from Analysis of Variance (ANOVA) tests. Again, this statistic is called a pseudo-F to emphasize that it is not expected to have an F- distribution. The null distribution is determined by permutation. FDR correction was used to account for 120 comparisons.
The overlap between the Desikan atlas and the 120 Neurosynth maps was tested analogously, using MANOVA and post hoc ANOVA tests to generate correspondence statistics for spatial permutation tests.
RESULTS
The permutation method allowed for rigorous hypothesis testing of the proposed relationships between patterns of functional activation, resting state fMRI networks and anatomical regions of interest. The 95% percentile of the probability density distribution, used as the threshold for statistical significance at the P<0.05 level, appeared to stabilize by 1,000 permutations (Figure 1b-c), suggesting 1,000 as an appropriate number of permutations for subsequent statistical tests. Please see Section 2 of the Supplemental Materials and Supplemental Table S1 for a demonstration of Type 1 error control using simulated null data.
Spatial Correspondences Between Metaanalytic Patterns of Activation (Neurosynth) Define Cognitive Clusters
The correlation coefficients between the 120 cognitive maps suggested a broad range in terms of the degree of relatedness between the maps (mean r = 0.004, sd = 0.12, range = −0.41 – 0.68). Hierarchical clustering of the maps revealed a non-trivial structure, for example with terms related to the language and reward systems, respectively, grouping together into relatively homogenous clusters of mutual correlation (Figure 2a). Of these correlations, 35 were statistically significant based on the family-wise correction for multiple comparisons (see Figure 2b). The correlation coefficient corresponding to this significance threshold was Pearson’s r= 0.42. A network representation of these significant correlations (where nodes are cognitive terms and edges are significant correlations) revealed distinct components (edges within but not between sub-groups of nodes) corresponding to cognitive clusters including movement and motor planning, language, attention, memory, fear and reward (Figure 2b).
In contrast, calculating statistical significance with a standard parametric approach, allowing all of the vertices to independently contribute to the degrees of freedom of the test, would vastly overestimate the number of significance correlations, with 5,331 of the 7,140 total correlation surviving Bonferroni correction at a nominal p-value threshold of 0.05 (see Supplemental Materials Section 3 and Supplemental Figure S1).
Gyral-Based Anatomical Regions of Interest (Desikan Atlas) Overlap with Resting-State Functional Networks (Yeo Atlas)
The hypothesized overlap between anatomical regions of interest and functional networks was supported by the permutation procedure. The actual NMI between the Desikan atlas (Figure 3a) and the Yeo atlas (Figure 3b), 0.389, is unlikely to be simply due to chance overlap (P=0.034) (Figure 3c). Put differently, patches of brain that form part of the same gyral-based region of interest were significantly more likely to also form part of the same intrinsic functional network. This overlap is not due simply to spatial dependence, nor to contralateral symmetry, as these potential confounds are controlled for by the permutation procedure. (The mean of the null distribution generated by the permutation procedure can be interpreted as an estimate of the contribution of these potential confounds to the observed NMI.)
Figure 3.
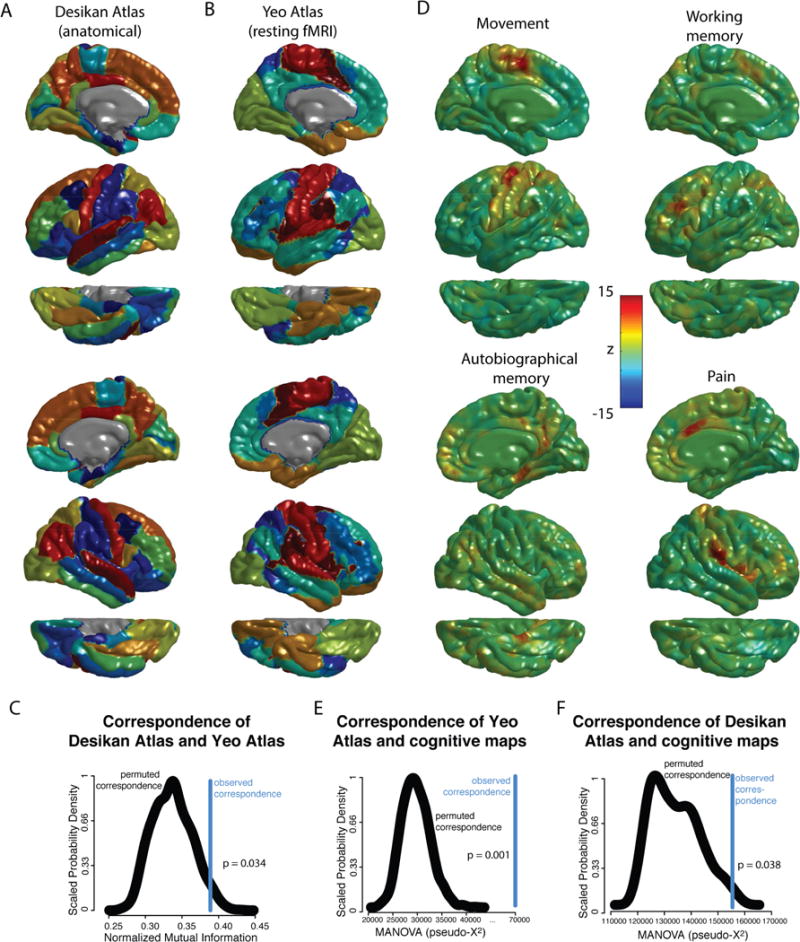
Spatial relationship between regions based on gyral landmarks (Desikan Atlas), intrinsic functional connectivity networks (Yeo Atlas), and task-based fMRI brain maps (Neurosynth meta-analyses). A) Representation of the Desikan Atlas, derived from manually identifying 34 in each hemisphere based on gyral landmarks, using 40 high resolution structural MRI scans. B) Representation of the Yeo atlas, derived by identifying 7 resting-state functional networks using a mixture model of 1000 resting-state fMRI scans. C) The normalized mutation information between the Yeo and Desikan Atlas, a measure of the similarity of the two atlases, for the original data as well as the probability density distribution of 1000 rotational permutations. The P-value is calculated as the frequency with which the permuted NMI equals or exceeds the actual NMI. D) Representation of 4 of the 120 brain maps derived from automated meta-analyses of cognitive concepts included in the cognitive atlas, with color scale corresponding to z-statistic (see methods). The top four cognitive terms are shown, ranked via F- statistic of 120 post hoc ANOVA tests of the relationship between these maps and the Yeo Atlas. As the maps are largely symmetric, for illustrative purposes, the left hemisphere is shown for movement and working memory, while the right hemisphere is shown for autobiographic memory and pain. E) The Chi-square transformation of the MANOVA test statistic where the networks of the Yeo atlas were the dependent variable and the 120 cognitive maps were the independent variables, for the original data as well as the probability density distribution of 1000 rotational permutations. The P-value was calculated as the frequency with which the permuted Chi-square statistic equaled or exceeded the actual test statistic. F) The Chi-square transformation of the MANOVA test statistic where the networks of the Desikan atlas were the dependent variable and the 120 cognitive maps were the independent variables, for the original data as well as the probability density distribution of 1000 rotational permutations. The P-value was calculated as the frequency with which the permuted Chi-square statistic equaled or exceeded the actual test statistic.
Post hoc analysis suggested that this statistically significant correspondence resulted disproportionately from certain resting state networks and anatomical regions. Specifically, the visual, somatomotor and frontoparietal networks showed statistically significant correspondence with the gyral boundaries of anatomical regions after FDR correction for multiple comparisons (Table 1). Conversely, although no individual region’s statistical significance survived FDR correction for multiple comparisons, the anatomical regions that corresponded most closely with the boundaries of intrinsic resting-state networks were largely visual and motor areas, as evidenced by marginally significant P-values in Table 1.
Metaanalytic Patterns of Activation (Neurosynth) Overlap with Resting-State Functional Networks (Yeo Atlas)
Meta-analytic patterns of functional activation did not only cluster in space to define overarching cognitive domains, but also demonstrated statistically-significant overlap with functional networks defined by patterns of coordinated intrinsic cortical activity at rest (spatial permutation test using the pseudo-X2 transformation of the Wilk’s lambda from a MANOVA test as the correspondence statistic, P=0.001) (Figure 3e). Put differently, the patterns of activation shown by the meta-analyses of cognitive concepts tended to respect the boundaries of the resting-state functional networks. In the 120 post hoc permutation tests (using pseudo-F-statistics as the correspondence statistics), only “movement” was statistically significant after FDR-correction for multiple comparisons (q<0.05). There was suggestive but non-significant correspondence (uncorrected p<0.05, q>0.05) with resting-state networks for the metaanalytic maps of working memory, pain, autobiographical memory and spatial attention (see illustrations in Figure 3d). Movement appeared to differentially activate the somato-motor network; working memory differentially activated the frontoparietal and dorsal attention networks; autobiographical memory differentially activated the default-mode network; and pain differentially activated the ventral attention network (see Table 1 for the labels of the individual resting-state networks).
Metaanalytic Patterns of Activation (Neurosynth) Overlap with Gyral-Based Anatomical Regions of Interest (Desikan Atlas)
Finally, as would be predicted based on their mutual overlap with intrinsic resting-state networks, meta-analytic patterns of activation also demonstrated statistically significant overlap with a classical parcellation of the cortical sheet defined by macroanatomical gyral boundaries (spatial permutation test using the pseudo-X2 transformation of the Wilk’s lambda from a MANOVA test as the correspondence statistic, P=0.038) (Figure 3f). In other words, the patterns of activation shown by the metaanalyses of cognitive concepts tended to respect gyral boundaries. For the 120 post hoc permutation tests using pseudo-F-statistics as the correspondence statistics, only “listening” was statistically significant after FDR-correction for multiple comparisons (q<0.05). There was suggestive but non-significant correspondence (uncorrected p<0.05, q>0.05) with gyral boundaries for the metaanalytic maps of movement, pain, speech perception and reward. Listening appeared to differentially activate superior temporal gyrus, tranverse temporal gyrus and the bank of the superior temporal sulcus; pain disproportionately activated insula, post central and caudal anterior cingulate cortex; movement differentially activated precentral, postcentral, supramarginal and superior parietal cortex; speech perception differentially activated superior temporal gyrus, bank of the superior temporal sulcus and transverse temporal gyrus; reward differentially activated the rostral anterior cingulate, lateral orbitofrontal and medial orbitofrontal gyrus.
DISCUSSION
Our work addresses a number of methodological issues that arise in the statistical comparison of brain maps, and in doing so provides evidence in support of specific biological hypotheses regarding functional topography and function-structure relationships in the human cerebral cortex. We advocate a spatial permutation approach to the issue of comparing cortical maps. This approach demonstrates partial overlap or convergence between meta-analytic maps of functional activations, gyral-based anatomical regions of interest, and resting-state functional connectivity networks. In making the code for these analyses available and discussing the methodological issues, we hope to draw attention to this issue and increase the statistical rigor with which “the correspondence problem” is approached.
The benefits of spatial permutation as a statistical approach
The utility of the rotational permutation approach is illustrated by the inter-relationships between the anatomical substrates of 120 cognitive functions. Although the 120×120 correlation matrix appears to have meaningful structure (Figure 2a), P-values generated from a parametric test of the significance of these correlation coefficients would have extremely high false positive rates, because of falsely assuming spatial and contralateral independence (see Supplemental Figure S1). (Non-parametric tests and permutation procedures that do not preserve spatial and contralateral dependence would have similarly high false positive rates.) In addition, a correction for multiple comparisons across the 7,140 correlations is required, but as these correlations are not independent, standard approaches for multiple comparisons correction may be too conservative depending on the context. The permutation procedure addresses both of these concerns, by generating permuted data with the same spatial and contralateral structure of the original data, as well as a null distribution of maximum correlation coefficients that allows for a straightforward family-wise correction for multiple comparisons. In general, there is an analogy between spatial permutation and other well-described (although perhaps under-utilized) permutation approaches (E. T. Bullmore et al. 1999; Nichols & Holmes 2002; Winkler et al. 2014); the spatial coordinates of the maps are permuted, rather than the task/rest labels of a functional scan, or the patient/control labels in a case-control study.
The approach provides a framework to address both spatial dependence and contralateral symmetry, which are multi-faceted and often problematic issues in neuroimaging studies. On the one hand, there is ample evidence that spatial constraints are a biological principle of brain network organization (E. Bullmore & Sporns 2012). On the other hand, spatial dependence is also introduced by image processing pipelines, for example, when images are smoothed in order to make statistical comparisons between anatomically divergent individuals. In addition, motion artifact may introduce artefactual smoothing into both functional (Satterthwaite et al. 2012) and anatomical (Alexander-Bloch et al. 2016) scans. Regardless of the underlying source of spatial dependence, or whether it is biological or artefactual in a given experimental context, it has the potential to confound statistical inference about partial overlap or convergence between brain maps. Contralateral symmetry is more generally appreciated as “biological” compared to spatial autocorrelation within hemispheres. However, confounds such as motion are likely to similarly impact contralateral homologues (which are the same distance from the axes of rotation). Therefore, similarly to spatial dependence, symmetry can falsely inflate the apparent overlap when comparing brain maps that include both left and right hemisphere data. Spatial permutation addresses both of these potential confounds in a single unified framework.
Another important benefit of the spatial permutation procedure is its relevance to analyses of functional or anatomical communities. There is no single accepted methodology to compare such communities, e.g. brain parcellations or partitions, maps of anatomical regions of interest and or intrinsic functional connectivity networks. The terminology can be confusing: it is common to call a map of anatomical regions an atlas or a parcellation (Van Essen et al. 2012), while maps of intrinsic connectivity (or other kinds of connectivity) are described as partitions, communities, clusters or modules (Alexander-Bloch et al. 2010). However, the practical distinction between these two kinds of maps is that parcellations of anatomical regions, by definition, form spatially contiguous patches. Partitions, while often spatially contiguous, may be spatially distributed; in functional parcellations such as the Yeo atlas, sensorimotor clusters tend to form distinct patches, while spatially discontiguous clusters are distributed across association cortical areas. For the purposes of statistical comparison, similar statistics can quantify the degree of overlap, such as the adjusted Rand index (Hubert & Arabie 1985), a variation of information criterion (Meilă 2007), and normalized mutual information (Kvalseth 1987). Because properties such as the degree of spatial dependence and contralateral symmetry affect community structures, it is problematic to interpret these statistics without taking these factors into consideration. Spatial permutation provides a straightforward way for the significance of these statistics to be evaluated.
Biological relevance of tests of anatomical correspondence
By leveraging these strengths of spatial-permutation testing for the comparison of three distinct types of cortical map, our study provides a number of insights into cortical organization. First, we provide quantitative evidence that task-induced patterns of brain activation (Neurosynth meta-analytic maps) are non-randomly related to patterns of coordinated brain activity at rest (Yeo 7-network resting state parcellation). The ability to test the apparent similarity between the two modes of coordinated brain activity provides a necessary empirical and technical foundation for asking how this similarity arises, and whether inter-individual differences in the strength of this spatial coupling are relevant for behavioral differences in health and disease (Braga & Buckner 2017).
Second, we provide new evidence about the spatial inter-dependence between functional and macroanatomical topography of the cortical sheet. The non-random organization of brain function with respect to gyral features is evident with respect to both coordinated brain activity at rest (Yeo Atlas) and task-evoked brain activity (Neurosynth data), and varies in strength across different functional systems. Specifically, we find that the degree of alignment between function and structure tends to be stronger for primary input/output systems (visual, auditory, motor) than for higher-order associative systems, which is consistent with recent work in this area using different methodological approaches (Sotiras et al. 2017). The corresponding gyral features that show closest alignment for the spatial organization of brain activity during rest and tasks are aligned with those “primary sulci” that arise earliest in prenatal human brain development (Nishikuni & Ribas 2013), show least variance in morphology across individuals (Mangin et al. 2004) and most consistent correspondence with the boundaries of cytoarchitectonically-defined cortical areas (Fischl et al. 2008). These observations suggest the operation of a strong conjoint constraint on the anatomical and functionally patterning of lower-order cortical regions, such that these display an alignment of gyral and functional boundaries that can be detected at the group level. The spatial permutations approach represents a promising quantitative framework for moving beyond group-level analyses in future work to probe structure-function relationships in individual cortical sheets.
Finally, the clusters of anatomically-corresponding cognitive functions identified by the permutation procedure (Figure 2b) support prior biological hypotheses about the functional organization of the cerebral cortex, illustrated by the three largest clusters of statistically significant correlations between the Neurosynth maps. Supplemental Figure S2 shows positive activation in primary motor and somato-sensory cortex, as well as premotor/supplementary motor areas, which are coordinated in subserving simple and complex motion and motor planning (Mayka et al. 2006; Geyer et al. 2000). A cluster evidently related to memory, shown in Supplemental Figure S3, shows, in addition to parahippocampal regions in the medial temporal lobe, positive activations in the medial and ventrolateral prefrontal cortex, posterior cingulate, lateral temporal and temporoparietal junction that have been implicated in autobiographical memory (Svoboda et al. 2006), internal monitoring and the “default-mode network” (Buckner et al. 2008). The language cluster (Supplemental Figure S4) shows left-lateralized activation in canonical inferior frontal and superior temporal gyri as well as other cortical areas that have previously been implicated in, for example, reading and object naming (Price 2012; Poeppel et al. 2012). We note that this discussion is in no way meant to imply that these cortical regions are not also involved in other functions (Poldrack 2011). Clusters of similar functional maps correspond to a priori similar cognitive functions, which plausibly explains the correspondence of the meta-analytic maps (Rubin et al. 2017) if the same terms appear in similar papers in the published literature. However, the recovery of such canonical systems points to the potential validity of patterns of anatomical correspondence in other experimental contexts. A goal for future work is to investigate the correspondence between other human brain maps, for example, based on cytoarchitectonic boundaries, multimodal imaging techniques (Glasser et al. 2016) or pleiotropy between regions (Chen et al. 2013; Alexander-Bloch et al. 2017).
Methodological limitations
Several methodological issues with the present analysis should be noted. First, the present method is limited to cortical surface maps. It may be possible to extend the method to specific sub-cortical or volumetric maps, most readily for structures such as the thalamus that could reasonably be modelled as a spherical volume, but there is no simple way to extend the approach to maps that include both cortical and subcortical data. This limits the current utility of the test to contexts in which it is reasonable to project volumetric data onto the cortical surface, and it is worth noting that the accuracy of the maps may be affected by the process of projection. Other methods of comparison, including the visual comparison of brain maps by informed anatomists, remain superior depending on the experimental context.
The illustrative analyses presented here depend on multiple upstream methodological choices. For example, the choice of terms to include in the automated meta-analysis clearly constrains downstream results, as does the choice of atlases with greater or fewer numbers of regions (which would also directly affect the control for multiple comparisons in the regional analysis). Although the functional networks (Yeo Atlas) and anatomical regions (Desikan Atlas) that we discuss are comprised of non-overlapping regions, the spatial permutation approach could be adapted for use in the case of networks with a mixture of overlapping and non-overlapping regions and/or both positive and negative loadings, such as ICA components. Each component could be treated separately based on its loading at every vertex. This alternative would be similar to the analysis of Neurosynth maps in the present study, which include both positive and negative activations.
The spatial permutation test is theoretically applicable to the question of overlap between brain networks, for example, where the correspondence statistic is the proportion of shared edges between two networks. In this case, however, the correspondence statistic would be expected to scale with the graph density, i.e., more dense graphs will tend to overlap more extensively. We would expect the null distribution, estimated via the spatial permutation test, to take this trend into consideration and for the test to remain valid across graph densities. In the limit case where one of the graphs is fully connected, for example, it is evident that the null hypothesis would not be rejected by the spatial permutation test. However, additional work may be required to demonstrate the validity of the test depending on the particular networks of interest.
Future directions
Although our analysis does not specifically incorporate prior knowledge about functional neuroanatomy, this would be a reasonable approach for future work. Such information could be incorporated quantitatively into a priori probabilities using a Bayesian approach, or else incorporated into the control for multiple comparisons. In this sense, the regional analysis shown in Table 1, which attempts to ascertain which specific regions or networks “drive” the correspondence between resting state networks (the Yeo Atlas) and anatomical regions (the Desikan Atlas), is arguably over-conservative. A less stringent multiple comparisons correction might for example indicate that the default mode network – for which the permutation test indicated an uncorrected P-value of 0.046, but was not labelled as “significant” after FDR correction for multiple comparisons – contributed significantly via its overlap with multiple parietal, temporal, frontal and cingulate regions. Alternatively, the lack of statistical significance for the overlap between specific functional networks (e.g. the resting-state network, the dorsal attention network and the ventral attention network) may indicate that these networks “cut across” canonical anatomical boundaries. Many of the regions that do not appear to show a significance correspondence are thought to show greater morphometric and functional variability across individuals (Mueller et al. 2013), suggesting potentially weaker developmental constraints on their patterning which could manifest as weaker topographical correspondence between structural and functional features.
The theoretical basis of the spatial permutation test is not the same as that of standard permutation procedures, where the permuted observations are assumed to be exchangeable under the null hypothesis. Rather, the null hypothesis is that a random alignment of the surfaces suffices to account for the observed correspondence. The procedure conditions on the surface maps, meaning that the interpretation is restricted to the alignment of the two surfaces. The current test does not allow for inference about dataset-to-dataset variability, i.e., “what would happen” if the maps were regenerated based on a repetition of the necessary experiments. A goal for future work is investigate the validity of the procedure for stochastic processes, in which case inference about dataset-to-dataset variability would be possible (see Methods and Supplemental Materials). Semantically, it may be appropriate to say that the procedure is not a permutation test in the classical sense, but it is a related if distinct non-parametric test. Informally, the procedure we describe implements a “spin test” for the association between two cortical maps. Another interesting possibility for future work would be implement certain constraints on the spins considered in order to test more anatomically specific hypotheses – for example, ensuring that gyri and sulci remain overlapping, respectively.
An alternative or complementary approach to the spin test could involve estimating a null distribution by resampling in a manner that is biased as a function of the distance between vertices on the surface (Radersma & Sheldon 2015). Such an approach would have the relative advantage of potentially explaining dataset-to-dataset variability, unlike the current approach. One relative disadvantage is that certain spatial features of the original maps would be disrupted in such an approach, for example spatially contiguous parcels could “fragment” during the resampling procedure. In addition, how conservative this approach is depends on the function that is chosen to “bias” the resampling. As a consequence, such an approach might require additional, potentially unrealistic, assumptions about the unobserved covariance structure of the surfaces.
In summary, the spatial permutation methods described, applied and disseminated by our study constitute a useful advance upon current methods for the comparison of cortical maps, and thereby open up new possibilities for the surface based integration of diverse neuroimaging data.
Supplementary Material
Acknowledgments
AAB is supported by T32MH019961-20 (PI: RM) and the Detre Award from the Yale Department of Psychiatry. RTS is partially supported by R01NS085211, R01MH112847, and R01NS060910. TDS is supported by R01MH107703 and R01MH112847. SNV is supported by T32MH065218. The content is solely the responsibility of the authors and does not necessarily represent the official views of the funding agencies.
Footnotes
Publisher's Disclaimer: This is a PDF file of an unedited manuscript that has been accepted for publication. As a service to our customers we are providing this early version of the manuscript. The manuscript will undergo copyediting, typesetting, and review of the resulting proof before it is published in its final citable form. Please note that during the production process errors may be discovered which could affect the content, and all legal disclaimers that apply to the journal pertain.
References
- Achard S, et al. Hubs of brain functional networks are radically reorganized in comatose patients. Proceedings of the National Academy of Sciences of the United States of America. 2012;109(50):20608–20613. doi: 10.1073/pnas.1208933109. [DOI] [PMC free article] [PubMed] [Google Scholar]
- Alexander-Bloch A, et al. Subtle in-scanner motion biases automated measurement of brain anatomy from in vivo MRI. Human Brain Mapping. 2016;37(7):2385–2397. doi: 10.1002/hbm.23180. [DOI] [PMC free article] [PubMed] [Google Scholar]
- Alexander-Bloch A, et al. The convergence of maturational change and structural covariance in human cortical networks. The Journal of Neuroscience. 2013;33(7):2889–2899. doi: 10.1523/JNEUROSCI.3554-12.2013. [DOI] [PMC free article] [PubMed] [Google Scholar]
- Alexander-Bloch A, et al. The discovery of population differences in network community structure: new methods and applications to brain functional networks in schizophrenia. NeuroImage. 2012;59(4):3889–3900. doi: 10.1016/j.neuroimage.2011.11.035. [DOI] [PMC free article] [PubMed] [Google Scholar]
- Alexander-Bloch AF, et al. Disrupted modularity and local connectivity of brain functional networks in childhood-onset schizophrenia. Frontiers in Systems Neuroscience. 2010;4:147. doi: 10.3389/fnsys.2010.00147. [DOI] [PMC free article] [PubMed] [Google Scholar]
- Alexander-Bloch AF, et al. Human Cortical Thickness Organized into Genetically- determined Communities across Spatial Resolutions. Cerebral Cortex. 2017;22(Pt 2):1–13. doi: 10.1093/cercor/bhx309. [DOI] [PMC free article] [PubMed] [Google Scholar]
- Baliki MN, et al. Functional reorganization of the default mode network across chronic pain conditions. In: Zang Y-F, editor. PloS ONE. 9. Vol. 9. 2014. p. e106133. [DOI] [PMC free article] [PubMed] [Google Scholar]
- Bäuml JG, et al. Correspondence Between Aberrant Intrinsic Network Connectivity and Gray-Matter Volume in the Ventral Brain of Preterm Born Adults. Cerebral Cortex. 2015;25(11):4135–4145. doi: 10.1093/cercor/bhu133. [DOI] [PubMed] [Google Scholar]
- Beckmann CF, et al. Investigations into resting-state connectivity using independent component analysis. Philosophical Transactions of the Royal Society of London. Series B, Biological Sciences. 2005;360(1457):1001–1013. doi: 10.1098/rstb.2005.1634. [DOI] [PMC free article] [PubMed] [Google Scholar]
- Braga RM, Buckner RL. Parallel Interdigitated Distributed Networks within the Individual Estimated by Intrinsic Functional Connectivity. Neuron. 2017;95(2):457–471.e5. doi: 10.1016/j.neuron.2017.06.038. [DOI] [PMC free article] [PubMed] [Google Scholar]
- Buckner RL, Hanna JRA, Schacter DL. The Brain’s Default Network. 1. Vol. 1124. Annals of the New York Academy of Sciences; 2008. pp. 1–38. [DOI] [PubMed] [Google Scholar]
- Bullmore E, Sporns O. The economy of brain network organization. Nature Reviews Neuroscience. 2012;13(5):336–349. doi: 10.1038/nrn3214. [DOI] [PubMed] [Google Scholar]
- Bullmore ET, et al. Global, voxel, and cluster tests, by theory and permutation, for a difference between two groups of structural MR images of the brain. IEEE Transactions on Medical Imaging. 1999;18(1):32–42. doi: 10.1109/42.750253. [DOI] [PubMed] [Google Scholar]
- Casanova R, et al. Biological parametric mapping: A statistical toolbox for multimodality brain image analysis. NeuroImage. 2007;34(1):137–143. doi: 10.1016/j.neuroimage.2006.09.011. [DOI] [PMC free article] [PubMed] [Google Scholar]
- Chen CH, et al. Genetic topography of brain morphology. Proceedings of the National Academy of Sciences of the United States of America. 2013;110(42):17089–17094. doi: 10.1073/pnas.1308091110. [DOI] [PMC free article] [PubMed] [Google Scholar]
- Desikan RS, et al. An automated labeling system for subdividing the human cerebral cortex on MRI scans into gyral based regions of interest. NeuroImage. 2006;31(3):968–980. doi: 10.1016/j.neuroimage.2006.01.021. [DOI] [PubMed] [Google Scholar]
- Douaud G, et al. A common brain network links development, aging, and vulnerability to disease. Proceedings of the National Academy of Sciences of the United States of America. 2014;111(49):17648–17653. doi: 10.1073/pnas.1410378111. [DOI] [PMC free article] [PubMed] [Google Scholar]
- Eickhoff SB, Constable RT, Yeo BTT. Topographic organization of the cerebral cortex and brain cartography. NeuroImage. 2017 doi: 10.1016/j.neuroimage.2017.02.018. [DOI] [PMC free article] [PubMed] [Google Scholar]
- Eklund A, Nichols TE, Knutsson H. Cluster failure: Why fMRI inferences for spatial extent have inflated false-positive rates. Proceedings of the National Academy of Sciences of the United States of America. 2016;113(28):7900–7905. doi: 10.1073/pnas.1602413113. [DOI] [PMC free article] [PubMed] [Google Scholar]
- Fischl B, et al. Cortical folding patterns and predicting cytoarchitecture. Cerebral Cortex. 2008;18(8):1973–1980. doi: 10.1093/cercor/bhm225. [DOI] [PMC free article] [PubMed] [Google Scholar]
- Fornito A, Bullmore ET. Connectomics: a new paradigm for understanding brain disease. European Neuropsychopharmacology. 2015;25(5):733–748. doi: 10.1016/j.euroneuro.2014.02.011. [DOI] [PubMed] [Google Scholar]
- Frost MA, Goebel R. Measuring structural-functional correspondence: spatial variability of specialised brain regions after macro-anatomical alignment. NeuroImage. 2012;59(2):1369–1381. doi: 10.1016/j.neuroimage.2011.08.035. [DOI] [PubMed] [Google Scholar]
- Geyer S, et al. Functional neuroanatomy of the primate isocortical motor system. Anatomy and Embryology. 2000;202(6):443–474. doi: 10.1007/s004290000127. [DOI] [PubMed] [Google Scholar]
- Glasser MF, et al. A multi-modal parcellation of human cerebral cortex. Nature Neuroscience. 2016;536(7615):171–178. doi: 10.1038/nature18933. [DOI] [PMC free article] [PubMed] [Google Scholar]
- Glerean E, et al. Reorganization of functionally connected brain subnetworks in high- functioning autism. Human Brain Mapping. 2016;37(3):1066–1079. doi: 10.1002/hbm.23084. [DOI] [PMC free article] [PubMed] [Google Scholar]
- Goksan S, et al. fMRI reveals neural activity overlap between adult and infant pain. eLife. 2015;4:1321. doi: 10.7554/eLife.06356. [DOI] [PMC free article] [PubMed] [Google Scholar]
- Gong G, et al. Convergence and divergence of thickness correlations with diffusion connections across the human cerebral cortex. NeuroImage. 2012;59(2):1239–1248. doi: 10.1016/j.neuroimage.2011.08.017. [DOI] [PubMed] [Google Scholar]
- Gordon EM, et al. Generation and Evaluation of a Cortical Area Parcellation from Resting-State Correlations. Cerebral Cortex. 2016;26(1):288–303. doi: 10.1093/cercor/bhu239. [DOI] [PMC free article] [PubMed] [Google Scholar]
- Hagmann P, et al. Mapping the structural core of human cerebral cortex. PLoS Biology. 2008;6(7):e159. doi: 10.1371/journal.pbio.0060159. [DOI] [PMC free article] [PubMed] [Google Scholar]
- Honey CJ, et al. Predicting human resting-state functional connectivity from structural connectivity. Proceedings of the National Academy of Sciences of the United States of America. 2009;106(6):2035–2040. doi: 10.1073/pnas.0811168106. [DOI] [PMC free article] [PubMed] [Google Scholar]
- Honey CJ, Thivierge JP, Sporns O. Can structure predict function in the human brain? NeuroImage. 2010;52(3):766–776. doi: 10.1016/j.neuroimage.2010.01.071. [DOI] [PubMed] [Google Scholar]
- Horn A, et al. The structural-functional connectome and the default mode network of the human brain. NeuroImage. 2014;102(Pt 1):142–151. doi: 10.1016/j.neuroimage.2013.09.069. [DOI] [PubMed] [Google Scholar]
- Hubert L, Arabie P. Comparing partitions. Journal of Classification. 1985;2(1):193–218. [Google Scholar]
- Kelly C, et al. A convergent functional architecture of the insula emerges across imaging modalities. NeuroImage. 2012;61(4):1129–1142. doi: 10.1016/j.neuroimage.2012.03.021. [DOI] [PMC free article] [PubMed] [Google Scholar]
- Krzanowski WJ. Principles of Multivariate Analysis. Oxford University Press; 1990. [Google Scholar]
- Kvalseth TO. Entropy and Correlation: Some Comments. IEEE Transactions on Systems, Man, and Cybernetics. 1987;17(3):517–519. [Google Scholar]
- Maingault S, et al. Regional correlations between cortical thickness and surface area asymmetries: A surface-based morphometry study of 250 adults. Neuropsychologia. 2016;93(Pt B):350–364. doi: 10.1016/j.neuropsychologia.2016.03.025. [DOI] [PubMed] [Google Scholar]
- Mangin JF, et al. A framework to study the cortical folding patterns. NeuroImage. 2004;23(Suppl 1):S129–38. doi: 10.1016/j.neuroimage.2004.07.019. [DOI] [PubMed] [Google Scholar]
- Mayka MA, et al. Three-dimensional locations and boundaries of motor and premotor cortices as defined by functional brain imaging: A meta-analysis. NeuroImage. 2006;31(4):1453–1474. doi: 10.1016/j.neuroimage.2006.02.004. [DOI] [PMC free article] [PubMed] [Google Scholar]
- Meilă M. Comparing clusterings—an information based distance. Journal of Multivariate Analysis. 2007;98:873–895. [Google Scholar]
- Mueller K, et al. Commentary: Cluster failure: Why fMRI inferences for spatial extent have inflated false-positive rates. Frontiers in human neuroscience. 2017;11:345. doi: 10.3389/fnhum.2017.00345. [DOI] [PMC free article] [PubMed] [Google Scholar]
- Mueller S, et al. Individual Variability in Functional Connectivity Architecture of the Human Brain. Neuron. 2013;77(3):586–595. doi: 10.1016/j.neuron.2012.12.028. [DOI] [PMC free article] [PubMed] [Google Scholar]
- Nichols TE, Holmes AP. Nonparametric permutation tests for functional neuroimaging: a primer with examples. Human Brain Mapping. 2002;15(1):1–25. doi: 10.1002/hbm.1058. [DOI] [PMC free article] [PubMed] [Google Scholar]
- Nishikuni K, Ribas GC. Study of fetal and postnatal morphological development of the brain sulci. Journal of neurosurgery Pediatrics. 2013;11(1):1–11. doi: 10.3171/2012.9.PEDS12122. [DOI] [PubMed] [Google Scholar]
- Otto B, et al. Functional overlap of top-down emotion regulation and generation: an fMRI study identifying common neural substrates between cognitive reappraisal and cognitively generated emotions. Cognitive, affective & behavioral neuroscience. 2014;14(3):923–938. doi: 10.3758/s13415-013-0240-0. [DOI] [PubMed] [Google Scholar]
- Poeppel D, et al. Towards a New Neurobiology of Language. The Journal of Neuroscience. 2012;32(41):14125–14131. doi: 10.1523/JNEUROSCI.3244-12.2012. [DOI] [PMC free article] [PubMed] [Google Scholar]
- Poldrack RA. Inferring mental states from neuroimaging data: from reverse inference to large-scale decoding. Neuron. 2011;72(5):692–697. doi: 10.1016/j.neuron.2011.11.001. [DOI] [PMC free article] [PubMed] [Google Scholar]
- Poldrack RA, Yarkoni T. From Brain Maps to Cognitive Ontologies: Informatics and the Search for Mental Structure. Annual review of psychology. 2016;67(1):587–612. doi: 10.1146/annurev-psych-122414-033729. [DOI] [PMC free article] [PubMed] [Google Scholar]
- Poldrack RA, et al. The cognitive atlas: toward a knowledge foundation for cognitive neuroscience. Frontiers in Neuroinformatics. 2011;5:17. doi: 10.3389/fninf.2011.00017. [DOI] [PMC free article] [PubMed] [Google Scholar]
- Price CJ. A review and synthesis of the first 20 years of PET and fMRI studies of heard speech, spoken language and reading. NeuroImage. 2012;62(2):816–847. doi: 10.1016/j.neuroimage.2012.04.062. [DOI] [PMC free article] [PubMed] [Google Scholar]
- Radersma R, Sheldon Ben C. A new permutation technique to explore and control for spatial autocorrelation. In: Dray S, editor. Methods in Ecology and Evolution. 9. Vol. 6. 2015. pp. 1026–1033. [Google Scholar]
- Raznahan A, Lerch JP, et al. Patterns of coordinated anatomical change in human cortical development: a longitudinal neuroimaging study of maturational coupling. Neuron. 2011;72(5):873–884. doi: 10.1016/j.neuron.2011.09.028. [DOI] [PMC free article] [PubMed] [Google Scholar]
- Raznahan A, Shaw P, et al. How does your cortex grow? The Journal of Neuroscience. 2011;31(19):7174–7177. doi: 10.1523/JNEUROSCI.0054-11.2011. [DOI] [PMC free article] [PubMed] [Google Scholar]
- Ronan L, Fletcher PC. From genes to folds: a review of cortical gyrification theory. Brain Structure & Function. 2014 doi: 10.1007/s00429-014-0961-z. [DOI] [PMC free article] [PubMed] [Google Scholar]
- Rubin TN, et al. Decoding brain activity using a large-scale probabilistic functional- anatomical atlas of human cognition. In: Gershman SJ, editor. PLoS Computational Biology. 10. Vol. 13. 2017. p. e1005649. [DOI] [PMC free article] [PubMed] [Google Scholar]
- Satterthwaite TD, et al. impact of in-scanner head motion on multiple measures of functional connectivity: relevance for studies of neurodevelopment in youth. NeuroImage. 2012;60(1):623–632. doi: 10.1016/j.neuroimage.2011.12.063. [DOI] [PMC free article] [PubMed] [Google Scholar]
- Seeley WW, et al. Neurodegenerative diseases target large-scale human brain networks. Neuron. 2009;62(1):42–52. doi: 10.1016/j.neuron.2009.03.024. [DOI] [PMC free article] [PubMed] [Google Scholar]
- Skudlarski P, et al. Measuring brain connectivity: diffusion tensor imaging validates resting state temporal correlations. NeuroImage. 2008;43(3):554–561. doi: 10.1016/j.neuroimage.2008.07.063. [DOI] [PMC free article] [PubMed] [Google Scholar]
- Slotnick SD. Cluster success: fMRI inferences for spatial extent have acceptable false- positive rates. Cognitive Neuroscience. 2017;8(3):150–155. doi: 10.1080/17588928.2017.1319350. [DOI] [PubMed] [Google Scholar]
- Smith SM, et al. Correspondence of the brain’s functional architecture during activation and rest. Proceedings of the National Academy of Sciences of the United States of America. 2009;106(31):13040–13045. doi: 10.1073/pnas.0905267106. [DOI] [PMC free article] [PubMed] [Google Scholar]
- Sotiras A, et al. Patterns of coordinated cortical remodeling during adolescence and their associations with functional specialization and evolutionary expansion. Proceedings of the National Academy of Sciences of the United States of America. 2017;114(13):3527–3532. doi: 10.1073/pnas.1620928114. [DOI] [PMC free article] [PubMed] [Google Scholar]
- Svoboda E, McKinnon MC, Levine B. The functional neuroanatomy of autobiographical memory: a meta-analysis. Neuropsychologia. 2006;44(12):2189–2208. doi: 10.1016/j.neuropsychologia.2006.05.023. [DOI] [PMC free article] [PubMed] [Google Scholar]
- Toro R, Fox PT, Paus T. Functional coactivation map of the human brain. Cerebral Cortex. 2008;18(11):2553–2559. doi: 10.1093/cercor/bhn014. [DOI] [PMC free article] [PubMed] [Google Scholar]
- van Belle J, et al. Common and unique neural networks for proactive and reactive response inhibition revealed by independent component analysis of functional MRI data. NeuroImage. 2014;103:65–74. doi: 10.1016/j.neuroimage.2014.09.014. [DOI] [PubMed] [Google Scholar]
- Van Essen DC, et al. Parcellations and hemispheric asymmetries of human cerebral cortex analyzed on surface-based atlases. Cerebral Cortex. 2012;22(10):2241–2262. doi: 10.1093/cercor/bhr291. [DOI] [PMC free article] [PubMed] [Google Scholar]
- Vandekar SN, et al. Topologically dissociable patterns of development of the human cerebral cortex. The Journal of Neuroscience. 2015;35(2):599–609. doi: 10.1523/JNEUROSCI.3628-14.2015. [DOI] [PMC free article] [PubMed] [Google Scholar]
- Wesley MJ, Bickel WK. Remember the future II: meta-analyses and functional overlap of working memory and delay discounting. Biological Psychiatry. 2014;75(6):435–448. doi: 10.1016/j.biopsych.2013.08.008. [DOI] [PMC free article] [PubMed] [Google Scholar]
- Westfall PH, Young SS. Resampling-Based Multiple Testing. John Wiley & Sons; 1993. [Google Scholar]
- Winkler AM, et al. Permutation inference for the general linear model. NeuroImage. 2014;92:381–397. doi: 10.1016/j.neuroimage.2014.01.060. [DOI] [PMC free article] [PubMed] [Google Scholar]
- Xu J, et al. Task-related concurrent but opposite modulations of overlapping functional networks as revealed by spatial ICA. NeuroImage. 2013;79:62–71. doi: 10.1016/j.neuroimage.2013.04.038. [DOI] [PMC free article] [PubMed] [Google Scholar]
- Yarkoni T, et al. Large-scale automated synthesis of human functional neuroimaging data. Nature Methods. 2011;8(8):665–670. doi: 10.1038/nmeth.1635. [DOI] [PMC free article] [PubMed] [Google Scholar]
- Yeo BTT, et al. The organization of the human cerebral cortex estimated by intrinsic functional connectivity. Journal of Neurophysiology. 2011;106(3):1125–1165. doi: 10.1152/jn.00338.2011. [DOI] [PMC free article] [PubMed] [Google Scholar]
- Zaki J, et al. The Anatomy of Suffering: Understanding the Relationship between Nociceptive and Empathic Pain. Trends in Cognitive Sciences. 2016;20(4):249–259. doi: 10.1016/j.tics.2016.02.003. [DOI] [PMC free article] [PubMed] [Google Scholar]
Associated Data
This section collects any data citations, data availability statements, or supplementary materials included in this article.