. 2018 Jul 30;7:e35755. doi: 10.7554/eLife.35755

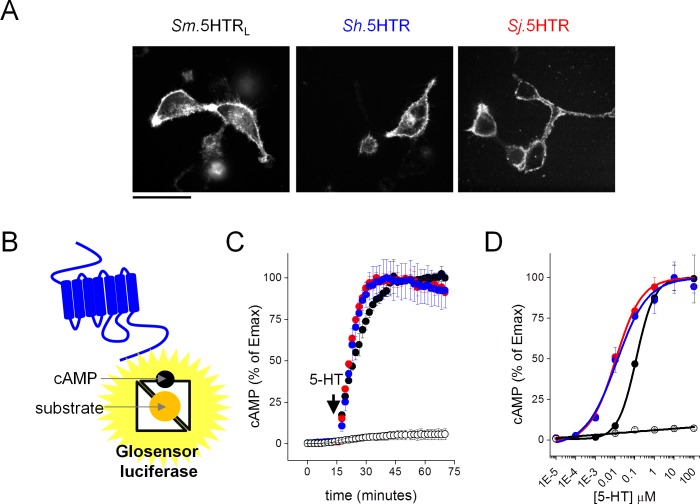
Figure 1. Functional expression of Schistosoma serotonin receptors.

(A) Confocal images showing cell surface expression in mammalian HEK293 cells of 5-HT receptors cloned from S. mansoni (Sm.5HTRL), S. haematobium (Sh.5HTR) and S. japonicum (Sj.5HTR) localized by COOH-terminally tagged eGFP. Scalebar, 50 µm. (B) Schematic of luminescent cAMP sensor bioassay. cAMP generated by schistosome 5-HTRs (blue) binds the engineered GloSensor luciferase, switching the sensor to a more active conformation resulting in enhanced luminescence output. (C) Kinetics of signal following the addition of 5-HT (1 µM) to HEK293 cells co-transfected with luminescent cAMP sensor and individual schistosome 5-HT receptors. Open circles, cells not transfected with 5-HT receptor, colored circles represent measurements in cells transfected with Sm.5HTRL (black), (Sh.5HTR (blue) and Sj.5HTR (red). (D) Serotonin dose-response curves for each of the three receptors (colored circles) and HEK293 cells expressing the cAMP sensor alone (open circles). Data reflect mean ± standard error of at least 3 biological replicates.

Figure 1.

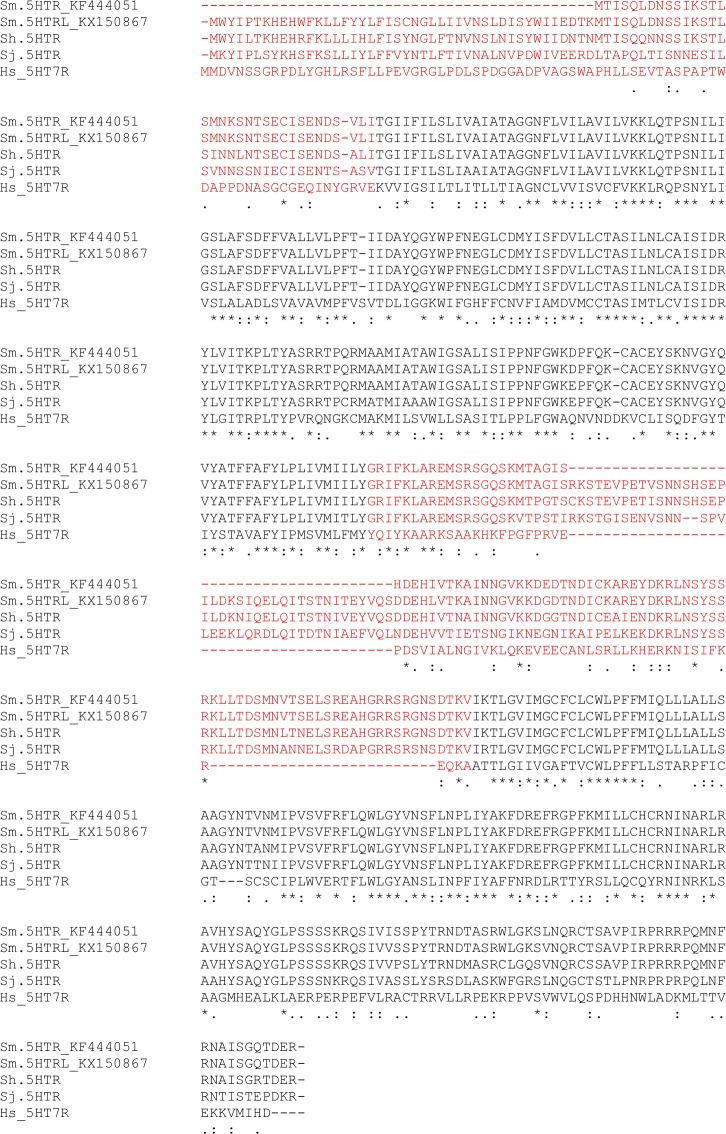
Figure 1—figure supplement 1. Schistosome 5-HT receptor protein alignment.

Figure 1—figure supplement 1.

Predicted sequences from S. japonicum and S. haematobium (545 and 547 amino acids long) closely match the ‘long’ isoform of the previously cloned S. mansoni receptor (Sm.5HTRL, 547 amino acids; NCBI accession # KX150867, [Chan et al., 2017]). No sequences matching the previously reported ‘short’ isoform (Sm.5HTRL, 463 amino acids; NCBI accession # KF444051 [Patocka et al., 2014]) were identified in S. mansoni, S. japonicum or S. haematobium. Regions delimiting the N-terminus and third intracellular loop shown in red. Alignment with human HTR7 (UniProt entry P34969) is shown.
Figure 1—figure supplement 2. Cladogram of schistosome 5-HT receptors.
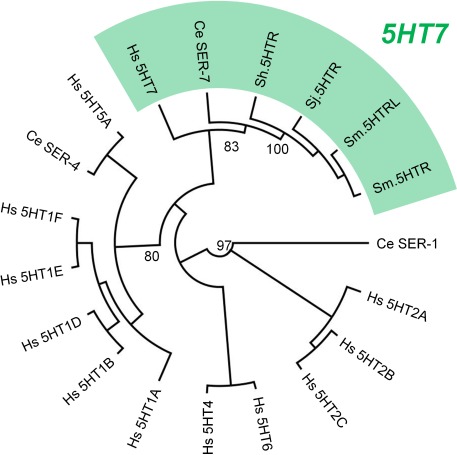
Figure 1—figure supplement 2.

Schistosome 5.HTR sequences cluster with known 5-HT7 receptors (human 5HTR7, C. elegans SER-7). Sequences were aligned with MUSCLE and maximum likelihood phylogeny computed with PhyML(v3.1), 500 bootstrap replicates.
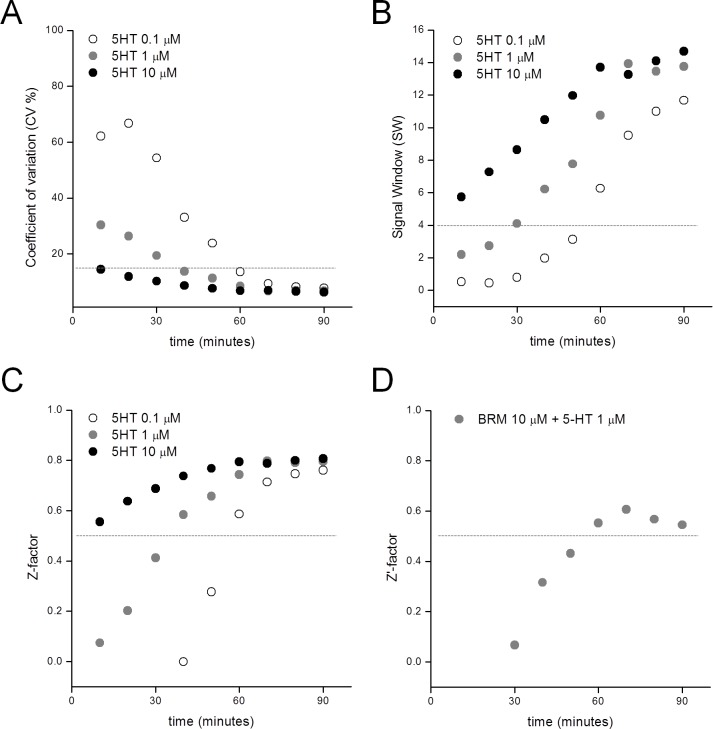
Figure 1—figure supplement 3. Performance of the Sm.5HTRL luminescent cAMP reporter assay.

Figure 1—figure supplement 3.

(A) Coefficient of variation (CV%) for signal in response to increasing concentrations of 5-HT (white = 0.1 µM, gray = 1 µM, black = 10 µM) relative to basal levels (no 5-HT addition). Dotted line represents threshold for acceptable limit of 15%. CV%=(σ5-HT5-HT) x100. (B) Signal window (SW) for serotonin response relative to basal levels. Dotted line = acceptable limit of 4-fold. SW = (µ5-HT - µbasal - 3(σ5-HT + σbasal)) / σ5-HT. (C) Z’ factor for signal evoked by increasing concentrations of serotonin. Dotted line represents acceptable threshold of 0.5. Z’ factor = 1 - ((3σ5-HT + 3σbasal) / |µ5-HT - µbasal|). (D) Z factor for control antagonist (bromocriptine, BRM) inhibition of 5-HT response. Z factor = 1 - ((3σ5-HT + 3σ5-HT+BRM) / |µ5-HT - µ5-HT+BRM|). (A–D) All parameters were calculated from 48 wells per concentration of compound in a 384 well plate.