Abstract
Purpose
Changes in retinal pH may contribute to a variety of eye diseases. To study the effect of acidosis alone, we induced systemic metabolic acidosis and hypothesized that the retina would respond with altered expression of genes involved in acid/base regulation.
Methods
Systemic metabolic acidosis was induced in Long-Evans rats for up to two weeks by adding NH4Cl to the drinking water. After two weeks, venous pH was 7.25±0.08 (SD) and [HCO3−] was 21.4±4.6 mM in acidotic animals; pH was 7.41±0.03 and [HCO3−] was 30.5±1.0 mM in controls. Retinal mRNAs were quantified by qRT-PCR. Protein was quantified with Western blots and localized by confocal microscopy. Retinal [H+]o was measured in vivo with pH microelectrodes in animals subject to metabolic acidosis and in controls.
Results
NH4Cl in drinking water or given IV was effective in acidifying the retina. Cariporide, a blocker of Na+/H+ exchange, further acidified the retina. Metabolic acidosis for two weeks led to increases of 40 to 100% in mRNA for carbonic anhydrase isoforms II (CA-II) and XIV (CA-XIV) and acid sensing ion channels 1 and 4 (ASIC1 and ASIC4) (all p<0.005). Expression of anion exchanger 3 (AEP-3) and Na+/H+ exchanger (NHE)-1 also increased by ≥ 50% (both p<0.0001). Changes were similar after one week of acidosis. Protein for AEP-3 doubled. NHE-1 co-localized with vascular markers, particularly in the outer plexiform layer. CA-II was located in the neural parenchyma of the ganglion cell layer and diffusely in the rest of the inner retina.
Conclusions
The retina responds to systemic acidosis with increased expression of proton and bicarbonate exchangers, carbonic anhydrase and acid-sensing ion channels. While responses to acidosis are usually associated with renal regulation, these studies suggest that the retina responds to changes in local pH presumably to control its acid/base environment in response to systemic acidosis
Keywords: retina, rat, pH, acidosis, acid/base regulation, ASIC, carbonic anhydrase, hydrogen ion transport, anion transport
Introduction
The outer half of the retina in mammals is more acidic than many parts of the nervous system, particularly in darkness (1–4), with an extracellular pH of about 7.2 in the outer nuclear layer, where [H+]o is highest. This acidity results from the high rate of anaerobic glycolysis in the photoreceptors (5) and a lack of local circulation in that region to clear the acid. The direction of H+ gradients indicates that H+ produced by the photoreceptors diffuses both toward the choroid and toward the retinal circulation. Although proton and lactate transporters in the RPE are required for transport into the choroid (6), less is known about the transport mechanisms that move H+ into the retinal circulation. Some of the H+ is undoubtedly also buffered by combination with bicarbonate, because the retina acidifies when carbonic anhydrase is blocked in cat (7, 8) or rat (A.V. Dmitriev et al., in preparation).
Acidosis increases in the outer retina during hypoxia (9, 10), when anaerobic glycolysis increases to compensate for decreased oxidative metabolism. Acidosis also occurs when the inner retina is ischemic (11), so it is likely to be present in a range of vascular occlusive diseases. Acute hyperglycemia also acidified the cat retina (9), which suggested that the retina might also be more acidic in chronic hyperglycemia, and that acidosis could potentially play a role in the pathogenesis of diabetes.
Studies of diabetic animals have revealed complex changes in acidosis. In diabetic cats there was an inversion of intraretinal pH gradients, with lower [H+]o in the outer retina than the inner retina of three animals with more than seven years of diabetes, and no regions that were more acidic than in control retinas (12). After this duration it is possible that photoreceptors are damaged (13) and cannot produce as much acid. Previous studies have identified increased acidosis in the diabetic rat retina between 1 and 3 months of diabetes with high variability of proton concentration (4). After 3 months there was continued high variability, but a return to normal average acidity (4). Among a number of potential reasons for this normalization over time, one possibility is that retinal acidosis may trigger compensatory mechanisms to allow better handling of acid, either through enhanced transport into the circulation or neutralization. This hypothesis is difficult to test in the context of diabetes, where many changes take place simultaneously and the disease progression is relatively slow. However, chronic acidosis can be produced without diabetes, which allows a test of the hypothesis that the retina itself can increase acid/base regulating mechanisms when challenged with acidosis in diabetes or other situations. We hypothesized further that such mechanisms would include changes in retinal carbonic anhydrase isoforms, and in acid-sensing and acid-regulating ion transporters.
Specifically, we have investigated mRNA for acid regulating genes in the retinas of Long-Evans rats treated with NH4Cl to produce systemic metabolic acidosis. First we confirmed that this systemic acidosis produced retinal acidosis as well. Previous studies had shown that several genes of interest are expressed in the retina. The genes investigated were carbonic anhydrase II (CA-II), believed to be intracellular (14) in Muller cells (15) and photoreceptors (16), carbonic anhydrase XIV (CA-XIV), believed to be extracellular (17), anion-exchange protein 3 (AEP-3) (18), and the sodium-hydrogen exchanger 1 (NHE-1) (19, 20). The two isoforms of CA are the only ones that have been reported in the retina. We also investigated acid-sensing ion channels (ASICs) 1 and 4. While not directly involved in acid regulation, ASICs are widely distributed in the retina (21, 22), and may play a role in retinal responses to pH changes (21–25).
Methods
Animals
Procedures were approved by the Northwestern University Animal Care and Use Committee, and adhered to the ARVO Statement for the Use of Animals in Ophthalmic and Vision Research. The experiments were done on male Long Evans rats that were between 50 and 57 days old with initial weights ranging between 250–300g.
Metabolic Acidosis
To induce systemic metabolic acidosis, rats were given 500mM NH4Cl and 2% sucrose in their drinking water for 3, 7, or 14 days (26, 27). Control rats had drinking water with no chemical modifications. The weight of rats and drinking water bottles were measured periodically. Blood samples were taken from the acidotic rats’ tails every other day in heparinized capillary tubes, and pH, PO2, and PCO2 were analyzed with a Siemens Rapidlab 248 blood gas analyzer.
Dissection of retinas
Rats were deeply anesthetized with isoflurane and decapitated. Some retinas were dissected using curved forceps placed behind the eye and used to push the retina through an incision across the cornea as previously described (28). However, to ensure separation of the retina from the RPE, other retinas were dissected by removing the cornea, followed by extracting the lens, clearing the vitreous, and separating the retina from the RPE. Isolated retinas were frozen immediately in individual 1.8mL Nunc® CryoTube® Vials (Thermo Scientific; Denmark) in liquid N2 and stored at −80°C until used for RNA isolation.
RNA isolation and qRT-PCR
Total RNA was isolated using column-purification (QiaShredder & RNeasy Plus Mini Kit, Qiagen, Hilden Germany) according to the manufacturer’s instructions. Reverse transcription was performed on 800 ng of total RNA using random hexamers, Oligo dT, Rnase Inhibitors, and Omniscript, (Qiagen Omniscript RT kit, Qiagen, Hilden Germany). Real time polymerase chain reactions (RT-PCR) were done with a TaqMan® probe-based detection kit (TaqMan® PCR universal mastermix, Applied Biosystems, Darmstadt, Germany). The following FAM-primers were used: Carbonic Anhydrase II, Car2, #Rn01462065_m1; Carbonic Anhydrase XIV, Car14, #Rn01534442_m1; Acid Sensing Ion Channel 1, ASIC1,#Rn00577292_m1; Acid Sensing Ion Channel 4, ASIC4, #Rn01637758_m1; Anion Exchange Protein-3, Slc4a3, #Rn00436642_m1; Sodium/Hydrogen Exchanger-1, Slc9a1, #Rn00561924_m1 and Glyceraldehyde 3-phosphate dehydrogenase GAPDH, Gapdh, #Rn01775763_g1, all from Applied Biosystems, (Darmstadt, Germany). Rat actin (ACTB) VIC primer (ThermoFisher Scientific, Waltham, MA, U.S.A.) was used as an endogenous control. The PCR assays were done using a real time PCR system (CFX384, Bio-Rad, Hercules, California, U.S.A) with the following cycling conditions: 50° C for 2 min, 95° C for 10 min, 40 cycles of 95° C for 15 sec and 60° C for 1 min. Reaction specificity was confirmed by running appropriate negative controls. Cycle threshold (CT) values for each gene of interest were normalized to the corresponding CT values for β-actin (ΔCT). Relative gene expression in acidotic animals was calculated in relation to control animals (ΔΔCT).
Protein measurements
Protein was extracted from retinas and prepared for Western analysis. Lysates were applied to NuPAGE SDS-PAGE gels (Life Technologies, Carlsbad, CA) followed by transfer to nitrocellulose membranes. Membranes were blocked in 2% ECL Prime Blocking Reagent, 5% milk or 5% BSA diluted in 1x tris-buffered saline and Tween 20. Membranes were then incubated with mouse anti-NHE-1 Antibody, C-terminus, clone 4E9 (1:500; Millipore, Billerica, MA, U.S.A.), mouse-anti-SLC4A3 (AEP-3) (1:500; Abcam), rabbit-anti CA-XIV (1:1000, Sigma, St Louis, MO, U.S.A.), rabbit-anti-CA-II (1:1000), and mouse anti-actin (1:5000; Cell Signaling). Primary antibodies were detected using goat anti-mouse or anti-rabbit secondary antibody conjugated with horseradish peroxidase (1:10,000) and chemiluminescence with horseradish peroxidase substrate Lumigen TMA-6 (Lumigen, Southfield, MI).
Immunofluorescence of rat retinas
Eyes from separate control and acidotic animals were used to localize proteins of interest. They were fixed in 4% paraformaldehyde (PFA) for 2 hours at room temperature or overnight at 4°C. Next, the eyes were washed in phosphate buffered saline (PBS) three times for ten minutes each. The corneas and lenses were removed. The eye cups were suspended in 5% sucrose solution (sucrose in PBS) for 1 hour, followed by a suspension in 10% sucrose for 30 minutes, and finally in 20% sucrose until the eye cups sank to the bottom of the solution. After that, the eye cup was taken and infiltrated in a 2:1 ratio of a mixture 20% sucrose solution and Tissue-Tek optimum cutting temperature (O.C.T.) medium (Sakura® Finetek; USA INC) until the eye cup sank into a Tissue-Tek Cryomold. The eye cup molds were then dropped in liquid N2 for 30 seconds to 1 minute and were stored at −80°C until they were ready to be sectioned. Ten μm sections were prepared using a cryostat. Sections were blocked in 10% goat serum with 0.3% Triton X-100. Samples were then incubated at 4°C with rabbit anti-NHE-1 (H-160) (1:400; Santa Cruz Biotechnology),, sheep anti-CA-II (2ug/mL; R&D Systems), isolectin GS-IB4 Alexa Fluor 488, isolectin or GS-IB4 Alexa Fluor 647 (1:50; Life Technologies) for 3 days, followed with goat anti-rabbit IgG (H+L) Alexafluor 488, goat anti-rabbit IgG (H+L) Alexafluor 555, or goat anti-chicken IgY (H+L) Alexafluor 488 (1:1000; Life Technologies) secondary fluorescent antibodies and Hoescht (1:1000; Life Technologies). Retina samples were imaged using a confocal microscope (TCS SP5; Leica, Wetzlar, Germany).
Recordings of Intraretinal pH
A separate group of animals was used to evaluate the effect of NH4Cl on retinal pH. Recordings were made with double-barreled ion-selective pH microelectrodes, generating profiles of [H+]o across the retina, as described previously (4). During recordings, the animals were maintained under urethane and isoflurane anesthesia and artificially respired to maintain normal blood gas values. Three of these animals had been acidic for two weeks. After surgical preparation, two were still moderately acidic (arterial pH of 7.25 and 7.3) but one had normal blood pH (7.35). Recordings were made from two additional animals that had received normal drinking water and had normal blood pH at the beginning of recording. After recording several [H+]o profiles across the retina from each of these five animals, all were given intravenous 1 M NH4Cl (2.5 to 8.5 ml/kg over an average of 80±33 min) to reduce arterial pH, and additional recordings were made during acidosis at an arterial pH of 7.02 to 7.19 (average 7.11). In one of these animals, and in two animals not subjected to NH4Cl, 5 μl of cariporide was given intravitreally to assess the effect of blocking NHE-1 on retinal pH profiles. Because of uncertainty in the retinal concentration of cariporide following vitreal injection and the amount that would be needed to be effective, the cariporide concentration in the injected solution varied in different experiments between 80 and 800 μM.
Statistics
Statistical evaluation was performed with unpaired t-tests, ANOVA, or regression analysis as appropriate.
Results
Intraretinal [H+] recordings
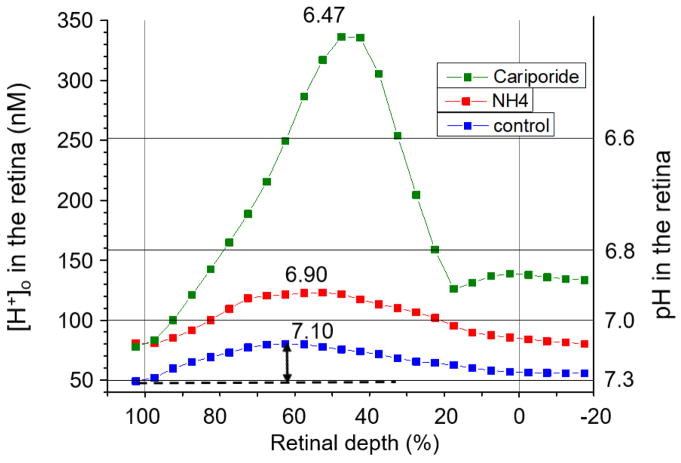
Intraretinal recordings of [H+]o were made in a separate group of animals from those used for molecular studies in order to assess the magnitude of changes in retinal [H+]o caused by metabolic acidosis. These recordings were made in dark adaptation during withdrawal of the microelectrode at 1 μm/sec, after penetrating the retina in steps until a change in the intraretinal electroretinogram signaled that the RPE had been crossed. Figure 1 shows results from one of the 14-day acidic animals. The lowest curve is an average of three withdrawal profiles when arterial pH was 7.3, lower than normal as a result of the NH4Cl in the drinking water for two weeks. [H+]o across the retina is plotted vs. percent retinal depth, where 0% is the vitreal surface of the retina and 100% is the retinal pigment epithelium. For averaging, each profile was segmented into bins consisting of 5% retinal depth, and the average [H+]o was computed in that bin. Corresponding bins were then averaged across profiles. After recording in the acidotic baseline condition, NH4Cl was given intravenously, and additional profiles were recorded. The three profiles averaged for this condition were recorded starting at about 2 hours after the onset of the IV infusion. The additional NH4Cl resulted in an almost uniform acidification of the entire retina. In this animal, an intravitreal injection of cariporide was given following the recordings under IV NH4Cl. Cariporide resulted in a further dramatic acidification, to a peak retinal [H+]o of 336 nM (pH = 6.46) (Figure 1). In two other animals where no IV NH4Cl was given, the peak retinal [H+]o was 157 nM (pH = 6.80) and 178 nM (pH = 6.75) after intravitreal cariporide, an increase of 40 to 60 nM. These results indicate the importance of NHE-1 in retinal pH regulation.
Figure 1.
[H+]o gradients across the retina in one 14-day acidotic animal (rat 323). The blue curve is the average of three profiles prior to any further manipulation of systemic pH. The red curve is the average of three profiles following intravenous NH4Cl. The green curve is for a profile obtained after intravitreal injection of cariporide. Data points represent the average [H+]o over each 5% segment of the profile. Zero % retinal depth is the border between the vitreous and the retina; 100% represents the RPE. The arrow indicates the amplitude of the profile.
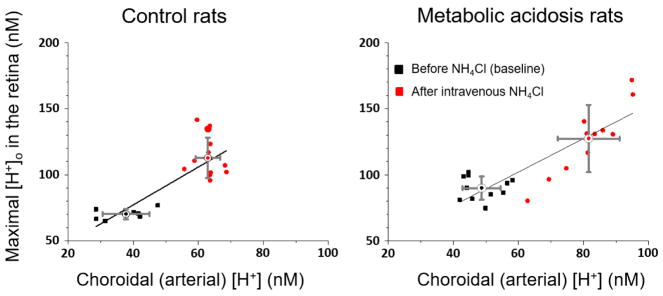
To quantify the retinal [H+]o changes during acidification, the maximum [H+]o in profiles was measured and is plotted against the choroidal (arterial) [H+] in Figure 2. The choroidal value is assumed to be the same as the arterial value because of the rapid choroidal blood flow rate. Each point represents one pH profile. The black points for the two control animals (not subjected to NH4Cl in the drinking water, left panel) and those with 14 days of oral NH4Cl (n=3 animals; right panel) were recorded before any IV NH4Cl (baseline), and the red points were recorded after IV NH4Cl. The means and standard deviations of the profiles under each condition are also shown. Comparison of the baseline retinal [H+]o in control animals (left panel) and chronically acidotic animals (right panel) shows the acidification of the retina after chronic metabolic acidosis, with the retinal maximum being 70.2 ± 3.6 nM (mean ± SD) in control animals and 89.9 ± 8.8 nM in the 14-day acidotic animals (p<0.001). The blood pH in the baseline condition for the metabolic acidosis animals was higher than that in the animals used for molecular measurements, so NH4Cl was given intravenously to lower the blood pH to a level approximating the value in the animals used for the molecular measurements. This was successful, and red points are generally above and to the right of black points, showing that both the blood and retina were acidified by IV NH4Cl in both groups. The regressions for both panels are significant at p < 0.001. If two weeks of chronic metabolic acidosis had made the retina better able to deal with the subsequent acute acidic challenge of IV NH4Cl, then one might have expected the regression line in the right panel to be flatter, although in the discussion we consider why this is not a strong prediction. The slope of the regression line was in fact smaller in the right panel (1.26 vs 1.43 nM/nM), but the 95% confidence intervals for the regression slopes overlapped, so the difference was not significant.
Figure 2.
Maximum [H+]o in profiles as a function of choroidal [H+] for control rats (left panel) and 14-day acidotic rats (right panel), before (black symbols) and after (red symbols) intravenous NH4Cl. Each symbol represents one profile. Regression lines are shown for each condition along with the mean and SD for the pre- and post-IV-NH4Cl data. R2 = 0.65 for control rats; 0.76 for acidotic rats.
Changes in gene and protein expression in acidosis
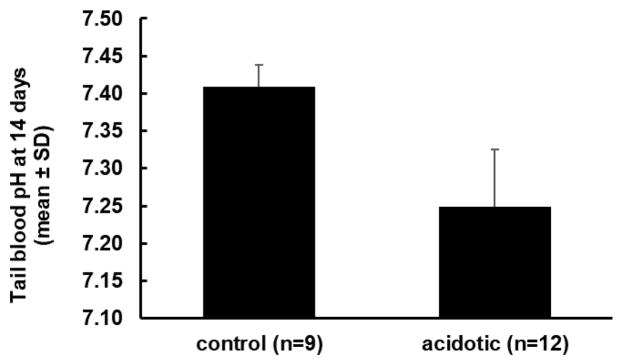
For the purpose of investigating the retinal response to altered pH, it was necessary to maintain acidosis for an extended time in order to determine whether gene expression was altered. Consequently, we induced metabolic acidosis by adding NH4Cl to the drinking water for up to two weeks (26, 27). Retinas were collected from rats at 3 days (6 control; 6 acidotic), 7 days (a total of 9 control and 12 acidotic in two separate experiments) and 14 days (a total of 9 control and 12 acidotic in two separate experiments). Treated rats became acidotic over the first two to three days, and then maintained a similar level of acidosis for the duration of the experiment. At the end of 14 days, just before euthanasia, the average pH of control rats’ tail blood (n=9) was 7.41 ± 0.03 (mean ± SD) and the pH of acidotic rats (n=12 in two groups) was 7.25 ± 0.08, (p<0.01) (Figure 3). There was a tendency for treated rats to be more acidotic in the second of the two 14 day experiments, but the difference was not significant (t-test; p = 0.06). The PCO2 in these venous samples was similar for controls (50.0 ± 3.3 mmHg) and acidotic rats (49.7 ± 5.0 mmHg). Bicarbonate concentration, calculated from pH and PCO2, was lower in the acidotic rats (21.4 ± 4.6 mM) than in controls (30.5 ± 1.0 mM), consistent with metabolic acidosis.
Figure 3.
pH of tail blood samples from control and acidotic rats after 14 days of metabolic acidosis, just before euthanasia (mean ± SD). Control and acidotic groups were significantly different (p<0.001). Converted to nM, the control average [H+] was 39 nM and the acidotic average was 56 nM.
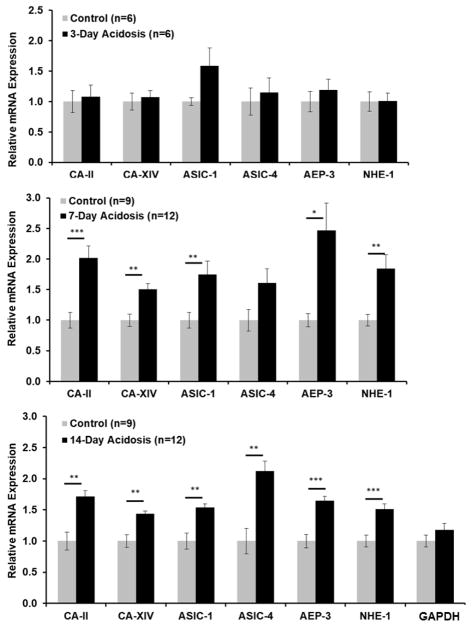
Time course analysis using qRT-PCR revealed that the mRNA of six genes potentially involved in regulation of H+ and known to be present in the retina were significantly upregulated by metabolic acidosis (Figure 4). The mRNAs tested were two isoforms of carbonic anhydrase (CA-II and CA-XIV), two isoforms of the acid-sensing ion channel (ASIC1 and ASIC4), the anion exchanger AEP-3, and the sodium-hydrogen exchanger NHE-1. Gene expression was measured by qRT-PCR using Taqman primers, normalized to actin and quantified by the ΔΔCt method. For the 7 and 14 day experiments, changes in mRNA expression were similar in the two experiments done at each time point, so results are combined (Figure 4). No significant change was observed at day 3, although ASIC1 tended to be higher in acidotic rats. At day 7, CA-II, CA-XIV, ASIC1, AEP-3 and NHE-1 were significantly higher in acidotic rats than in controls. By 14 days significant changes of 40 to 100% were observed in all mRNAs tested. A GAPDH primer was used as a separate control and did not change.
Figure 4.
Retinal mRNA (mean ± SEM) expression after 3, 7 and 14 days of metabolic acidosis normalized to control expression for each gene. The genes were carbonic anhydrase II and XIV (CA-II and CA-XIV), acid-sensing ion channels 1 and 4 (ASIC-1 and ASIC-IV), anion exchange protein 3 (AEP-3) and Na+/H+ exchanger 1 (NHE-1). Glyceraldehyde 3-phosphate dehydrogenase (GAPDH) was a control gene that was not expected to change. One asterisk: significantly different at p<0.05. Two asterisks: significantly different at p <0.01.; three asterisks: significantly different at p ≤ 0.001.
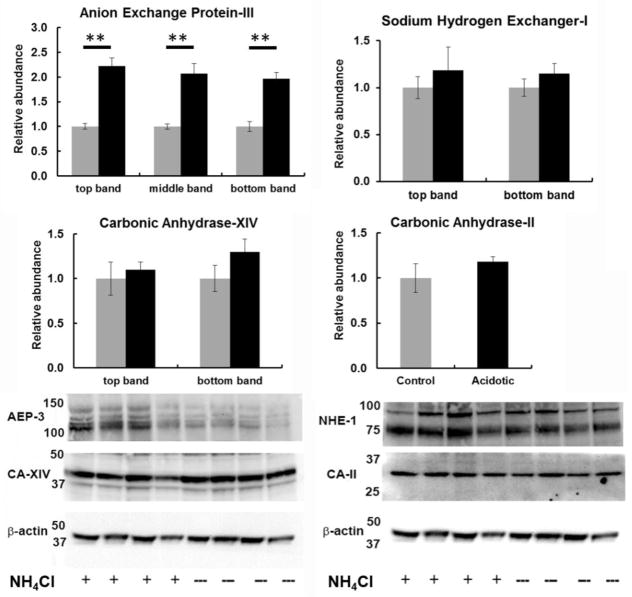
Protein changes were also analyzed in the 14 day experiments for genes where an antibody was available (Figure 5). For CA-XIV, AEP-3, and NHE-1, Western blots revealed multiple bands near the expected molecular weights, and each band was quantified separately. CA-II exhibited just a single band. Protein for all four tended to increase, as predicted by the mRNA findings, but only AEP-3, which increased two fold, was statistically different during acidosis.
Figure 5.
Retinal protein levels measured by Western blot in control animals (gray) and after 14 days of metabolic acidosis (black). The expected sizes of protein for AEP-3, NHE-1, CA-XIV and CA-II are 136 kDa, 90 kDa, 37kDa and 28 kDa respectively. The difference between controls and acidotic animals was significant for AEP-3 at p < 0.01.
Immunohistochemistry
Antibodies that were successful for immunofluorescence microscopy could only be identified for CA-II and NHE-1, and these were used to localize proteins in control and acidotic conditions. Controls in which the primary antibodies were omitted did not show any labeling (not shown). As shown in Figure 6, CA-II labeled the ganglion cell layer most strongly, with additional labeling in the inner nuclear layer. CA-II was roughly co-localized with isolectin B4 (IB4), a label for blood vessels, but was not identified closely enough to attribute the CA-II labeling to blood vessels, and it may be associated more prominently with astrocytes or pericytes instead. Figure 7 shows that NHE-1 labeled the inner retina, but the most striking and consistent labeling was in the outer plexiform layer (OPL), where NHE-1 was very closely associated with isolectin B4, suggesting that NHE-1 in the OPL was associated with blood vessels rather than neural or glial elements. This is the region of the deepest capillaries of the retinal circulation, which are well-positioned to help regulate the highly acidic outer nuclear layer.
Figure 6.
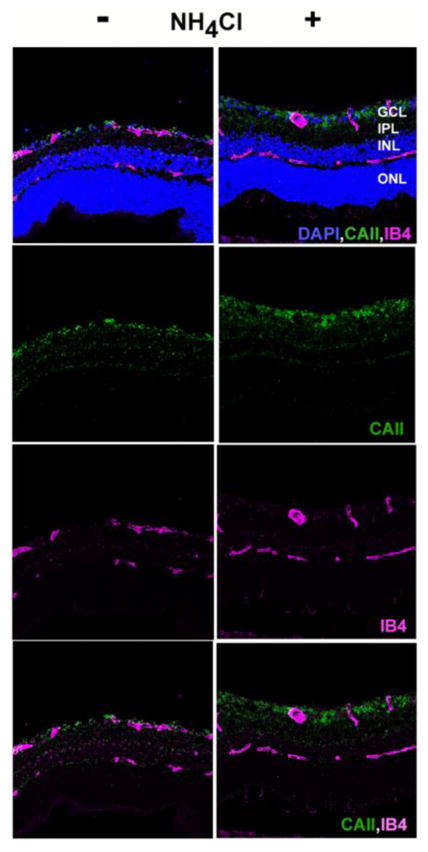
Immunohistochemistry for CA-II. Retinal sections were treated with antibodies and counterstains for isolectin B4 (pink) and CA-II (green). Sections were also stained with DAPI (blue) to show cellular layers. Left column: control rat; right column: 14 day acidotic rat.
Figure 7.
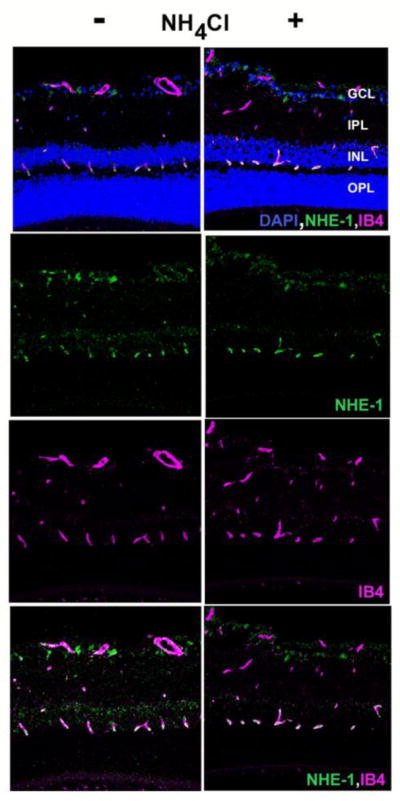
Immunohistochemistry for NHE-1. Retinal sections were treated with antibodies and counterstains for for isolectin B4 (pink) and NHE-1 (green). Sections were also stained with DAPI to show cellular layers. Left column: control rat; right column: 14 day acidotic rat.
Changes in mRNA in diabetes
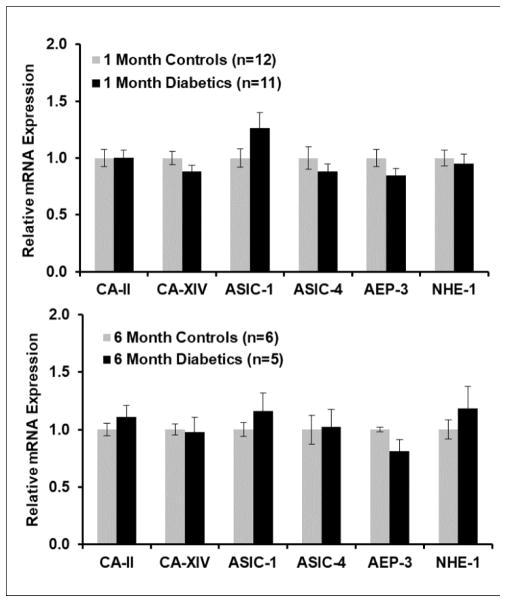
Because the retina in Long-Evans rats becomes more acidic between 1 and 3 months of diabetes (4), we hypothesized that there might be similar changes in mRNA in diabetic animals as in acidotic animals. Consequently, mRNA for the same genes was measured in a group of 1 month Long-Evans streptozotocin diabetic animals in two separate experiments (total n=11), and corresponding age-matched controls (total n=12), treated and maintained as described previously (4) and having blood glucose values averaging about 500 mg/dl. ASIC-1 tended to be higher in the diabetics, but mRNA was not significantly different for any genes in these two groups (Figure 8). The same experiment was performed to compare a group of 6 month diabetic animals (n=5) to age-matched controls (n=6). Again, no difference between diabetics and controls was observed, but there was the same tendency for ASIC-1 to be higher. The standard error of the measurements of each gene in 6-month diabetics was higher than in the age-matched controls by at least a factor of 2 for all genes except ASIC-4, which had high variability in the controls as well as the diabetics. The variability was not higher in 1-month diabetics than in controls. This greater variation as diabetes progresses, despite similar blood glucose values in all animals, was also observed in intraretinal pH recordings from diabetics (4).
Figure 8.
Retinal mRNA (mean ± SEM) expression in rats made diabetic with streptozotocin for 1 month or 6 months, compared to age-matched controls treated only with the citric acid vehicle used for the streptozotocin injections. No differences between diabetics and controls were significant.
Discussion
The current studies show that the retina expresses genes that are important in pH regulation, and that their expression changes in response to systemic acidosis. Metabolic acidosis by providing NH4Cl in the drinking water. It would have been ideal to produce chronic acidosis with CA inhibitors, which are known to produce retinal acidification after intravenous injection (7, 8), but it was not possible to produce chronic acidosis with CA inhibitors in the drinking water. Attempts to have rats drink water containing CA inhibitors failed, even when sucrose was added, evidently because all CA inhibitors are bitter, and this is aversive to rats. Producing metabolic acidosis with NH4Cl is more complicated. When NH4Cl is given in situations with isolated cells, NH4+ itself does not easily penetrate the membrane, and instead NH3 enters the cell and combines with H+, causing an alkalinization rather than acidification (6, 29). Thus, it was necessary to show that NH4Cl would acidify the retina as well as the blood, which was verified with intraretinal recordings of [H+]o (Figures 1 and 2). We do not know whether the acidification of the retina was due to NH4+ somehow crossing the blood-retinal barrier and entering retinal extracellular space, or whether the blood acidosis caused changes in RPE and endothelial cell transport that led to acidification. Nevertheless, it was possible to verify that NH4Cl led to a pan-retinal acidosis, both acutely with IV injections, and chronically, with oral NH4Cl. Chronic NH4Cl allowed us to keep the retina acidic and investigate molecular responses, which are discussed further below. The observed changes in gene expression were not capable of preventing further increases in retinal [H+]o but this may be expected as the chronic NH4Cl already increased [H+]o beyond the physiological range and saturated the ability of the retina to compensate. A true test of compensation would require targeted local inhibition of gene expression and measures of retinal responses to change in proton concentration at different levels of acidosis.
Changes in Gene Expression
Responses to systemic metabolic acidosis are usually associated with the kidney, where many genes are upregulated and some are downregulated (27). The results obtained here show for the first time that the retina itself can upregulate acid-handling and acid-sensing systems. At the message level, all the genes involved in pH regulation that were investigated revealed significant upregulation by 14 days. These genes were chosen because they are expressed in the retina as discussed in the introduction, and were expected to be directly related to H+ regulation or sensing. Other isoforms of these or other transporters (e.g. the sodium-bicarbonate cotransporter, NBC1) may change as well. In addition, the expression of some of these genes or related ones could change in the RPE or choroid, which were not studied due to our interest in identifying mechanisms in the neural retina.
In the mouse kidney, 2 or 7 days of metabolic acidosis produced with NH4Cl significantly (> 2 fold) altered the expression of hundreds of genes on a genome-wide screen (27). A key element of the renal response to acidosis involves metabolic processing of glutamine to release ammonia into the renal tubule. The retinal response probably mainly involves local buffering and transport of protons, so the genes involved in the kidney would not be expected to be the same as those in the retina. Indeed, none of the genes shown to change here were observed to be altered in the mouse kidney (27), but in rabbit kidney CA-II mRNA (30) and activity (31) increased during metabolic acidosis produced with NH4Cl. It is possible that a genome-wide screen of the retina would reveal many more changes than were found here, some related to regulation, and potentially some related to acidosis-related damage.
Protein quantification and immunohistochemistry
The work on retinal proteins corresponding to the identified genes was limited by the available probes, and by the greater difficulty in quantifying protein changes of a modest degree by Western analysis compared to the highly quantifiable mRNA changes measured by qRT-PCR. Nevertheless, CA-II, CA-XIV and NHE-1 tended to change in the expected direction, and the change in AEP-3 was highly significant.
We confirmed the previous localization of the intracellular form of carbonic anhydrase, CA-II, to the innermost retina, but it did not appear to be in Muller cells (15) as has previously been reported, but had a distribution more consistent with astrocytes or pericytes. Perhaps surprisingly, because of the importance of pH buffering, there was only faint expression in any other cell layer, and no other intracellular CA has been found in the retina (17, 32, 33). CA-XIV has been associated with Muller cells and RPE cells in mouse retina (17, 33). Prior work shows that CA is important to retinal pH regulation. The retina is acidified by non-selective block of CA with acetazolamide in cat (8) or dorzolamide in rat (A.V. Dmitriev et al., in preparation and (34)), or blocking CA-XIV with benzolamide, which does not penetrate cells, in chick (35) or cat (7). In addition, knockout of CA-XIV decreases the amplitude of the ERG (32).
NHE-1 had its major retinal expression in the deep capillary plexus in the outer plexiform layer, with a very strong correlation to blood vessels, suggesting that in this region, near where [H+]o is near its maximum in the retina, H+ clearance from the retina is at least partly achieved by transport across the apical membrane of endothelial cells into the capillaries. Consistent with this, the NHE blocker cariporide acidified the retina. An unknown form of NHE was previously implicated in photoreceptor H+ transport (36). NHE-1 has been localized to blood vessels in both the inner and outer retina, where its expression has been found to increase at 6 and 12 weeks of diabetes in Sprague-Dawley rats (19), a finding that we were not able to replicate in Long-Evans rats at 1 month. In general, NHE-1 is activated by PKC, hyperglycemia, growth factors, oxidative stress, and advanced glycation end-products, with all but the first of these acting through MAPK (37), although whether these stimuli also increase NHE-1 expression is not clear from the literature. In addition to its well-established role in preventing intracellular acidosis, NHE-1 appears to play a role in vascular smooth muscle cell proliferation in at least some tissues (37), and it may mediate the effects of endothelin on the retinal vasculature (19). We could not demonstrate changes in the immunohistochemistry of either CA-II or NHE-I during acidosis, but this was expected to be difficult given the modest mRNA changes and the less quantitative nature of immunohistochemistry in relation to qRT-PCR.
While we did not find suitable antibodies to study the localization of the other proteins of interest, the literature suggests that subtle modulations of them could influence retinal function, and it is worth reviewing the relevant observations. One isoform of AEP-3 is found in Muller cells and another is in horizontal cells in rat retina (18). It has been suggested that CO2 generated by photoreceptors is converted into bicarbonate in Muller cells, using CA-II, and then AE3 moves the bicarbonate out of Muller cells to allow further buffering (18), but regulation of Muller cell pH or Cl−, independent of photoreceptor activity, is also possible. Knockout of the gene for AE3 (Slc4A3) in mice leads to a retinal dysfunction that begins in the inner retina with selective loss of the b-wave, and then proceeds to cause photoreceptor degeneration, and this occurs even though CA-II and CA-XIV and the Na+-bicarbonate transporter NBC1 are upregulated in the knockout animals (38). A mutation of Slc4A3 also causes photoreceptor degeneration in dogs (39).
Similarly the acid-sensing ion channels (ASICs) may have a variety of functions. ASICs are non-classical, H+-gated cation channels (40). Several isoforms (ASIC1a and ASIC1b, ASIC2a and ASIC2b, ASIC3 and ASIC4) are found in inner and outer retinal neurons as well as Muller cells (41, 42). Their roles are not completely understood, but they appear to play a role in cell survival and other functions. Deletion of ASIC2a (24) or ASIC3 (23) increases the amplitude of the ERG, but either knockout leads to subsequent retinal degeneration. On the other hand, the presence of ASIC1 leads to degeneration under some conditions, as noted below, and its upregulation in acidosis may be detrimental, in contrast to the upregulation of CA, AE3 and NHE-1, which are more likely protective. Acidosis opens ASIC1, allowing Ca+2 entry into cultured mouse hippocampal cells, an effect that is significantly reduced in ASIC1 knockouts (43). Ca+2 entry is not associated with other ASICs (43). Blocking ASIC1a with a specific antagonist prevents ganglion cell damage caused by hypoxia (25) or by chloroquine (44). Similarly, ganglion cell death due to optic nerve ligation was prevented by amiloride (45), another blocker of ASICs, but amiloride blocks NHE-1 as well, so this was a less specific test. However, increased ASIC1 appears from the existing evidence to be detrimental, so the increase in ASIC1 message in this study may suggest a damaging effect of acidosis. Many questions remain about ASICs and their functions, and whether longer-term acidosis would cause the protein levels to increase.
The outer retina is relatively acidic even without imposed acidosis. In acute metabolic or respiratory acidosis the retina further acidifies and the ERG is affected, indicating that acidosis leads to functional consequences (46–48). The expression of acid regulating transporters suggests the ability to regulate the retinal pH environment locally in response to chronic metabolic acidosis by increasing expression of a number of mechanisms related to local pH control. Acidosis is also expected during any ischemic disease when the retina is forced to rely on anaerobic glycolysis. In retinal artery occlusion, for instance, the inner retina becomes much more acidic (11). Acidosis may also occur if hyperglycemia causes tissues to increase glycolysis, as is the case in acute hyperglycemia in cats (9) and early diabetes in rats (4) and probably cats (12). The current studies suggest the retina may respond to local pH changes in an attempt to maintain retinal homeostasis.
Acknowledgments
Supported by NIH grant R01EY021165.
References
- 1.Oakley B, 2nd, Wen R. Extracellular pH in the isolated retina of the toad in darkness and during illumination. J Physiology. 1989;419:353–78. doi: 10.1113/jphysiol.1989.sp017876. [DOI] [PMC free article] [PubMed] [Google Scholar]
- 2.Padnick-Silver L, Linsenmeier RA. Quantification of in vivo anaerobic metabolism in the normal cat retina through intraretinal pH measurements. Visual neuroscience. 2002;19(6):793–806. doi: 10.1017/s095252380219609x. [DOI] [PubMed] [Google Scholar]
- 3.Yamamoto F, Borgula GA, Steinberg RH. Effects of light and darkness on pH outside rod photoreceptors in the cat retina. Exp Eye Res. 1992;54(5):685–97. doi: 10.1016/0014-4835(92)90023-l. [DOI] [PubMed] [Google Scholar]
- 4.Dmitriev AV, Henderson D, Linsenmeier RA. Development of diabetes-induced acidosis in the rat retina. Exp Eye Res. 2016;149:16–25. doi: 10.1016/j.exer.2016.05.028. [DOI] [PMC free article] [PubMed] [Google Scholar]
- 5.Winkler BS. A quantitative assessment of glucose metabolism in the isolated rat retina. In: Christen Y, Doly M, Droy-Lefaix M, et al., editors. Les Seminaires ophthalmologiques d’IPSEN, Vision et adaptation. 6. Paris: Elsevier; 1995. pp. 78–96. [Google Scholar]
- 6.Kenyon E, Maminishkis A, Joseph DP, Miller SS. Apical and basolateral membrane mechanisms that regulate pHi in bovine retinal pigment epithelium. Am J Physiology. 1997;273(2 Pt 1):C456–72. doi: 10.1152/ajpcell.1997.273.2.C456. [DOI] [PubMed] [Google Scholar]
- 7.Wangsa-Wirawan N, Padnick-Silver L, Budzynski E, Linsenmeier R. pH regulation in the intact cat outer retina. ARVO Abstract. Invest Ophthalmol Vis Sci. 2001;42(4):S367. [Google Scholar]
- 8.Yamamoto F, Steinberg RH. Effects of intravenous acetazolamide on retinal pH in the cat. Exp Eye Res. 1992;54(5):711–8. doi: 10.1016/0014-4835(92)90025-n. [DOI] [PubMed] [Google Scholar]
- 9.Padnick-Silver L, Linsenmeier RA. Effect of hypoxemia and hyperglycemia on pH in the intact cat retina. Arch Ophthalmol. 2005;123(12):1684–90. doi: 10.1001/archopht.123.12.1684. [DOI] [PubMed] [Google Scholar]
- 10.Yamamoto F, Steinberg RH. Effects of systemic hypoxia on pH outside rod photoreceptors in the cat retina. Exp Eye Res. 1992;54(5):699–709. doi: 10.1016/0014-4835(92)90024-m. [DOI] [PubMed] [Google Scholar]
- 11.Birol G, Budzynski E, Wangsa-Wirawan ND, Linsenmeier RA. Retinal arterial occlusion leads to acidosis in the cat. Exp Eye Res. 2005;80(4):527–33. doi: 10.1016/j.exer.2004.11.002. [DOI] [PubMed] [Google Scholar]
- 12.Budzynski E, Wangsa-Wirawan N, Padnick-Silver L, Hatchell D, Linsenmeier R. Intraretinal pH in diabetic cats. Current Eye Research. 2005;30(3):229–40. doi: 10.1080/02713680590934067. [DOI] [PubMed] [Google Scholar]
- 13.Kern TS, Berkowitz BA. Photoreceptors in diabetic retinopathy. J Diabetes Investig. 2015;6(4):371–80. doi: 10.1111/jdi.12312. [DOI] [PMC free article] [PubMed] [Google Scholar]
- 14.Purkerson JM, Schwartz GJ. The role of carbonic anhydrases in renal physiology. Kidney International. 2007;71(2):103–15. doi: 10.1038/sj.ki.5002020. [DOI] [PubMed] [Google Scholar]
- 15.Linser P, Moscona AA. Variable CA II compartmentalization in vertebrate retina. Annals NY Acad Sciences. 1984;429:430–46. doi: 10.1111/j.1749-6632.1984.tb12369.x. [DOI] [PubMed] [Google Scholar]
- 16.Wistrand PJ, Schenholm M, Lonnerholm G. Carbonic anhydrase isoenzymes CA I and CA II in the human eye. Invest Ophthalmol Vis Sci. 1986;27(3):419–28. [PubMed] [Google Scholar]
- 17.Ochrietor JD, Clamp MF, Moroz TP, Grubb JH, Shah GN, Waheed A, et al. Carbonic anhydrase XIV identified as the membrane CA in mouse retina: strong expression in Muller cells and the RPE. Exp Eye Research. 2005;81(4):492–500. doi: 10.1016/j.exer.2005.03.010. [DOI] [PubMed] [Google Scholar]
- 18.Kobayashi S, Morgans CW, Casey JR, Kopito RR. AE3 anion exchanger isoforms in the vertebrate retina: developmental regulation and differential expression in neurons and glia. J Neuroscience. 1994;14(10):6266–79. doi: 10.1523/JNEUROSCI.14-10-06266.1994. [DOI] [PMC free article] [PubMed] [Google Scholar]
- 19.Cukiernik M, Hileeto D, Downey D, Evans T, Khan ZA, Karmazyn M, et al. The role of the sodium hydrogen exchanger-1 in mediating diabetes-induced changes in the retina. Diabetes Metab Res Rev. 2004;20(1):61–71. doi: 10.1002/dmrr.421. [DOI] [PubMed] [Google Scholar]
- 20.Lupachyk S, Stavniichuk R, Komissarenko JI, Drel VR, Obrosov AA, El-Remessy AB, et al. Na+/H+-exchanger-1 inhibition counteracts diabetic cataract formation and retinal oxidative-nitrative stress and apoptosis. Int J Molecular Med. 2012;29(6):989–98. doi: 10.3892/ijmm.2012.933. [DOI] [PMC free article] [PubMed] [Google Scholar]
- 21.Brockway LM, Benos DJ, Keyser KT, Kraft TW. Blockade of amiloride-sensitive sodium channels alters multiple components of the mammalian electroretinogram. Visual Neurosci. 2005;22(2):143–51. doi: 10.1017/S0952523805222034. [DOI] [PubMed] [Google Scholar]
- 22.Lilley S, LeTissier P, Robbins J. The discovery and characterization of a proton-gated sodium current in rat retinal ganglion cells. J Neurosci. 2004;24(5):1013–22. doi: 10.1523/JNEUROSCI.3191-03.2004. [DOI] [PMC free article] [PubMed] [Google Scholar]
- 23.Ettaiche M, Deval E, Pagnotta S, Lazdunski M, Lingueglia E. Acid-sensing ion channel 3 in retinal function and survival. Invest Ophthalmol Vis Sci. 2009;50(5):2417–26. doi: 10.1167/iovs.08-3028. [DOI] [PubMed] [Google Scholar]
- 24.Ettaiche M, Guy N, Hofman P, Lazdunski M, Waldmann R. Acid-sensing ion channel 2 is important for retinal function and protects against light-induced retinal degeneration. J Neurosci. 2004;24(5):1005–12. doi: 10.1523/JNEUROSCI.4698-03.2004. [DOI] [PMC free article] [PubMed] [Google Scholar]
- 25.Tan J, Ye X, Xu Y, Wang H, Sheng M, Wang F. Acid-sensing ion channel 1a is involved in retinal ganglion cell death induced by hypoxia. Mol Vis. 2011;17:3300–8. [PMC free article] [PubMed] [Google Scholar]
- 26.Nowik M, Kampik NB, Mihailova M, Eladari D, Wagner CA. Induction of metabolic acidosis with ammonium chloride (NH4Cl) in mice and rats--species differences and technical considerations. Cellular Physiol Biochem: Int J Exp Cell Physiol. Biochem, Pharmacol. 2010;26(6):1059–72. doi: 10.1159/000323984. [DOI] [PubMed] [Google Scholar]
- 27.Nowik M, Lecca MR, Velic A, Rehrauer H, Brandli AW, Wagner CA. Genome-wide gene expression profiling reveals renal genes regulated during metabolic acidosis. Physiological genomics. 2008;32(3):322–34. doi: 10.1152/physiolgenomics.00160.2007. [DOI] [PubMed] [Google Scholar]
- 28.Winkler BS, Kapousta-Bruneau N, Arnold MJ, Green DG. Effects of inhibiting glutamine synthetase and blocking glutamate uptake on b-wave generation in the isolated rat retina. Visual Neurosci. 1999;16(2):345–53. doi: 10.1017/s095252389916214x. [DOI] [PMC free article] [PubMed] [Google Scholar]
- 29.Thomas RC. Experimental displacement of intracellular pH and the mechanism of its subsequent recovery. J Physiol. 1984;354:3P–22P. doi: 10.1113/jphysiol.1984.sp015397. [DOI] [PMC free article] [PubMed] [Google Scholar]
- 30.Schwartz GJ, Winkler CA, Zavilowitz BJ, Bargiello T. Carbonic anhydrase II mRNA is induced in rabbit kidney cortex during chronic metabolic acidosis. Am J Physiol. 1993;265(6 Pt 2):F764–72. doi: 10.1152/ajprenal.1993.265.6.F764. [DOI] [PubMed] [Google Scholar]
- 31.Brion LP, Zavilowitz BJ, Suarez C, Schwartz GJ. Metabolic-acidosis stimulates carbonic-anhydrase activity in rabbit proximal tubule and medullary collecting duct. Am J Physiol. 1994;266(2):F185–F95. doi: 10.1152/ajprenal.1994.266.2.F185. [DOI] [PubMed] [Google Scholar]
- 32.Ogilvie JM, Ohlemiller KK, Shah GN, Ulmasov B, Becker TA, Waheed A, et al. Carbonic anhydrase XIV deficiency produces a functional defect in the retinal light response. Proc Natl Acad Sci USA. 2007;104(20):8514–9. doi: 10.1073/pnas.0702899104. [DOI] [PMC free article] [PubMed] [Google Scholar]
- 33.Nagelhus EA, Mathiisen TM, Bateman AC, Haug FM, Ottersen OP, Grubb JH, et al. Carbonic anhydrase XIV is enriched in specific membrane domains of retinal pigment epithelium, Muller cells, and astrocytes. Proc Natl Acad Sci USA. 2005;102(22):8030–5. doi: 10.1073/pnas.0503021102. [DOI] [PMC free article] [PubMed] [Google Scholar]
- 34.Dmitriev AV, Henderson D, Linsenmeier RA. Diabetes compromises pH control in the rat retina. Invest Ophthalmol Visual Sci ARVO Abstract 2016. 2016;57:108. doi: 10.1167/iovs.18-26073. [DOI] [PMC free article] [PubMed] [Google Scholar]
- 35.Wolfensberger TJ, Dmitriev AV, Govardovskii VI. Inhibition of membrane-bound carbonic anhydrase decreases subretinal pH and volume. Doc Ophthalmol Advances in Ophthalmology. 1999;97(3–4):261–71. doi: 10.1023/a:1002496223131. [DOI] [PubMed] [Google Scholar]
- 36.Katz BJ, Oakley B., 2nd Evidence for Na+/H+ exchange in vertebrate rod photoreceptors. Exp Eye Res. 1990;51(2):199–207. doi: 10.1016/0014-4835(90)90073-4. [DOI] [PubMed] [Google Scholar]
- 37.Hannan KM, Little PJ. Mechanisms regulating the vascular smooth muscle Na H exchanger (NHE-1) in diabetes. Biochem Cell Biology-Biochimie Biologie Cellulaire. 1998;76(5):751–9. doi: 10.1139/bcb-76-5-751. [DOI] [PubMed] [Google Scholar]
- 38.Alvarez BV, Gilmour GS, Mema SC, Martin BT, Shull GE, Casey JR, et al. Blindness Caused by Deficiency in AE3 Chloride/Bicarbonate Exchanger. PLoS One. 2007;2(9) doi: 10.1371/journal.pone.0000839. [DOI] [PMC free article] [PubMed] [Google Scholar]
- 39.Downs LM, Wallin-Hakansson B, Boursnell M, Marklund S, Hedhammar A, Truve K, et al. A Frameshift Mutation in Golden Retriever Dogs with Progressive Retinal Atrophy Endorses SLC4A3 as a Candidate Gene for Human Retinal Degenerations. PLoS One. 2011;6(6) doi: 10.1371/journal.pone.0021452. [DOI] [PMC free article] [PubMed] [Google Scholar]
- 40.Waldmann R, Champigny G, Bassilana F, Heurteaux C, Lazdunski M. A proton-gated cation channel involved in acid-sensing. Nature. 1997;386(6621):173–7. doi: 10.1038/386173a0. [DOI] [PubMed] [Google Scholar]
- 41.Brockway LM, Zhou ZH, Bubien JK, Jovov B, Benos DJ, Keyser KT. Rabbit retinal neurons and glia express a variety of ENaC/DEG subunits. Am J Physiol-Cell Physiology. 2002;283(1):C126–C34. doi: 10.1152/ajpcell.00457.2001. [DOI] [PubMed] [Google Scholar]
- 42.Vina E, Parisi V, Sanchez-Ramos C, Cabo R, Guerrera MC, Quiros LM, et al. Acid-sensing ion channels (ASICs) 2 and 4.2 are expressed in the retina of the adult zebrafish. Cell Tissue Research. 2015;360(2):223–31. doi: 10.1007/s00441-014-2084-5. [DOI] [PubMed] [Google Scholar]
- 43.Yermolaieva O, Leonard AS, Schnizler MK, Abboud FM, Welsh MJ. Extracellular acidosis increases neuronal cell calcium by activating acid-sensing ion channel 1a. Proc Natl Acad Sci U S A. 2004;101(17):6752–7. doi: 10.1073/pnas.0308636100. [DOI] [PMC free article] [PubMed] [Google Scholar]
- 44.Li XY, Fei JC, Lei Z, Liu KJ, Wu JB, Meng T, et al. Chloroquine impairs visual transduction via modulation of acid sensing ion channel 1a. Toxicology Letters. 2014;228(3):200–6. doi: 10.1016/j.toxlet.2014.05.008. [DOI] [PubMed] [Google Scholar]
- 45.Miyake T, Nishiwaki A, Yasukawa T, Ugawa S, Shimada S, Ogura Y. Possible implications of acid-sensing ion channels in ischemia-induced retinal injury in rats. Japanese J Ophthalmol. 2013;57(1):120–5. doi: 10.1007/s10384-012-0213-9. [DOI] [PubMed] [Google Scholar]
- 46.Linsenmeier RA, Mines AH, Steinberg RH. Effects of hypoxia and hypercapnia on the light peak and electroretinogram of the cat. Invest Ophthalmol Vis Sci. 1983;24(1):37–46. [PubMed] [Google Scholar]
- 47.Niemeyer G, Nagahara K, Demant E. Effects of changes in arterial PO2 and PCO2 on the electroretinogram in the cat. Invest Ophthalmol Vis Sci. 1982;23(5):678–83. [PubMed] [Google Scholar]
- 48.Niemeyer G, Steinberg RH. Differential effects of PCO2 and pH on the ERG and light peak of the perfused cat eye. Vision research. 1984;24(3):275–80. doi: 10.1016/0042-6989(84)90131-7. [DOI] [PubMed] [Google Scholar]


