Abstract
Tumor cells evade the immune surveillance by up-regulating surface expression of PD-L1, which interacts with PD-1 on T cells to elicit the immune checkpoint response1,2. Anti-PD-1 antibodies have shown remarkable promise in treating tumors, including metastatic melanoma2–4. However, patient response rate is low4,5. A better understanding of PD-L1-mediated immune evasion is needed to predict patient response and improve treatment efficacy. Here we report that metastatic melanoma releases a high level of extracellular vesicles (EVs), mostly in the form of exosomes, that carry PD-L1 on their surface. Interferon-γ (IFN-γ) up-regulates PD-L1 on these vesicles, which suppresses the function of CD8 T cells and facilitates tumor growth. In patients with metastatic melanoma, the level of circulating exosomal PD-L1 positively correlates with that of IFN-γ, and changes during the course of anti-PD-1 therapy. The magnitudes of the early on-treatment increase in circulating exosomal PD-L1, as an indicator of the adaptive response of the tumor cells to T cell re-invigoration, stratifies clinical responders from non-responders. Our study unveils a mechanism by which tumor cells systemically suppress the immune system, and provides a rationale for the application of exosomal PD-L1 as a predictor for anti-PD-1 therapy.
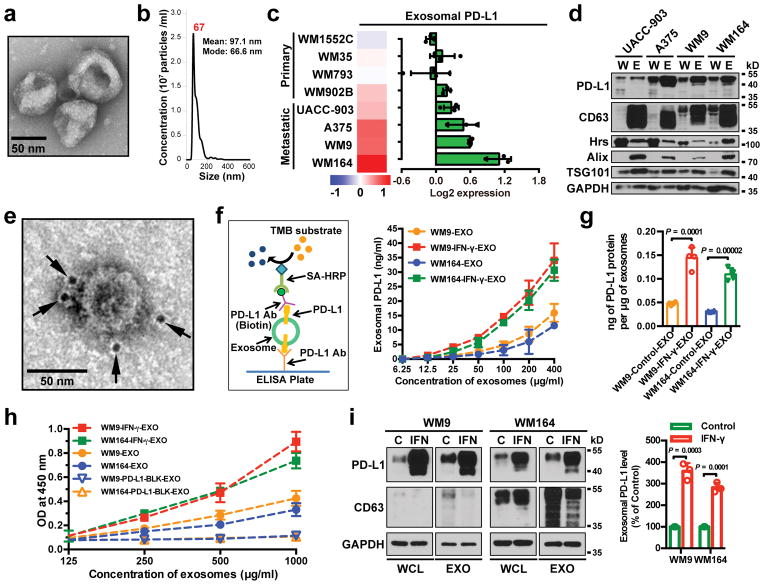
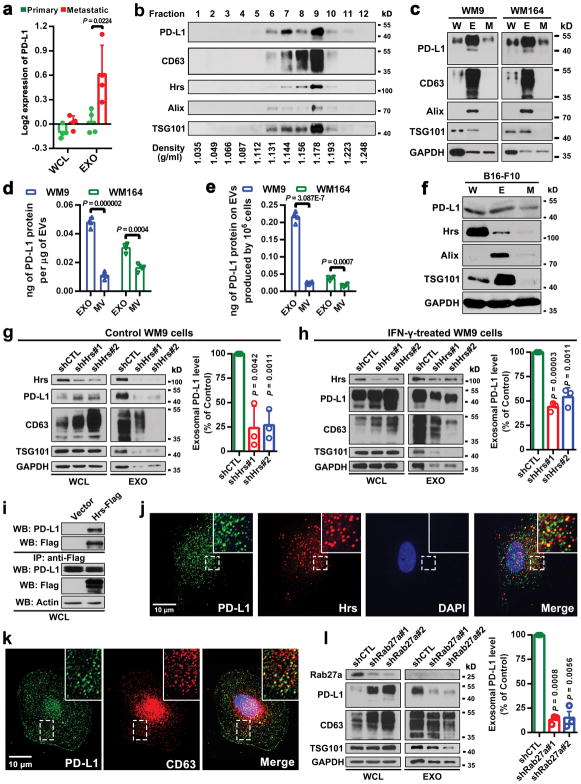
EVs such as exosomes and microvesicles (a.k.a. shedding vesicles) carry bioactive molecules that influence the extracellular environment and the immune system6–8. The exosomes from a panel of human primary and metastatic melanoma cell lines were purified by differential centrifugation9–11, and verified by transmission electron microscopy (EM) and nanoparticle tracking analysis (NTA) (Fig. 1a and 1b). Proteins associated with the exosomes were then analyzed by reverse phase protein array (RPPA), a large-scale antibody-based quantitative proteomics technology12. The RPPA and western blot analysis revealed PD-L1 in exosomes, and its level was significantly higher in exosomes derived from metastatic melanoma cells compared to primary melanoma cells (Fig. 1c and d, Extended Data Fig. 1a). Iodixanol density gradient centrifugation further confirmed the association of PD-L1 with the exosomes (Extended Data Fig. 1b). PD-L1 was also detected in microvesicles, but at a lower level (Extended Data Fig. 1c–e). PD-L1 was also detected in EVs generated from mouse metastatic melanoma B16-F10 cells (Extended Data Fig. 1f).
Figure 1. Extrafacial expression of PD-L1 on melanoma cell-derived exosomes and its regulation by INF-γ.
a, A representative TEM image of purified WM9 cell exosomes. b, Characterization of purified exosomes by NanoSight nanoparticle tracking system. c, RPPA data showing the level of PD-L1 in the exosomes secreted by primary or metastatic melanoma cell lines (n = 3 for WM1552C, WM902B, A375, WM164, and n = 4 for WM35, WM793, UACC-903, WM9). See Extended Data Fig. 1a for statistical analysis. d, Immunoblots for PD-L1 in the whole cell lysate (“W”) and purified exosomes (“E”) from different metastatic melanoma cell lines. The same amounts of proteins in whole cell lysates and exosome were loaded. e, A representative TEM image of WM9 cell-derived exosomes immunogold-labeled with anti-PD-L1 antibodies. Arrowheads indicate 5-nm gold particles. f, Diagram of ELISA of exosomal PD-L1 (left panel). PD-L1 on the surface of exosomes was determined. See Methods for details. g, Levels of PD-L1 on exosomes from melanoma cells, with or without IFN-γ treatment, as measured by ELISA. h, PD-l binding of exosomes. See Methods for details. i, Western blot analysis of PD-L1 in exosomes from IFN-γ-treated cells (“IFN”) and control cells (“C”). The same amounts of exosome proteins were loaded (left panel). Quantification of exosomal PD-L1 by western blotting (right panel). The experiments were repeated three (a, b) or two (d, e) times independently with similar results obtained. Data represent mean ± s.d. of three (f, h, i) or four (g) independent biological replicates. Statistical analyses were performed using two-sided unpaired t-test (g, i). For source data (d, i), see Supplementary Fig. 1.
Tumor cell surface PD-L1 can be up-regulated in response to IFN-γ secreted by activated T cells, and PD-L1 binds to PD-1 through its extracellular domain to inactivate T cells2,3,14. Using immuno-EM and enzyme-linked immunosorbent assay (ELISA) (Fig. 1e–g), we found that exosomal PD-L1 has the same membrane topology as the cell surface PD-L1, with its extracellular domain exposed on the surface of the exosomes. Exosomal PD-L1 binds PD-1 in a concentration-dependent manner and this interaction can be disrupted by PD-L1 blocking antibodies (Fig. 1h). Furthermore, the level of exosomal PD-L1 secreted by melanoma cells increased significantly upon IFN-γ treatment (Fig. 1f, g, i), and correspondingly, these exosomes displayed an increased binding to PD-1 (Fig. 1h).
Exosomes are generated and released through a defined intracellular trafficking route7,9,10. Knockdown of the ESCRT subunit HRS, which mediates the recognition and sorting of exosomal cargos15, led to a decrease in the level of PD-L1 in the exosomes and an increase of PD-L1 in the cell (Extended Data Fig. 1g, h). In addition, PD-L1 co-immunoprecipitated with Hrs from the cell lysates (Extended Data Fig. 1i). PD-L1 co-localized with Hrs and CD63, an exosome marker, in melanoma cells (Extended Data Fig. 1j, k). Knockdown of RAB27A, which mediates exosome release16, also blocked PD-L1 secretion via exosomes (Extended Data Fig. 1l).
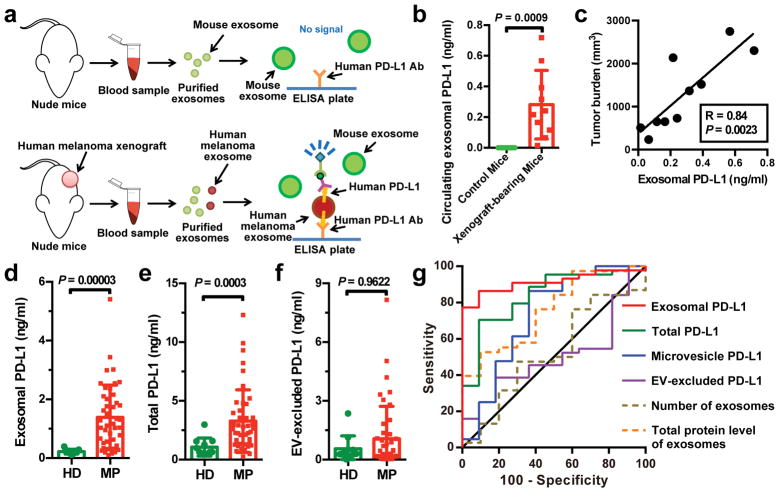
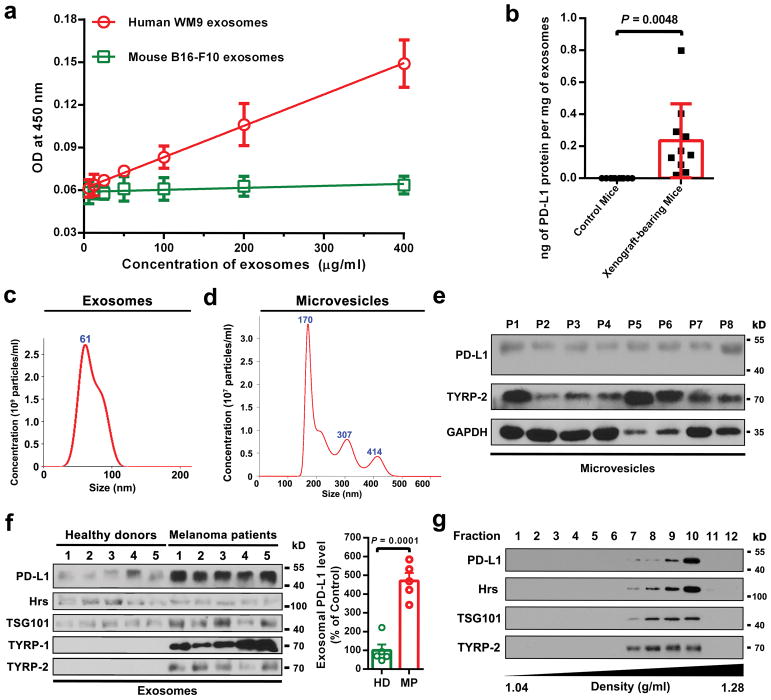
To test the secretion of exosomal PD-L1 by melanoma cells in vivo, we established human melanoma xenografts in nude mice. Blood from mice was collected for exosome purification and subsequent detection of human PD-L1 proteins by ELISA (Fig. 2a). Antibodies against human PD-L1 specifically identified human PD-L1 on the circulating exosomes from mice bearing human melanoma xenografts but not the control mice (Fig. 2b, Extended Data Fig. 2a, b). Moreover, the level of circulating exosomal PD-L1 positively correlated with tumor size (Fig. 2c).
Figure 2. The level of PD-L1 on circulating exosomes distinguishes patients with metastatic melanoma from healthy donors.
a, Diagram of ELISA of human exosomal PD-L1 in the plasma samples derived from mice harboring human melanoma xenograft. b, Levels of PD-L1 on exosomes isolated from the plasma samples of control or human WM9 melanoma xenograft-bearing nude mice as measured by ELISA (n = 10). c, Pearson correlation between the plasma level of exosomal PD-L1 and tumor burden in xenograft-bearing nude mice (n = 10). d–f, ELISA of the circulating level of exosomal PD-L1 (d), total PD-L1 (e), or EV-excluded PD-L1 (f) in healthy donors (“HD”, n = 11) and melanoma patients (“MP”, n = 44). g, ROC curve analysis for the indicated parameters in patients with metastatic melanoma compared to healthy donors. Data represent mean ± s.d. Statistical analyses were performed using two-sided unpaired t-test (b, d–f).
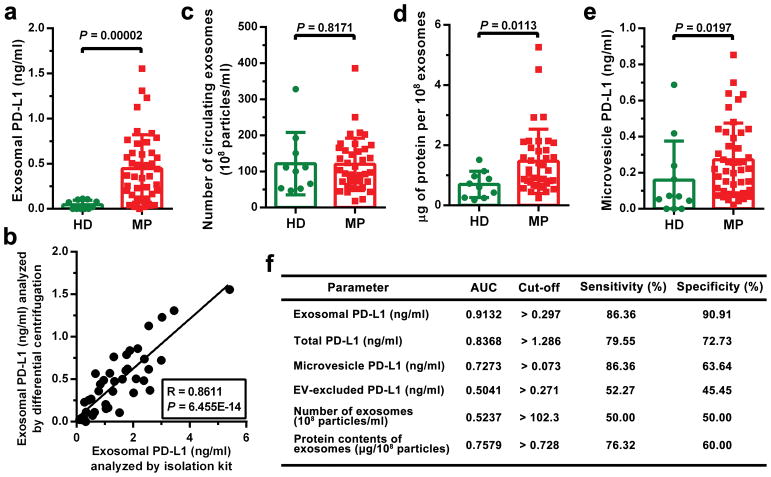
PD-L1 has been found in blood samples derived from melanoma patients17. Recent studies suggest the presence of PD-L1 in the EVs isolated from the blood samples of cancer patients, and the level of PD-L1 correlates with pathoclinical features of the patients17–20. We purified EVs from the plasma of melanoma patients (Extended Data Fig. 2c–g). The level of PD-L1 on the circulating exosomes was significantly higher in patients with metastatic melanoma than that in healthy donors (Fig. 2d, Extended Data Fig. 2f, 3a, 3b), while there was no or only marginal difference in the number of circulating exosomes or the total protein levels on these exosomes (Extended Data Fig. 3c, d). The difference of PD-L1 in circulating microvesicles was less significant compared to the circulating exosomes (Extended Data Fig. 3e). The receiver operating characteristic (ROC) curve shows that, among all the parameters tested, the level of circulating exosomal PD-L1 best distinguished melanoma patients from healthy donors (Fig. 2d–g, Extended Data Fig. 3e, f).
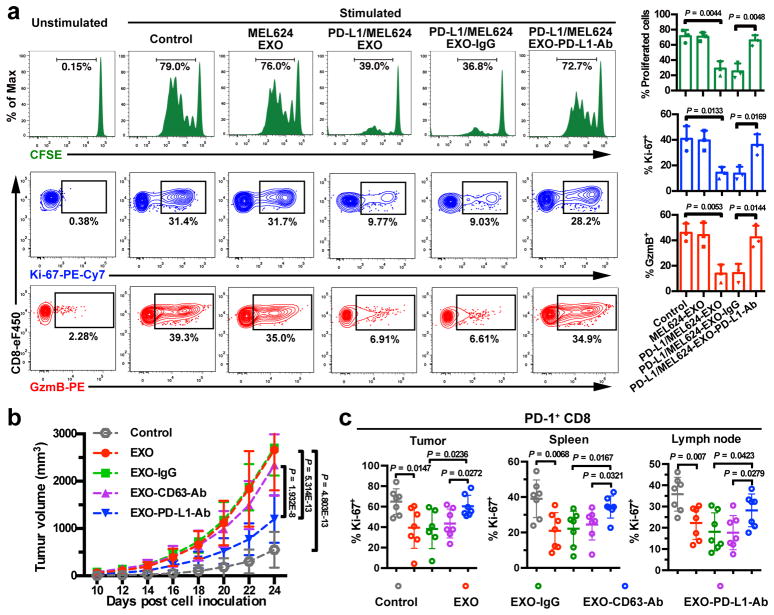
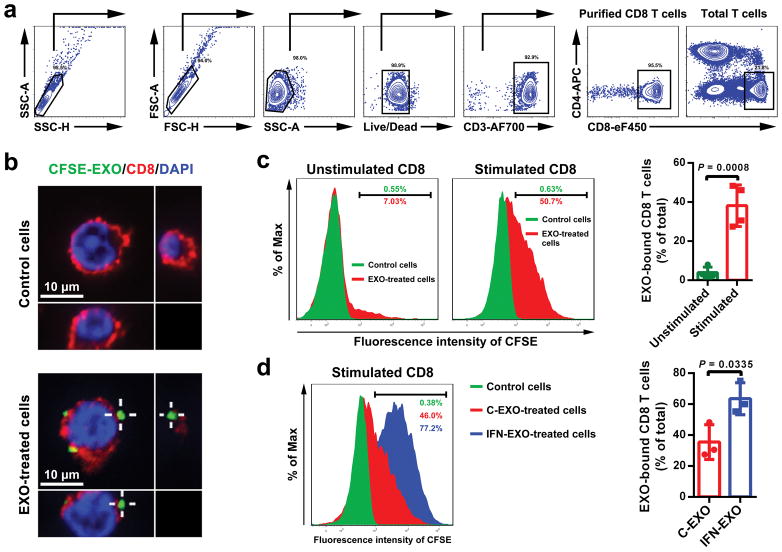
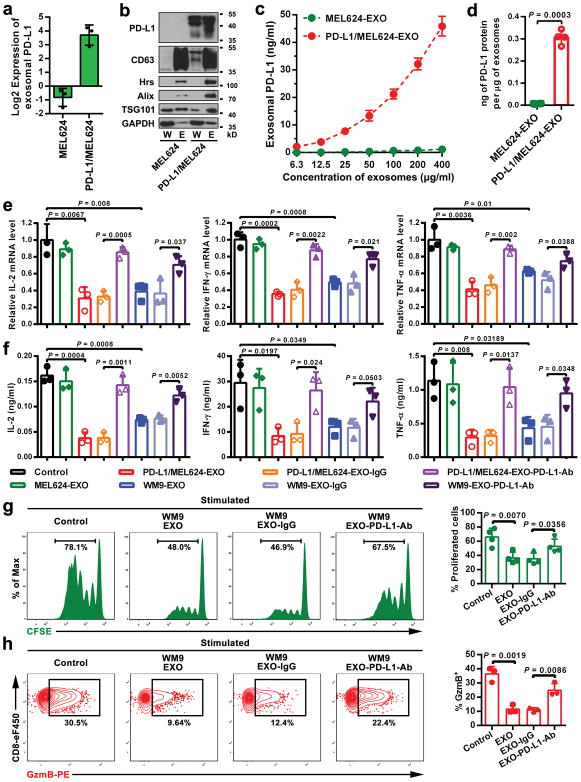
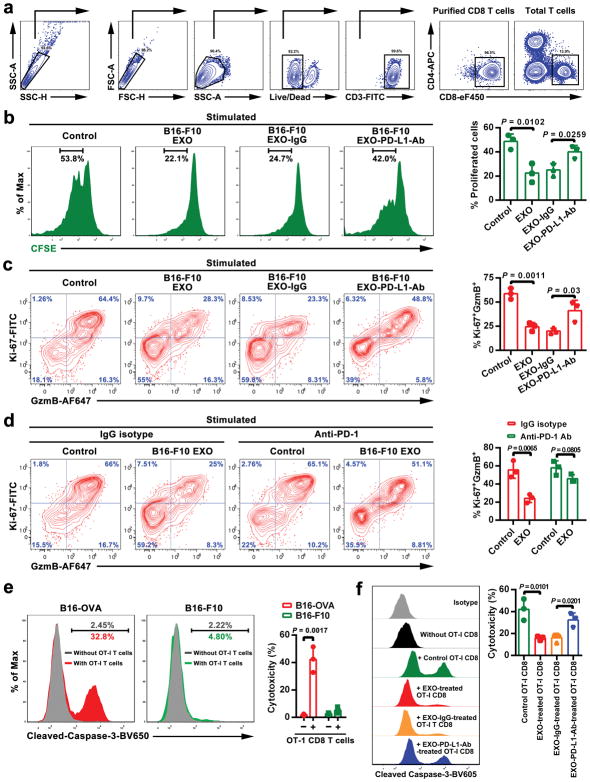
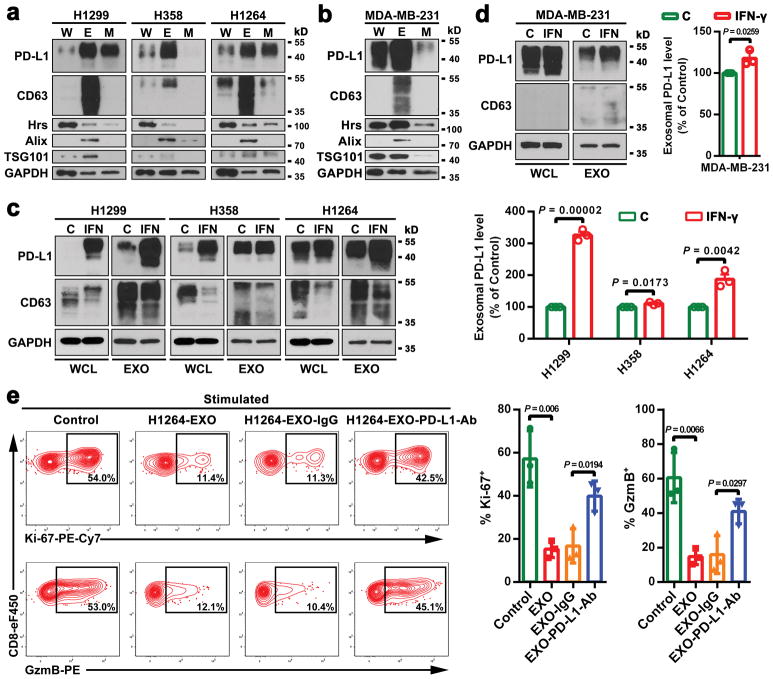
The current model for PD-L1-mediated immunosuppression is based on the interaction between PD-L1 on tumor cell surface and PD-1 on CD8 T cells. Here we tested whether exosomal PD-L1 inhibits CD8 T cells. First, confocal microscopy showed the physical interaction between tumor exosomes and CD8 T cells purified from human peripheral blood (Extended Data Fig. 4a, b). Flow cytometry analyses further indicated that the level of interaction was significantly higher for activated CD8 T cells than for non-activated counterparts (Extended Data Fig. 4c). Moreover, exosomes derived from melanoma cells treated with IFN-γ exhibited a higher level of binding to CD8 T cells (Extended Data Fig. 4d). Next, we tested the effect of exosomal PD-L1 on CD8 T cells taking advantage of the MEL624 cells, which does not express endogenous PD-L1 (Extended Data Fig. 5a–d) and other immunosuppressive proteins such as FasL and TRAIL1. Exosomes derived from MEL624 cells expressing exogenous PD-L1 (“PD-L1/MEL624”) significantly inhibited the proliferation, cytokine production and cytotoxicity of CD8 T cells, as demonstrated by the decreased proportion of cells with diluted CFSE dye, reduced expression of Ki-67 and granzyme B (GzmB), and the inhibited production of IFN-γ, IL-2, and TNF-α (Fig. 3a, Extended Data Fig. 5e, f). Pre-treatment of the exosomes with the anti-PD-L1 antibodies nearly abolished these effects. Similar observation was made using exosomes secreted from WM9 cells that express endogenous PD-L1 (Extended Data Fig. 5e–h). The exosomes derived from mouse melanoma B16-F10 cells also inhibited the proliferation and cytotoxicity of mouse splenic CD8 T cells (Extended Data Fig. 6a–d). Pre-treating OT-I T cells (specific for OVA peptide) (Extended Data Fig. 6e) with B16-F10 cell-derived exosomes significantly inhibited their ability to kill the target cells (Extended Data Fig. 6f). In addition to melanoma, EVs from human lung and breast cancer cells also carry immunosuppressive PD-L1, mostly in the form of exosomes, and its level is up-regulated by IFN-γ in some of the cell lines (Extended Data Fig. 7a–e).
Figure 3. Exosomal PD-L1 inhibits CD8 T cells and facilitates the progression of melanoma in vitro and in vivo.
a, Representative histogram of CFSE-labeled human peripheral CD8 T cells (left top), representative contour plots of human peripheral CD8 T cells examined for the expression of Ki-67 (left middle) and Granzyme B (GzmB) (left bottom) after indicated treatments. The proportions of cells with diluted CFSE dye, or positive Ki-67 or GzmB expression are shown at the right panel (n = 3 independent biological experiments). b, Growth curve of B16-F10 PD-L1 knockdown tumors with indicated treatments (n = 7 mice per group). c, The proportions of Ki-67+PD-1+ CD8 TILs or splenic or lymph node CD8 T cells after indicated treatments (n = 6 for tumor samples of the “EXO-IgG” group, and n = 7 for all the other groups). See Extended Data Fig. 8d for representative contour plots. Data represent mean ± s.d. (a–c). Statistical analyses were performed using two-sided unpaired t-test (a, c) or two-way ANOVA (b).
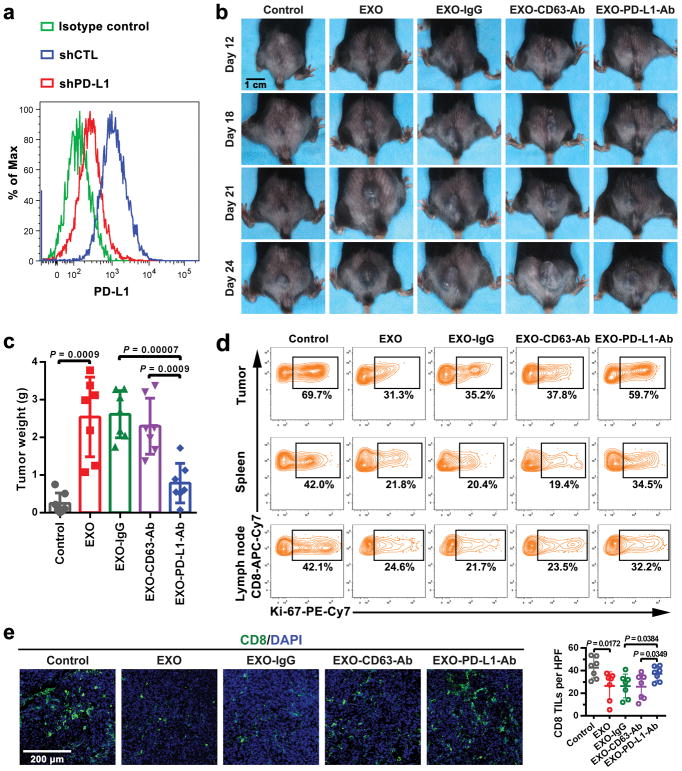
To examine the effects of exosomal PD-L1 in vivo, a syngeneic mouse melanoma model was established in C57BL/6 mice using PD-L1 knockdown B16-F10 cells (“PD-L1-KD B16-F10”) (Extended Data Fig. 8a). Injection of exosomes derived from parental B16-F10 cells significantly promoted the growth of PD-L1-KD B16-F10 tumors, whereas pre-treatment of the exosomes with anti-PD-L1 antibodies, but not IgG isotype or CD63-blocking antibodies, inhibited the effect (Fig. 3b, Extended Data Fig. 8b, c). The number of tumor-infiltrating CD8 T lymphocytes (TILs) decreased significantly after the injection of exosomes (Fig. 3c, Extended Data Fig. 8d, e). B16-F10 exosomes also decreased the proportion of proliferating PD-1+ CD8 T cells in both spleen and lymph nodes (Fig. 3c, Extended Data Fig. 8d), suggesting that exosomal PD-L1 suppresses anti-tumor immunity systemically.
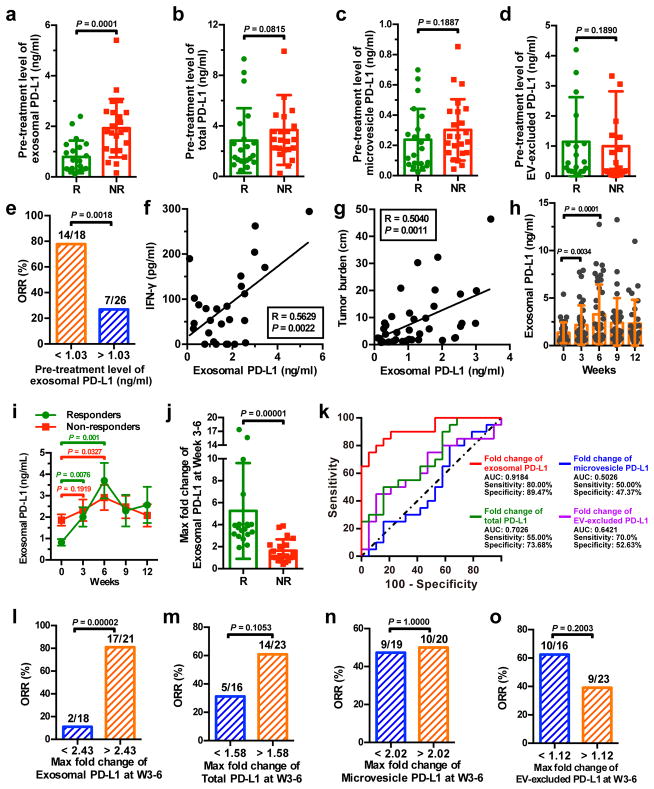
We then examined the level of PD-L1 on circulating EVs in melanoma patients under anti-PD-1 therapy. The pre-treatment level of circulating exosomal PD-L1 was significantly higher in patients who failed to respond to the anti-PD-1 treatment with pembrolizumab (Fig. 4a). The difference was, however, less significant for total circulating PD-L1, PD-L1 on circulating microvesicles, or EV-excluded PD-L1 (Fig. 4b–d). A higher level of circulating exosomal PD-L1 prior to the treatment was associated with poorer clinical outcome (Fig. 4e). IFN-γ up-regulates exosomal PD-L1 and the pre-treatment levels of IFN-γ were significantly higher in patients who did not respond to pembrolizumab21. The level of circulating exosomal PD-L1 positively correlated with the level of circulating IFN-γ and overall tumor burden (Fig. 4f, g), which was shown to be indicative of poor prognosis21.
Figure 4. The level of circulating exosomal PD-L1 stratifies clinical responders from non-responders to pembrolizumab.
a-d, Comparison of the pre-treatment levels of circulating exosomal PD-L1 (a), total PD-L1 (b), microvesicle PD-L1 (c), or EV-excluded PD-L1 (d) between melanoma patients with or without clinical response to pembrolizumab (“R”: responders, n = 21; “NR”: non-responders, n = 23). e, Objective response rate (“ORR”) for patients with high and low pre-treatment levels of circulating exosomal PD-L1. f, g, Pearson correlation of the IFN-γ level (f, n = 27) or overall tumor burden (g, n = 39) to the exosomal PD-L1 level in the plasma of melanoma patients. h, The levels of circulating exosomal PD-L1 at serial time points pre- and on-treatment (n = 39). i, The levels of circulating exosomal PD-L1 in clinical responders (n = 19) and non-responders (n = 20) at serial time points pre- and on-treatment. j, Comparison of the maximum fold change of circulating exosomal PD-L1 at Week 3–6 between the clinical responders and non-responders. k, ROC curve analysis for the max fold change of circulating exosomal PD-L1 at Week 3–6 in clinical responders compared to non-responders. l-o, Objective response rate for patients with high and low fold changes of circulating exosomal PD-L1 (l), total PD-L1 (m), microvesicle PD-L1 (n), or EV-excluded PD-L1 (o). Data represent mean ± s.d. *P < 0.05, Statistical analyses were performed using two-sided unpaired t-test (a–d, j), two-sided paired t-test (h, i), or two-sided Fisher’s exact test (e, l–o).
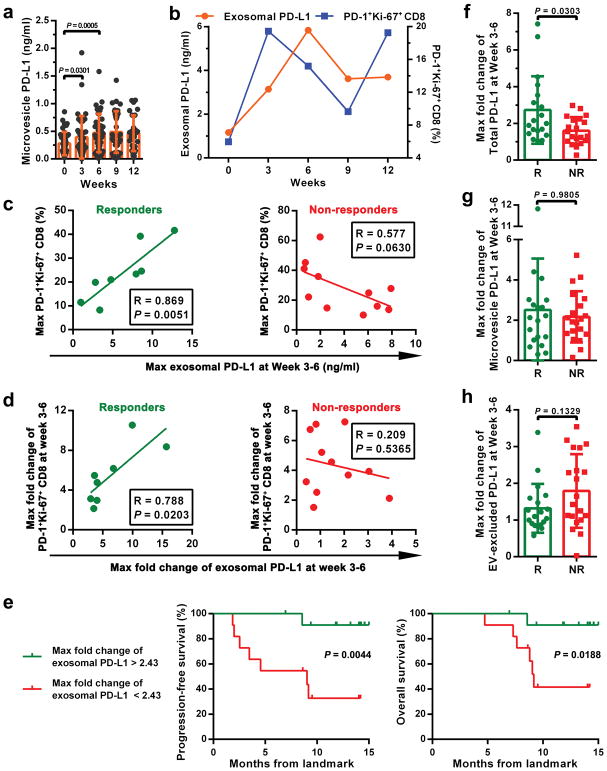
Next, we examined PD-L1 on circulating EVs in patients on pembrolizumab therapy. For the clinical responders, the level of PD-L1 on circulating exosomes increased significantly, mostly within 6 weeks on therapy (Fig. 4h, i). The level of PD-L1 on microvesicles also increased in the same cohort of patients, but to a less extent (Extended Data Fig. 9a). CD8 T cell proliferation and re-invigoration peaked at Week 3 and preceded the peaking of exosomal PD-L1 at Week 6 (Extended Data Fig. 9b). Moreover, for the responders, both the absolute value and maximal fold change of Ki-67 in PD-1+ CD8 T cells 3–6 weeks on-treatment positively correlated with those of circulating exosomal PD-L1 (Extended Data Fig. 9c, d). The responders had a greater increase in the level of circulating exosomal PD-L1 as early as 3–6 weeks following the initial treatment (Fig. 4j). ROC analysis determined that a fold change of 2.43 in exosomal PD-L1 at Week 3–6 stratified patients by clinical response to pembrolizumab (Fig. 4k). A fold change in circulating exosomal PD-L1 greater than 2.43 at Week 3–6 was associated with a better response to the anti-PD-1 therapy by objective response rate (ORR), progression-free and overall survival (Fig. 4l, Extended Data Fig. 9e). The magnitude of fold increase for total circulating PD-L1, microvesicle PD-L1, and EV-excluded PD-L1 was inferior to exosomal PD-L1 in distinguishing responders from non-responders (Fig. 4k, m, n, o, Extended Data Fig. 9f–h).
Our studies suggest that melanoma cells release PD-L1-positive EVs into the tumor microenvironment and circulation to battle the anti-tumor immunity systemically. Since exosomal PD-L1-mediated T cell inhibition can be blocked by both anti-PD-L1 and PD-1 antibodies, our study also raises the possibility that disrupting the interaction between the exosomal PD-L1 and T cell PD-1 is a previously unrecognized mechanism in the PD-L1/PD-1 blockade-based therapies. The level of PD-L1 on EVs is up-regulated by IFN-γ, and EV PD-L1 primarily targets PD-1+ CD8 T cells, which represent the antigen experienced T cells that secrete IFN-γ. The level of exosomal PD-L1 may thus reflect the dynamic interplay between the tumor and immune cells. Besides PD-L1, other EV proteins such as FasL may also contribute to the immunosuppressive effects19,22–24. However, PD-L1 will enable the exosomes to predominantly target the PD-1+ CD8 T cells, allowing tumor cells to counteract the immune pressure at their effector stage. Besides the exosomal PD-L1-PD-1 interaction, the involvement of other molecules including B7/CD2825,26 in this process also warrant investigation.
Our study suggests that the circulating exosomal PD-L1 before and on pembrolizumab treatment may reflect distinct states of anti-tumor immunity. The pre-treatment level may correlate with a role of exosomal PD-L1 in immune dysfunction. High levels of exosomal PD-L1 may reflect the “exhaustion” of patient T cells to a breaking point, by which the T cells can no longer be re-invigorated by the anti-PD-1 treatment. For the on-treatment patients, however, an increase in the level of exosomal PD-L1, following and correlating positively with the T cell re-invigoration, would reflect the presence of a successful anti-tumor immunity elicited by the anti-PD-1 therapy. Although the elevation of exosomal PD-L1 in response to IFN-γ could enable the tumor cells to adaptively inactivate CD8 T cells, it is futile because the PD-L1/PD-1 interaction is blocked by pembrolizumab. For non-responders, no marked increase in exosomal PD-L1 could be observed. This could be due to the failure in eliciting an adequate T cell response, or a resistance mechanism to IFN-γ from tumors. Tumor cells in non-responders may have adaptively down-regulated their response to IFN-γ to avoid the detrimental increase in antigen presentation and to escape the anti-proliferative effects induced by IFN-γ5,27.
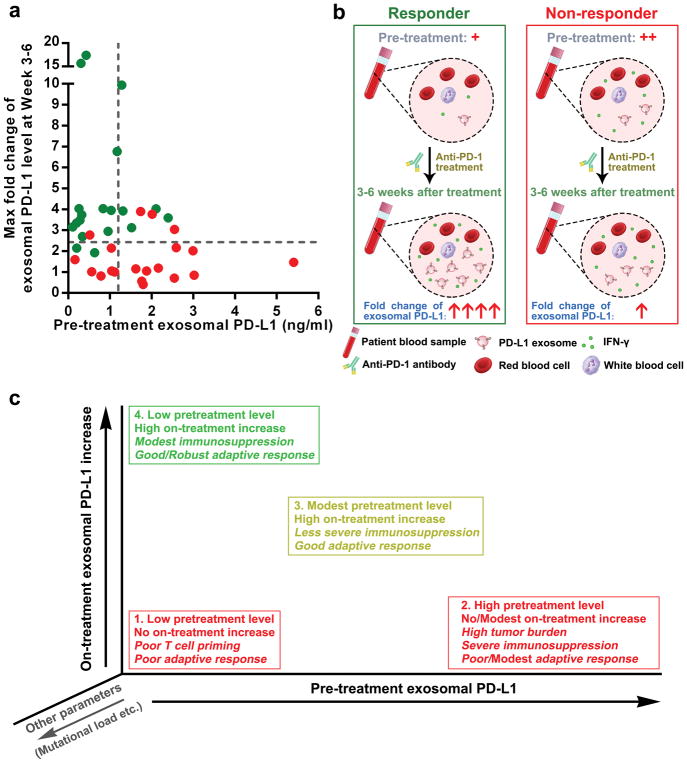
Our study offers a rationale for developing circulating exosomal PD-L1 as a predictor for the clinical outcomes of anti-PD-1 therapy, and sheds light on the possible causes for the failure of anti-PD-1 therapies experienced by many patients (Extended Data Fig. 10). Tumor PD-L1 has been used as a predictive biomarker for clinical responses to anti-PD-1 therapy28–30. Considering the heterogeneity and dynamic nature of PD-L1 expression in tumors, developing exosomal PD-L1 as a blood-based biomarker could be attractive.
METHODS
Cell culture
Human melanoma cell lines MEL624, PD-L1/MEL624, WM1552C, WM35, WM902B, WM793, UACC-903, WM9, A375, and WM164 were cultured in RPMI 1640 medium (Invitrogen) supplemented with 10% (v/v) fetal bovine serum (FBS) (Invitrogen). B16-F10 and B16-OVA cells were cultured in DMEM (Sigma) supplemented with 10% (v/v) FBS. For stimulation with IFN-γ, cells were incubated with 100 ng/ml of recombinant human or mouse IFN-γ (Peprotech) for 48 hr.
Generation of stable Hrs, Rab27a, or PD-L1 knockdown melanoma cells
Short hairpin RNAs (shRNAs) against human HRS (HGS) (NM_004712, GCACGTCTTTCCAGAATTCAA, GCATGAAGAGTAACCACAGC), human RAB27A (NM_004850, GCTGCCAATGGGACAAACATA, CAGGAGAGGTTTCGTAGCTA) (kind gift from Dr. Alissa Weaver, Vanderbilt University), murine PD-L1 (Cd274) (NM_021893, GCGTTGAAGATACAAGCTCAA) or scrambled shRNA-control (Addgene) were packaged into lentiviral particles using 293T cells co-transfected with the viral packaging plasmids. Lentiviral supernatants were harvested 48–72 hr after transfection. Cells were infected with filtered lentivirus and selected by 2 μg/ml puromycin.
Patients and specimen collection
Patients with Stage III to IV melanoma (Supplementary Table 1) were enrolled for treatment with pembrolizumab (2 mg/kg by infusion every 3 weeks) under an Expanded Access Program at Penn (http://clinicaltrials.gov identifier NCT02083484) or with commercial Keytruda. Patients were consented in writing for blood collection under the University of Pennsylvania Abramson Cancer Center’s melanoma research program tissue collection protocol UPCC 08607 in accordance with the ethics committee and The Institutional Review Board of the University of Pennsylvania. Peripheral blood was obtained in sodium heparin tubes before each pembrolizumab infusion every 3 weeks for 12 weeks. Clinical response was determined as best response based on immune related RECIST (irRECIST) using unidimensional measurements31. Blood samples from healthy donors were collected at The Wistar Institute after approval by the ethics committee and Institutional Review Board of The Wistar Institute. The written consent was obtained from each healthy donor before blood collection. All the experiments involving blood samples from healthy donors were performed in accordance with relevant ethical regulations.
Flow cytometry of patients’ PBMCs and in vitro cultured tumor cells
Peripheral blood mononuclear cells (PBMCs) were isolated using ficoll gradient and stored using standard protocols. Cryopreserved PBMC samples from pretreatment, cycles 1–4 (weeks 3–12) were thawed and analyzed by flow cytometry as we previously described21. Briefly, live/dead cell discrimination was performed using Live/Dead Fixable Aqua Dead Cell Stain Kit (Life Technologies). Cell surface staining was performed for 30 min at 4 °C. Intracellular staining for 60 min on ice was performed after using a fixation/permeabilization kit (eBioscience).
Purification of the extracellular vesicles
For exosome purification from cell culture supernatants, cells were cultured in media supplemented with 10% exosome-depleted FBS. Bovine exosomes were depleted by overnight centrifugation at 100,000 g. Supernatants were collected from 48–72 hr cell cultures and extracellular vesicles were purified by a standard differential centrifugation protocol9–11. Briefly, culture supernatants were centrifuged at 2,000 g for 20 min to remove cell debris and dead cells (Beckman Coulter, Allegra X-14R). Microvesicles were pelleted after centrifugation at 16,500 g for 45 min (Beckman Coulter, J2-HS), and resuspended in PBS. Then supernatants were ultracentifugated at 100,000 g for 2 hr at 4 ºC (Beckman Coulter, Optima XPN-100). The pelleted exosomes were suspended in PBS and collected by ultracentrifugation at 100,000 g for 2 hr.
For purification of circulating extracellular vesicles by differential centrifugation, venous citrated blood from melanoma patients or healthy donors was centrifuged at 1,550 g for 30 min to obtain cell-free plasma (Beckman Coulter, Allegra X-14R). Then 1 ml of the obtained plasma was centrifuged at 16,500 g for 45 min (Eppendorf, 5418R). The pelleted microvesicles were suspended in PBS. Then the collected supernatants were centrifuged at 100,000 g for 2 hr at 4 ºC (Beckman Coulter, Optima™ MAX-XP) to pellet the exosomes. For purification of circulating exosomes using the exosome isolation kit, cell-free plasma was first centrifuged at 16,500 g for 45 min (Eppendorf, 5418R) to pellet large membrane vesicles. Exosomes were then purified from the supernatants using the exosome isolation kit (Invitrogen, Cat# 4484450).
Characterization of the purified exosomes
For characterization with flow cytometry, purified exosomes (25 μg) were incubated with 20 μl CD63-coated magnetic beads (Invitrogen, Cat# 10606D) in 100 μl PBS with 0.1% bovine serum albumin (BSA) overnight at 4 °C with mixing. Exosomes-coated beads were then washed, and incubated with fluorophore-labeled antibodies, followed by analysis on a LSR II flow cytometer (BD Biosciences).
For verification of purified exosomes using electron microscopy, purified exosomes suspended in PBS were dropped on formvar carbon coated nickel grids. After staining with 2% uranyl acetate, grids were air-dried and visualized using a JEM-1011 transmission electron microscope. For immunogold labeling, purified exosomes suspended in PBS were placed on formvar carbon coated nickel grids, blocked, and incubated with the mouse anti-human monoclonal antibody that recognizes the extracellular domain of PD-L1 (clone 5H1-A3)1, followed by incubation with the anti-mouse secondary antibody conjugated with protein A-gold particles (5 nm). Each staining step was followed by five PBS washes and ten ddH2O washes before contrast staining with 2% uranyl acetate.
The size and concentration of exosomes, purified from cell culture supernatants or patients’ plasma were determined using NanoSight NS300 (Malvern Instruments), which is equipped with fast video capture and particle-tracking software.
For iodixanol density-gradient centrifugation, exosomes harvested by differential centrifugation was loaded on top of a discontinuous iodixanol gradient (5%, 10%, 20% and 40% made by diluting 60% OptiPrepTM aqueous iodixanol with 0.25M sucrose in 10mM Tris) and centrifuged at 100,000 g for 18 hr at 4 °C (Beckman Coulter, Optima™ MAX-XP). Twelve fractions with equal volumes were collected from the top of the gradients, with the exosomes distributed at the density range between 1.13 to 1.19 g/ml, as previously demonstrated8,9,11. The exosomes were further pelleted by ultracentrifugation at 100,000 g for 2 hr at 4 °C.
Immunoprecipitation
To analyze the role of ESCRT machinery in exosomal secretion of PD-L1 in melanoma cells, PD-L1/MEL624 cells were transfected with FLAG-HRS plasmid or vector and then lysed. The cleared lysate was incubated with Anti-FLAG™ Affinity Gel (Sigma-Aldrich) overnight at 4 °C. The immunoprecipitated proteins were resolved by SDS-polyacrylamide gel electrophoresis and transferred to nitrocellulose membranes. PD-L1 and Flag (Hrs) were determined by western blot using specific antibodies.
ELISA
For detection of PD-L1 on EVs or in cell supernatant and patients’ plasma, ELISA plates (96-well) (Biolegend) were coated with 0.25 μg per well (100 μl) of monoclonal antibody against PD-L1 (clone 5H1-A3) overnight at 4 °C. Free binding sites were blocked with 200 μl of blocking buffer (Pierce) for 1 hr at room temperature. Then 100 μl of plasma samples with or without EV removal, or EV samples purified from plasma or cell culture supernatants, were added to each well. The exosome or microvesicle samples purified from cell culture supernatants were prepared by serial dilution in respect of the total protein level to analyze the enrichment of PD-L1 on exosomes and microvesicles. The exosome or microvesicle samples derived from the plasma samples of healthy donors or melanoma patients were prepared using the same volume of PBS as the plasma as they were originally derived from. The plasma samples with (EV-excluded) or without (total) EV removal were diluted with PBS in a 1:0.75 volume ratio. After overnight incubation at 4°C, biotinylated monoclonal PD-L1 antibody (clone MIH1, eBioscience) was added to each well and incubated for 1 hr at room temperature. A total of 100 μl per well of horseradish peroxidase-conjugated streptavidin (BD Biosciences) diluted in PBS containing 0.1% BSA was then added and incubated for 1 hr at room temperature. Plates were developed with tetramethylbenzidine (Pierce) and stopped with 0.5N H2SO4. The plates were read at 450 nm with a BioTek plate reader. Recombinant human PD-L1 protein (R&D Systems, Cat# 156-B7) was used to make the standard curve. Recombinant P-selectin protein (R&D Systems, Cat# 137-PS) was used as the negative control to verify the detection specificity. The result of standard curve demonstrated that the established ELISA exhibited a reliable linear detection range from 0.2 to 12 ng/ml.
For detection of IFN-γ, TNF-α and IL-2, the supernatant of human CD8 T cells were harvested and measured according to the instruction manuals (Biolegend).
PD-1-PD-L1 binding assay
To test the binding of exosomal PD-L1 to PD-1, 100 μl of exosome samples of different concentrations were captured onto PD-L1 antibody (clone 5H1-A3)-coated 96-well ELISA plates by overnight incubation at 4°C. Then 100 μl of 4 μg/ml biotin-labeled human PD-1 protein (BPS Bioscience, Cat# 71109) was added and incubated for 2 hr at room temperature. A total of 100 μl per well of horseradish peroxidase-conjugated streptavidin (BD Biosciences) diluted in PBS containing 0.1% BSA was then added and incubated for 1 hr at room temperature. Plates were developed with tetramethylbenzidine (Pierce) and stopped using 0.5N H2SO4. The plates were read at 450 nm with a BioTek plate reader. Recombinant human PD-L1 protein directly coated onto the plates was used as the positive control. Biotin-labeled mouse CD8 protein instead of biotin-labeled human PD-1 protein was used as the negative control.
Treatment of CD8 T cells with the exosomes
To block PD-L1 on exosome surface, the purified exosomes (200 μg) were incubated with PD-L1 blocking antibodies (10 μg/ml) or IgG isotype antibodies (10 μg/ml) in 100 μl PBS, and then washed with 30 ml PBS and pelleted by ultracentrifugation to remove the non-bound free antibodies. Human CD8 T cells purified from peripheral blood using immunodepletion on a Ficoll-Hypaque gradient (RosetteSep™; StemSep Technologies) or mouse CD8 T cells purified from splenocytes using Dynabeads™ Untouched™ Mouse CD8 Cells Kit (Invitrogen) were stimulated with anti-CD3 (2 μg/ml) and anti-CD28 (2 μg/ml) antibodies for 24 hr and then incubated with human melanoma cell-derived exosomes or mouse B16-F10 cell-derived exosomes with or without PD-L1 blocking for 48 hr in the presence of anti-CD3/CD28 antibodies. For human CD8 T cells (2×10⁵ cells/well in a 96-well plate), 25 μg/ml of human WM9 cell-derived exosomes (carrying surface PD-L1 at a level of 0.05 ng per μg of exosomes as determined by ELISA, Fig. 1i) were used as the circulating exosomal PD-L1 level in melanoma patients is around 1.25 ng/ml (Fig. 2h). For mice CD8 T cells (2×10⁵ cells/well in a 96-well plate), 100 μg/ml of mouse B16-F10 cell-derived exosomes (carrying surface PD-L1 at a level of 0.016 ng per μg of exosomes as determined by ELISA) were used as the circulating exosomal PD-L1 level in mice bearing B16-F10 tumors is around 1.63 ng/ml. The treated cells were then collected, stained, and analyzed by flow cytometry. Information about the primary antibodies was included in Supplementary Table 2. To assay for the proliferation of CD8 T cells, CFSE, a dye for the tracking of cell division (Molecular Probes) was used. A total of 1×10⁶ CD8 T cells were stained with CFSE at 5 μM. The cells were then incubated at 37 °C for 20 min and the reaction was stopped by adding 5 volumes of cold medium with 10% FBS, and treated as above. Unstimulated CFSE-labeled cells served as a nondividing control.
The exosome-T cell binding assay
To verify the physical interactions between melanoma cell-derived exosomes and CD8 T cells, the purified exosomes were stained with CFSE in 100 μl PBS, and then washed with 10 ml PBS and pelleted by ultracentrifugation. Unstimulated or stimulated human CD8 T cells (2×10⁵ cells/well in 96-well plates) were treated with CFSE-labeled exosomes (25 μg/ml) for 2 hr, and then fixed for flow cytometry or confocal microscopy after immunostaining for CD8 T cells.
Generation of dendritic cells from bone marrow
Dendritic cells (DCs) were generated from bone marrow of C57BL/6 mice cultured in RPMI 1640 with 10% (v/v) FBS, 20 mM L-glutamin, 50 μM β-Mercapoethanol, 20 ng/mL IL-4 and 20 ng/mL GM-CSF. After 3 days, half of the culture medium was replaced by fresh medium containing 40 ng/ml IL-4 and 40 ng/ml GM-CSF. To prime antigen-specific OT-I CD8 T cells, DCs were subsequently loaded with 2 μg/mL SIINFEKL (OVA257–264) peptide overnight.
CD8 T cell-mediated tumor cell killing assay
To determine the effects of melanoma cell-derived exosomes on the ability of CD8 T cells to kill tumor cells, CD8 T cells were purified from the splenocytes of OT-I mice expressing a transgene encoding a TCR that specifically recognized SIINFEKL peptide bound to MHC-I H-2kb32. OT-I CD8 T cells (4×10⁵ cells/well in a 48-well plate) were then activated by incubation with SIINFEK-loaded (2 μg/ml) bone marrow-derived DCs (2×10⁵ cells/well). The activated OT-I CD8 T cells (4×10⁵ cells/well in 48-well plate) were treated with PBS (as a control) or B16-F10-derived exosomes (100 μg/ml for 48 h) with or without IgG isotype or PD-L1 antibody blocking (10 μg/ml), and then co-cultured with CFSE-labeled melanoma PD-L1-KD B16/OVA cells (4×10⁵) in 6-well plates for 48 hr at an effector to target (E:T) ratio of 1:1. Cells were then harvested, intracellularly stained with BV650- conjugated antibody against cleaved-Caspase-3 (BD Biosciences), and analyzed by flow cytometry. Information about the primary antibodies was included in Supplementary Table 2.
Immunofluorescence staining
Immunofluorescence staining was performed on fixed cells or formalin-fixed, paraffin-embedded (FFPE) sections. For fixed cells, permeabilization with 0.1% Triton X-100 was performed before blocking with bovine serum albumin (BSA) buffer for 1 hr. For FFPE sections, antigen retrieval by steaming in citrate buffer (pH=6.0) was performed before blocking. The fixed cells or FFPE sections were incubated with primary antibodies overnight at 4 ºC, followed by incubation with fluorophore-conjugated secondary antibodies for 1 hr. Nuclei were stained with DAPI. Samples were observed using a Nikon confocal microscope at 100 × magnification.
Western blot analysis
Whole cell lysates or exosomal proteins were separated using 12% SDS- polyacrylamide gel electrophoresis and transferred onto nitrocellulose membranes. The blots were blocked with 5% non-fat dry milk at room temperature for 1 hr, and incubated overnight at 4 ºC with the corresponding primary antibodies at dilutions recommended by the suppliers, followed by incubation with HRP-conjugated secondary antibodies (Cell Signaling Technology) at room temperature for 1 hr. The blots on the membranes were developed with ECL detection reagents (Pierce). CD63, Hrs, Alix, and TSG101 were used as exosome markers. TYRP-1 and TYRP-2 were used as melanoma-specific markers. GAPDH was used as a loading control. Information about the primary antibodies was included in Supplementary Table 2.
Real-time quantitative PCR
Total RNA was isolated from CD8 T cells using TRIzol Reagent (Invitrogen), and reverse transcribed into first-strand complementary DNA (cDNA) with random primer with RevertAidTM First Strand cDNA Synthesis Kit (ThermoFisher Scientific). The samples were then analyzed in an Applied Biosystems™ QuantStudio™ 3 Real-Time PCR system. GAPDH was used as an internal control. Information about the primers was included in Supplementary Table 3.
In vivo mice study
All animal experiments were performed according to protocols approved by the Institutional Animal Care and Use Committee (IACUC) of the University of Pennsylvania. For establishing human melanoma xenograft model in nude mice, WM9 cells (5×10⁶ cells in 100 μl medium ) were injected into flanks of 8-week-old female athymic nude mice. Tumors were measured using a digital caliper and the tumor volume was calculated by the formula (width)2 × length/2. Mice were euthanized 30 days after cell inoculation or the longest dimension of the tumors reached 2.0 cm before 30 days. Immediately following euthanasia, blood samples were harvested by cardiac puncture, and exosomes were purified and detected by ELISA using aforementioned method. Exosomes purified from sex-, age- and weight-matched healthy nude mice without xenograft were used as the control.
For establishing syngeneic mouse melanoma model in C57BL/6 mice, B16-F10 cells or B16-F10 PD-L1-KD cells (5×10⁵ cells in 100 μl medium) were subcutaneously injected into immunocompetent C57BL/6 mice. Based on the difference in the level of circulating exosomal PD-L1 between mice bearing parental B16-F10 and PD-L1-KD B16-F10 tumors (1.63 ng/ml vs 0.70 ng/ml), a total of 100 μg of parental B16-F10 cell-derived exosomes (carrying surface PD-L1 at a level of 0.016 ng per μg of exosomes) with or without IgG isotype, CD63 or PD-L1 blocking (10 μg/ml) were injected into mice after inoculation of PD-L1-KD B16-F10 cells to examine the functional significance of PD-L1. The dose of 100 μg exosomes used for our in vivo study was equivalent to approximately 30% of the physiological level of circulating exosomes in mice, and was also comparable to those from a palpable tumor in mice according to our data. Tail vein injections of exosomes (100 μg in 100 μl PBS) were performed every 3 days. Mice were weighted every 3 days. Tumors were measured using a digital caliper and the tumor volume was calculated by the formula (width)2 × length/2. The mice were euthanized before the longest dimension of the tumors reached 2.0 cm. For flow cytometry, the spleen and tumor samples were harvested, and single cell suspensions were prepared and red blood cells were lysed using ACK Lysis Buffer. Information about the primary antibodies was included in Supplementary Table 2.
Reverse phase protein array (RPPA)
RPPA was performed at the MD Anderson Cancer Center core facility using 50 μg protein per sample. All of the antibodies were validated by western blotting12. Methods for data analysis is included below.
Statistical analyses
RPPA data analysis was performed according to the protocol from the M.D. Anderson Cancer Center. Specifically, relative protein levels for each sample were determined by interpolation of each dilution curves from the “standard curve” (supercurve) of the slide (antibody). Supercurve is constructed by a script in R written by the RPPA core facility. The package binaries of SuperCurve and SuperCurveGUI are available in R-Forge (https://r-forge.r-project.org/R/?group_id=1899). These values are defined as Supercurve Log2 value. All the data points were normalized for protein loading and transformed to linear value, designated as “Normalized Linear”. “Normalized Linear” value was transformed to Log2 value, and then median-centered for further analysis. Median-Centered values were centered by subtracting the median of all samples in a given protein. All of the above-mentioned procedures were performed by the RPPA core facility. The normalized data provided by the RPPA core facility were analyzed by Cluster 3.0 (http://bonsai.ims.u-tokyo.ac.jp/~mdehoon/software/cluster/) and visualized using the Java TreeView 1.0.5 (http://jtreeview.sourceforge.net/).
All other statistical analyses were performed using GraphPad Prism, version 6.0. Normality of distribution was determined by D’Agostino-Pearson omnibus normality test and variance between groups was assessed by the F-test. For normally distributed data, significance of mean differences was determined using two-tailed paired or unpaired Student’s t-tests; for groups that differed in variance, unpaired t-test with Welch’s correction was performed. For data that were not normally distributed, non-parametric Mann-Whitney U-tests or Wilcoxon matched-pairs test were used for unpaired and paired analysis, respectively. Correlations were determined by Pearson’s r coefficient. Two-way ANOVA was used to compare mouse tumor volume data among different groups. Log-rank and Wilcoxon tests were used to analyze the mouse survival data. Error bars shown in graphical data represent mean ± s.d. A two-tailed value of P < 0.05 was considered statistically significant.
REPORTING SUMMARY
Further information on experimental design is available in the Nature Research Reporting Summary linked to this paper.
DATA AVAILABILITY
All data and materials are available from the authors upon reasonable request by contacting W.G. (guowei@sas.upenn.edu) and X.Xu. (xug@pennmedicine.upenn.edu).
Extended Data
Extended Data Figure 1. Melanoma cells release EVs carrying PD-L1.
a, The Log2 transformed RPPA data showing a higher level of exosomal PD-L1 secreted by metastatic melanoma cell lines compared with primary melanoma cell lines. Data represent mean ± s.d. of four primary (WM1552C, WM35, WM793, WM902B) or metastatic (UACC-903, 1205Lu, WM9, WM164) melanoma lines. b, Density gradient centrifugation confirming that PD-L1 secreted by WM9 cells co-fractionated with exosome markers CD63, Hrs, Alix, and TSG101. c, Immunoblots for PD-L1 in the whole cell lysate (“W”), purified exosomes (“E”), or microvesicles (“M”) from different metastatic melanoma cell lines. The same protein amounts of whole cell lysates, exosome and microvesicle proteins were loaded. d, Levels of PD-L1 on the exosomes or microvesicles derived from melanoma cells as assayed by ELISA. e, The levels of exosomal PD-L1 and microvesicle PD-L1 produced by an equal number of melanoma cells. f, Immunoblots for PD-L1 in the whole cell lysate, purified exosomes or microvesicles from mouse melanoma B16-F10 cells. The same protein amounts of whole cell lysates, exosome and microvesicle proteins were loaded. g, h, Western blot analysis of PD-L1 in HRS knockdown cells without (g) or with (h) IFN-γ treatment. Quantification of the western blotting data (right panel). i, Co-immunoprecipitation of PD-L1 and Hrs from MEL624 cells expressing exogenous PD-L1 and Hrs. j, Immunofluorescence staining of intracellular PD-L1 and exosome marker Hrs in WM9 cells treated with IFN-γ. k, Immunofluorescence staining of intracellular PD-L1 and CD63 in WM9 cells treated with IFN-γ. l, Western blotting analysis showing intracellular accumulation of PD-L1, and decreased exosomal secretion of PD-L1 in WM9 cells with RAB27A knockdown (left). The levels of exosomal PD-L1 were compared (right). Two experiments were repeated independently with similar results (b, c, f, i–k). Data represent mean ± s.d. of four (d, e), or three (g, h, l) independent biological replicates. Statistical analysis is performed by two-sided unpaired t-test (a, d, e, g, h, l). For gel source data (b, c, f–i, l), see Supplementary Fig. 1.
Extended Data Figure 2. Melanoma cells secrete exosomal PD-L1 into the circulation.
a, The monoclonal antibodies against the extracellular domain of human PD-L1 specifically detect human exosomal PD-L1, but not mouse exosomal PD-L1 (n = 3 independent biological experiments) b, Levels of human PD-L1 (ng) in the exosomes from the plasma of control nude mice (n = 10) and human WM9 melanoma xenograft-bearing nude mice (n = 10) per μg of total circulating exosomal proteins. c, Characterization of circulating exosomes purified from the plasma of a patient with Stage IV melanoma using NanoSight nanoparticle tracking analysis. d, Characterization of circulating microvesicles purified from the plasma sample of a patient with Stage IV melanoma using NanoSight nanoparticle tracking analysis. e, Immunoblots for PD-L1 in the microvesicles purified from the plasma samples of 8 patients with Stage IV melanoma (denoted as “P1” to “P8”). f, Immunoblots for PD-L1 in the exosomes purified from the plasma samples of 5 healthy donors and 5 patients with Stage IV melanoma (left panel). Quantification of the levels of exosomal PD-L1 by western blot analysis (right panel). Results are expressed as the percentage of the mean value of healthy donors. g, Standard density gradient centrifugation analysis showing that circulating PD-L1 co-fractionated with exosome markers Hrs and TSG101 and melanoma-specific marker TYRP-2. Three (c, d) or two (e, g) experiments were repeated independently with similar results. Data represent mean ± s.d. (a, b, f). Statistical analyses were performed using two-sided unpaired t-test (b, f). For gel source data (e–g), see Supplementary Fig. 1.
Extended Data Figure 3. The number or bulk protein level of circulating exosomes shows no or modest difference between healthy donors and patients with metastatic melanoma.
a, ELISA showing the level of PD-L1 on circulating exosomes purified from healthy donors (“HD”, n = 11) and melanoma patients (“MP”, n = 44). The exosomes were purified using differential centrifugation. b, Pearson correlation between the ELISA-detected levels of PD-L1 on circulating exosomes purified by differential centrifugation or using the commercial exosome isolation kit (n = 44). c, Comparison of the number of circulating exosomes between healthy donors (n = 10) and melanoma patients (n = 38). d, Comparison of the protein content of circulating exosomes between healthy donors (n = 10) and melanoma patients (n = 38). e, ELISA of the circulating level of microvesicle PD-L1 in healthy donors (“HD”, n = 11) and melanoma patients (“MP”, n = 44). f, Detailed data associated with the ROC curve analysis depicted in Fig. 2g. Data represent mean ± s.d. Statistical analyses are performed by two-sided unpaired t-test (a, c–e).
Extended Data Figure 4. Melanoma cell-derived exosomes bind to CD8 T cells on their surface.
a, Representative contour plots showing the general gating strategy used to identify the purified CD8 T cells (CD3+CD8+CD4−) from human peripheral blood. b, Confocal microscopy analysis of human peripheral CD8 T cells (stimulated with anti-CD3/CD28 antibodies) after incubation with CFSE-labeled WM9 cell-derived exosomes for 2 hr. The experiments were repeated three times independently with similar results. c, Representative histogram of human peripheral CD8 T cells with or without anti-CD3/CD28 antibody stimulation after incubation with CFSE-labeled WM9 cell-derived exosomes for 2 hr (left panel). The proportion of exosome-bound cells is shown at the right panel. d, Representative histogram of human peripheral CD8 T cells (stimulated with anti-CD3/CD28 antibodies) after incubation with CFSE-labeled exosomes purified from control or IFN-γ-treated WM9 cells for 2 hr (left panel). The proportion of EXO-bound cells is shown at the right panel. Data represent mean ± s.d. of four (c) or three (d) independent biological replicates. Statistical analyses are performed using two-sided unpaired t-test (c, d).
Extended Data Figure 5. Functional inhibition of CD8 T cells by exosomal PD-L1.
a, The Log2 transformed RPPA data showing the levels of PD-L1 in the exosomes secreted by control (MEL624) or PD-L1-expressing (PD-L1/MEL624) human melanoma MEL624 cells (Bottom). b, Immunoblots for PD-L1 in the whole cell lysate (“W”) or in the purified exosomes (“E”) from MEL624 or PD-L1/MEL624 cells. The same amounts of whole cell lysates and exosomal proteins for each cell line were loaded. The experiments were repeated two times independently with similar results. For source data, see Supplementary Fig. 1. c, PD-L1 on the surface of exosomes secreted by MEL624 or PD-L1/MEL624 cells as determined by ELISA. d, Levels of PD-L1 on exosomes secreted by MEL624 or PD-L1/MEL624 cells, as measured by ELISA. e, Real-time PCR analyses of IL-2, IFN-γ, and TNF-α in human peripheral CD8 T cells (stimulated with anti-CD3/CD28 antibodies) after treatment with MEL624 cell-derived exosomes, PD-L1/MEL624 cell-derived exosomes or WM9-cell-derived exosomes with or without blocking by IgG isotype or the anti-PD-L1 antibodies. The relative mRNA expression level was calculated as the ratio to the control cells. f, ELISA of IL-2, IFN-γ, and TNF-α in human peripheral CD8 T cells (stimulated with anti-CD3/CD28 antibodies) after treatment with MEL624 cell-derived exosomes, PD-L1/MEL624 cell-derived exosomes or WM9-cell-derived exosomes with or without blocking by IgG isotype or PD-L1 antibodies. g, Representative histogram of CFSE-labeled human peripheral CD8 T cells (stimulated with anti-CD3/CD28 antibodies) after treatment with WM9 cell-derived exosomes with or without antibody blocking (left). The proportion of cells with diluted CFSE dye is shown at the right panel. h, Representative contour plots of human peripheral CD8 T cells (stimulated with anti-CD3/CD28 antibodies) examined for the expression of Granzyme B (GzmB) after treatment with WM9 cell-derived exosomes with or without antibody blocking (left). The percentage of GzmB+ CD8 T cells stimulated with anti-CD3/CD28 antibodies is shown at the right panel. Data represent mean ± s.d. of three (a, c, e, f, h) or four (d, g) independent biological replicates. Statistical analyses are performed using two-sided unpaired t-test (d–h).
Extended Data Figure 6. Exosomal PD-L1 secreted by mouse melanoma B16-F10 cells inhibits the proliferation and cytotoxicity of mouse splenic CD8 T cells.
a Representative contour plots showing the general gating strategy used to identify the purified CD8 T cells (CD3+CD8+CD4−) from mouse splenocytes. b, Representative histogram of CFSE-labeled mouse splenic CD8 T cells (stimulated with anti-CD3/CD28 antibodies) after treatment with B16-F10 cell-derived exosomes with or without blocking by IgG isotype or the anti-PD-L1 antibodies (left). The proportion of cells with diluted CFSE dye is shown at the right panel. c, Representative contour plots of mouse splenic CD8 T cells (stimulated with anti-CD3/CD28 antibodies) examined for the expression of Ki-67 and Granzyme B (GzmB) after treatment with B16-F10 cell-derived exosomes with or without blocking by IgG isotype or the anti-PD-L1 antibodies (left). The percentage of Ki-67+GzmB+ CD8 T cells stimulated with anti-CD3/CD28 antibodies is shown at the right panel. d, Representative contour plots of mouse splenic CD8 T cells (stimulated with anti-CD3/CD28 antibodies) examined for the expression of Ki-67 and GzmB after treatment with B16-F10 cell-derived exosomes in the presence or absence of anti-PD-1 blocking antibodies (left). The percentage of Ki-67+GzmB+ CD8 T cells stimulated with anti-CD3/CD28 antibodies is shown at the right panel. e, OT-I CD8 T cell-meditated tumor cell killing assay was performed in B16-OVA cells with PD-L1 knockdown, or B16-F10 cells with PD-L1 knockdown (negative control). Apoptosis of tumor cells was evaluated by flow cytometric analysis of intracellular cleaved caspase-3 (left), and the relative cytotoxicity was calculated (right). f, OT-I CD8 T cells, activated by OVA-pulsed bone marrow-derived dendritic cells and treated with PBS (as a control), exosomes derived from B16-F10 cells with or without IgG isotype or PD-L1 antibody blocking, were co-cultured with PD-L1 knockdown B16-OVA cells for 48 hr. Tumor cell apoptosis was evaluated by flow cytometric analysis of intracellular cleaved caspase-3 (left), and the relative cytotoxicity was calculated (right). Data represent mean ± s.d. of three (b–f) independent biological replicates. Statistical analyses are performed using two-sided unpaired t-test (b–f).
Extended Data Figure 7. Lung cancer and breast cancer cells release extracellular vesicles carrying PD-L1.
a, Immunoblots for PD-L1 in the whole cell lysate (“W”), purified exosomes (“E”), or microvesicles (“M”) from different lung cancer cell lines. The same amounts of proteins were loaded for each fraction. b, Immunoblots for PD-L1 in the whole cell lysate, purified exosomes, or microvesicles from the breast cancer cell line MDA-MB-231. The same amounts of proteins were loaded for each fraction. c, Immunoblots for PD-L1 in the whole cell lysate (“WCL”) or in the purified exosomes (“EXO”) from control (“C”) or IFN-γ-treated (“IFN”) lung cancer cells. The same amounts of exosome proteins from IFN-γ-treated and control cells were loaded (left panel). Quantification of the exosomal PD-L1 level determined by western blot analysis (right panel). d, Immunoblots for PD-L1 in the whole cell lysate or in the purified exosomes from control or IFN-γ-treated the breast cancer MDA-MB-231 cells. The same amounts of exosome proteins from IFN-γ-treated and control cells were loaded (left panel). Quantification of the exosomal PD-L1 level determined by western blot analysis (right panel). e, Representative contour plots of human peripheral CD8 T cells examined for the expression of Ki-67 and GzmB after treatment with H1264 cell-derived exosomes with or without blocking by IgG isotype or PD-L1 antibodies (left). The percentage of Ki-67+ or GzmB+ CD8 T cells is shown at the right panel. The experiments were repeated twice independently with similar results (a, b). Data represent mean ± s.d. of three (c-e) independent biological replicates. Statistical analyses are performed using two-sided unpaired t-test (c–e). For source data (a–d), see Supplementary Fig. 1.
Extended Data Figure 8. Exosomal PD-L1 facilitates melanoma growth in vivo.
a, Representative flow cytometric histograms of B16-F10 cells examined for the expression of PD-L1 with or without PD-L1 knockdown. B16-F10 cells were stably depleted of PD-L1 using lentiviral shRNA against PD-L1 (“shPD-L1”) or the scrambled control shRNA (“shCTL”). The experiment was repeated twice independently with similar results. b, Representative images showing the growth of PD-L1 knockdown B16-F10 tumors in C57BL/6 mice after indicated treatments. Experiments were performed using 7 mice for each group. c, The weights of PD-L1 knockdown B16-F10 tumors from C57BL/6 mice with indicated treatments (n = 7 mice per group). Data represent mean ± s.d. d, Representative contour plot of CD8 TILs or splenic or lymph node CD8 T cells examined for the expression of Ki-67 after indicated treatments. Experiments were performed using 7 mice for each group. See Fig. 3c for quantification data. e, Representative immunofluorescence images of CD8 TILs in tumor tissues (left). The number of CD8 TILs for each mouse (n = 7 mice per group) were quantified from 5 high-power fields (“HPF”) (right). Statistical analysis is performed using two-sided unpaired t-test (c, e).
Extended Data Figure 9. The level of circulating exosomal PD-L1 distinguishes the clinical responders from non-responders to pembrolizumab treatment.
a, The levels of PD-L1 on circulating microvesicles at serial time points pre- and on-treatment (n = 39). b, The frequency of PD-1+ Ki-67+ CD8 T cells and the level of circulating exosomal PD-L1 in clinical responders at serial time points pre- and on-treatment (n = 8). c, Pearson correlation of the maximum level of circulating exosomal PD-L1 at Week 3–6 to the maximum frequency of PD-1+Ki-67+ CD8 T cells at Week 3–6 in clinical responders (n = 8) and non-responders (n = 11). d, Pearson correlation of the maximum fold change of circulating exosomal PD-L1 level at Week 3–6 to the maximum fold change of PD-1+Ki-67+ CD8 T cells at Week 3–6 in clinical responders (n = 8) and non-responders (n = 11). e, Kaplan-Meier progression-free and overall survival of patients with high (n = 11) and low (n = 12) fold changes of circulating exosomal PD-L1 at 3–6 weeks. f, Comparison of the maximum fold change of total circulating PD-L1 at Week 3–6 between the clinical responders and non-responders. “R”: responders, n = 19; “NR”: non-responders, n = 20. g, Comparison of the maximum fold change of circulating microvesicle PD-L1 at Week 3–6 between the clinical responders (n = 19) and non-responders (n = 20). h, Comparison of the maximum fold change of EV-excluded PD-L1 at Week 3–6 between the clinical responders (n = 19) and non-responders (n = 20). Data represent mean ± s.d. Statistical analyses were performed using two-sided paired t-test (a), log-rank test (e), or two-sided unpaired t-test (f–h).
Extended Data Figure 10. Circulating exosomal PD-L1 is a potential rationale-based and clinically accessible predictor for clinical outcomes of anti-PD-1 therapy.
a, Tracking the levels of circulating exosomal PD-L1 before and during anti-PD-1 treatment may stratify responders (green) from non-responders (red) to anti-PD-1 therapy as early as 3–6 weeks into the treatment. b, Diagram for the potential application of circulating exosomal PD-L1 to predict patients’ response to anti-PD-1 therapy. The pre-treatment level of circulating exosomal PD-L1 is lower in metastatic melanoma patients with clinical response to anti-PD-1 therapy. After 3–6 weeks of anti-PD-1 treatment, the level of circulating exosomal PD-L1 increases significantly in clinical responders but not in non-responders. c, Tracking both the pre-treatment and on-treatment levels of circulating exosomal PD-L1 may help define the possible reasons involved in the success (green) or failure (red) of the therapy.
Supplementary Material
Acknowledgments
We thank Drs. Serge Fuchs and James Ridley for their helpful comments. This work is supported by NIH grants GM111128 and GM085146 to W.G., AI105343, AI108545, AI082630, AI117950, Parker Institute for Cancer Immunotherapy to E.J.W., 2T32CA009615-26 to A.C.H., American Heart Association to G.C., CA114046, CA025874, CA010815, CA193417, CA047159, P50 CA174523 (SPORE), and the Tara Miller Foundation to M.H., L.M.S, R.A.K, G.C.K, T.C.G, X.X., the University of Pennsylvania and the Wistar Institute, the Dr. Miriam and Sheldon G. Adelson Medical Research Foundation to M.H., the CAST foundation 2016QNRC001, 2015QNRC001 to Wuhan University, and the NSFC foundation 81570994 to Y.Z.
Footnotes
Methods, along with Extended Data display items and Source Data, are available in the online version of the paper.
AUTHOR CONTRIBUTIONS
G.C. and W.G. conceived the project and designed the experiments. G.C., W. Zha., M.W., Z.Y., J.Y., H.X., Q.M., W. Zho. and X. Xio. purified and characterized EVs. G.C., W. Zha., J.Y., B. Wan., W. Zho., X.L., S.L. and L.D. performed the mice experiments. G.C., W. Zha., M.W., J.Y., B. Wan. and B. Wu. performed the immunoprecipitation and western blot analysis. G.C., A.C.H., M.W., J.Y., H.S. and R.Y. performed the flow cytometry experiments. G.C., W. Zha. and J.Y. performed the nanoparticle tracking, ELISAs, real-time qPCR, PD-1 binding and immunofluorescence staining experiments. G.C., Z.Y., H.X. and Q.M. performed the electron microscopy experiments. G.C., W. Zha., H.S. and J.Y. performed the T cell proliferation and tumor killing experiments. G.C., H.S., L.G. and T.L. generated the bone marrow-derived dendritic cells and performed the antigen cross-presentation experiments. G.M. and Y.L. performed the RPPA experiments. G.K. and X. Xu. performed pathological analyses. W.X., L.F.A., S.M., R.S., T.G., and L.S. provided human samples and associated clinical data. H.D. and M.H. provided melanoma cell lines. G.C., A.C.H., W. Zha., G.Z., M.W., W.X., Z.Y., Y.L., R.R., G.M., J.K., Y.C., H.D., Y.Z., T.G., L.S., E.J.W., X.X. and W.G. analyzed and interpreted the data. G.C. and W.G. wrote the paper. G.Z., A.C.H., Y.C., H.D., M.H., E.J.W. and X.X. edited the paper. All authors have read and approved the final manuscript.
COMPETING INTERESTS
W.G., C.G., and X. Xu. are listed as inventors on a patent owned by the University of Pennsylvania related to this work. W.G. and X. Xu. serve on the Scientific Advisory Board and have equities in Exo Bio, a company that has licensed the patent from the University of Pennsylvania.
References
- 1.Dong H, et al. Tumor-associated B7-H1 promotes T-cell apoptosis: a potential mechanism of immune evasion. Nat Med. 2002;8:793–800. doi: 10.1038/nm730. [DOI] [PubMed] [Google Scholar]
- 2.Chen L, Han X. Anti-PD-1/PD-L1 therapy of human cancer: past, present, and future. J Clin Invest. 2015;125:3384–3391. doi: 10.1172/JCI80011. [DOI] [PMC free article] [PubMed] [Google Scholar]
- 3.Topalian SL, Taube JM, Anders RA, Pardoll DM. Mechanism-driven biomarkers to guide immune checkpoint blockade in cancer therapy. Nat Rev Cancer. 2016;16:275–287. doi: 10.1038/nrc.2016.36. [DOI] [PMC free article] [PubMed] [Google Scholar]
- 4.Ribas A, et al. Association of Pembrolizumab With Tumor Response and Survival Among Patients With Advanced Melanoma. JAMA. 2016;315:1600–1609. doi: 10.1001/jama.2016.4059. [DOI] [PubMed] [Google Scholar]
- 5.Zaretsky JM, et al. Mutations Associated with Acquired Resistance to PD-1 Blockade in Melanoma. N Engl J Med. 2016;375:819–829. doi: 10.1056/NEJMoa1604958. [DOI] [PMC free article] [PubMed] [Google Scholar]
- 6.Becker A, et al. Extracellular Vesicles in Cancer: Cell-to-Cell Mediators of Metastasis. Cancer Cell. 2016;30:836–848. doi: 10.1016/j.ccell.2016.10.009. [DOI] [PMC free article] [PubMed] [Google Scholar]
- 7.Kalluri R. The biology and function of exosomes in cancer. J Clin Invest. 2016;126:1208–1215. doi: 10.1172/JCI81135. [DOI] [PMC free article] [PubMed] [Google Scholar]
- 8.Robbins PD, Morelli AE. Regulation of immune responses by extracellular vesicles. Nat Rev Immunol. 2014;14:195–208. doi: 10.1038/nri3622. [DOI] [PMC free article] [PubMed] [Google Scholar]
- 9.Thery C, Amigorena S, Raposo G, Clayton A. Isolation and characterization of exosomes from cell culture supernatants and biological fluids. Curr Protoc Cell Biol. 2006;Chapter 3(Unit 3.22) doi: 10.1002/0471143030.cb0322s30. [DOI] [PubMed] [Google Scholar]
- 10.Colombo M, Raposo G, Thery C. Biogenesis, secretion, and intercellular interactions of exosomes and other extracellular vesicles. Annu Rev Cell Dev Bi. 2014;30:255–289. doi: 10.1146/annurev-cellbio-101512-122326. [DOI] [PubMed] [Google Scholar]
- 11.Peinado H, et al. Melanoma exosomes educate bone marrow progenitor cells toward a pro-metastatic phenotype through MET. Nat Med. 2012;18:883–891. doi: 10.1038/nm.2753. [DOI] [PMC free article] [PubMed] [Google Scholar]
- 12.Tibes R, et al. Reverse phase protein array: validation of a novel proteomic technology and utility for analysis of primary leukemia specimens and hematopoietic stem cells. Mol Cancer Ther. 2006;5:2512–2521. doi: 10.1158/1535-7163.MCT-06-0334. [DOI] [PubMed] [Google Scholar]
- 13.Melo SA, et al. Glypican-1 identifies cancer exosomes and detects early pancreatic cancer. Nature. 2015;523:177–182. doi: 10.1038/nature14581. [DOI] [PMC free article] [PubMed] [Google Scholar]
- 14.Garcia-Diaz A, et al. Interferon Receptor Signaling Pathways Regulating PD-L1 and PD-L2 Expression. Cell Rep. 2017;19:1189–1201. doi: 10.1016/j.celrep.2017.04.031. [DOI] [PMC free article] [PubMed] [Google Scholar]
- 15.Schmidt O, Teis D. The ESCRT machinery. Curr Biol. 2012;22:R116–120. doi: 10.1016/j.cub.2012.01.028. [DOI] [PMC free article] [PubMed] [Google Scholar]
- 16.Ostrowski M, et al. Rab27a and Rab27b control different steps of the exosome secretion pathway. Nat Cell Biol. 2010;12:19–30. doi: 10.1038/ncb2000. [DOI] [PubMed] [Google Scholar]
- 17.Zhou J, et al. Soluble PD-L1 as a Biomarker in Malignant Melanoma Treated with Checkpoint Blockade. Cancer Immunol Res. 2017;5:480–492. doi: 10.1158/2326-6066.CIR-16-0329. [DOI] [PMC free article] [PubMed] [Google Scholar]
- 18.Theodoraki MN, Yerneni SS, Hoffmann TK, Gooding WE, Whiteside TL. Clinical Significance of PD-L1(+) Exosomes in Plasma of Head and Neck Cancer Patients. Clin Cancer Res. 2018;24:896–905. doi: 10.1158/1078-0432.CCR-17-2664. [DOI] [PMC free article] [PubMed] [Google Scholar]
- 19.Ludwig S, et al. Suppression of Lymphocyte Functions by Plasma Exosomes Correlates with Disease Activity in Patients with Head and Neck Cancer. Clin Cancer Res. 2017;23:4843–4854. doi: 10.1158/1078-0432.CCR-16-2819. [DOI] [PMC free article] [PubMed] [Google Scholar]
- 20.Ricklefs FL, et al. Immune evasion mediated by PD-L1 on glioblastoma-derived extracellular vesicles. Sci Adv. 2018;4:eaar2766. doi: 10.1126/sciadv.aar2766. [DOI] [PMC free article] [PubMed] [Google Scholar]
- 21.Huang AC, et al. T-cell invigoration to tumour burden ratio associated with anti-PD-1 response. Nature. 2017;545:60–65. doi: 10.1038/nature22079. [DOI] [PMC free article] [PubMed] [Google Scholar]
- 22.Kim JW, et al. Fas ligand-positive membranous vesicles isolated from sera of patients with oral cancer induce apoptosis of activated T lymphocytes. Clin Cancer Res. 2005;11:1010–1020. [PubMed] [Google Scholar]
- 23.Strauss L, Bergmann C, Whiteside TL. Human circulating CD4+CD25highFoxp3+ regulatory T cells kill autologous CD8+ but not CD4+ responder cells by Fas-mediated apoptosis. J Immunol. 2009;182:1469–1480. doi: 10.4049/jimmunol.182.3.1469. [DOI] [PMC free article] [PubMed] [Google Scholar]
- 24.Wieckowski EU, et al. Tumor-derived microvesicles promote regulatory T cell expansion and induce apoptosis in tumor-reactive activated CD8+ T lymphocytes. J Immunol. 2009;183:3720–3730. doi: 10.4049/jimmunol.0900970. [DOI] [PMC free article] [PubMed] [Google Scholar]
- 25.Kamphorst AO, et al. Rescue of exhausted CD8 T cells by PD-1-targeted therapies is CD28-dependent. Science. 2017;355:1423–1427. doi: 10.1126/science.aaf0683. [DOI] [PMC free article] [PubMed] [Google Scholar]
- 26.Hui E, et al. T cell costimulatory receptor CD28 is a primary target for PD-1-mediated inhibition. Science. 2017;355:1428–1433. doi: 10.1126/science.aaf1292. [DOI] [PMC free article] [PubMed] [Google Scholar]
- 27.Shin DS, et al. Primary Resistance to PD-1 Blockade Mediated by JAK1/2 Mutations. Cancer Discov. 2017;7:188–201. doi: 10.1158/2159-8290.CD-16-1223. [DOI] [PMC free article] [PubMed] [Google Scholar]
- 28.Reck M, et al. Pembrolizumab versus Chemotherapy for PD-L1-Positive Non-Small-Cell Lung Cancer. N Engl J Med. 2016;375:1823–1833. doi: 10.1056/NEJMoa1606774. [DOI] [PubMed] [Google Scholar]
- 29.Patel SP, Kurzrock R. PD-L1 Expression as a Predictive Biomarker in Cancer Immunotherapy. Mol Cancer Ther. 2015;14:847–856. doi: 10.1158/1535-7163.MCT-14-0983. [DOI] [PubMed] [Google Scholar]
- 30.Tumeh PC, et al. PD-1 blockade induces responses by inhibiting adaptive immune resistance. Nature. 2014;515:568–571. doi: 10.1038/nature13954. [DOI] [PMC free article] [PubMed] [Google Scholar]
- 31.Nishino M, et al. Developing a common language for tumor response to immunotherapy: immune-related response criteria using unidimensional measurements. Clin Cancer Res. 2013;19:3936–3943. doi: 10.1158/1078-0432.CCR-13-0895. [DOI] [PMC free article] [PubMed] [Google Scholar]
- 32.Hogquist KA, et al. T cell receptor antagonist peptides induce positive selection. Cell. 1994;76:17–27. doi: 10.1016/0092-8674(94)90169-4. [DOI] [PubMed] [Google Scholar]
Associated Data
This section collects any data citations, data availability statements, or supplementary materials included in this article.
Supplementary Materials
Data Availability Statement
All data and materials are available from the authors upon reasonable request by contacting W.G. (guowei@sas.upenn.edu) and X.Xu. (xug@pennmedicine.upenn.edu).


