

Abstract
Purpose
Mitochondrial glycerophosphate dehydrogenase (mGPDH) is the key enzyme connecting oxidative phosphorylation (OXPHOS) and glycolysis as well as a target of the antidiabetic drug metformin (MF) in the liver. There are no data on the expression and role of mGPDH as a metformin target in cancer. In this study, we evaluated mGPDH as a potential target of metformin in thyroid cancer and investigated its contribution in thyroid cancer metabolism.
Experimental design
We analyzed mGPDH expression in 253 thyroid cancer and normal tissues by immunostaining and examined its expression and localization in thyroid cancer-derived cell lines (FTC133, BCPAP) by confocal microscopy. The effects of metformin on mGPDH expression were determined by qRT-PCR and western blot. Seahorse analyzer was utilized to assess the effects of metformin on OXPHOS and glycolysis in thyroid cancer cells. We analyzed the effects of metformin on tumor growth and mGPDH expression in metastatic thyroid cancer mouse models.
Results
We show for the first time that mGPDH is overexpressed in thyroid cancer compared with normal thyroid. We demonstrate that mGPDH regulates human thyroid cancer cell growth and OXPHOS rate in vitro. Metformin treatment is associated with downregulation of mGPDH expression and inhibition of OXPHOS in thyroid cancer in vitro. Cells characterized by high mGPDH expression are more sensitive to OXPHOS-inhibitory effects of metformin in vitro and growth inhibitory effects of metformin in vitro and in vivo.
Conclusion
Our study established mGPDH as a novel regulator of thyroid cancer growth and metabolism that can be effectively targeted by metformin.
Keywords: thyroid cancer, metformin, mGPDH, OXPHOS, glycolysis
INTRODUCTION
Epidemiological evidence suggests that therapy with the antidiabetic drug metformin is associated with decreased incidence of certain cancers, such as colon, liver or lung, as well as improved response to cancer therapy and decreased cancer mortality (1). However, there is a significant heterogenicity and discrepancy between these studies; some document an association between metformin use and beneficial cancer treatment outcome with reduced mortality (2–5), while others fail to document such beneficial effects (6,7). These observations suggest the presence of a specific molecular signature of cancer that increases its susceptibility to the antineoplastic effects of metformin.
Metformin is a hydrophilic, positively charged drug under physiological conditions and, thus, requires active intracellular transport through organic cation transporters (OCT) 1, 2 or 3. OCT1 is highly expressed in the major target tissue of metformin action – the liver (8). Mitochondrial glycerophosphate dehydrogenase (mGPDH) has been found to be a metformin target responsible for hepatic gluconeogenesis inhibition (9). mGPDH is a flavin-linked respiratory chain dehydrogenase which, via the glycerol-3-phosphate shuttle, connects glycolysis with oxidative phosphorylation (OXPHOS). Mammalian mGPDH is encoded by a single, highly conserved GPD2 gene, located on human chromosome 2q24.1 (10).
Although glycolysis and OXPHOS are the two major metabolic adaptation pathways in cancer (11), there are no data on the role of mGPDH as a metformin target in cancer or its contribution in cancer cell metabolism. To analyze the role of mGPDH in cancer metabolism, we utilized thyroid cancer as a model system. Currently, thyroid cancer is the most common endocrine malignancy, with an incidence increasing faster than any other cancer type (12). We used two human thyroid cancer cell line models derived from follicular and papillary thyroid cancer tissues (13).
We previously documented that thyroid cancer in metformin treated diabetic patients is characterized by smaller tumor size, higher complete remission rate and longer progression-free survival than in diabetic patients not treated with metformin (14). We investigated the pathophysiology of this association by studying in vitro models of human thyroid cancer and documented that the growth inhibitory effects of metformin were due to downregulation of the mTOR signaling pathway (14). Interestingly, we observed a differential susceptibility of different thyroid cancer cell lines to the antiproliferative effects of metformin, and showed that the availability of metabolic substrates (i.e. glucose) modifies the response to metformin in vitro (15). This observation formed the rationale to test the role of mGPDH in growth and metabolism of thyroid cancer cell lines in vitro, metastatic mouse models in vivo and in a transgenic mouse model that spontaneously develops thyroid cancer.
In this study, we document for the first time that mGPDH is overexpressed in thyroid cancer compared with normal thyroid tissue. We show that mGPDH regulates thyroid cancer cell growth and mitochondrial metabolism – with mGPDH overexpression associated with increased growth and OXPHOS rate, and, conversely, decreased proliferation and mitochondrial respiration with mGPDH downregulation. Further, we provide evidence that mGPDH is a metformin target in thyroid cancer.
METHODS
Cell lines and culture conditions
Thyroid cancer cell lines FTC133 (male derived, follicular thyroid cancer (FTC) with a PTEN R130STOP and TP53 R273H mutation) and BCPAP (female derived, papillary thyroid cancer (PTC) with a BRAFV600E and TP53 D259Y mutation) were utilized (9,13). STR authenticated the cell lines: >80% FTC133; 100% BCPAP (Appendix 2). The cells were grown in DMEM-high glucose medium (Gibco) supplemented with 10% FBS (ThermoFisher Scientific), 2μg/mL Insulin (ThermoFisher Scientific), 1IU/100mL Thyrotropic hormone (Sigma Aldrich), 10U/mL Penicillin Streptomycin (Gibco) and 0.25μg/mL Amphotericin B (Gibco) (16).
Cells were treated with 1mM and 5mM metformin (Sigma Aldrich) for 24 and 48h, and 50, 100, and 200nM concentrations of T3 (Sigma Aldrich) for 48 and 72h and combined therapy with metformin 5mmol/48h and T3 100nM/72h.
Luciferase transfected FTC133 and BCPAP cells were used for in vivo studies (17). Cells were transfected with a linearized pGL4.51[luc2/CMV/Neo] vector (Promega, Madison, WI) encoding the luciferase reporter gene luc2 (Photinus pyralis) using Lipofectamine™ 2000 reagent (Invitrogen, Carlsbad, CA) and selected with Geneticin (600μg/mL)-containing culture media and the G418-resistant cells were amplified in the same medium. IMPACT II PCR analysis was performed on the cells to check for any contamination and the test results were reported to be negative (Appendix 3).
siRNA transfection
FTC133 and BCPAP cells were transfected with commercially available mGPDH siRNA (hs.Ri.mGPDH.13.2, Integrated DNA Technologies) or negative control (NC) siRNA (51-01-14-04, Integrated DNA Technologies) using Lipofectamine RNAiMAX (13778075, Invitrogen) as the transfection agent. Cells were transfected with 100pmoles si-mGPDH or si-NC. qRT-PCR and western blot (WB) analysis demonstrated successful silencing at 48h post-transfection.
For Seahorse assay, cells were transfected using a reverse transfection protocol. To transfect all the wells, a complex of siRNA and Lipofectamine RNAiMAX was prepared in a opti-MEM I medium (31985088, Gibco). Cells were treated with metformin for cellular energetic studies.
CRISPR/Cas9 gene editing
mGPDH gene knockdown in FTC133 and BCPAP cells was accomplished utilizing commercially available pCas guide vector and donor template DNA containing homologous arms and functional cassette (KN213341, OriGene). OriGene protocol was followed to transfect cells with guide RNA (1μg) and donor template (1μg) using Turbofectin 8.0 (TF81001, OriGene). The puromycin resistant cells were analyzed for mGPDH (monoallelic deletion) knockdown by WB.
Stable over-expressing cell lines
To generate mGPDH over-expressing FTC133 and BCPAP cell lines, commercially available mGPDH (EX-A3080-M03)-expressing plasmid along with an empty control vector (EX-NEG-M03) was purchased from GeneCopoeia. Cells were transfected with 1μg of mGPDH expressing plasmid DNA or empty control using Turbofectin 8.0 as the transfection agent. Plasmid DNA-Turbofectin complex was prepared in opti-MEM I medium. Cells were subjected to G418 selection to obtain resistant cell colonies. qRT-PCR and WB confirmed mGPDH over-expression.
Cell proliferation assay
Cell proliferation assay was performed according to the Vybrant MTT Cell Proliferation Assay Kit (V13154, Invitrogen) protocol.
RNA extraction and quantitative real-time PCR
Total RNA was isolated using RNeasy Mini Kit (Qiagen). cDNA was synthesized using iScript cDNA synthesis Kit (Biorad). Gene expression was analyzed using iQ SYBR Green Supermix (Bio-Rad) on a StepOnePlus Real-Time PCR Detection System (Applied Biosystems) using commercially available primers for mGPDH (Hs_mGPDH_1_SG QuantiTect Primer Assay) and Beta-Actin (Hs_ACTB_1_SG QuantiTect Primer Assay). The custom-made primers (Integrated DNA technologies) for RT-PCR analysis of other genes were as follows: OCT1 (FP-GGATGAAGATGGAGTTATC, RP-GTAGGCAAGTATGAGGAA); COX6B2 (FP-CTAACGCCCTCACCATTT, RP-TCGCATCATTGTACTCCAG); NDUFA6 (FP-TTCCTATCCAAGTTCTATGTT, RP-AAGTGACCATTGTATAGTGA); NDUFC2 (FP-ATTGAGTAGTTGTGATAGA, RP-ACAGAATCCTCCATAATC).
Mitochondrial metabolism PCR array
The PCR array was performed using a RT2 Profiler™ PCR Array Human Mitochondrial Energy Metabolism Kit (PAHS-008Z; Qiagen) as per manufacturer instructions.
Mitochondrial DNA (mtDNA) copy number analysis
The average mtDNA copy number was determined using a NovaQUANT™ Human Mitochondrial to Nuclear DNA Ratio Kit (72620; Millipore Sigma) as per manufacturer instructions.
Protein extraction and Immunoblot analysis
Cells were lysed using M-PER (Mammalian Protein Extraction Reagent) (Thermo Scientific) per manufacturer instructions. Amicon Centrifugal filters (Millipore) were used for protein concentration. Following protein estimation by DC™ Protein Assay Kit II, samples were loaded onto 4-12% SDS-PAGE gel (Novex) and transferred to a membrane utilizing a Trans-blot turbo system (Biorad). The membranes were blocked with 3% BSA for 1h and incubated overnight with a primary antibody against mGPDH (1:700; Abcam; ab188585), OCT1 (SLC22A1) (1:1000; Abcam; ab181022) and total OXPHOS (1:500; Abcam; ab110411). GAPDH (1:1000; Invitrogen; MA5-15738) and Porin (1:1000; Abcam; ab14734) were used as endogenous controls. After 3x washing with TBST, the membrane was incubated with the secondary antibody (1:10000) and washed 3x. The blot was visualized using ECL (Thermo Scientific) and imaging system (Bio-Rad). The relative protein expression was quantified by densitometry using Fiji - ImageJ software.
Mitochondrial stress assay
Mitochondrial function was determined by measuring oxygen consumption rate (OCR) of each cell line using XF Cell Mito Stress Test Kit (Agilent Technologies). FTC133 and BCPAP cells were seeded in an XF96 cell culture microplate and treated with metformin for 48h. The sensor cartridge and base medium were prepared by adding 1mM pyruvate, 2mM glutamine and 10mM glucose and stored as per manufacture instructions. Seahorse assay was run in XF96 Extracellular Flux Analyzer (Agilent Technologies). Following three baseline OCR measurements, cells were exposed sequentially to Oligomycin (0.5μM), Carbonyl cyanide-4 (trifluoromethoxy) phenylhydrazone (FCCP) (1μM), and Rotenone/Antimycin A (0.5μM). Oligomycin inhibits ATP synthase (complex V), and the decrease in OCR following injection of Oligomycin correlates to the mitochondrial respiration associated with cellular ATP production. FCCP is an uncoupling agent that collapses the proton gradient and disrupts the mitochondrial membrane potential, allowing cells to achieve maximal oxygen consumption rate. As a result, electron flow through the ETC (Electron Transfer Chain) is uninhibited and oxygen is maximally consumed by complex IV. The FCCP-stimulated OCR can then be used to calculate spare respiratory capacity, defined as the difference between maximal respiration and basal respiration. Spare respiratory capacity is a measure of the ability of the cell to respond to increased energy demand. The third injection is a mix of Rotenone, a complex I inhibitor, and Antimycin A, a complex III inhibitor. This combination shuts down mitochondrial respiration and enables the calculation of nonmitochondrial respiration driven by processes outside the mitochondria. Three measurements were recorded after every injection. To normalize the results, cell number/well was quantified using the Celígo Imaging Cytometer (Nexcelom). The assay results were analyzed using Wave program 2.3.0 (Seahorse Bioscience).
Glycolysis stress assay
The conversion of glucose to pyruvate, and subsequently lactate, results in a net production and extrusion of protons into the extracellular medium and consequently acidification of the medium. The Seahorse XF Glycolysis Stress Test Kit (Agilent Technologies) was utilized to measure the extracellular acidification rate (ECAR) because of glycolytic metabolism. Cells were seeded in a XF96 cell culture microplate and treated with metformin for 48h. The sensor cartridge and assay medium preparation was performed as per manufacture instructions. Following three baseline ECAR measurements, cells were exposed sequentially to Glucose (10mM), Oligomycin (1.0μM) and 2-deoxy glucose (50mM). The first injection is a saturating concentration of glucose. The cells utilize the glucose injection and catabolize it through the glycolytic pathway to pyruvate, producing ATP, NADH, water, and protons. The extrusion of protons into the surrounding medium causes a rapid increase in ECAR. This glucose-induced response is reported as the rate of glycolysis under basal conditions. The second injection is Oligomycin, an ATP synthase inhibitor. Oligomycin inhibits mitochondrial ATP production, and shifts the energy production to glycolysis, with the subsequent increase in ECAR revealing the cellular maximum glycolytic capacity. The final injection is 2-deoxy-glucose (2-DG), a glucose analog, that inhibits glycolysis through competitive binding to glucose hexokinase, the first enzyme in the glycolytic pathway. The resulting decrease in ECAR confirms that the ECAR produced in the experiment is due to glycolysis. ECAR, prior to glucose injection, is referred to as non-glycolytic acidification. Three measurements were recorded after every injection. The results were analyzed and normalized as described above.
mGPDH enzyme assay
Mitochondria were isolated from cultured FTC133 and BCPAP cells using a commercially available Mitochondrial Isolation Kit (Thermofisher scientific), according to the manufacturer instructions. mGPDH enzymatic activity was measured as rate of reduction of cytochrome C following the addition of glycerophosphate. The assay was performed in incubation medium containing 50mM KCl, 1mg/ml BSA, 10mM Tris-HCl, 1mM EDTA, 1mM KCN, 50μM cytochrome c, pH 7.4. Prior to the assay, isolated mitochondria were incubated with either 1mM or 5mM metformin for 10 minutes. The reaction was initiated by the addition of 20mM glycerophosphate and gain of absorbance was measured at 550nm for 5 minutes at 30°C. The enzyme activity was measured as rate of change of absorbance/min and presented as activity percentage relative to control.
Complex I activity assay
FTC133 and BCPAP cells were treated with either 1mM or 5mM metformin for 4h. The enzyme activity of complex I was measured according to the Complex I Enzyme Activity Microplate Assay Kit protocol (Abcam; ab109721).
In-vivo studies
The animal protocol for the experiments was approved by NCI-Bethesda Animal Care and Use Committee. Xenograft NOD.Cg-Prkdcscid Il2rgtm1Wjl/SzJ mice, purchased from Jackson Laboratory (Bar Harbor, ME) were used for in vivo studies. At 8-10 weeks of age, mice received tail vein injection of either FTC133 (160,000 cells) or BCPAP (500,000 cells) cell lines containing a linearized pGL4.51[luc2/CMV/Neo] vector.
Mice were treated with metformin (12.5mg/250μl) or water via oral gavage daily for four weeks. Tumor burden was checked weekly through Xenogen IVIS (In Vivo Imaging System) (Caliper Life Sciences Inc., Hopkinton, MA). Mice were injected with Luciferin approximately 15 minutes prior to imaging. After the last whole-body imaging, the mice were euthanized by CO2 inhalation, and the organs were isolated and fixed in formalin for histological analysis. All in vivo experiments were performed twice.
Immunostaining
Immunostaining was performed on paraffin embedded tissue sections. Sections were dewaxed, soaked in alcohol, and, after microwave treatment in antigen unmasking solution (Vector Labs, Burlingame, CA) for 10 minutes, incubated in 3% hydrogen peroxide for 15 minutes to inactivate endogenous peroxidase activity. Sections were incubated for 10 minutes in working solution of blocking serum and incubated at 4°C overnight with anti-mGPDH [2mg/ml] (Abcam, Cambridge, MA; cat# ab188585) or with anti-OCT1 [2mg/ml] (Abcam, Cambridge, MA; cat# 182144). Immunostaining was performed using the Vectastain Universal Quick Kit according to manufacturer’s instructions. Sections were incubated with biotinylated secondary antibody for 10 minutes, and in streptavidin/peroxidase complex working solution for 10 minutes. Peroxidase staining was revealed with ImmPact DAB, peroxidase substrate Kit (Vector Labs, Burlingame, CA). Sections were counterstained with hematoxylin and mounted. Antiserum was omitted in the negative control.
The results of staining were interpreted and scored independently by two investigators (VV and JKG).
Immunofluorescence staining and confocal microscopy
The 250,000 cells were plated in glass coverslips in 6-well plates and allowed to attach for 24h at 37°C (5% CO2). The cells were incubated in 1:5000 concentration of Mitotracker Deep Red (Invitrogen) for 15 minutes, washed with prewarmed media, then fixed and permeabilized in 100% methanol for 5 minutes at 4°C. Next, the cells were blocked with 5% BSA in PBS-TT (0.5% Tween and 0.1% Triton) for 1h and immunostained for mGPDH using monoclonal antibody anti-mGPDH (Abcam, Cambridge, MA) for 2h then secondary antibodies conjugated with Alexa Fluor 488 or Alexa Fluor 569 for 1h (Life Technologies, Thermo Fisher Scientific). DNA was stained with DAPI (Vector Laboratories, Burlingame, CA). Fluorescence images were detected by confocal microscope NLO 710 Zeiss, and collected using Carl Zeiss Zen Software (Zeiss, Germany).
Widefield Fluorescence Microscopy and Image Analysis
Images were acquired on a Keyence BZ-9000 digital microscope (Keyence Corporation of America, Itasca, IL), using the equipped Nikon 10x objective lens (Nikon Instruments, Inc., Melville, NY). Filter sets used for DAPI and Alexa 488 were 49028 and 49002, respectively (Chroma Technology Corporation, Bellows Falls, VT).
Quantification of green and red signal in the images was performed using a custom macro written for Fiji/ImageJ software (18). Cell counts/image, based on DAPI nuclei identification, ranged from 141 to 977. Intensity measurements were divided by the number of nuclei to get per-cell readings. For each experimental group, a background/cell was determined from the negative control and subtracted from the other per-cell measurements in the group.
Statistical Analysis
Data were analyzed using GraphPad Prism 7.0 software. For non-categorical data, a two-tailed unpaired student’s t-test was used. Data are presented as mean±S.D. Seahorse graphs are presented with standard error bars. For categorical data, a two-tailed Fisher exact test was used.
P-value of <0.05 was considered significant. Bonferroni correction was used for multiple comparisons. All in vitro experiments were performed in 2-18 technical replicates (n represents technical replicates) and repeated with at least two biological replicates while in vivo experiments involved 8-14 biological replicates and were performed twice.
RESULTS
Metformin intracellular transporter, OCT1 (SLC22A1), is overexpressed in thyroid cancer compared with normal thyroid tissue
Metformin transport into cells involves an active uptake process mediated by organic cation transporter (OCT) 1, 2 or 3 (8). To determine the level of OCT1 expression in thyroid cancer, we analyzed RNA Seq data derived from The Cancer Genome Atlas (TCGA) database incorporating 507 thyroid cancer patients. We examined the OCT1 expression in different subtypes of papillary thyroid cancer (Supplemental Figure 1A). TCGA database includes 65 paired samples of tumor vs normal tissue derived from the same patients. Analysis of these paired samples demonstrated significantly higher OCT1 expression in thyroid cancer compared with normal thyroid (Log fold change 0.3, p=0.04), (raw data – Appendix 1).
We next performed immunohistochemical (IHC) staining for OCT1 in 200 tissue samples – 27 normal thyroid, 69 follicular thyroid cancer (FTC), 68 papillary thyroid cancer (PTC) and 36 poorly differentiated thyroid cancer (PDTC). OCT1 protein level was significantly higher in thyroid cancer compared with normal thyroid (p<0.001), with the highest level observed in PTC (Figure 1A).
Figure 1. Expression of OCT1 (SLC22A1) and mGPDH in human thyroid cancer tissues and cell lines.
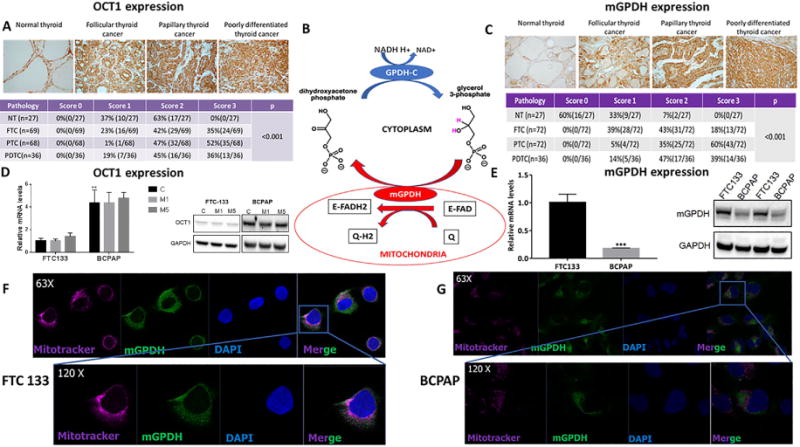
A) Significantly higher expression of OCT1 in thyroid cancer compared with normal thyroid tissue as documented by IHC staining, (n=200, p<0.001). The expression of OCT1 is significantly higher in papillary thyroid cancer compared with follicular (p<0.001) and poorly differentiated thyroid cancer (p=0.004), which are characterized by similar OCT1 expression. NT=normal thyroid; FTC=follicular thyroid cancer; PTC=papillary thyroid cancer; PDTC=poorly differentiated thyroid cancer.
B) The scheme representing the mGPDH role in glycerol-3-phosphate shuttle. mGPDH transfers reducing equivalents from cytosolic NADH into the mitochondrial electron transport chain connecting glycolysis with OXPHOS.
C) Significantly higher expression of mGPDH in thyroid cancer compared with normal thyroid tissue as documented by IHC staining, (n=207, p<0.001). NT=normal thyroid; FTC=follicular thyroid cancer; PTC=papillary thyroid cancer; PDTC=poorly differentiated thyroid cancer.
D) BCPAP cells express higher OCT1 mRNA (n=4; p<0.01) and protein than FTC133 cells. No effect of metformin 5mM/48h on OCT1 expression.
E) Significantly higher mRNA expression of mGPDH in FTC133 compared with BCPAP human thyroid cancer cell line, (n=4, p<0.0001). Significantly higher protein expression of mGPDH in FTC133 compared with BCPAP human thyroid cancer cell line, (n=4, p<0.001).
F) Intracellular mitochondria-associated localization of mGPDH in FTC133 cells documented by IF staining and confocal microscopy imaging, (n=4-6). Blue=DAPI nuclear staining; purple=Mitotracker mitochondrial staining; green=mGPDH staining.
G) Intracellular mitochondria-associated localization of mGPDH in BCPAP cells documented by IF staining and confocal microscopy imaging, (n=4-6). Blue=DAPI nuclear staining; purple=Mitotracker mitochondrial staining; green=mGPDH staining.
Two thyroid cancer cell lines – FTC133 (FTC) and BCPAP (PTC) – served as a model for investigating thyroid cancer. We found moderate OCT1 expression at the mRNA (Figure 1D) and protein level (Figure 1D), with BCPAP cells characterized by higher OCT1 expression than FTC133 cells. There was no change in OCT1 expression after metformin treatment (Figure 1D). OCT2 and OCT3 expression was not detected in the thyroid cancer cell lines (data not shown). We show that the level of OCT1 is elevated in human thyroid cancer tissue samples. OCT1 is expressed in human FTC and PTC cell lines. These observations established a robust model for functional in vitro and in vivo studies to test the metabolic and growth inhibitory effects of metformin in thyroid cancer.
mGPDH is overexpressed in thyroid cancer compared with normal thyroid tissue
While mGPDH has been found to be a target of metformin in the liver (9), there are no data on its expression and role in cancer cell metabolism and response to metformin. Using the RNA Seq data from TCGA database consisting of 507 PTC patients, we examined the mGPDH expression in all PTC subtypes (Supplemental Figure 1B). Among the 65 paired samples of tumor vs normal tissue, mGPDH showed significantly higher expression in thyroid cancer compared with normal thyroid (Log fold change 0.28, p<0.001), (raw data – Appendix 1). IHC staining in 207 tissue samples derived from 117 patients – 72 FTC, 72 PTC, 36 PDTC and 27 normal thyroid tissues – showed significantly higher expression of mGPDH protein in thyroid cancer compared with normal thyroid tissue (p<0.001), (Figure 1C). We next evaluated mGPDH expression in thyroid cancer cell lines by qRT-PCR, Western Blot (WB), immunofluorescence staining, and its intracellular localization by confocal microscopy. We found mitochondrial expression of mGPDH based on co-staining with mitochondrial marker – Mitotracker – in both thyroid cancer cell lines (Figure 1 F, G). FTC133 cells are characterized by significantly higher mGPDH expression than BCPAP cells (p<0.001), (Figure 1E; Supplemental Figure 1C). FTC133 cells are also characterized by higher mitochondrial staining as documented by quantification of immunofluorescence staining with Mitotracker (Supplemental Figure 1D).
In summary, we demonstrated that mGPDH is overexpressed in thyroid cancer, thus establishing in vitro models characterized by high (FTC133) and low (BCPAP) mGPDH expression to test the effect of metformin on mGPDH expression and cancer cell metabolism.
Metformin treatment decreases mGPDH expression in thyroid cancer cell lines in vitro.
We previously demonstrated that metformin inhibits proliferation of thyroid cancer cell lines in vitro via activation of the intracellular energy sensor, AMPK (AMP-activated protein kinase), and downstream inhibition of the mTOR/pS6/cyclin D1 signaling pathway (14,19). In this study, we tested if the same growth inhibitory and metabolic stress-inducing concentrations of metformin affect mGPDH expression – the key enzyme connecting glycolysis with OXPHOS via the glycerol-3-phosphate shuttle (Figure 1B). Treatment with 5mM metformin for 48h resulted in significant mGPDH downregulation in the two-examined thyroid cancer cell lines at the mRNA (p=0.001), (Figure 2 A, B), and protein level (Figure 2 C). We also assessed the proliferation rate after 5 days of exposure to metformin 5mM. We found a significant inhibition of proliferation by 58.01±7.273% in FTC133 cells and 61.96±9.345% in BCPAP cells (Supplemental Figure 2G). However, longer incubation with metformin was not associated with a more significant decrease in mGPDH protein expression in comparison to 48h exposure (Supplemental Figure 2H).
Figure 2. FTC133 cells are characterized by higher level of mGPDH expression and higher mitochondrial respiration rate than BCPAP cells. Metformin treatment is associated with reduction in mGPDH expression in both cell lines.
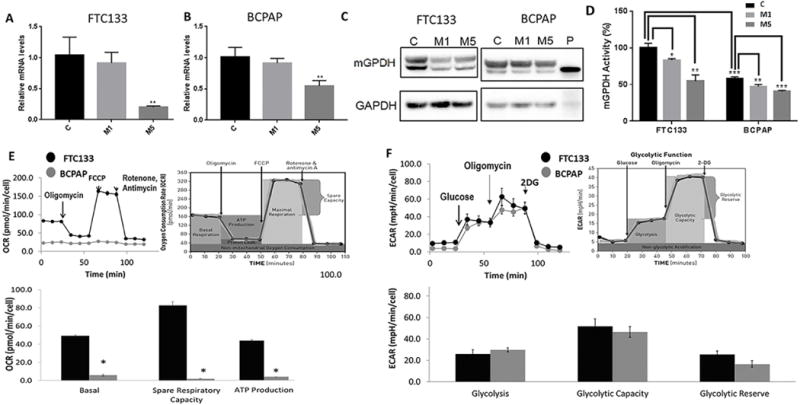
A) Decrease in mRNA expression of mGPDH in FTC133 cells treated with 5mmol metformin for 48h. M1=metformin 1mmol/48h; M5=metformin 5mmol/48h, (n=4, p=0.001).
B) Decrease in mRNA expression of mGPDH in BCPAP cells treated with 5mmol metformin for 48h. M1=metformin 1mmol/48h; M5=metformin 5mmol/48h, (n=4, p=0.002).
C) Reduction of mGPDH protein expression after treatment with metformin (1 and 5 mmol/48h) in FTC133 and BCPAP cells documented by Western Blot. M1=treatment with metformin 1mmol/48h; M5=treatment with metformin 5mmol/48h; P=positive control recombinant human mGPDH.
D) Higher baseline mGPDH activity in FTC133 cell compared with BCPAP cells (n=3, p<0.001). Significant reduction of mGPDH activity after treatment with metformin (n=3). M1=treatment with metformin 1mmol/48h (FTC133-p<0.05; BCPAP-p<0.01); M5=treatment with metformin 5mmol/48h (FTC133-p<0.01; BCPAP-p<0.001).
E) Significantly higher baseline mitochondrial respiration, ATP production, maximal respiration and spare respiratory capacity in FTC133 compared with BCPAP cells documented by Seahorse Mitostress Kit, (n=6-9).
Basal OCR – FTC133 49.2±4.6 pmol/min/cell vs BCPAP 7.4±1.3 pmol/min/cell, p<0.0001.
ATP production – FTC133 40.6±3.6 pmol/min/cell vs BCPAP 3.5±1.6 pmol/min/cell, p<0.0001.
Maximum respiration – FTC133 132±14.2 pmol/min/cell vs BCPAP 7.8±2.2 pmol/min/cell, p<0.0001.
Spare respiratory capacity – FTC133 82.8±12.2 pmol/min/cell vs BCPAP 2±1.3 pmol/min/cell, p<0.0001.
F) Comparable level of glycolysis, glycolytic reserve and capacity of FTC133 and BCPAP cells measured by Seahorse Glycolysis Stress Kit, (n=6-9).
Glycolysis rate – FTC133 26.8±4.6 mpH/min/cell vs BCPAP 29.9±3 mpH/min/cell, p=0.18.
Glycolytic capacity – FTC133 51.8±7.5 mpH/min/cell vs BCPAP 46.6±5.7 mpH/min/cell, p=0.21.
Glycolytic reserve – FTC133 25.7±3.4 mpH/min/cell vs BCPAP 16.7±3.4 mpH/min/cell, p=0.1.
OCR=Oxygen consumption rate pmol/min/cell; ECAR=extracellular acidification rate mpH/min/cell.
Since we found mitochondrial expression of mGPDH, we next examined if mGPDH expression inhibition could be due to decreased intracellular mitochondrial content. Metformin therapy did not affect mitochondrial staining in any of the examined cell lines, as documented by the quantification of immunofluorescence staining with Mitotracker (Supplemental Figure 1D) and by mtDNA copy number analysis (Supplemental Figure 1E).
We also performed a PCR expression profile array of other genes involved in mitochondrial metabolism (Supplemental Table 4). The only genes with mRNA expression that was nearly two-fold downregulated in both cell lines after metformin treatment (5mmol/48h) were ATP4B (subunit of ATPase synthase Complex), COX412 (subunit of complex IV) and COX6B2 (subunit of complex IV). Among these three, ATP4B and COX4I2 had very low expression in both cell lines with Ct values greater than 35. In FTC133 cells, we observed more than two-fold downregulation in NDUFC2 and NDUFA6 genes, which are complex I subunits. We performed validation of COX6B2, NDUFC2 and NDUFA6 with targeted PCR, and found that none of the targets were consistently downregulated in both cell lines (Supplemental Figure 2A). We also performed WB analysis using total OXPHOS Human WB Antibody Cocktail enabling concomitant analysis of main proteins of each complex in the electron transport chain - complex I subunit NDUFB8, complex II subunit 30kDa, complex III subunit Core 2, complex IV subunit II, and ATP synthase subunit alpha. There was no difference in protein expression after treatment with metformin 5mM for 48h (Supplemental Figure 2B). We also analyzed the enzymatic activity of mGPDH in mitochondria extracted from FTC133 and BCPAP cells. We found a significant decrease in mGPDH activity after 10 minutes of exposure to metformin (Figure 2D). We did not find any difference in mitochondrial complex I activity in cancer cells after up to 4h exposure to metformin (Supplemental Figure 2F). These results do not rule out the involvement of complex I activity in the intracellular effects of metformin in our model if it binds at or near the ubiquinone binding site. To the best of our knowledge, the binding site of metformin into the mitochondrial complex I is not elucidated and is beyond the scope of this paper. The activity assay utilized in our experiments measured diaphorase-type activity of complex I. This activity is not dependent on the presence of ubiquinone and, therefore, inhibitors which bind at or near the ubiquinone binding site do not inhibit this assay.
Taken together, our data suggests that mGPDH may serve as a metformin target in thyroid cancer cells and formed the rationale to test the role of mGPDH in thyroid cancer metabolism and its response to metformin.
mGPDH-rich thyroid cancer cell line FTC133 is characterized by higher baseline OXPHOS rate compared with BCPAP cells with low mGPDH expression
To investigate thyroid cancer cell metabolism, we next analyzed OXPHOS and glycolysis rate in FTC133 and BCPAP cells using the Seahorse technique. The well-established Seahorse Mito Stress Kit analyzes key parameters of mitochondrial function by directly measuring the oxygen consumption rate (OCR) of cells utilizing sequential compound injections (Figure 2E). We documented significantly higher baseline OCR, ATP production, maximal respiration and spare respiratory capacity in mGPDH-rich FTC133 compared with BCPAP cells (p<0.001), (Figure 2E).
We next used a Seahorse Glycolysis Stress Kit to compare the glycolysis rate – extracellular acidification rate (ECAR) – among thyroid cancer cell lines utilizing sequential compound injections (Figure 2F). No significant difference was observed between the baseline glycolysis, glycolytic capacity and glycolytic reserve in the thyroid cancer cell lines (Figure 2F).
These results show that mGPDH-rich FTC133 cells are characterized by a different metabolic phenotype of higher mitochondrial respiration rate than mGPDH-poor BCPAP cells, which are predominantly glycolysis-dependent. Of note, mGPDH-rich FTC133 cells are characterized by a significantly higher proliferation rate (doubling time 27h) compared to BCPAP cells (doubling time 30-36h) (13,20).
Metformin inhibits OXPHOS more significantly in FTC133 cells compared with BCPAP cells and switches cancer cell metabolism to glycolysis
We determined the metformin effect on mitochondrial respiration in the two-human thyroid cancer cell lines. After treatment with 5mM concentration of metformin for 48h (M5), we observed significant inhibition of baseline respiration, ATP production, maximum respiration and spare respiratory capacity in FTC133 cells, as well as minimal inhibition of baseline and maximal respiration and ATP production in BCPAP cells (Figure 3 A, B). The metformin induced OXPHOS inhibition resulted in the switching of glucose metabolism to be more anaerobic glycolysis-dependent in FTC133 and BCPAP cells, leading to a significant inhibition of glycolytic reserve in both cell lines (Figure 3 C, D).
Figure 3. Significantly higher reduction in mitochondrial respiration in FTC133 than in BCPAP cells after metformin therapy leading to shifting cancer cell metabolism to glycolysis.
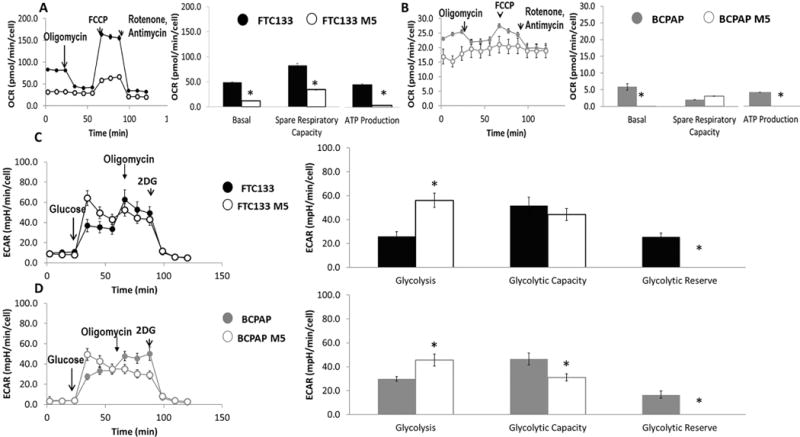
A) Significant inhibition of basal and maximal mitochondrial respiration, ATP production and spare respiratory capacity in FTC133 cells pretreated with metformin (5mmol/48h), (n=6-9).
Basal OCR – FTC133 49.2±1.5 pmol/min/cell vs FTC133 M5 12.05±0.5 pmol/min/cell, p<0.0001.
ATP production – FTC133 40.6±1.2 pmol/min/cell vs FTC133 M5 3.4±0.4 pmol/min/cell, p=0.004.
Maximum respiration – FTC133 132±4.7 pmol/min/cell vs FTC133 M5 46.2±2.3 pmol/min/cell, p<0.0001.
Spare respiratory capacity – FTC133 82.8±4.1 pmol/min/cell vs FTC133 M5 34.2±1.9 pmol/min/cell, p<0.0001.
B) Significant inhibition of basal and maximal mitochondrial respiration and ATP production in BCPAP cells pretreated with metformin (5mmol/48h), (n=6-9).
Basal OCR – BCPAP 5.8±1.1 pmol/min/cell vs BCPAP M5 1.5±1.1 pmol/min/cell, p=0.006.
ATP production – BCPAP 3.5±0.5 pmol/min/cell vs BCPAP M5 0.3±0.1 pmol/min/cell, p=0.0004.
Maximum respiration – BCPAP 7.8±0.7 pmol/min/cell vs BCPAP M5 2.2±0.6 pmol/min/cell, p<0.0001.
Spare respiratory capacity – BCPAP 2±0.4 pmol/min/cell vs BCPAP M5 3.1±0.7 pmol/min/cell, p=0.22.
C) Increased glucose utilization via glycolysis leading to decreased glycolytic reserve in FTC133 cells after metformin treatment (5mmol/48h), (n=6-9).
Glycolysis rate – FTC133 26.1±12.2 mpH/min/cell vs FTC133 M5 56.2±19.7 mpH/min/cell, p=0.01.
Glycolytic capacity – FTC133 51.8±22.4 mpH/min/cell vs FTC133 M5 44.4±15.8 mpH/min/cell, p=0.18.
Glycolytic reserve – FTC133 25.7±10.3 mpH/min/cell vs FTC133 M5 0.0±0.0 mpH/min/cell, p=0.001.
D) Increased glucose utilization via glycolysis leading to decreased glycolytic capacity and glycolytic reserve in BCPAP cells after metformin treatment (5mmol/48h), (n=6-9).
Glycolysis rate – BCPAP 29.9±9.0 mpH/min/cell vs BCPAP M5 45.6±15.1 mpH/min/cell, p=0.05.
Glycolytic capacity – BCPAP 46.6±17.0 mpH/min/cell vs BCPAP M5 31.1±11.6 mpH/min/cell, p=0.05.
Glycolytic reserve – BCPAP 16.7±10.2 mpH/min/cell vs BCPAP M5 0.0±0.0 mpH/min/cell, p=0.001.
M5=metformin treatment (5mmol/48h); OCR=Oxygen consumption rate pmol/min/cell; ECAR=extracellular acidification rate mpH/min/cell.
We also analyzed the acute effects of metformin on thyroid cancer metabolism. We performed Seahorse analysis after 0.5, 1, 2 and 4h of exposure to metformin. We found a significant decrease in baseline and maximal OCR and ATP production in metformin treated cells compared with control cells at 2 and 4h (Supplemental Figure 2 C, D). However, there was no difference in mGPDH expression after acute exposure to metformin at these time points (Supplemental Figure 2E). Metformin inhibited the enzymatic activity of mGPDH as early as 10 minutes after exposure (Figure 2D). These data suggest that the acute effects of metformin on cancer cells’ OXPHOS are due to the inhibition of the enzymatic activity of respiratory chain enzymes, targeting mGPDH enzymatic activity.
In summary, we demonstrate that FTC133 cells, characterized by higher mGPDH expression and mitochondrial respiration rate, are more sensitive to OXPHOS-inhibitory effects of metformin in vitro compared with BCPAP cells. Metformin therapy results in switching cancer cell metabolism towards glycolysis.
Metformin induced inhibition of growth and mitochondrial respiration is dependent on mGPDH in thyroid cancer cells
To determine the direct effect of mGPDH on growth and metabolism of thyroid cancer cells, we utilized two methods of mGPDH silencing: transient silencing using siRNA; and a knockdown model using CRISPR/Cas9 gene editing. Silencing efficacy was documented by qRT-PCR and WB in the siRNA model (Figure 4 A, B) and by WB in the knockdown model (Figure 4B). mGPDH silencing by siRNA resulted in cell proliferation inhibition by 33.6±5% in FTC133 cells and 30.7±6.7% in BCPAP cells (Figure 4C), while monoallelic knockdown resulted in inhibition of proliferation by 38.6±2.6% in FTC133 cells and 25.2±5.2% in BCPAP cells (Figure 4D). mGPDH knockdown was associated with mitochondrial respiration inhibition in FTC133 and BCPAP cells (Figure 4 E, F), with a more pronounced effect in FTC133 cells. Similar effects on mitochondrial respiration were observed in both cell lines in a transient silencing model (Supplemental Figure 3 A, B).
Figure 4. mGPDH silencing leads to decreased cancer cell growth and mitochondrial respiration, and causes resistance to growth and OXPHOS inhibition by metformin.
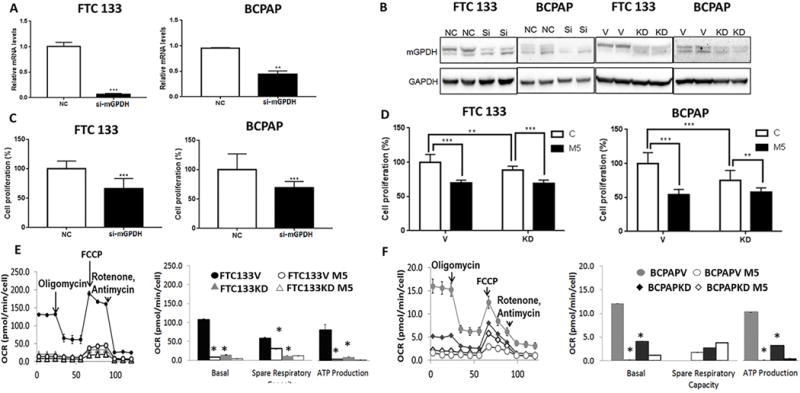
A) Decreased mRNA expression of mGPDH after siRNA silencing in FTC133 (p<0.0001) and BCPAP (p=0.007) cells, (n=2-5).
B) Decreased protein expression of mGPDH after siRNA silencing in FTC133 and BCPAP cells. Decreased protein expression of mGPDH after monoallelic knockdown in FTC133 and BCPAP cells. V=empty vector; KD=mGPDH knockdown.
C) Decreased cell growth after silencing of mGPDH in FTC133 and BCPAP cells, (n=18, p<0.0001).
D) Decreased cell growth after mGPDH knockdown in FTC133 (p<0.0001) and BCPAP (p=0.0001) cells. Reduced growth inhibitory metformin action in mGPDH-knockdown cells compared with control cells, (n=10-11).
E) Decreased baseline and maximal mitochondrial respiration, ATP production and spare respiratory capacity in FTC133 cells after mGPDH knockdown. Reduced mitochondrial respiration inhibitory effects of metformin in knockdown cells compared with control cells, (n=6-9).
Basal OCR vector (V) vs knockdown (KD) – FTC133 V 106±7 pmol/min/cell vs FTC133 KD 14.8±2.7 pmol/min/cell, p<0.0001.
ATP production – FTC133 V 84.8±4.4 pmol/min/cell vs FTC133 KD 9.02±1.9 pmol/min/cell, p<0.0001.
Maximum respiration – FTC133 V 164.8±14.8 pmol/min/cell vs FTC133 KD 27.1±2.8 pmol/min/cell, p<0.0001.
Spare respiratory capacity – FTC133 V 57.9±7.6 pmol/min/cell vs FTC133 KD 12.3±0.52 pmol/min/cell, p<0.0001.
F) Decreased baseline and maximal mitochondrial respiration, ATP production and proton leak in BCPAP cells after mGPDH knockdown. Reduced mitochondrial respiration inhibitory effects of metformin in knockdown cells compared with control cells, (n=6-9). Basal OCR vector (V) vs knockdown (KD)–BCPAP V 12.1±2 pmol/min/cell vs BCPAP KD 4.05±0.51 pmol/min/cell, p=0.0001.
ATP production – BCPAP V 9±1.6 pmol/min/cell vs BCPAP KD 2.8±0.3 pmol/min/cell, p=0.0002.
Maximum respiration – BCPAP V 9.4±2.7 pmol/min/cell vs BCPAP KD 6.7±0.3pmol/min/cell, p=0.01.
Spare respiratory capacity – BCPAP V 0 pmol/min/cell vs BCPAP KD 2.7±0.2 pmol/min/cell, p<0.0001.
NC=control cells; si=cell transfected with mGPDH siRNA; V=control cells transfected with pCAS empty vector; KD=cells with monoallelic mGPDH knockdown; M5=metformin 5mmol/48h.
We next examined the effect of metformin with mGPDH-silencing conditions. While metformin inhibited growth of control cells, its growth inhibitory effect in mGPDH knockdown model was significantly lowered with growth inhibition by 19±3.1% in FTC133 cells and 17.1±5.1% in BCPAP cells (Figure 4D). Metformin significantly inhibited basal OCR, ATP production, maximum respiration and spare respiratory capacity in control cells, while the net OCR-inhibitory effect of metformin in knockdown cells was significantly reduced in both cell lines (Figure 4 E, F; Supplemental Table 1). The quantification of a net difference (delta) in the OCR-inhibitory effect of metformin in control cells and mGPDH-knockdown cells is depicted in the Supplemental Figure 3 C,D.
Taken together, we showed that mGPDH silencing leads to inhibition of growth and mitochondrial respiration in thyroid cancer cells and decreased efficacy of the antiproliferative and OXPHOS-inhibitory effects of metformin in vitro.
mGPDH overexpression leads to increased thyroid cancer cell growth and mitochondrial respiration and sensitizes thyroid cancer cells to metformin
mGPDH transcription is activated by TR/RXR binding to a TRE (thyroid hormone response element) sequence in the promoter region of the mGPDH gene (21). We found that treatment with thyroid hormone (T3) resulted in significant mGPDH upregulation in both thyroid cancer cell lines, with the maximum effect observed at 100nM concentration for 72h (Figure 5 A, B). We also successfully induced mGPDH overexpression in thyroid cancer cell lines by an mGPDH-containing plasmid (Figure 5 C, D).
Figure 5. mGPDH-overexpression results in increased cancer cell growth and mitochondrial respiration and sensitizes cancer cells to OCR inhibitory effects of metformin.
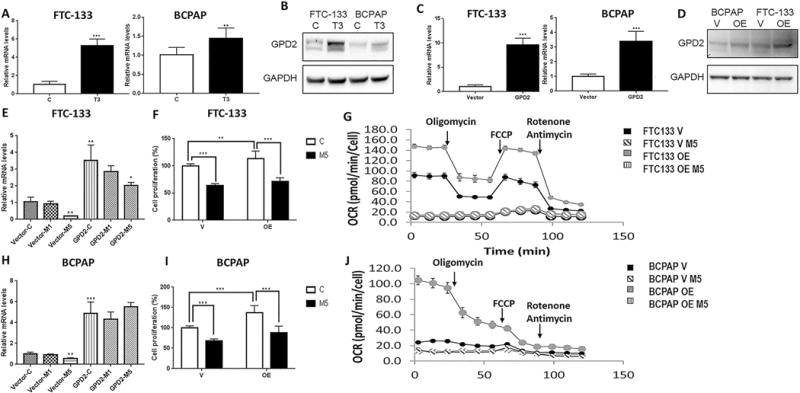
A) 100nM/72h triiodothyronine (T3) treatment results in increased mGPDH expression at the mRNA level in FTC133 (p<0.0001) and BCPAP (p=0.002) cells, (n=4-8).
B) 100nM/72h T3 treatment results in increased mGPDH expression at the protein level in FTC133 and BCPAP cells.
C) Plasmid induced overexpression of mGPDH at the mRNA level in FTC133 and BCPAP cells, (n=3-4, p=0.0005).
D) Plasmid induced overexpression of mGPDH at the protein level in FTC133 and BCPAP cells.
E) Metformin treatment (5mmol/48h) is associated with decreased expression of mGPDH mRNA in control FTC133 (n=4, p=0.001) and mGPDH-overexpressing FTC133 cells, (n=4, p=0.03).
F) mGPDH-overexpression is associated with increased FTC133 thyroid cancer cell growth and sensitizes FTC133 cells to metformin growth inhibitory effects, (n=10-11, p=0.003).
G) Significant increase in basal and maximum respiration and ATP production in mGPDH-overexpressing FTC133 compared with control cells and increased sensitivity to OXPHOS inhibitory effects of metformin (5mmol/48h), (n=6-9); (Supplemental Table 2).
H) Metformin treatment (5mmol/48h) is associated with decreased expression of mGPDH mRNA in control BCPAP cells (n=4, p=0.002), but not in plasmid induced mGPDH-overexpressing BCPAP cells, (n=4, p=0.27).
I) mGPDH-overexpression is associated with increased BCPAP cell growth and sensitizes BCPAP cells to metformin growth inhibitory effects, (n=10-11, p<0.0001).
J) Significant increase in basal respiration and ATP production in mGPDH-overexpressing BCPAP compared with control cells and increased sensitivity to OXPHOS inhibitory effects of metformin (5mmol/48h). The basal respiration of mGPDH-overexpressing BCPAP cells operates on maximum capacity, as adding the uncoupler–FCCP–does not stimulate mitochondrial respiration any further, (n=6-9), (Supplemental Table 2).
T3=triiodothyronine 100nM/72h; V=control cells transfected with empty vector; OE=cells with mGPDH-overexpression; M5=metformin 5mmol/48h.
mGPDH overexpression was associated with increased thyroid cancer cell proliferation by 13±3.5% in FTC133 cells and 37.4±5.8% in BCPAP cells (Figure 5 F, I). mGPDH overexpression lead to significant activation of baseline and maximal mitochondrial respiration as well as ATP production in FTC133 and BCPAP cells, with the net effect larger in BCPAP cells (Supplemental Figure 4 A, B). Of note, BCPAP cells with mGPDH overexpression were operating on maximal respiratory rate at baseline since FCCP addition did not further stimulate maximal respiration (Supplemental Figure 4 B). Similar effects of increased cancer cell mitochondrial respiration were observed after induction of mGPDH expression by T3 treatment (100nM/72h), (Supplemental Figure 4 C, D).
In plasmid induced mGPDH-overexpressing thyroid cancer cell lines, metformin treatment inhibited mGPDH expression only in FTC133 cells characterized by high endogenous mGPDH level, but not in BCPAP cells (Figure 5 E, H). Metformin inhibited cell proliferation by 42.2±3.5% in mGPDH-overexpressing FTC133 cells and by 36.5±3.5% in control cells (Figure 5F). The growth inhibitory effect of metformin in mGPDH-overexpressing cells was higher in the BCPAP model, with growth inhibition of 49.6±5.5% in mGPDH-overexpressing cells compared with 32.3±5.5% in control cells (Figure 5I). FTC133 and BCPAP cells with stable mGPDH overexpression were characterized by higher metformin induced inhibition of basal and maximal respiration as well as ATP production compared with control cells (Figure 5 G, J; Supplemental Table 2). The quantification of a net difference (delta) in the OCR-inhibitory effect of metformin in control and mGPDH-overexpressing cells is depicted in Supplemental Figure 4 E, F.
Similar effects were observed in FTC133 and BCPAP cells with T3-induced mGPDH overexpression (Supplemental Figure 5 A, B; Supplemental Table 3). The net difference in mitochondrial respiration inhibitory effects of metformin in control and T3-treated cells are summarized in Supplemental Figure 5 C, D.
Taken together, this data showed that overexpression of mGPDH in thyroid cancer cells shifts their metabolism to increased mitochondrial respiration and stimulates thyroid cancer cell proliferation. Therefore, thyroid cancer cells characterized by mGPDH overexpression are more sensitive to metformin induced inhibition of growth and OXPHOS.
Metformin treatment is associated with cancer growth inhibition in an FTC133 metastatic mouse model, but not in a BCPAP metastatic mouse model
We established a metastatic mouse model by tail vein injection of luciferase labeled FTC133 and BCPAP thyroid cancer cells into immunocompromised mice (17). This model results in the development of lungs metastases in 100% of the animals, and liver and bone metastases in a subset of mice. We began metformin therapy in these models once IVIS (In Vivo Imaging System) confirmed the development of lung metastases (2 weeks post-injection), (Figure 6 C, D). Metformin treatment led to a significant reduction in thyroid cancer metastatic growth in the FTC133 model, but not in the BCPAP model (Figure 6 A, B, E, G). A significantly lower proportion of metformin treated FTC133 mice developed liver metastases, while there was no difference in the rate of liver metastases in the BCPAP model (Figure 6 F, H). Most important, the growth inhibitory effects of metformin in vivo in the FTC133 model were achieved utilizing a metformin concentration reflecting a therapeutic concentration in humans – 7.9±3.9 μM. Metformin treated animals were characterized by significantly lower serum glucose levels than placebo-treated animals (FTC133 model – MF glucose 132.2±44.9 mg/dl vs placebo glucose 207.3±74.8 mg/dl, p<0.001; BCPAP model – MF glucose 126.3±67.9 mg/dl vs placebo glucose 171.5±85.6 mg/dl, p=0.049). There was no difference in the insulin level in control and metformin treated animals (FTC133 model – MF insulin 0.266±0.21 ng/ml vs placebo insulin 0.399±0.3 ng/ml, p=0.1; BCPAP model – MF insulin 0.53±0.49 ng/ml vs placebo insulin0.57±0.31 ng/ml, p=0.7).
Figure 6. Metformin inhibits growth of thyroid cancer metastases in FTC133 metastatic mouse model, but not in BCPAP metastatic mouse model.
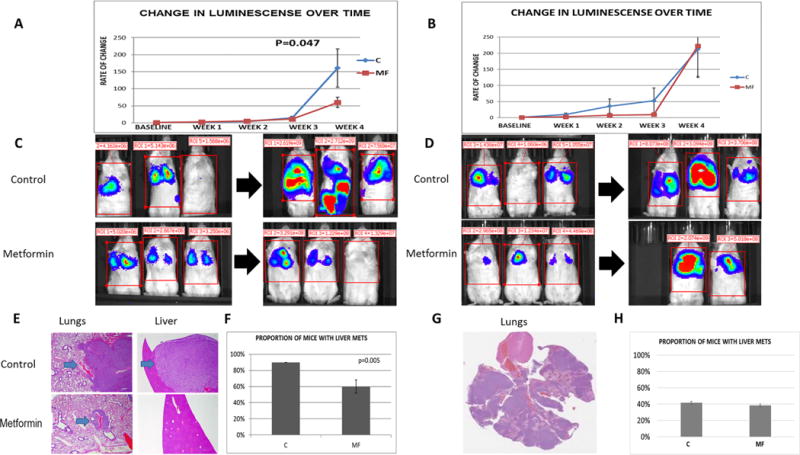
A) Significantly decreased growth rate of metastases in metformin treated mice (n=14) compared with placebo treated animals (n=13) documented by weekly bioluminescence measurement in FTC133 metastatic mouse model, p=0.046.
B) No difference in the growth rate of metastases in metformin treated mice (n=12) compared with placebo treated animals (n=13) documented by weekly bioluminescence measurement in BCPAP metastatic mouse model, p=0.6.
C) The representative images of the metastatic disease burden at the baseline and the end of the in vivo experiment in control and metformin treated animals in metastatic FTC133 mouse model.
D) The representative images of the metastatic disease burden at the baseline and the end of the in vivo experiment in control and metformin treated animals in metastatic BCPAP mouse model.
E) Representative hematoxylin-eosine (H-E) stained slides of lung and liver metastases derived from FTC133 metastatic mouse model in control, placebo treated and metformin treated animals.
F) Significantly lower rate of liver metastases in metformin treated mice compared with placebo treated animals in FTC133 metastatic mouse model, p=0.005.
G) Representative H-E stained slide of the lung metastases derived from BCPAP metastatic mouse model.
H) No difference in the liver metastases rate in metformin treated mice compared with placebo, p=0.8.
C=control placebo-treated animals; MF=metformin treated animals.
We analyzed mGPDH expression in the lung and liver metastases derived from the metastatic mouse models. In the FTC133 model, we found significantly lower mGPDH expression in tumors derived from metformin treated animals compared with robust expression of mGPDH in the placebo group (p=0.03), (Figure 7A). The mGPDH expression was very low (score 0 and 1) in metastases derived from the BCPAP model, without a significant difference in control and metformin-treated groups (p=0.51), (Figure 7B).
Figure 7. Significantly lower expression of mGPDH in metastatic lesions derived from FTC133 metastatic mouse model and thyroid tumor tissue derived from transgenic TRβPV/PVPten± mouse model with documented cancer growth and progression inhibitory effects of metformin.
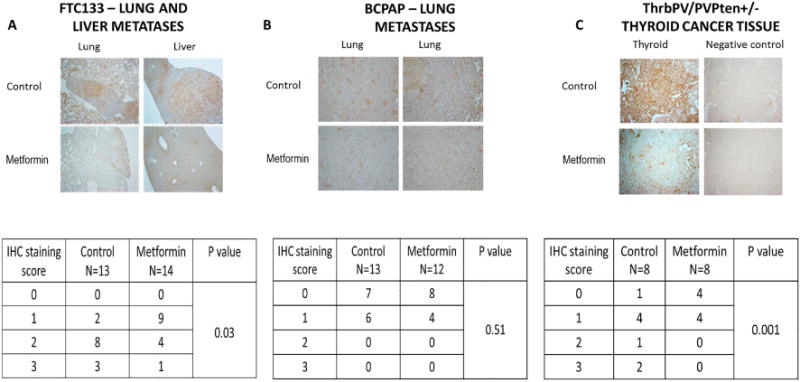
A) FTC133-metastatic mouse model – significantly lower expression of mGPDH in lung and liver metastases derived from metformin treated (n=14) compared with placebo (n=13) treated mice, p=0.03.
B) BCPAP-metastatic mouse model – very low and comparable expression of mGPDH in lung metastases derived from metformin treated (n=12) and placebo (n=13) treated mice, p=0.51.
C) Transgenic TRβPV/PVPten± mouse model – significantly lower expression of mGPDH in thyroid tumor tissue derived from metformin treated (n=8) compared with placebo (n=8) treated mice, p=0.001.
We next examined mGPDH expression in a transgenic TRβPV/PVPten± mouse model, which spontaneously develops FTC, characterized by increased tumor aggressiveness when subjected to high fat diet-induced obesity. Metformin was found to block the progression of thyroid cancer in this model (22). We obtained thyroid cancer tissue samples from TRβPV/PVPten± mice derived from control and metformin treated animals. We found a significantly higher expression of mGPDH in the control group compared with the metformin treated animals (p=0.001), (Figure 7C).
In summary, we demonstrated the inhibitory effects of metformin on both tumor growth and progression in two thyroid cancer in vivo models characterized by high tissue mGPDH expression, and lack of growth inhibitory effects of metformin in a metastatic mouse model characterized by low tissue mGPDH expression. Therefore, our in vitro and in vivo data suggest that mGPDH is a target of metformin in thyroid cancer and may serve as a potential biomarker of the response to metformin treatment (Supplementary Figure 6).
DISCUSSION
We demonstrate for the first time that mGPDH is overexpressed in thyroid cancer. We show that mGPDH overexpression leads to increased thyroid cancer cell growth and stimulation of mitochondrial respiration to meet the metabolic demands of increased proliferation. Conversely, we demonstrate mGPDH knockdown is associated with growth inhibition and reduction of OXPHOS. Our data show that mGPDH is a metformin target in thyroid cancer. Metformin treatment is associated with decreased mGPDH expression, inhibition of growth and mitochondrial respiration, as well as the shifting of cancer cell metabolism toward glycolysis. mGPDH silencing decreases sensitivity to the inhibition of OXPHOS and growth by metformin, while mGPDH overexpression sensitizes thyroid cancer cells to mitochondrial respiration and the growth inhibitory effects of metformin. We also show that in vivo metastatic and transgenic thyroid cancer models characterized by high tissue mGPDH expression are responsive to cancer progression-inhibitory effects of therapeutic concentrations of metformin, while metformin does not inhibit the growth of metastatic lesions in a metastatic thyroid cancer model characterized by low tumor tissue mGPDH expression.
To study the direct effects of metformin on potential intracellular targets in cancer cells, it is necessary to prove that metformin intracellular transporters are expressed. We found that thyroid cancer is characterized by a significant overexpression of OCT1 transporter. OCT1 has also been found to be overexpressed in other malignancies such as leukemia, prostate cancer, hepatocellular carcinoma, colorectal cancer or renal cell carcinoma (23–27). OCT1 downregulation limits the antineoplastic effects of metformin, further supporting the significant role of OCT1 expression in cancer response to metformin (28). The same metformin transporter plays a major role in metformin action in the liver (8).
mGPDH has been found to be a major metformin target in the liver, acting by shifting the NADH/NAD+ ratio via inhibition of glycerol-3-phosphate shuttle, directly blocking gluconeogenesis from glycerol and preventing clearance of cytosolic NADH, impairing glucose production from lactate (9). Interestingly, an mGPDH knockdown in vivo model recapitulated the effects of metformin treatment, and metformin had no additional gluconeogenesis inhibitory function in these animals (9). Of note, this landmark study documented that metformin induced non-competitive inhibition of the enzymatic activity of mGPDH, but did not investigate the role of metformin in regulating mGPDH expression (9). One of the reasons for non-competitive inhibition is decreased expression of the enzyme. We now demonstrate that metformin inhibits mGPDH activity and expression at the mRNA and protein level. The proposed mechanism of inhibition of mGPDH enzymatic activity is via conformational change at the FAD/FADH molecule of the mGPDH enzyme complex as suggested by Madiraju et al (9).
It was not known whether mGPDH could act as a molecular target of metformin in cancer. In fact, several other mechanisms of metformin action in cancer have been identified, including activation of the intracellular energy sensor AMPK and LKB1-AMPK induced inhibition of Raptor–mTOR (mammalian TOR complex 1 (mTORC1)) complex, leading to suppression of cellular protein synthesis and growth. Several studies suggest that the major mechanism of induction of energetic stress in cancer cells leading to activation of AMPK is metformin-induced inhibition of mitochondrial complex I (29,30). AMPK-independent mechanisms of metformin action have also been described, such as the inhibitory effect on AKT phosphorylation in breast and lung cancers, suppression of HER2 oncoprotein, suppression of NF-κB and CREB signaling, direct inhibition of hexokinase 2 and indirect inhibition of IGFR signaling due to decreased plasma concentrations of insulin (31,32).
Our study, demonstrating the role of mGPDH as a metformin target in thyroid cancer cells, facilitates our understanding of a cross-talk between major signaling pathways and cancer metabolism. Acknowledging the role of mGPDH in the glycerol-3-phosphate shuttle connecting the major cancer metabolic pathways – glycolysis with OXPHOS – underscores its potentially important role in shifting the metabolic phenotype of cancer cells. There have been major discoveries in cancer metabolism recently, including identification of the “reverse Warburg effect” – the cross-talk between glycolysis dependent cancer cells and a population of cancer cells characterized by a high level of OXPHOS (33,34). Cancer cells behave as metabolic parasites with glycolysis dependent cells shifting the glycolysis end-product L-Lactate to another subpopulation of cancer cells characterized by active mitochondrial respiration. L-Lactate is then utilized to fuel OXPHOS-based energy production required for cancer growth (33,34). Birsoy et al. documented a significant role of OXPHOS as a metabolic pathway warranting optimal cancer cell proliferation specifically in low glucose conditions (35). The authors postulated that cell lines characterized by impaired glucose utilization or mtDNA mutation in complex I genes are the most sensitive to biguanide action, such as phenformin, in in vitro and in vivo xenograft models. We found that the cells characterized by increased OXPHOS were more vulnerable to growth and OXPHOS-inhibitory effects of metformin. These data are consistent with the observation by Javeshghani et al., who showed that the cells that are forced to rely on OXPHOS are more affected by the actions of metformin (36). We demonstrate that one of the mechanisms of sensitivity to metformin is modulated via mGPDH expression and enzymatic activity. Therefore, targeting mGPDH as an important factor that is involved in the regulation of OXPHOS and shifting cancer metabolism towards glycolysis might be an effective strategy against cancer.
Our study revealed significant mGPDH overexpression in a large number of human thyroid cancer tissue samples. There are very limited published data on mGPDH expression in cancer. Studies from the early 70s have documented significantly higher expression of mGPDH in Novikoff hepatoma compared with the normal liver (37), while more recent studies document mGPDH overexpression in prostate cancer and prostate cancer cell lines (38,39).
With mGPDH expression regulated by thyroid hormones, predominantly T3, it is worthwhile to speculate that our observation of significant mGPDH overexpression in thyroid cancer tissue samples might be partially due to the fact that the majority of intermediate and high-risk thyroid cancer patients are treated with the supra-physiologic doses of thyroid hormones in order to achieve TSH suppression. Unfortunately, we did not have data on the thyroid hormone levels available to correlate mGPDH tissue expression with free T4 and T3 serum levels in a cohort of patients whose tissue samples were analyzed. We demonstrate that T3 treatment results in increased mGPDH expression in thyroid cancer cells and leads to OXPHOS activation in thyroid cancer cell lines, particularly those characterized by low baseline mGPDH and OXPHOS levels. A similar observation documenting T3-induced mGPDH overexpression in Moris hepatoma, characterized by low baseline mGPDH level, but not in Novikoff hepatoma, characterized by baseline high mGPDH expression, was reported in the early 70s by Hunt et al. (37).
Our in vivo models further support the role of mGPDH as a metformin target as evidenced by cancer growth and progression inhibitory effects of metformin in metastatic and transgenic mouse models characterized by high tumor tissue mGPDH expression, and lack thereof in a metastatic mouse model characterized by low mGPDH expression. Moreover, metformin treatment was associated with a significant reduction in tumor tissue mGPDH expression in mGPDH-rich metastatic and transgenic mouse models. Metformin treated mice were characterized by significantly lower serum glucose levels than control animals. Our data suggest that glycemia did not play a major role in modulating cancer growth inhibitory effects of metformin, since lower metformin-induced glucose levels were observed in both metastatic mouse models, one characterized by a significant inhibition of cancer progression (FTC133) and the other without the growth inhibitory effects of metformin (BCPAP). Shen at al. documented that metformin inhibits glucose uptake by cancer cells as shown by 18FDG-PET imaging in PTC subcutaneous xenograft models (KTC1 and BCPAP cells) (40). In this study, the authors did not provide information on cancer growth in vivo nor information about the serum glucose levels which could have significantly affected 18FDG-PET imaging (41).
Several studies have suggested indirect cancer progression inhibitory effects of metformin in vivo via reduction of serum insulin levels leading to decreased IGFR signaling (31,32). Our study suggests that this mechanism of metformin action may not play a key role in thyroid cancer metastatic mouse models since, although we observed lower insulin levels in metformin treated animals compared with placebo, the difference was not statistically significant. To the best of our knowledge, there are no other studies testing the role of metformin in thyroid cancer metastatic mouse models.
In conclusion, based on in vitro and in vivo functional studies, we demonstrated that mGPDH is overexpressed in thyroid cancer and serves as a metformin target. Metformin induced inhibition of mGPDH leads to a shift in thyroid cancer metabolism with significant inhibition of OXPHOS and ATP production. High tumor tissue mGPDH expression may predict susceptibility to the growth inhibitory effects of metformin in vivo. Our observations may have a significant impact for an individualized approach to cancer therapy. Clinical trials in humans will be necessary to confirm the role of mGPDH as a predictor of response to metformin therapy.
Supplementary Material
STATEMENT OF TRANSLATIONAL RELEVANCE.
The antidiabetic drug metformin has been shown to be an effective anti-cancer agent in numerous studies. We previously demonstrated that metformin-treated diabetic patients were characterized by smaller thyroid cancer size, higher complete remission rate and longer progression-free survival than diabetics not treated with metformin. In the present study, we provide evidence that mGPDH is a target of metformin in thyroid cancer. We demonstrate for the first time that not only does mGPDH regulate human thyroid cancer cell growth and metabolism, but the susceptibility to the growth inhibitory effects of metformin in thyroid cancer depends on the level of mGPDH expression. Our observations may have a significant impact for an individualized approach to cancer therapy since high tumor tissue mGPDH expression may predict susceptibility to the growth inhibitory effects of metformin in vivo. The study also creates a scope to test metformin efficacy in other cancers characterized by high mGPDH expression.
Acknowledgments
We thank all co-workers who supported this work at our institution, with special thanks to Oksana Gavrilova – NIDDK Animal Core Facility, Kristopher Krausz – NCI Mass Spectrometry Core Facility, Matthew Breymaier – assistance with TCGA database, Jeongwon Park and Sunmi Park – preparation of tissue samples derived from the TRβPV/PVPten± mouse model, and Lee Weinstein –critical analysis of the manuscript.
Financial support information: NIH intramural grant DK075140
Footnotes
Conflict of interest statement: The authors have declared that no conflict of interest exists
References
- 1.Gandini S, Puntoni M, Heckman-Stoddard BM, Dunn BK, Ford L, DeCensi A, et al. Metformin and cancer risk and mortality: a systematic review and meta-analysis taking into account biases and confounders. Cancer prevention research (Philadelphia, Pa) 2014;7:867–85. doi: 10.1158/1940-6207.CAPR-13-0424. [DOI] [PMC free article] [PubMed] [Google Scholar]
- 2.Landman GW, Kleefstra N, van Hateren KJ, Groenier KH, Gans RO, Bilo HJ. Metformin associated with lower cancer mortality in type 2 diabetes: ZODIAC-16. Diabetes care. 2010;33:322–6. doi: 10.2337/dc09-1380. [DOI] [PMC free article] [PubMed] [Google Scholar]
- 3.Libby G, Donnelly LA, Donnan PT, Alessi DR, Morris AD, Evans JM. New users of metformin are at low risk of incident cancer: a cohort study among people with type 2 diabetes. Diabetes care. 2009;32:1620–5. doi: 10.2337/dc08-2175. [DOI] [PMC free article] [PubMed] [Google Scholar]
- 4.Bo S, Ciccone G, Rosato R, Villois P, Appendino G, Ghigo E, et al. Cancer mortality reduction and metformin: a retrospective cohort study in type 2 diabetic patients. Diabetes, obesity & metabolism. 2012;14:23–9. doi: 10.1111/j.1463-1326.2011.01480.x. [DOI] [PubMed] [Google Scholar]
- 5.Ma SJ, Zheng YX, Zhou PC, Xiao YN, Tan HZ. Metformin use improves survival of diabetic liver cancer patients: systematic review and meta-analysis. Oncotarget. 2016;7:66202–11. doi: 10.18632/oncotarget.11033. [DOI] [PMC free article] [PubMed] [Google Scholar]
- 6.Effect of intensive blood-glucose control with metformin on complications in overweight patients with type 2 diabetes (UKPDS 34). UK Prospective Diabetes Study (UKPDS) Group. Lancet (London, England) 1998;352:854–65. [PubMed] [Google Scholar]
- 7.Baur DM, Klotsche J, Hamnvik OP, Sievers C, Pieper L, Wittchen HU, et al. Type 2 diabetes mellitus and medications for type 2 diabetes mellitus are associated with risk for and mortality from cancer in a German primary care cohort. Metabolism: clinical and experimental. 2011;60:1363–71. doi: 10.1016/j.metabol.2010.09.012. [DOI] [PubMed] [Google Scholar]
- 8.Daugan M, Dufay Wojcicki A, d’Hayer B, Boudy V. Metformin: An anti-diabetic drug to fight cancer. Pharmacological research. 2016;113:675–85. doi: 10.1016/j.phrs.2016.10.006. [DOI] [PubMed] [Google Scholar]
- 9.Madiraju AK, Erion DM, Rahimi Y, Zhang XM, Braddock DT, Albright RA, et al. Metformin suppresses gluconeogenesis by inhibiting mitochondrial glycerophosphate dehydrogenase. Nature. 2014;510:542–6. doi: 10.1038/nature13270. [DOI] [PMC free article] [PubMed] [Google Scholar]
- 10.Mracek T, Drahota Z, Houstek J. The function and the role of the mitochondrial glycerol-3-phosphate dehydrogenase in mammalian tissues. Biochimica et biophysica acta. 2013;1827:401–10. doi: 10.1016/j.bbabio.2012.11.014. [DOI] [PubMed] [Google Scholar]
- 11.Cairns RA, Harris IS, Mak TW. Regulation of cancer cell metabolism. Nature reviews Cancer. 2011;11:85–95. doi: 10.1038/nrc2981. [DOI] [PubMed] [Google Scholar]
- 12.cancer facts and figures 2016
- 13.Saiselet M, Floor S, Tarabichi M, Dom G, Hebrant A, van Staveren WC, et al. Thyroid cancer cell lines: an overview. Frontiers in endocrinology. 2012;3:133. doi: 10.3389/fendo.2012.00133. [DOI] [PMC free article] [PubMed] [Google Scholar]
- 14.Klubo-Gwiezdzinska J, Costello J, Jr, Patel A, Bauer A, Jensen K, Mete M, et al. Treatment with metformin is associated with higher remission rate in diabetic patients with thyroid cancer. The Journal of clinical endocrinology and metabolism. 2013;98:3269–79. doi: 10.1210/jc.2012-3799. [DOI] [PubMed] [Google Scholar]
- 15.Bikas A, Jensen K, Patel A, Costello J, Jr, McDaniel D, Klubo-Gwiezdzinska J, et al. Glucose-deprivation increases thyroid cancer cells sensitivity to metformin. Endocrine-related cancer. 2015;22:919–32. doi: 10.1530/ERC-15-0402. [DOI] [PubMed] [Google Scholar]
- 16.Kotian S, Zhang L, Boufraqech M, Gaskins K, Gara SK, Quezado M, et al. Dual Inhibition of HDAC and Tyrosine Kinase Signaling Pathways with CUDC-907 Inhibits Thyroid Cancer Growth and Metastases. Clin Cancer Res. 2017;23:5044–54. doi: 10.1158/1078-0432.CCR-17-1043. [DOI] [PMC free article] [PubMed] [Google Scholar]
- 17.Zhang L, Gaskins K, Yu Z, Xiong Y, Merino MJ, Kebebew E. An in vivo mouse model of metastatic human thyroid cancer. Thyroid : official journal of the American Thyroid Association. 2014;24:695–704. doi: 10.1089/thy.2013.0149. [DOI] [PMC free article] [PubMed] [Google Scholar]
- 18.Schindelin J, Arganda-Carreras I, Frise E, Kaynig V, Longair M, Pietzsch T, et al. Fiji: an open-source platform for biological-image analysis. Nature methods. 2012;9:676–82. doi: 10.1038/nmeth.2019. [DOI] [PMC free article] [PubMed] [Google Scholar]
- 19.Klubo-Gwiezdzinska J, Jensen K, Costello J, Patel A, Hoperia V, Bauer A, et al. Metformin inhibits growth and decreases resistance to anoikis in medullary thyroid cancer cells. Endocrine-related cancer. 2012;19:447–56. doi: 10.1530/ERC-12-0046. [DOI] [PubMed] [Google Scholar]
- 20.Catalani S, Palma F, Battistelli S, Benedetti S. Oxidative stress and apoptosis induction in human thyroid carcinoma cells exposed to the essential oil from Pistacia lentiscus aerial parts. PloS one. 2017;12:e0172138. doi: 10.1371/journal.pone.0172138. [DOI] [PMC free article] [PubMed] [Google Scholar]
- 21.Weitzel JM, Kutz S, Radtke C, Grott S, Seitz HJ. Hormonal regulation of multiple promoters of the rat mitochondrial glycerol-3-phosphate dehydrogenase gene: identification of a complex hormone-response element in the ubiquitous promoter B. European journal of biochemistry. 2001;268:4095–103. doi: 10.1046/j.1432-1327.2001.02332.x. [DOI] [PubMed] [Google Scholar]
- 22.Park J, Kim WG, Zhao L, Enomoto K, Willingham M, Cheng SY. Metformin blocks progression of obesity-activated thyroid cancer in a mouse model. Oncotarget. 2016;7:34832–44. doi: 10.18632/oncotarget.8989. [DOI] [PMC free article] [PubMed] [Google Scholar]
- 23.Stefanko E, Rybka J, Jazwiec B, Haus O, Stapor S, Kuliczkowski K, et al. Significance of OCT1 Expression in Acute Myeloid Leukemia. Pathology oncology research : POR. 2017;23:665–71. doi: 10.1007/s12253-016-0161-7. [DOI] [PubMed] [Google Scholar]
- 24.Obinata D, Takayama K, Fujiwara K, Suzuki T, Tsutsumi S, Fukuda N, et al. Targeting Oct1 genomic function inhibits androgen receptor signaling and castration-resistant prostate cancer growth. Oncogene. 2016;35:6350–8. doi: 10.1038/onc.2016.171. [DOI] [PubMed] [Google Scholar]
- 25.Grimm D, Lieb J, Weyer V, Vollmar J, Darstein F, Lautem A, et al. Organic Cation Transporter 1 (OCT1) mRNA expression in hepatocellular carcinoma as a biomarker for sorafenib treatment. BMC cancer. 2016;16:94. doi: 10.1186/s12885-016-2150-3. [DOI] [PMC free article] [PubMed] [Google Scholar]
- 26.Wang YP, Song GH, Chen J, Xiao C, Li C, Zhong L, et al. Elevated OCT1 participates in colon tumorigenesis and independently predicts poor prognoses of colorectal cancer patients. Tumour biology : the journal of the International Society for Oncodevelopmental Biology and Medicine. 2016;37:3247–55. doi: 10.1007/s13277-015-4080-0. [DOI] [PMC free article] [PubMed] [Google Scholar]
- 27.Hagos Y, Wegner W, Kuehne A, Floerl S, Marada VV, Burckhardt G, et al. HNF4alpha induced chemosensitivity to oxaliplatin and 5-FU mediated by OCT1 and CNT3 in renal cell carcinoma. Journal of pharmaceutical sciences. 2014;103:3326–34. doi: 10.1002/jps.24128. [DOI] [PubMed] [Google Scholar]
- 28.Segal ED, Yasmeen A, Beauchamp MC, Rosenblatt J, Pollak M, Gotlieb WH. Relevance of the OCT1 transporter to the antineoplastic effect of biguanides. Biochemical and biophysical research communications. 2011;414:694–9. doi: 10.1016/j.bbrc.2011.09.134. [DOI] [PubMed] [Google Scholar]
- 29.Owen MR, Doran E, Halestrap AP. Evidence that metformin exerts its anti-diabetic effects through inhibition of complex 1 of the mitochondrial respiratory chain. The Biochemical journal. 2000;348(Pt 3):607–14. [PMC free article] [PubMed] [Google Scholar]
- 30.Wheaton WW, Weinberg SE, Hamanaka RB, Soberanes S, Sullivan LB, Anso E, et al. Metformin inhibits mitochondrial complex I of cancer cells to reduce tumorigenesis. eLife. 2014;3:e02242. doi: 10.7554/eLife.02242. [DOI] [PMC free article] [PubMed] [Google Scholar]
- 31.Lei Y, Yi Y, Liu Y, Liu X, Keller ET, Qian CN, et al. Metformin targets multiple signaling pathways in cancer. Chinese journal of cancer. 2017;36:17. doi: 10.1186/s40880-017-0184-9. [DOI] [PMC free article] [PubMed] [Google Scholar]
- 32.Salani B, Del Rio A, Marini C, Sambuceti G, Cordera R, Maggi D. Metformin, cancer and glucose metabolism. Endocrine-related cancer. 2014;21:R461–71. doi: 10.1530/ERC-14-0284. [DOI] [PubMed] [Google Scholar]
- 33.Martinez-Outschoorn UE, Pestell RG, Howell A, Tykocinski ML, Nagajyothi F, Machado FS, et al. Energy transfer in “parasitic” cancer metabolism: mitochondria are the powerhouse and Achilles’ heel of tumor cells. Cell cycle (Georgetown, Tex) 2011;10:4208–16. doi: 10.4161/cc.10.24.18487. [DOI] [PMC free article] [PubMed] [Google Scholar]
- 34.Fu Y, Liu S, Yin S, Niu W, Xiong W, Tan M, et al. The reverse Warburg effect is likely to be an Achilles’ heel of cancer that can be exploited for cancer therapy. Oncotarget. 2017 doi: 10.18632/oncotarget.18175. [DOI] [PMC free article] [PubMed] [Google Scholar]
- 35.Birsoy K, Possemato R, Lorbeer FK, Bayraktar EC, Thiru P, Yucel B, et al. Metabolic determinants of cancer cell sensitivity to glucose limitation and biguanides. Nature. 2014;508:108–12. doi: 10.1038/nature13110. [DOI] [PMC free article] [PubMed] [Google Scholar]
- 36.Andrzejewski S, Gravel SP, Pollak M, St-Pierre J. Metformin directly acts on mitochondria to alter cellular bioenergetics. Cancer & metabolism. 2014;2:12. doi: 10.1186/2049-3002-2-12. [DOI] [PMC free article] [PubMed] [Google Scholar]
- 37.Hunt SM, Osnos M, Rivlin RS. Thyroid hormone regulation of mitochondrial alpha-glycerophosphate dehydrogenase in liver and hepatoma. Cancer research. 1970;30:1764–8. [PubMed] [Google Scholar]
- 38.Chowdhury SK, Gemin A, Singh G. High activity of mitochondrial glycerophosphate dehydrogenase and glycerophosphate-dependent ROS production in prostate cancer cell lines. Biochemical and biophysical research communications. 2005;333:1139–45. doi: 10.1016/j.bbrc.2005.06.017. [DOI] [PubMed] [Google Scholar]
- 39.Chowdhury SK, Raha S, Tarnopolsky MA, Singh G. Increased expression of mitochondrial glycerophosphate dehydrogenase and antioxidant enzymes in prostate cancer cell lines/cancer. Free radical research. 2007;41:1116–24. doi: 10.1080/10715760701579314. [DOI] [PubMed] [Google Scholar]
- 40.Shen CT, Wei WJ, Qiu ZL, Song HJ, Zhang XY, Sun ZK, et al. Metformin reduces glycometabolism of papillary thyroid carcinoma in vitro and in vivo. Journal of molecular endocrinology. 2017;58:15–23. doi: 10.1530/JME-16-0134. [DOI] [PubMed] [Google Scholar]
- 41.Rabkin Z, Israel O, Keidar Z. Do hyperglycemia and diabetes affect the incidence of false-negative 18F-FDG PET/CT studies in patients evaluated for infection or inflammation and cancer? A Comparative analysis. Journal of nuclear medicine : official publication, Society of Nuclear Medicine. 2010;51:1015–20. doi: 10.2967/jnumed.109.074294. [DOI] [PubMed] [Google Scholar]
Associated Data
This section collects any data citations, data availability statements, or supplementary materials included in this article.