

Abstract
This study aimed to investigate the effects of miR-93 on resistance of breast cancer MCF-7 cells to adriamycin, and to explore the possible mechanism. Expression of miR-93 in breast cancer cell lines MCF-7 and MCF-7/ADM was detected by reverse transcription-quantitative PCR (RT-qPCR). miR-93 mimics and inhibitors were transfected into MCF-7/ADM and MCF-7 cells, and MTT assay was used to detect the resistance of cells to adriamycin after transfection. Western blot analysis was used to detect the expression of anti-apoptotic protein Bcl-2 and multidrug resistance gene MDR1 related P-gp protein in MCF-7/ADM and MCF-7 cells before and after the transfection of miR-93 mimics. Expression level of miR-93 in MCF-7/ADM cells was decreased, and was 40% of that in MCF-7 cells (0.39±0.04, p<0.05). Before transfection, IC50 value of MCF-7 cells to adriamycin (11.02±0.95) was lower than that of MCF-7/ADM cells (21.29±1.83, p<0.05). IC50 value of MCF-7/ADR cells at 72 h after transfection with miR-93 mimics (13.55±0.86) was lower than that of the negative control group (24.67±1.51, p<0.05). IC50 value of MCF-7 cells 72 h after transfection with miR-93 inhibitor (19.88±1.28) was higher than that of negative control group (11.02±0.95, p<0.05). Expression levels of Bcl-2 and P-gp proteins in MCF-7/ADM cells were 1.63±0.24 and 1.76±0.22 times that of MCF-7 cells, respectively (p<0.05). At 72 h after transfection of miR-93 mimics, expression levels of Bcl-2 and P-gp proteins in MCF-7/ADM cells were 0.27±0.06 and 0.39±0.05, respectively, compared with the negative control group (p<0.05). At 72 h after transfection with miR-93 inhibitor, expression levels of Bcl-2 and P-gp protein in MCF-7 cells were 1.48±0.10 and 1.56±0.11 times of the negative control group, respectively (p<0.05). miR-93 can increase the apoptosis of MCF-7/ADM cells and their resistance to adriamycin by inhibiting the expression of Bcl-2 and P-gp proteins.
Keywords: miR-93, adriamycin resistance, Bcl-2, P-gp, breast cancer
Introduction
Breast cancer is the most common malignant tumor in women with increasing incidence in China. Breast cancer is a serious threat to women's health and brings serious economic burdens to society and families (1). Main methods of clinical treatment of breast cancer are surgery, radiotherapy and chemotherapy, among which combination of adriamycin with other drugs is commonly used in clinical practices (1). However, for patients with advanced breast cancer, prognosis of this treatment plan is poor, and recurrence and metastasis are prone to occur. An important reason for treatment failure is resistance of cancer cells to adriamycin (2). miRNAs are single-stranded, non-coding small RNAs consisting of 18–25 nucleotides, and they exist in eukaryotes and exert their roles in the development and progression of tumors by up- or downregulating the expression of certain important proteins (3). Studies suggest that miRNAs can regulate the occurrence and development of tumor and their resistance to chemotherapeutic agents (4). For example, miR100 and miR-367 are upregulated in adriamycin-resistant tumor cells (5,6). Chu et al showed that expression of miR-93 in breast cancer cells can affect its resistance to chemotherapeutic drugs (7).
In this study, the expression of miR-93 in breast cancer cell line MCF-7 and adriamycin-resistant cell line MCF-7/ADM was detected. miR-93 was transfected into cancer cells to examine the effect of miR-93 on the resistance of MCF-7/ADM cells to adriamycin, and to explore the possible mechanism of action of miR-93. Our findings provide new insights for the clinical treatment of adriamycin-resistant breast cancer patients.
Materials and methods
Materials
MCF-7/ADM and MCF-7 cell lines were purchased from Aolushengwu (https://aolushengwu.biomart.cn/, Shanghai, China). Human breast cancer azithromycin-resistant cell lines (MCF-7/ADM) were purchased from Shanghai Zhen Biotechnology (Shanghai, China). miR-93 mimics, inhibitor, and primers were purchased from Thermo Fisher Scientific, Inc. Waltham, MA, USA). Adriamycin, fetal bovine serum, thiazolyl (MTT) and RPMI-1640 medium were purchased from Sigma-Aldrich (St. Louis, MO, USA). Dimethyl sulfoxide (DMSO), reverse transcription kit, real-time-quantitative PCR (RT-qPCR) kit, Bcl-2 antibody, P-gp antibody, GAPDH antibody, β-actin were purchased from Cell Signaling Technology, Inc. (Danvers, MA, USA). TRIzol kit, liposomes (Lipofectamine 2000), U6 snRNA real-time PCR kit which were purchased from Invitrogen (Thermo Fisher Scientific, Inc., Carlsbad, CA, USA).
The study was approved by the Ethics Committee of Shandong Provincial Hospital affiliated to Shandong University (Jinan, China).
Cell culture
MCF-7/ADM and MCF-7 cells were cultured in RPMI-1640 medium (containing 10% fetal bovine serum) at 37°C with 5% CO2, and 1 µg/ml of adriamycin was added to MCF-7/ADM culture medium. Subculture was performed every 3 to 4 days.
Detection of miR-93 expression by RT-qPCR
U6 snRNA was used as the endogenous control to measure the relative expression level of miR-93. MCF-7 and MCF-7/ADM cells were collected, and TRIzol reagent was used to extract total RNA. Total RNA was reversely transcribed into cDNA and the reaction conditions were: 37°C for 40 min, 85°C for 40 sec, using cDNA as a template and using miR-93 primers for PCR amplification. PCR reaction conditions were: 94°C for 2 min, followed by 50 cycles of 94°C for 30 sec, 55°C for 30 sec, and 72°C for 30 sec. Cq values were processed using 2−ΔΔCq method to calculate the relative expression level of miR-93 (8). miR-93 primer sequences were: 5′-UUCUCCGAACGUGUCACGUTT-3′ (forward) and 5′-ACGUGACACGUUCGGAGAAATT-3′ (reverse).
Cell transfection
MCF-7 and MCF-7/ADM cells were seeded into 6-well plates and miR-93 mimics, inhibitor, and their negative controls were transfected into MCF-7 and MCF-7/ADM, respectively, using Lipofectamine 2000. After 6 h, cells were cultured for 48–96 h (37°C, 5% CO2) in fresh culture medium and harvested. RT-qPCR was used to detect mRNA expression, and reduced expression level of miRNA indicated the successful transfection.
MTT assay to detect the resistance of cancer cells to adriamycin
Transfected tumor cell suspension was inoculated into the microtiter wells of the test plates. After cell adherence, adriamycin was added to final concentrations of 5, 10, 20, 40, and 80 µg/ml, and control and blank control wells were set. Cells were cultured at 37°C with 5% CO2 for 72 h, then 20 µl MTT solution was added to each well, followed by cell culture for another 4 h. Finally, 100 µl DMSO was added to each well, and crystals were dissolved by shaking for 15 min. Absorbance of each well at a wavelength of 490 nm was measured with a microplate reader (Bio-Rad, Hercules, CA, USA). Cell growth inhibition rate = (absorbance of the control group - absorbance of the experimental group)/absorbance of the control group ×100%. IC50 value of adriamycin was calculated.
Western blot analysis to detect Bcl-2 and P-gp protein expression
MCF-7 and MCF-7/ADM cells were seeded into 6-well plates. MCF-7/ADM cells were transfected with miR-93 mimics and negative control groups, and total protein was extracted after 72 h of cell culture. Protein concentration was measured by BCA method. Then, 10% PAGE was performed to separate proteins, followed transmembrane to PVDE membrane. Blocking was performed using 5% skimmed milk powder (BSA). After washing with TBST (TBS + Tween) 3 times, rabbit polyclonal Bcl-2 antibody (dilution: 1/500; cat. no. ab59348) and rabbit polyclonal P-gp antibody (dilution: 1/500; cat. no. ab103477) were added and incubated for 12 h at 4°C. After washing with TBST 3 times, secondary goat anti-rabbit (HRP) IgG antibody (dilution: 1/2,000; cat. no. ab6721) was added and incubated for 2 h at room temperature. All the antibodies were purchased from Abcam (Cambridge, MA, USA) After washing with TBST 3 times, ECL reagent was added to develop signals, and ImageJ software was used to normalize the expression level of each protein to endogenous control GAPDH.
Statistical analysis
SPSS 13.0 software (SPSS, Inc., Chicago, IL, USA) was used for statistical analysis. Quantitative data were analyzed by t-test, and results were expressed as mean ± standard deviation. P-values indicate a two-sided probability, and test standard α was 0.05.
Results
Expression of miR-93 in MCF-7 and MCF-7/ADM cells
Results showed that expression level of miR-93 decreased in MCF-7/ADM cells, and the expression level was 40% (0.39±0.04) of that in MCF-7 cells, and the difference was statistically significant (p<0.05, Fig. 1).
Figure 1.
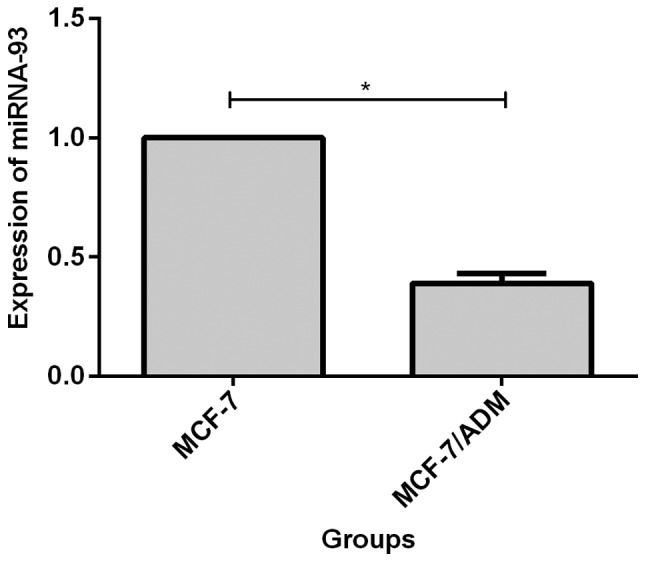
Expression of miR-93 in MCF-7 and MCF-7/ADM cells. RT-qPCR showed that the expression level of miR-93 in MCF-7/ADM cells was 40% (0.39±0.04) of that MCF-7 cells, and the difference was statistically significant, *P<0.05. RT-qPCR, reverse transcription-quantitative PCR.
Effect of miR-93 transfection on adriamycin resistance of MCF-7 and MCF-7/ADM cells
Before transfection, IC50 value of MCF-7 cells to adriamycin (11.02±0.95) was significantly lower than that of MCF-7/ADM cells (21.29±1.83, p<0.05, Fig. 2). IC50 value of MCF-7/ADM cells at 72 h after transfection of miR-93 mimics (12.71±0.54) was significantly lower than that of the negative control group (25.16±1.28, p<0.05, Fig. 3). IC50 was significantly higher in MCF-7 cells (19.88±1.28) at 72 h after transfection with miR-93 inhibitor than in negative control group (11.02±0.95, p<0.05, Fig. 4).
Figure 2.
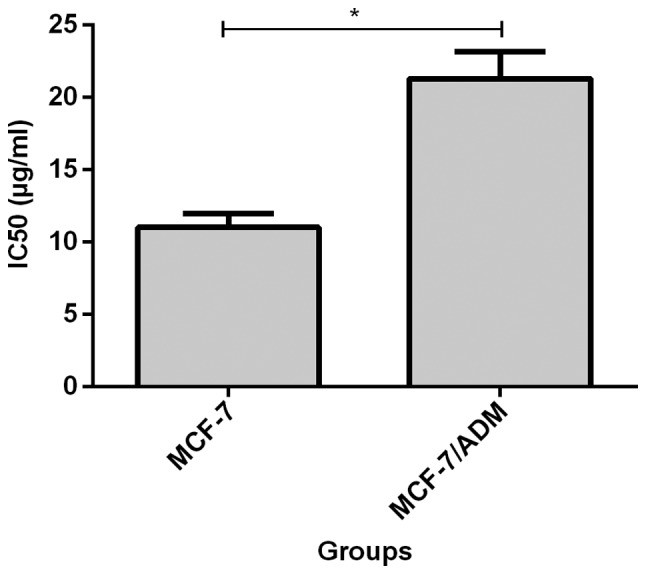
Comparison of adriamycin resistance of MCF-7 and MCF-7/ADM cells. Before transfection, IC50 value of MCF-7 cells to adriamycin (11.02±0.95) was lower than that of MCF-7/ADM cells (21.29±1.83), and the difference was statistically significant, *P<0.05.
Figure 3.
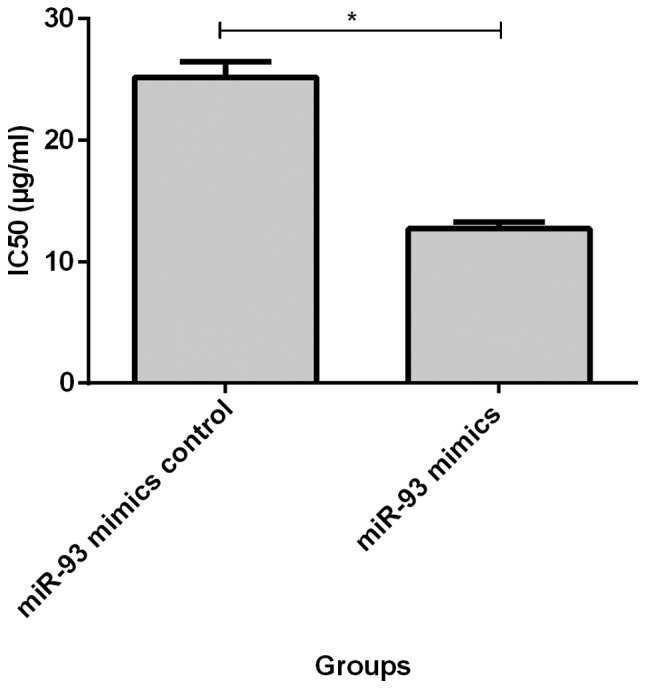
Resistance of MCF-7/ADM cells to adriamycin after transfection of miR-93 mimics. IC50 value of MCF-7/ADM cells after transfection of miR-93 mimics (12.71±0.54) was lower than that before transfection (25.16±1.28), and the difference was statistically significant, *P<0.05.
Figure 4.
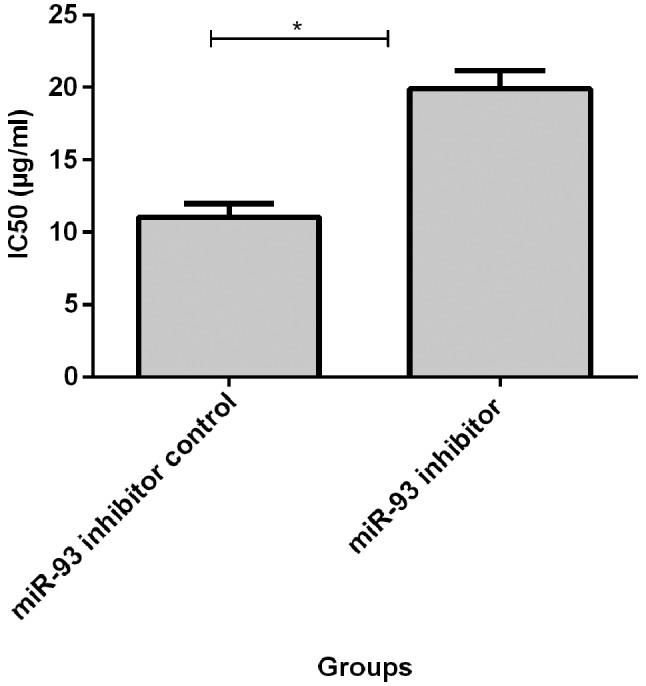
Adriamycin resistance of MCF-7 cells after transfection with miR-93 inhibitor. IC50 value was significantly higher in MCF-7 cells after transfection with miR-93 inhibitor (19.88±1.28), higher than that before transfection (11.02±0.95), *P<0.05.
Effect of miR-93 transfection on the expression of Bcl-2 and P-gp proteins in MCF-7 and MCF-7/ADM cells
Before transfection, expression levels of Bcl-2 and P-gp proteins in MCF-7/ADM cells were 1.63±0.24 and 1.76±0.22 times that of MCF-7 cells, respectively. The differences were statistically significant (p<0.05, Fig. 5). At 72 h after transfection of miR-93 mimics, the expression levels of Bcl-2 and P-gp protein in MCF-7/ADM cells were 0.27±0.06 and 0.39±0.05 times of those in the negative control group, and the differences were statistically significant (p<0.05, Fig. 6). At 72 h after transfection with miR-93 inhibitor, expression levels of Bcl-2 and P-gp protein in MCF-7 cells was 1.48±0.10 and 1.56±0.11 times of that of the negative control group, respectively, and the differences were statistically significant (p<0.05, Fig. 7).
Figure 5.
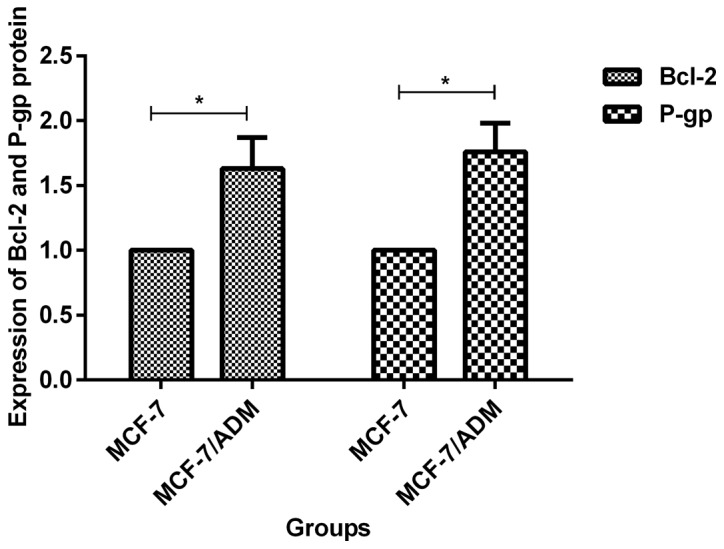
Expression of Bcl-2 and P-gp proteins in MCF-7 and MCF-7/ADM cells. Before transfection, expression levels of Bcl-2 and P-gp protein in MCF-7/ADM cells were (1.63±0.24, 1.76±0.22) times of those in MCF-7 cells. The differences were statistically significant, *P<0.05.
Figure 6.
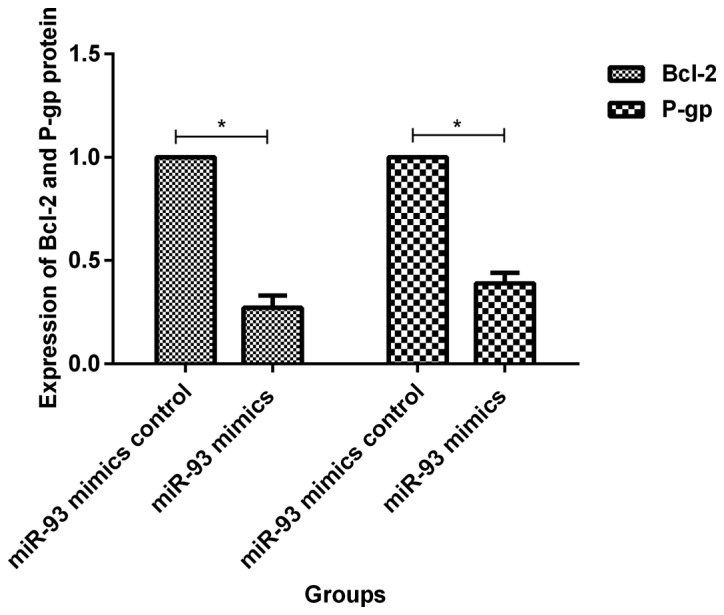
Expression of Bcl-2 and P-gp protein in MCF-7/ADM cells at 72 h after transfection of miR-93 mimics. Expression levels of Bcl-2 and P-gp proteins in MCF-7/ADM cells at 72 h after transfection of miR-93 mimics were (0.27±0.06, 0.39±0.05) times of those before transfection, and the differences were statistically significant, *P<0.05.
Figure 7.
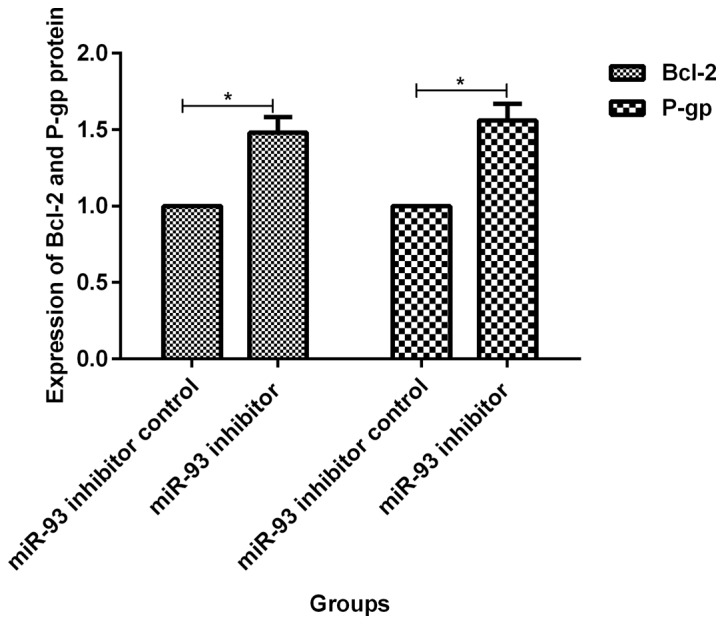
Expression of Bcl-2 and P-gp protein in MCF-7/ADM cells at 72 h after transfection of miR-93 inhibitor. Expression levels of Bcl-2 and P-gp proteins in MCF-7/ADM cells at 72 h after transfection of miR-93 inhibitor were higher than the control group (1.48±0.10, 1.56±0.11), and the differences were statistically significant, *P<0.05.
Discussion
The combinations of adriamycin and other drugs are widely used in the clinical treatment of breast cancer (1). Adriamycin is a kind of chemotherapeutic drug widely used in clinical practices (9). Due to the emergence of adriamycin resistance in breast cancer cells, patients with advanced breast cancer are prone to recurrence or metastasis after treatment, which reduces the therapeutic effect. Mechanism of development of drug resistance in tumor cells is complex and may be related to the expression and dysfunction of multiple genes (10).
miRNA is a non-coding RNA and plays an important role in the occurrence and development of tumors (5). Studies have shown that dysfunction of different miRNAs is closely related to tumor recurrence, metastasis, and drug resistance, suggesting that miRNAs can be used as gene targets for cancer therapy (7). Li et al (10) found that miR-106b can reverse the resistance of breast cancer cell lines. miR-93 expression in non-small cell lung cancer, gastric cancer, esophageal cancer, colon cancer tissue exist down phenomenon (11–14), in breast cancer cells can affect its resistance to chemotherapeutic drugs (7).
In this study, the differential expression of miR-93 in breast cancer cell lines MCF-7 and MCF-7/ADM was detected. miR-93 mimics and inhibitor were transfected into cancer cells to analyze the effect of miR-93 on the resistance of MCF-7/ADM cells to adriamycin, and to detect the expression of Bcl-2 and P-gp proteins before and after transfection, so as to explore the possible mechanism of the act of miR-93. All experiments were performed according to the manufacturer's instructions, so our data are reliable and accurate.
Results showed that the expression level of miR-93 decreased in MCF-7/ADM cells, indicating that miR-93 expression was downregulated in adriamycin-resistant breast cancer cells, which is consistent with the findings of Chu et al (7). Before transfection, IC50 values of MCF-7 cells to adriamycin were lower than MCF-7/ADM cells. After transfection of miR-93 mimics, IC50 value of MCF-7/ADM cells was lower than that before transfection. IC50 value of MCF-7 cells at 72 h after transfection with miR-93 inhibitor were higher than that before transfection, suggesting that transfection of miR-93 could increase the resistance of drug-resistant cells to adriamycin, which were consistent with the findings reported by previous studies (15–17).
P-gp is an expression product of multidrug resistance gene MDR. By combining with tumor chemotherapeutic drugs, P-gp pumped drugs out of the cell to reduce the concentration of drug in cells to produce drug resistance (18). In this study, expression level of P-gp in MCF-7/ADM cells was significantly higher than that in MCF-7 cells, so upregulated expression of P-gp may be related to the mechanism of drug resistance of tumor cells to adriamycin. Compared with negative control cells, tranfection with miR-93 mimics significantly reduced the expression level of P-gp in MCF-7/ADM cells. In addition, expression level of Bcl-2 protein in MCF-7/ADM cells before transfection was significantly higher than that in MCF-7 cells, and the expression level of Bcl-2 protein in MCF-7/ADM cells after transfection of miR-93 mimics was lower than that of negative control group. After transfection of miR-93 inhibitor into MCF-7 cells, expression levels of P-gp and Bcl-2 protein were higher than those of negative control group, indicating that the transfection of miR-93 can downregulate the expression of Bcl-2 and P-gp proteins, so as to reduce adriamycin resistance. Bcl-2 related anti-apoptotic gene (BAG) family is associated with the occurrence and prognosis of various tumors, and the expressed proteins have the functions of inhibiting apoptosis, promoting tumor cell proliferation and metastasis (19). The binding of BAG3 protein to anti-apoptotic protein Bcl-2 can regulate the apoptosis process and play an important role in development of drug resistance in malignant tumor cells (20,21).
This study shows that miR-93 is downregulated in adriamycin-resistant breast cancer cell lines. Upregulation of miR-93 can reduce the resistance of cells to adriamycin, and the mechanism of action may be related to the downregulated Bcl-2 and P-gp proteins expression. Therefore, our findings provide new insights for the treatment of breast cancer, and miR-93 may serve as a potential target for gene therapy.
Acknowledgements
Not applicable.
Funding
No funding was received.
Availability of data and materials
The datasets used and/or analyzed during the present study are available from the corresponding author on reasonable request.
Authors' contributions
QW drafted this manuscript. QW and CS were mainly devoted to cell transfection and MTT assay. CW and JL contributed to western blot analysis. All authors have read and approved the final manuscript.
Ethics approval and consent to participate
The study was approved by the Ethics Committee of Shandong Provincial Hospital affiliated to Shandong University (Jinan, China).
Patient consent for publication
Not applicable.
Competing interests
The authors declare that they have no competing interests.
References
- 1.Turati F, Carioli G, Bravi F, Ferraroni M, Serraino D, Montella M, Giacosa A, Toffolutti F, Negri E, Levi F, et al. Mediterranean diet and breast cancer risk. Nutrients. 2018;10:E326. doi: 10.3390/nu10030326. [DOI] [PMC free article] [PubMed] [Google Scholar]
- 2.Yang F, Zhao N, Wu N. TNFR2 promotes adriamycin resistance in breast cancer cells by repairing DNA damage. Mol Med Rep. 2017;16:2962–2968. doi: 10.3892/mmr.2017.6898. [DOI] [PubMed] [Google Scholar]
- 3.Gregory RI, Shiekhattar R. MicroRNA biogenesis and cancer. Cancer Res. 2005;65:3509–3512. doi: 10.1158/0008-5472.CAN-05-0298. [DOI] [PubMed] [Google Scholar]
- 4.Fang L, Li H, Wang L, Hu J, Jin T, Wang J, Yang BB. MicroRNA-17-5p promotes chemotherapeutic drug resistance and tumour metastasis of colorectal cancer by repressing PTEN expression. Oncotarget. 2014;10:2974–2987. doi: 10.18632/oncotarget.1614. [DOI] [PMC free article] [PubMed] [Google Scholar]
- 5.Danesh H, Hashemi M, Bizhani F, Hashemi SM, Bahari G. Association study of miR-100, miR-124-1, miR-218-2, miR-301b, miR-605, and miR-4293 polymorphisms and the risk of breast cancer in a sample of Iranian population. Gene. 2018;647:73–78. doi: 10.1016/j.gene.2018.01.025. [DOI] [PubMed] [Google Scholar]
- 6.Wang GC, He QY, Tong DK, Wang CF, Liu K, Ding C, Ji F, Zhang H. MiR-367 negatively regulates apoptosis induced by adriamycin in osteosarcoma cells by targeting KLF4. J Bone Oncol. 2016;5:51–56. doi: 10.1016/j.jbo.2016.02.002. [DOI] [PMC free article] [PubMed] [Google Scholar]
- 7.Chu S, Liu G, Xia P, Chen G, Shi F, Yi T, Zhou H. miR-93 and PTEN: Key regulators of doxorubicin-resistance and EMT in breast cancer. Oncol Rep. 2017;38:2401–2407. doi: 10.3892/or.2017.5859. [DOI] [PubMed] [Google Scholar]
- 8.Li BH, Yuan L, Shi RR, Wang JG. Reversal of adriamycin resistance by digoxin in human breast cancer cell line MCF-7/adriamycin and its mechanism. Sheng Li Xue Bao. 2015;67:611–617. (In Chinese) [PubMed] [Google Scholar]
- 9.Cao B, Li M, Zha W, Zhao Q, Gu R, Liu L, Shi J, Zhou J, Zhou F, Wu X, et al. Metabolomic approach to evaluating adriamycin pharmacodynamics and resistance in breast cancer cells. Metabolomics. 2013;9:960–973. doi: 10.1007/s11306-013-0517-x. [DOI] [PMC free article] [PubMed] [Google Scholar]
- 10.Li N, Miao Y, Shan Y, Liu B, Li Y, Zhao L, Jia L. MiR-106b and miR-93 regulate cell progression by suppression of PTEN via PI3K/Akt pathway in breast cancer. Cell Death Dis. 2017;8:e2796. doi: 10.1038/cddis.2017.119. [DOI] [PMC free article] [PubMed] [Google Scholar]
- 11.Yang W, Bai J, Liu D, Wang S, Zhao N, Che R, Zhang H. MiR-93-5p up-regulation is involved in non-small cell lung cancer cells proliferation and migration and poor prognosis. Gene. 2018;647:13–20. doi: 10.1016/j.gene.2018.01.024. [DOI] [PubMed] [Google Scholar]
- 12.Ma DH, Li BS, Liu JJ, Xiao YF, Yong X, Wang SM, Wu YY, Zhu HB, Wang DX, Yang SM. miR-93-5p/IFNAR1 axis promotes gastric cancer metastasis through activating the STAT3 signaling pathway. Cancer Lett. 2017;408:23–32. doi: 10.1016/j.canlet.2017.08.017. [DOI] [PubMed] [Google Scholar]
- 13.Ansari MH, Irani S, Edalat H, Amin R, Roushandeh Mohammadi A. Deregulation of miR-93 and miR-143 in human esophageal cancer. Tumour Biol. 2016;37:3097–3103. doi: 10.1007/s13277-015-3987-9. [DOI] [PubMed] [Google Scholar]
- 14.Yu XF, Zou J, Bao ZJ, Dong J. miR-93 suppresses proliferation and colony formation of human colon cancer stem cells. World J Gastroenterol. 2011;17:4711–4717. doi: 10.3748/wjg.v17.i42.4711. [DOI] [PMC free article] [PubMed] [Google Scholar]
- 15.Xiang Y, Liao XH, Yu CX, Yao A, Qin H, Li JP, Hu P, Li H, Guo W, Gu CJ, et al. MiR-93-5p inhibits the EMT of breast cancer cells via targeting MKL-1 and STAT3. Exp Cell Res. 2017;357:135–144. doi: 10.1016/j.yexcr.2017.05.007. [DOI] [PubMed] [Google Scholar]
- 16.Shyamasundar S, Lim JP, Bay BH. miR-93 inhibits the invasive potential of triple-negative breast cancer cells in vitro via protein kinase WNK1. Int J Oncol. 2016;49:2629–2636. doi: 10.3892/ijo.2016.3761. [DOI] [PubMed] [Google Scholar]
- 17.Deng ZQ, Qian J, Liu FQ, Lin J, Shao R, Yin JY, Tang Q, Zhang M, He L. Expression level of miR-93 in formalin-fixed paraffin-embedded tissues of breast cancer patients. Genet Test Mol Biomarkers. 2014;18:366–370. doi: 10.1089/gtmb.2013.0440. [DOI] [PubMed] [Google Scholar]
- 18.Kawami M, Yamada Y, Issarachot O, Junyaprasert VB, Yumoto R, Takano M. P-gp modulating effect of Azadirachta indica extract in multidrug-resistant cancer cell lines. Pharmazie. 2018;73:104–109. doi: 10.1691/ph.2018.7116. [DOI] [PubMed] [Google Scholar]
- 19.McCollum AK, Casagrande G, Kohn EC. Caught in the middle: The role of Bag3 in disease. Biochem J. 2009;425:e1–3. doi: 10.1042/BJ20091739. [DOI] [PMC free article] [PubMed] [Google Scholar]
- 20.Wang HQ, Liu BQ, Gao YY, Meng X, Guan Y, Zhang HY, Du ZX. Inhibition of the JNK signalling pathway enhances proteasome inhibitor-induced apoptosis of kidney cancer cells by suppression of BAG3 expression. Br J Pharmacol. 2009;158:1405–1412. doi: 10.1111/j.1476-5381.2009.00455.x. [DOI] [PMC free article] [PubMed] [Google Scholar]
- 21.Chiappetta G, Ammirante M, Basile A, Rosati A, Festa M, Monaco M, Vuttariello E, Pasquinelli R, Arra C, Zerilli M, et al. The antiapoptotic protein BAG3 is expressed in thyroid carcinomas and modulates apoptosis mediated by tumor necrosis factor-related apoptosis-inducing ligand. J Clin Endocrinol Metab. 2007;92:1159–1163. doi: 10.1210/jc.2006-1712. [DOI] [PubMed] [Google Scholar]
Associated Data
This section collects any data citations, data availability statements, or supplementary materials included in this article.
Data Availability Statement
The datasets used and/or analyzed during the present study are available from the corresponding author on reasonable request.