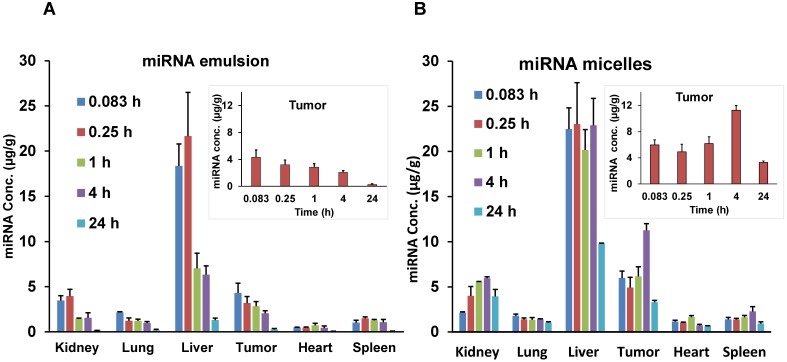
Figure 4.
Biodistribution of Cy5.5-let-7b in different organs after single intravenous injection of (A) emulsion and (B) micellar formulations in orthotopic pancreatic tumor-bearing NSG mice. Inset graphs are the same data emphasizing the tumor data that appears in the bar graph. Results are represented as the mean ± S.D. (n=4).

