

Abstract
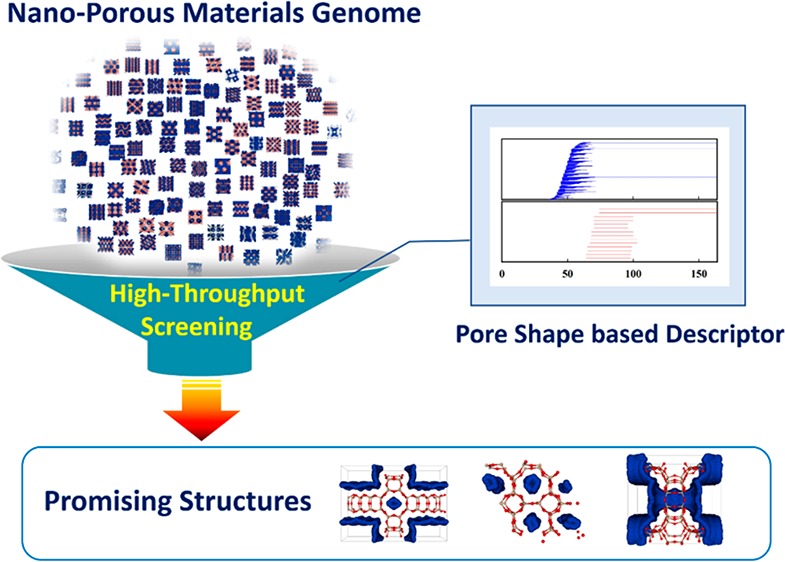
The materials genome initiative has led to the creation of a large (over a million) database of different classes of nanoporous materials. As the number of hypothetical materials that can, in principle, be experimentally synthesized is infinite, a bottleneck in the use of these databases for the discovery of novel materials is the lack of efficient computational tools to analyze them. Current approaches use brute-force molecular simulations to generate thermodynamic data needed to predict the performance of these materials in different applications, but this approach is limited to the analysis of tens of thousands of structures due to computational intractability. As such, it is conceivable and even likely that the best nanoporous materials for any given application have yet to be discovered both experimentally and theoretically. In this article, we seek a computational approach to tackle this issue by transitioning away from brute-force characterization to high-throughput screening methods based on big-data analysis, using the zeolite database as an example. For identifying and comparing zeolites, we used a topological data analysis-based descriptor (TD) recognizing pore shapes. For methane storage and carbon capture applications, our analyses seeking pairs of highly similar zeolites discovered good correlations between performance properties of a seed zeolite and the corresponding pair, which demonstrates the capability of TD to predict performance properties. It was also shown that when some top zeolites are known, TD can be used to detect other high-performing materials as their neighbors with high probability. Finally, we performed high-throughput screening of zeolites based on TD. For methane storage (or carbon capture) applications, the promising sets from our screenings contained high-percentages of top-performing zeolites: 45% (or 23%) of the top 1% zeolites in the entire set. This result shows that our screening approach using TD is highly efficient in finding high-performing materials. We expect that this approach could easily be extended to other applications by simply adjusting one parameter, the size of the target gas molecule.
1. Introduction
Zeolites, metal–organic frameworks,1 and other related nanoporous materials2 have many interesting applications, ranging from gas storage and separations to catalysis, sensing, etc. Scientific interest in these materials is related to their chemical tunability; by combining different organic linkers and metal units, we could synthesize millions of different nanoporous materials. These materials therefore provide an ideal platform to develop a profound understanding of how to tailor-make a material that is optimal for a given application. A practical limitation to developing this understanding is that in reality one can synthesize only a small fraction of all possible materials. Computational approaches have therefore been developed to generate libraries of millions of predicted nanoporous materials. To coordinate this development, the White House launched in 2011 the Materials Genome Initiative,3 which has generated significant scientific advances in the field of computational materials discovery. Specifically, for the development of advanced nanoporous materials, this initiative has led to the creation of a large database (the so-called ‘Nanoporous Materials Genome’) of different classes of porous materials (an infinite number of materials, in principle) that could be synthesized by combining different molecular building blocks.4−11
The current computational approach uses screening based on brute-force molecular simulations to generate the thermodynamic data needed to predict the performance of these materials in applications such as methane storage12,13 and different types of gas separation,14,15 but this approach is limited to tens of thousands of structures, due to computing time constraints. The main disadvantage of these brute-force techniques is that they can be relatively expensive. As the size of the libraries is growing exponentially, alternative screening methodologies to screen these databases are needed.
One popular screening methodology is utilizing simple descriptors that characterize materials. The idea behind these descriptors is that materials with similar descriptors should perform similarly. In the case of nanoporous materials, a fundamental question in developing a descriptor is how to systematically characterize similarity of pore structures. For nanoporous materials, popular descriptors are, for example, pore volume, density of the material, surface area, maximum included sphere, etc. These descriptors can be computed very efficiently and can subsequently be used to correlate with the performance of a material,16,17 but unfortunately remain insufficient to find the best materials.
Recently, we developed a new descriptor for nanoporous materials by taking a fundamentally different route and exploring topological concepts to quantify similarity of pore structures.18 Describing the complete pore topology of a material requires extremely high-dimensional data, which exceeds the capacity of most conventional data-mining tools. Therefore, in order to analyze high-dimensional data of pore structures, we employed the topological data analysis (TDA),19,20 which is a newly developed data-mining tool that has been successfully used to investigate various problems related to big data over the past decade.
Topology is the branch of mathematics concerned with the global structure of shape. TDA studies the “shape” of big and high-dimensional data in order to discover meaningful structure in the data and to identify important subgroups. Over the past decade, TDA has been intensively applied to investigate various problems involving large and high-dimensional data sets.19 One remarkably successful application of TDA was the discovery of a new type of breast cancer based on gene expression data of patients. TDA enabled the investigators to identify a previously unknown subtype of breast cancer with a unique mutational profile and excellent survival.21 Moreover, recently, TDA has extended its range of application to identification and characterization in materials science.22−24
In this article we aim to develop a high-throughput screening approach for nanoporous materials genome using our TDA-based descriptor. In our research, we chose zeolites as a starting material for two important reasons: (1) We already possess over a 100,000 simulation results for zeolites for several important applications, such as methane storage25 and carbon capture,14 which can serve as a reliable reference set; (2) as these materials are in the all-silica form, they all have the same chemical composition and differ only in their pore topology. This allows us to fundamentally check the validity of a pore-topology-based descriptor.
We recall first this new descriptor based on persistent homology theory.26 Next, we test the capability of our new descriptor to predict performance properties of zeolites for methane storage and carbon capture applications, in comparison with predictions from conventional descriptors. Furthermore, we perform high-throughput screening of zeolites for methane storage and carbon capture applications and show that our screening approach is highly efficient in finding high-performing materials.
2. Materials and Theory
2.1. Zeolite Database
For constructing the zeolite database in this study, we collected performance properties of zeolites from available sources, and the corresponding structures from the International Zeolite Association (IZA)27 database and Deem’s hypothetical database.7 For methane storage and carbon capture applications, deliverable capacities of 139,407 zeolites from Simon et al.’s work25 and parasitic energies of 119,129 zeolites from Lin et al.’s study14 were adopted, respectively. Deliverable capacity is a measure of the energy density of the material, defined as the difference in loading (number of methane molecules per unit material) at the (high) pressure at which we charge the materials with methane and at the (low) pressure at which we discharge the material. Parasitic energy is the total loss of electricity production if a carbon capture-and-sequestration process is added to a coal-fired power plant. For the best material, the loss of electricity production is minimal.
2.2. Persistent Homology
Persistent homology26 is a sophisticated topological methodology for identifying important features of a point cloud that persist over a range of spatial resolutions, as opposed to noise which persists only through a limited range of spatial resolutions. Persistent homology enables a multiscale analysis geometric features of point clouds. From a point cloud, a filtration of simplicial complexes is constructed, that is, a nested sequence of geometric objects that are described by gluing points, line segments, triangles, tetrahedra, etc., along their faces. Persistent homology detects homological changes of the complexes as the filtration increases. The persistent homology algorithm captures the birth and death times of homology classes, where birth means the creation of a nonzero homology class, while death refers to the merging of a homology class with another class born earlier. Homology classes detect the following types of features: zero-dimensional homology classes correspond to connected components, one-dimensional homology detects circles, and two-dimensional homology classes correspond to voids, and so on.28 The lifetime of a class is the difference between its death and birth times. Homology classes with relatively long lifetimes provide important information about the global shape of the point cloud, whereas noise generates short-lived homology classes.
2.3. Generation of a Descriptor Based on Pore Topology
The procedures to generate a descriptor based on topology of pore structures are illustrated in Figure 1. The first step is to prepare a finite set of points that represents a pore structure. In order to identify pore structures inside zeolites, we used the open-source software Zeo++,16 which models the accessible void space inside a porous material with a periodic Voronoi network. In Zeo++, both the framework atoms and gas molecules are modeled as hard spheres with radii adopted from the Cambridge Structural Database.29,30 Pore structure is a continuous object consisting of an infinite number of points. Thus, it is important to have sufficiently high resolution in order to capture pore structures well with only a finite number of points. However, it is also desirable that the resolution not be too high, as computational cost increases with the resolution (i.e., the number of points). One way to adjust the resolution is to manipulate a minimum distance (rmin) between two different points sampled. Through careful investigation from 1.2 to 0.7 Å, we set 0.8 Å as rmin in the work presented here.
Figure 1.

Persistent homology: the procedure to obtain a descriptor based on pore topologies in a zeolite.
The second step is to capture topological features of pore structures by performing persistent homology analysis for the sets of points prepared in the first step and encoding information about pore structure in a form of barcode. For persistent homology analysis, we used the Perseus software.31 The analysis was executed by constructing Vietoris–Rips complexes up through dimension 3, increasing the persistence interval ε by steps of 0.025 Å from the initial value of 0 for each point. The maximum distance considered, εmax, was set to 4.1 Å, in order to avoid identifying parts of the zeolite as pores (see Supporting Figure S1). For each zeolite, persistent homology analysis was performed separately for each individual connected component of a pore, and the outputs were combined thereafter. We proceeded in this manner because when the smallest distance between neighboring pores is smaller than εmax, they become connected, and artificial pores are created during the filtration process (see Figure S2).
The output of persistent homology analyses is given in the form of barcodes (or, equivalently, persistence diagrams), which play the role of a descriptor (i.e., fingerprint) for identifying and comparing zeolites. Although we generated barcodes just for two kinds of gas (carbon dioxide and methane), it is worthwhile to note that these procedures are universal. In developing barcodes for other gases, only the size of the probe gas molecule needs to be adjusted to reflect variations of accessible pore space, which makes this approach easily applicable to various kinds of applications.
2.4. Measuring Similarity between Different Barcodes
Comparing barcodes for different structures requires a measure of similarity or dissimilarity between them. There are a number of ways to define a measure on the space of persistence diagrams. Among them, we used L2- distances between the persistence landscapes; see ref (18). for details. L2-distances were calculated using the Persistence Landscape Toolbox,32 after constructing persistence landscapes from the barcodes we obtained. For each structure, we used barcodes in dimensions 0, 1, and 2. Because each dimension matters for identifying pore structures, we first calculated distances for each dimension and combined them as a root-mean-square for the overall distance dij between different barcodes (or zeolites) i and j:
| 1 |
where
α0, α1, and α2 are
weight factors for each dimensional distance, respectively. Λ1 and Λ2 are L2-distances calculated
at dimension 1 and 2. In dimension 0, instead of L2-distance,
we used the Euclidean distance  , where ni (or nj) and Vi (or Vj) are the
number of sampled points and the volume of zeolite i (or j), which is the only relevant information
from the zero-dimensional barcode, as the lengths of the persistence
intervals of a 0-simplex (i.e., lifetime of connected components)
is an artifact of the sampling procedure rather than intrinsic to
the material. Because we have not made explicit how the overall distance
is related to the distances in each dimension, the effects of functional
forms’ type and different weight factors are discussed in Section 3.3.
, where ni (or nj) and Vi (or Vj) are the
number of sampled points and the volume of zeolite i (or j), which is the only relevant information
from the zero-dimensional barcode, as the lengths of the persistence
intervals of a 0-simplex (i.e., lifetime of connected components)
is an artifact of the sampling procedure rather than intrinsic to
the material. Because we have not made explicit how the overall distance
is related to the distances in each dimension, the effects of functional
forms’ type and different weight factors are discussed in Section 3.3.
3. Implementation Details
3.1. Unit-Cell Size Issue
In comparing shapes of different pore structures, it is reasonable to compare pores obtained from zeolites having the same or almost equivalent volume, in order to avoid possible errors due to volume differences. However, as shown in Figure S3, the distribution of unit-cell volumes of zeolites covers a wide range, from 290.855 to 42282.4 Å3 with an average of 3483.4 Å3 and standard deviation of 1837.792 Å3. To minimize volume differences, in our analysis we used supercells with periodic boundary conditions created by expanding each unit cell repeatedly with a target volume of 40000 Å3, which is close to the largest volume of 42282.4 Å3 in the entire set of zeolites. Numbers of repetitions along three axes were chosen to make expanded cells as isotropic as possible. As shown in Figure S3, the distribution of volumes of expanded cells became narrower, compared to that of original unit cells, with an average of 40013.22 Å3 and standard deviation of 5873.805 Å3.
3.2. Correction of Death Time for Unclosed Second Dimensional Homology Class
When generating barcodes using persistent homology analysis, we set the maximum persistent interval εmax to be 4.1 Å, to avoid detecting parts of the zeolite as pores. However, this εmax is not sufficiently large for all homology classes to be dead at the end of the filtration, especially for zeolites having large pores. If homology classes are still alive at the end of the persistent homology analysis, barcodes corresponding to them are not included in calculating L2-distances, although they represent important topological features (such as large pores) with long intervals. This might cause undesired errors in comparing structures using barcodes. Figure S4 shows scatter plots of performance parameters of the entire zeolite database as a function of distances dij for two example zeolites PCOD8330975 and PCOD8325951. Both are high-performing zeolites for methane storage, having deliverable capacity of 137.94 (PCOD8330975) or 97.6248 (PCOD8325951) v STP/v. Thus, in our high-throughput screening (see Section 4.3 for details), structures predicted to be similar to PCOD8330975 or PCOD8325951 are categorized as promising structures. A gauge distance determining whether two different structures are similar or not normally occurs around dij = 0.05. For PCOD8330975, as shown in Figure S4a, there are a reasonable number of zeolites within the gauge distance, which is a standard distribution of neighboring zeolites. As PCOD8330975 has relatively small pores (the diameter of the largest included sphere Di = 4.638 Å), for this material all second dimensional homology classes are dead. In contrast, PCOD8325951 has large Di = 14.739 Å, so that second dimensional homology classes corresponding to the largest pore do not die by the time we reach εmax in our persistent homology analysis. Because of this missing information about large pores, Λ2 between PCOD8325951 and other zeolites is estimated incorrectly to be small regardless of similarities of pore shapes; as shown in Figure S4b, there is a large population of zeolites within a distance 0.05 from PCOD8325951. Most of them are categorized into two cases: (1) zeolites with no pocket inside and (2) zeolites with a large pocket. If such a structure is included in the initial training set for a screening study, it causes many dissimilar structures to be incorrectly assigned as neighbors and categorized as promising structures, which can lower performance of screening significantly.
Thus, to avoid this unphysical neighboring and compare two barcodes correctly, a death time has to be assigned to those homology classes that are remaining at the end of the filtration. One possible way is increasing εmax until all second dimensional homology classes are trivial. However, increasing εmax might lead to wrongly detecting parts of the zeolite as pores, as explained in Section 3.2. Instead, we assigned a death time for such second dimensional homology classes about pores by an extrapolation approach based on the relation between Di and death time for small and midrange pores, because death time of second dimensional homology classes is closely related to the size of pockets inside a pore structure. As shown in Figure S5, we could obtain linearly fitted behavior in a two-dimensional histogram of death time against Di for both CH4 and CO2. As shown in Figure S6, when the death time was assigned using the extrapolation approach, dissimilar zeolites initially located close were shifted right, and the histogram for PCOD8325951 took on a standard shape.
3.3. Dimensionality and Weight
In our study measures of distance (similarity) are estimated in three dimensions. These measures need to be combined in one overall measure of similarity, to utilize important information about pore structures identified at each dimension: connected components as zero-dimensional classes, tunnels as one-dimensional classes, and voids as two-dimensional classes. To determine the optimal way to define the overall distance, we prepared a subset of zeolites by randomly selecting 5000 structures from the entire zeolite database for the methane storage application and investigated correlations between the performance parameter (PPZi) of each zeolite (Zi) in the subset and the performance parameter (PPsZi) of the corresponding most similar structure (sZi) in the entire database. Four different kinds of functional forms were examined with varying weight factors in each dimension: arithmetic mean (AM), geometric mean (GM), harmonic mean (HM), and root-mean-square (QM).
Figure 2 shows two-dimensional scatterplots of PPs
of zeolites in the subset against those of the corresponding most
similar ones. In the ideal case, as the structure sZi is most similar to structure Zi, their performance parameters
should be very similar, that is, PPsZi ≈ PPZi. Figure 2 shows that indeed, irrespective of the types
of functional forms and the range of weight factors used, PPsZi is similar to PPZi. The arithmetic (AM) and root-mean-square (QM) forms gave
the best results with weight factors of 0.1, 0.45, and 0.45 in dimensions
0, 1, and 2, respectively, with root-mean-square error (RMSE) = 6.64
for AM and 6.60 for QM. The RMSE was calculated as  , where nsubset is the number of zeolites
in the subset. Based on these results, we used in the rest of this
article the QM with α0 = 0.1, α1 = 0.45, and α2 = 0.45 as a measure of distance
between different barcodes (or persistence diagrams). At this point
it is important to note that the optimal measure of distance may depend
on the performance property one is interested in.
, where nsubset is the number of zeolites
in the subset. Based on these results, we used in the rest of this
article the QM with α0 = 0.1, α1 = 0.45, and α2 = 0.45 as a measure of distance
between different barcodes (or persistence diagrams). At this point
it is important to note that the optimal measure of distance may depend
on the performance property one is interested in.
Figure 2.

Two-dimensional scatterplots of the performance parameters PPZi of zeolites in a fixed subset of 5000 materials against those PPsZi of the corresponding most similar ones by TDA, where AM, GM, HM, or QM denote arithmetic, geometric, harmonic, or root-mean-square, respectively. The three numbers following a type of mean are the chosen weight factors for dimensions 0, 1, and 2. In these graphs the performance parameter is the one we use for methane storage.
4. Results and Discussion
4.1. TDA-Based Description of the Performance Parameters
Before applying a TDA-based descriptor (hereinafter referred as “TD (topological data analysis-based descriptor)”) to screening zeolites, we checked its capability to predict performance properties. For each zeolite in the subsets prepared by randomly selecting zeolites from the entire set, we found the most similar zeolites in the entire set and compared performance properties between them. For comparison, we also performed the analyses for the subsets using each individual conventional descriptor and an aggregation (CD) of five conventional descriptors as CD = {Di, Df, ρ, ASA, AV}, where Di, and Df represents the diameter of the largest included sphere and of the free sphere, ρ is zeolite density, and ASA and AV denote the accessible surface area and volume to a gas probe molecule. All of these properties were calculated using Zeo++. For both individual conventional descriptors and CD, distances between different structures were measured with the normalized L2 Euclidean distance between the vectors.
Figure 3 shows two-dimensional scatterplots of PPs of zeolites in the subset of 5000 for the methane storage application. As shown in Figure 3, selection by individual conventional descriptors did not lead to good correlation between PPsZi and PPZi. The RMSE values (22, 24, 19, 20, and 18 for Di, Df, ρ, ASA, and AV, respectively) were significantly larger than RMSE for TD. As one might expect, the aggregate of these descriptors (CD) showed much improved correlation (with RMSE = 11.341), as in the aggregate, there is a compensation effect due to combining information about the pore structure contained in each individual descriptor. Figure 3 does show, however, that the overall performance of TD is significantly better than the aggregate of CD (RMSE = 6.60 for TD and 11.34 for CD).
Figure 3.

Two-dimensional scatterplots of performance property PPZi of zeolites in the subset against those PPsZi of the corresponding most similar ones, for the methane storage application. Red dots indicate results by TD. Green dots are results by conventional descriptors. Blue diagonal lines correspond to {PPZi} = {PPsZi}. The RMSE = 6.60 by TD; 21.67, 23.56, 19.10, 19.53, 18.38, and 11.34 by Di, Df, ρ, ASA, AV, and CD, respectively.
It might be interesting to investigate in detail some of the structures for which there are large discrepancies between performance properties from CD and TD predictions. For instance, in Figure 4 we compare the zeolites PCOD8097838 and PCOD8004291 that were selected to be most similar to PCOD8165978 by CD and TD, respectively. Globally, the pore shapes for these three structures have similar one-dimensional linear shapes. However, in detail, as opposed to the pore shape of PCOD8097838 (prediction by CD), PCOD8004291 (prediction by TD) shows a zigzag patterned pore shape similar to PCOD8165978. As shown in the table in Figure 4, although PCOD8165978 and PCOD8097838 have very similar values for the five structural properties, the CD might not capture the details in pore shape that could result in significantly different performances between PCOD8165978 (PP = 26 v STP/v) and PCOD8097838 (PP = 93 v STP/v); note that PCOD8004291 exhibits PP = 28 v STP/v.
Figure 4.

An example of the most similar structures selected by TD (right) and CD (center) based on a seed zeolite (left). Red or tan colored spheres represent oxygen or silicon atoms in a zeolite, respectively. Blue colored spaces correspond to pore structures.
We also applied our methodology to the carbon capture application, where we used an inverse of parasitic energy as a performance property. In Figure 5, the screening result using TD is compared with screening by five different single descriptors and their aggregate (CD). For the carbon capture application, compared to single descriptors and CD, TD also yielded much improved correlation (RMSE = 1.87 × 10⁻⁴ for TD with 2.75 × 10⁻⁴ for CD).
Figure 5.

Two-dimensional histograms of performance property PPZi of zeolites in the subset against those PPsZi of the corresponding most similar ones, for the carbon capture application. Red dots indicate results by TD. Green dots are results by conventional descriptors. Blue diagonal lines correspond to {PPZi} = {PPsZi}. The RMSE = 1.87 × 10⁻⁴ by TD; 3.56 × 10⁻⁴, 3.43 × 10⁻⁴, 3.71 × 10⁻⁴, 3.73 × 10⁻⁴, 3.45 × 10⁻⁴, and 2.75 × 10⁻⁴ by Di, Df, ρ, ASA, AV, and CD, respectively.
4.2. The Capability of the TDA-Based Descriptor To Find the Top-Performing Zeolites
Next, we checked the capability of TD to detect high-performing structures in the entire database, given that we know the structure of several top-performing materials. The idea is that our method will provide all the materials that are topologically similar to these top-performing materials. If our hypothesis is correct, then most of these similar materials should also be top-performing materials.
For this analysis, we first defined the set of the top 100 materials (“the best set”) out of the entire database, according to their PP. For each structure in the best set, we found the five materials that are closest to it, based on distances measured using TD. The capability of a descriptor was measured as the probability that the selected similar structures have PP larger than a threshold value, which is set as the PP value of the top 1% of zeolites for each application.
For the methane storage application, we set a threshold PP as deliverable capacity = 90 v STP/v, since the total number of structures having deliverable capacity larger than 90 v STP/v is about 1% of the entire database. As summarized in Table 1(a), TDs were highly capable of detecting high-performing materials in the entire database, as long as some top materials are already known. For instance, with TD, it was possible to have another good material as the first nearest neighbor with 79.3% probability, which is comparable to 82.7% by CD. The average error for PPs between zeolites in the best set and the corresponding five closest neighbors is 17.03% or 15.42% by TD and CD, respectively. These results seem to state that CD performs better than TD in terms of the probability of finding other top materials as neighbors of given top zeolite. However, we would like to emphasize that more top materials can be detected using TD overall. In the analysis using CD, there were many overlaps among top materials found as neighbors of different zeolites in the best set, which might indicate better capability to detect more diverse top-performing zeolites by TD.
Table 1. Probability of Finding Top 1% Materials within The Nth Nearest Neighbors of Top 100 Zeolites for (a) the Methane Storage and (b) the Carbon Capture Applicationsa.
| Nth | TD | CD |
|---|---|---|
| (a) Methane Storage Application | ||
| 1 | 0.793 (69/87) | 0.827 (72/87) |
| 3 | 0.679 (163/240) | 0.769 (157/204) |
| 5 | 0.701 (265/378) | 0.754 (236/313) |
| (b) Carbon Capture Application | ||
| 1 | 0.170 (17/100) | 0.222 (22/99) |
| 3 | 0.138 (40/289) | 0.197 (56/284) |
| 5 | 0.129 (61/472) | 0.160 (73/456) |
Repeat appearances of the same zeolite are excluded.
For the carbon capture application, we set a threshold PP as 1/parasitic energy = 0.001282 kg CO2/kJ (corresponding to parasitic energy = 780 kJ/kg CO2) because about 1% of the entire set of structures has parasitic energy lower than 780 kJ/kg CO2. As shown in Table 1(b), with TD, 17 top 1% structures were detected as the first nearest neighbors, which corresponds to 17% probability. We could find 22 top 1% structures using CD. Compared to the methane storage application, while the probability finding another top material is lower, PPs between zeolites in the best set and the corresponding five closest neighbors showed better agreement, as the average errors were 12.83% and 12.16% for TD and CD, respectively.
It is instructive to discuss why we think our predictions for carbon capture are not as successful as for methane storage. The objective function for methane storage is the deliverable capacity at a single temperature. For carbon capture the parasitic heat is much more complex as it compares the trade-off between compression and heating, which therefore requires a prediction of not only the deliverable capacity at different temperatures but also the heat of adsorption at different temperatures. Based on these consideration, it is not surprising to see that with the same level of detail in our fingerprint, one would expect our method to work better for methane storage.
The good agreement between PP of structures from the out-of-bag search and initial structure indicates that TD can reasonably predict PP without performing molecular simulations for all structures.
4.3. High-Throughput Screening Using TDA-Based Descriptor
Next, we applied TD to high-throughput screening of zeolite database. The workflow of our screening method is illustrated in Figure 6. It consists of the following six steps. First, we performed persistent homology analysis for all structures in the entire set and obtained barcodes that work as fingerprints for pore topologies. Second, a training set was selected with the min–max algorithm,33 which is a diversity selection approach to ensure that our training set of materials sufficiently covers the entire space based on persistent homology. The number of structures in the training set depends on how diverse the database is in terms of pore topologies, as analyzed by persistent homology. For each screening, we increased the number of structures in the training set until the diversity of the set was sufficiently saturated. The degree of diversity saturation was measured by the change of minimum distances upon adding a new structure. The convergence criterion was set as (1 – {minimum distance of a new structure}/{average minimum distance of previous 10 structures}) < 0.001 (see Figure S7). In our work, as a training set, 1500 zeolites were chosen. Third, we ranked structures in the training set according to their performance-related properties: deliverable capacity for methane storage and inverse of parasitic energy for carbon capture. Fourth, we performed a screening on the entire set of the structures except those included in the training set. For each structure in the training set, we created a bin containing similar structures, as follows. For any material not in the training set, we computed all pairwise similarities between it and the training set materials and then assigned it to the bin of the material in the training set to which it is most similar, based on the metric defined in the previous section. We expected the PP of each material to be similar to the PP of the material in the training set corresponding to its bin. Fifth, after screening all materials not in the training set, we defined the most promising set of materials (e.g., top 1%, top 0.5%, ...) to be those materials that were assigned to the bins corresponding to materials in the training set with PP larger than the criterium we specified. Lastly, to verify our results, we compared the PP of materials in the most promising set as obtained from the grand-canonical Monte Carlo simulations to the hypothetical PP coming from their bin assignment.
Figure 6.

Procedure of high-throughput screening using the TDA-based descriptor.
First, we performed a high-throughput screening using TD for methane application. For comparison, we also performed a screening using aggregation of conventional descriptors (CD). Figure 7a,b shows the normalized distribution of diverse training sets and of promising sets predicted by TD and CD for methane storage. For the sake of reference, the distributions of the entire set and random training set are also shown. Normalization was done with respect to the total number of structures in each set. As shown in Figure 7a, the modes of the distribution of PP for both diverse training sets are significantly shifted to higher PP compared to mode for the random training set; note that the highest peak occurs around PP = 80. The large population of zeolites in the range of PP between 50 and 90 might reflect high diversity of zeolites in that region.
Figure 7.
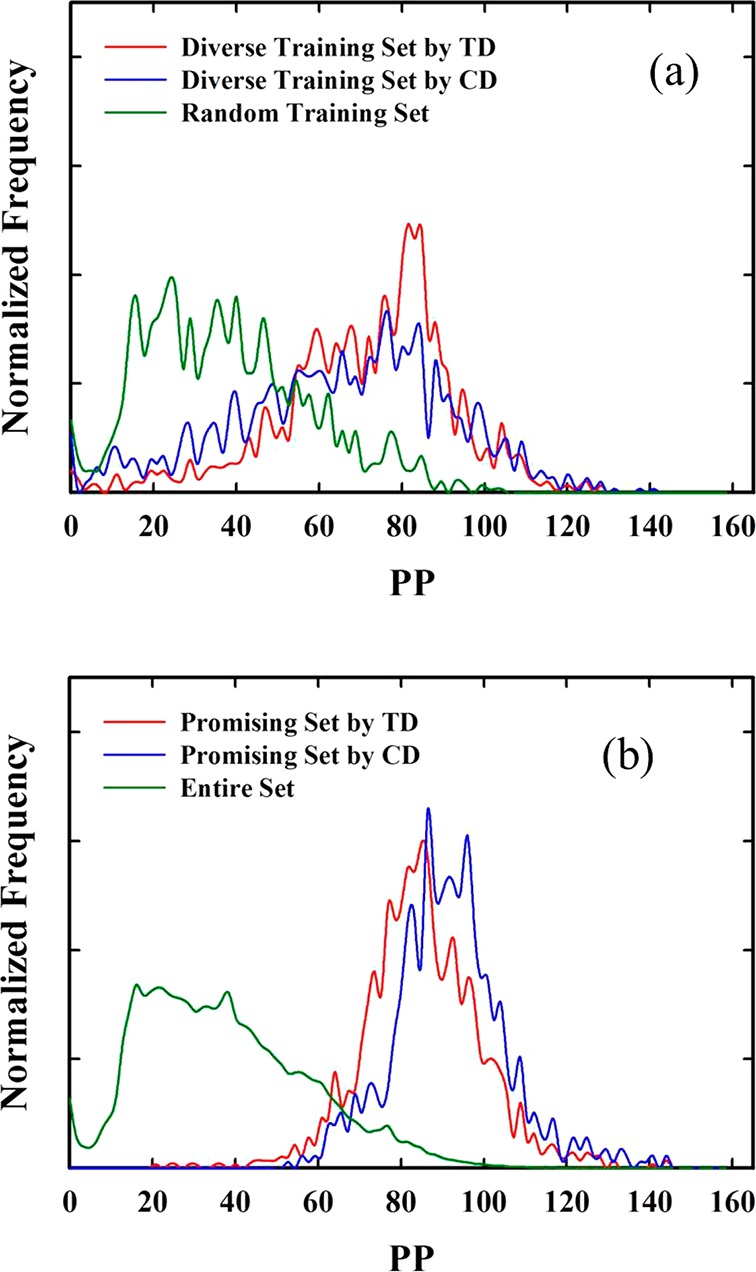
(a) The normalized distribution of diverse training sets by TD and CD, together with that of a random training set. (b) The normalized distribution of promising sets by TD and CD, compared to that of the entire set. The x-axis represents the PP, which is deliverable capacity for the methane storage application.
As shown in Figure 7b, our screening strategy efficiently detected high-performing materials based on the comparison between the distribution of PP in the promising set and that in the entire set. The distribution of PP for the promising set is significantly shifted to high PP compared to the entire set, confirming the efficiency of our screening strategy using TD. Also, TD worked well for screening out low-performing materials with PP less than about 40 v STP/v, which is important to ensure that low-performing materials are not labeled as promising materials. Our results show that TD and CD have similar modes of distribution of PP for the corresponding promising set. While it seems that CD produces more good structures in the promising set than TD, the picture is somewhat different if we look at the percentage of top-performing structures in the promising set as a fraction of the entire set, because the normalized frequencies in Figure 7b show only the relative number of structures within the promising set. Table 2(a) shows percentages of the number of structures having PP > 90 v STP/v in the promising set based on the number of structures having PP > 90 in the entire set. As summarized in Table 2(a), the promising set determined by TD contained higher percentages of top-performing structures than CD: 45.16% top 1% zeolites, which is significantly higher than 32.31% by CD. Moreover, TD (respectively, CD) produced 61.1 (72.2), 72.2 (60.6), 59.8 (43.5), 55.6 (39.8), or 39.3 (27.2)% of structures having PP > 130, 130 ≥ PP > 120, 120 ≥ PP > 110, 110 ≥ PP > 100, or 100 ≥ PP > 90 v STP/v, respectively.
Table 2. Percentage of Top 1% Materials Detected in the Promising Sets by TD and CD for (a) the Methane Storage and (b) the Carbon Capture Applicationsa.
| (a) methane
store application | ||
|---|---|---|
| PP | TD | CD |
| >130 | 61.1% | 72.2 |
| 130–120 | 72.2 | 60.6 |
| 120–110 | 59.8 | 43.5 |
| 110–100 | 55.6 | 39.8 |
| 100–90 | 39.3 | 27.2 |
| total | 45.16 | 32.31 |
| (b) carbon
capture application | ||
|---|---|---|
| PP (PE) | TD | CD |
| <740 | 23.8% | 15.4 |
| 750–740 | 22.2 | 10.9 |
| 760–750 | 22.1 | 10.8 |
| 770–760 | 24.6 | 4.5 |
| 780–770 | 21.7 | 5.3 |
| total | 23.14 | 9.68 |
The last row in each table (i.e., total) shows overall percentage of top 1% materials detected in the promising sets.
Next, the screening results for the carbon capture application are shown in Figure 8. The overall results are similar to the case of methane storage; the ordering of the modes of distribution of promising set is TD > CD > random selection. However, it is worthwhile to note that the discrepancy between TD and CD in ability to screen zeolites is larger than that for methane storage. From Table 2(b), we observe that the promising set of 2105 (or 1839) structures created by TD (respectively, CD) contains 23.8 (15.4), 22.2 (10.9), 22.1 (10.8), 24.6 (4.5), or 21.7 (5.3) % of structures having PE > 740, 750 ≥ PE > 740, 760 ≥ PE > 750, 770 ≥ PE > 760, or 780 ≥ PE > 770 kJ/kg CO2, respectively.
Figure 8.
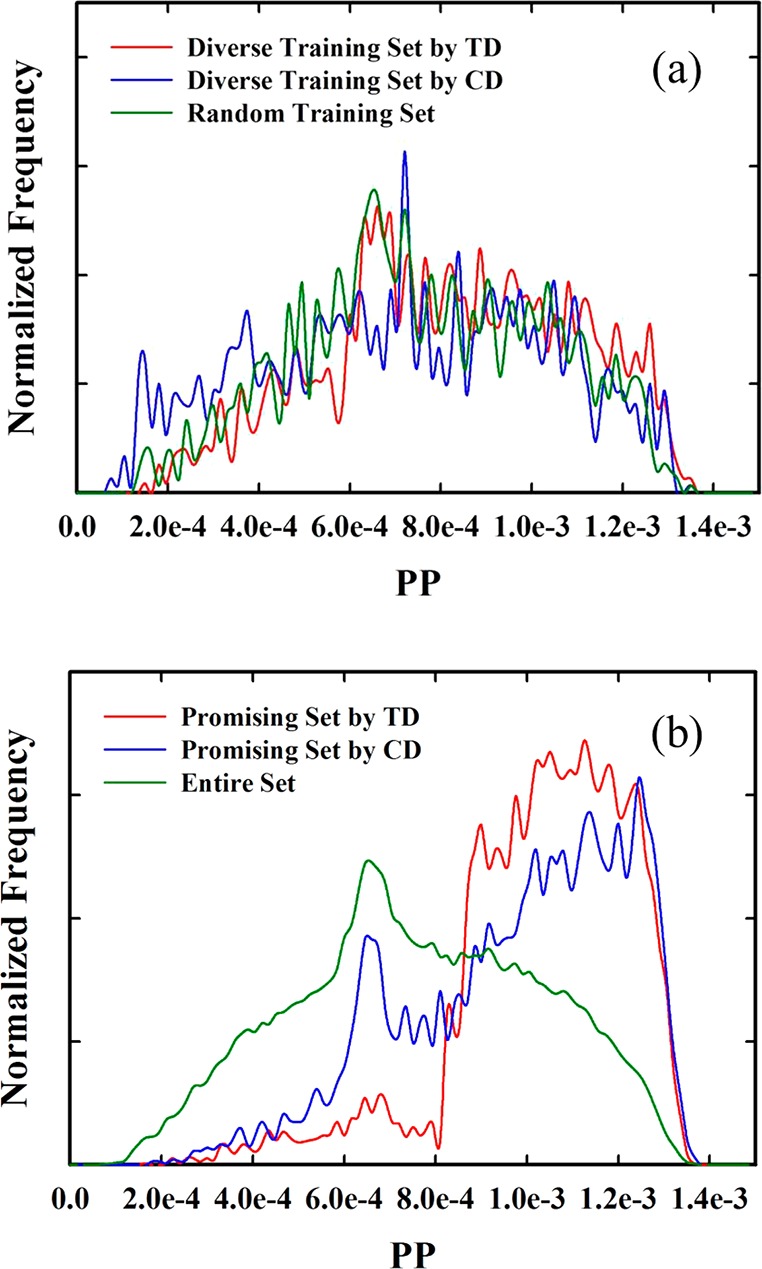
(a) The normalized distribution of a given performance parameter for carbon capture for diverse training sets created by TD and CD, together with that of a random training set. (b) The normalized distribution a given performance parameter for carbon capture for promising sets created by TD and CD, compared to that of the entire set. The x-axis represents the PP, which is deliverable capacity for the carbon capture application.
5. Conclusion
In this article, we developed a high-throughput approach for screening zeolites, using a recently developed topological data analysis-based descriptor (TD) that recognizes pore topology. For generating this descriptor, a point-cloud representation of pore structures was created using Zeo++, and topological features of the pore structures were then encoded in the form of barcodes, by performing persistent homology analysis for the point cloud. To build filtrations for persistent homology, we used the Vietoris–Rips complex, but our method could also be applied to cubical complexes and alpha complexes, as we will do in forthcoming work.
We first checked the capability of this descriptor to predict performance properties of zeolites for methane storage (deliverable capacity) and carbon capture (inverse of parasitic energy), in comparison with predictions from conventional descriptors. In global searches for the most similar structures to a selected subset, the overall performance of TD is significantly better than that of the aggregate of the conventional descriptors (CD); root-mean-square errors of performance properties between the initial subset and the most similar set were estimated to be 6.60 v STP/v by TD and 11.34 v STP/v by CD for methane storage and 1.87 × 10⁻⁴ kg CO2/kJ by TD and 2.75 × 10⁻⁴ kg CO2/kJ by CD for carbon capture applications. Furthermore, we showed that TD is highly capable of detecting good materials in the entire set, as long as some top materials are already known. Next, with confidence in the capability of TD to predict performance properties without performing molecular simulations for all structures and to match top-performing materials, we performed high-throughput screening of zeolites for methane storage and carbon capture applications. We showed that the TD screening approach is highly efficient in detecting high-performing materials for both applications; the promising set created by TD contained higher percentages of top-performing structures than that obtained by CD.
Although the TD has been tested only for carbon capture and methane storage application in only one kind of framework (zeolites), we expect that our methodology can easily be extended to other applications by simply adjusting one parameter, the size of the target gas molecule, and to other classes of nanoporous materials (metal–organic frameworks, zeolitic imidazolate frameworks, porous polymer networks, etc.) by taking into account information about energy or charge.
Acknowledgments
During the early stage of the research Y.L. and B.S. were supported by the Center for Gas Separations Relevant to Clean Energy Technologies, an Energy Frontier Research Center funded by the DOE, Office of Science, Office of Basic Energy Sciences under award DE-SC0001015. Y.L. (during the later stages of the research) and S.B. were supported by the National Center of Competence in Research (NCCR) “Materials” Revolution: Computational Design and Discovery of Novel Materials (MARVEL) of the Swiss National Science Foundation (SNSF). Y.L. thanks the ShanghaiTech University Research Startup Fund for support. M.M. was supported by the Deutsche Forschungsgemeinschaft (DFG, priority program SPP 1570). B.S. was supported by the European Research Council (ERC) under the European Union’s Horizon 2020 research and innovation program (MaGic, grant agreement no. 666983) and by the ‘Korean-Swiss Science and Technology Programme’ (KSSTP) grant no. 162130 of the Swiss National Science Foundation (SNSF). P.D. was supported by the Advanced Grant of the European Research Council GUDHI, (Geometric Understanding in Higher Dimensions) (grant agreement no. 339025). P.D. is also supported by the EPSRC grant New Approaches to DataScience: Application Driven Topological Data Analysis EP/R018472/1.
Supporting Information Available
The Supporting Information is available free of charge on the ACS Publications website at DOI: 10.1021/acs.jctc.8b00253.
Figures illustrating details in generation of barcodes and preparation of training sets used in high-throughput screening (PDF)
The authors declare no competing financial interest.
Supplementary Material
References
- Furukawa H.; Cordova K. E.; O’Keeffe M.; Yaghi O. M. The Chemistry and Applications of Metal-Organic Frameworks. Science 2013, 341, 1230444. 10.1126/science.1230444. [DOI] [PubMed] [Google Scholar]
- Cooper A. I. Conjugated Microporous Polymers. Adv. Mater. 2009, 21, 1291–1295. 10.1002/adma.200801971. [DOI] [Google Scholar]
- Kalil T.; Wadia C.. Materials Genome Initiative for Global Competitiveness. National Science and Technology Council: Washington, DC, 2011.
- Wilmer C. E.; Leaf M.; Lee C. Y.; Farha O. K.; Hauser B. G.; Hupp J. T.; Snurr R. Q. Large-Scale Screening of Hypothetical Metal–organic Frameworks. Nat. Chem. 2012, 4, 83–89. 10.1038/nchem.1192. [DOI] [PubMed] [Google Scholar]
- Chung Y. G.; Camp J.; Haranczyk M.; Sikora B. J.; Bury W.; Krungleviciute V.; Yildirim T.; Farha O. K.; Sholl D. S.; Snurr R. Q. Computation-Ready, Experimental Metal–Organic Frameworks: A Tool To Enable High-Throughput Screening of Nanoporous Crystals. Chem. Mater. 2014, 26, 6185–6192. 10.1021/cm502594j. [DOI] [Google Scholar]
- Deem M. W.; Pophale R.; Cheeseman P. A.; Earl D. J. Computational Discovery of New Zeolite-Like Materials. J. Phys. Chem. C 2009, 113, 21353–21360. 10.1021/jp906984z. [DOI] [Google Scholar]
- Pophale R.; Cheeseman P. A.; Deem M. W. A Database of New Zeolite-like Materials. Phys. Chem. Chem. Phys. 2011, 13, 12407. 10.1039/c0cp02255a. [DOI] [PubMed] [Google Scholar]
- Bao Y.; Martin R. L.; Simon C. M.; Haranczyk M.; Smit B.; Deem M. W. In Silico Discovery of High Deliverable Capacity Metal–Organic Frameworks. J. Phys. Chem. C 2015, 119, 186–195. 10.1021/jp5123486. [DOI] [Google Scholar]
- Martin R. L.; Lin L.-C.; Jariwala K.; Smit B.; Haranczyk M. Mail-Order Metal–Organic Frameworks (MOFs): Designing Isoreticular MOF-5 Analogues Comprising Commercially Available Organic Molecules. J. Phys. Chem. C 2013, 117, 12159–12167. 10.1021/jp401920y. [DOI] [Google Scholar]
- Martin R. L.; Simon C. M.; Medasani B.; Britt D. K.; Smit B.; Haranczyk M. In Silico Design of Three-Dimensional Porous Covalent Organic Frameworks via Known Synthesis Routes and Commercially Available Species. J. Phys. Chem. C 2014, 118, 23790–23802. 10.1021/jp507152j. [DOI] [Google Scholar]
- Martin R. L.; Simon C. M.; Smit B.; Haranczyk M. In Silico Design of Porous Polymer Networks: High-Throughput Screening for Methane Storage Materials. J. Am. Chem. Soc. 2014, 136, 5006–5022. 10.1021/ja4123939. [DOI] [PubMed] [Google Scholar]
- Simon C. M.; Kim J.; Gomez-Gualdron D. A.; Camp J. S.; Chung Y. G.; Martin R. L.; Mercado R.; Deem M. W.; Gunter D.; Haranczyk M.; Sholl D. S.; Snurr R. Q.; Smit B. The Materials Genome in Action: Identifying the Performance Limits for Methane Storage. Energy Environ. Sci. 2015, 8, 1190–1199. 10.1039/C4EE03515A. [DOI] [Google Scholar]
- Simon C. M.; Kim J.; Gomez-Gualdron D. A.; Chung Y. G.; Martin R. L.; Mercado R.; Deem M. W.; Gunter D.; Haranczyk M.; Snurr R. Q.; Smit B. Computer-Aided Search for Materials to Store Natural Gas for Vehicles. Front. Young Minds 2015, 3, 11. 10.3389/frym.2015.00011. [DOI] [Google Scholar]
- Lin L.-C.; Berger A. H.; Martin R. L.; Kim J.; Swisher J. A.; Jariwala K.; Rycroft C. H.; Bhown A. S.; Deem M. W.; Haranczyk M.; Smit B. In Silico Screening of Carbon-Capture Materials. Nat. Mater. 2012, 11, 633–641. 10.1038/nmat3336. [DOI] [PubMed] [Google Scholar]
- Simon C. M.; Mercado R.; Schnell S. K.; Smit B.; Haranczyk M. What Are the Best Materials To Separate a Xenon/Krypton Mixture?. Chem. Mater. 2015, 27, 4459–4475. 10.1021/acs.chemmater.5b01475. [DOI] [Google Scholar]
- Martin R. L.; Smit B.; Haranczyk M. Addressing Challenges of Identifying Geometrically Diverse Sets of Crystalline Porous Materials. J. Chem. Inf. Model. 2012, 52, 308–318. 10.1021/ci200386x. [DOI] [PubMed] [Google Scholar]
- Martin R. L.; Willems T. F.; Lin L.-C.; Kim J.; Swisher J. A.; Smit B.; Haranczyk M. Similarity-Driven Discovery of Zeolite Materials for Adsorption-Based Separations. ChemPhysChem 2012, 13, 3595–3597. 10.1002/cphc.201200554. [DOI] [PubMed] [Google Scholar]
- Lee Y.; Barthel S. D.; Dłotko P.; Moosavi S. M.; Hess K.; Smit B. Quantifying Similarity of Pore-Geometry in Nanoporous Materials. Nat. Commun. 2017, 8, 15396. 10.1038/ncomms15396. [DOI] [PMC free article] [PubMed] [Google Scholar]
- Carlsson G. TOPOLOGY AND DATA. Bull. New. Ser. Am. Math. Soc. 2009, 46, 255–308. 10.1090/S0273-0979-09-01249-X. [DOI] [Google Scholar]
- Lum P. Y.; Singh G.; Lehman A.; Ishkanov T.; Vejdemo-Johansson M.; Alagappan M.; Carlsson J.; Carlsson G. Extracting Insights from the Shape of Complex Data Using Topology. Sci. Rep. 2013, 3, 1236. 10.1038/srep01236. [DOI] [PMC free article] [PubMed] [Google Scholar]
- Nicolau M.; Levine A. J.; Carlsson G. Topology Based Data Analysis Identifies a Subgroup of Breast Cancers with a Unique Mutational Profile and Excellent Survival. Proc. Natl. Acad. Sci. U. S. A. 2011, 108, 7265–7270. 10.1073/pnas.1102826108. [DOI] [PMC free article] [PubMed] [Google Scholar]
- Ushizima D.; Morozov D.; Weber G. H.; Bianchi A. G. C.; Sethian J. A.; Bethel E. W. Augmented Topological Descriptors of Pore Networks for Material Science. IEEE Trans. Vis. Comput. Graph. 2012, 18, 2041–2050. 10.1109/TVCG.2012.200. [DOI] [PubMed] [Google Scholar]
- Nakamura T.; Hiraoka Y.; Hirata A.; Escolar E. G.; Nishiura Y. Persistent Homology and Many-Body Atomic Structure for Medium-Range Order in the Glass. Nanotechnology 2015, 26, 304001. 10.1088/0957-4484/26/30/304001. [DOI] [PubMed] [Google Scholar]
- Kramar M.; Goullet A.; Kondic L.; Mischaikow K. Persistence of Force Networks in Compressed Granular Media. Phys. Rev. E 2013, 87, 42207. 10.1103/PhysRevE.87.042207. [DOI] [PubMed] [Google Scholar]
- Simon C. M.; Kim J.; Lin L.-C.; Martin R. L.; Haranczyk M.; Smit B. Optimizing Nanoporous Materials for Gas Storage. Phys. Chem. Chem. Phys. 2014, 16, 5499. 10.1039/c3cp55039g. [DOI] [PubMed] [Google Scholar]
- Edelsbrunner H.; Harer J. L.. Computational Topology an Introduction; American Mathematical Society: Providence, RI, 2010. [Google Scholar]
- Baerlocher Ch.; McCusker L. B.. Database of Zeolite Structures: http://www.iza-structure.org/databases/.
- Munkres J. R.Elements of Algebraic Topology; Perseus Books: New York, 1984. [Google Scholar]
- Bondi A. Van Der Waals Volumes and Radii. J. Phys. Chem. 1964, 68, 441–451. 10.1021/j100785a001. [DOI] [Google Scholar]
- Rowland S. R.; Taylor R. Intermolecular Nonbonded Contact Distances in Organic Crystal Structures: Comparison with Distances Expected from van Der Waals Radii. J. Phys. Chem. 1996, 100, 7384–7391. 10.1021/jp953141+. [DOI] [Google Scholar]
- Mischaikow K.; Nanda V. Morse Theory for Filtrations and Efficient Computation of Persistent Homology. Discrete Comput. Geom. 2013, 50, 330–353. 10.1007/s00454-013-9529-6. [DOI] [Google Scholar]
- Bubenik P.; Dłotko P. A Persistence Landscapes Toolbox for Topological Statistics. J. Symb. Comput. 2017, 78, 91–114. 10.1016/j.jsc.2016.03.009. [DOI] [Google Scholar]
- Kennard R. W.; Stone L. A. Computer Aided Design of Experiments. Technometrics 1969, 11, 137–148. 10.1080/00401706.1969.10490666. [DOI] [Google Scholar]
Associated Data
This section collects any data citations, data availability statements, or supplementary materials included in this article.
Data Citations
- Baerlocher Ch.; McCusker L. B.. Database of Zeolite Structures: http://www.iza-structure.org/databases/.