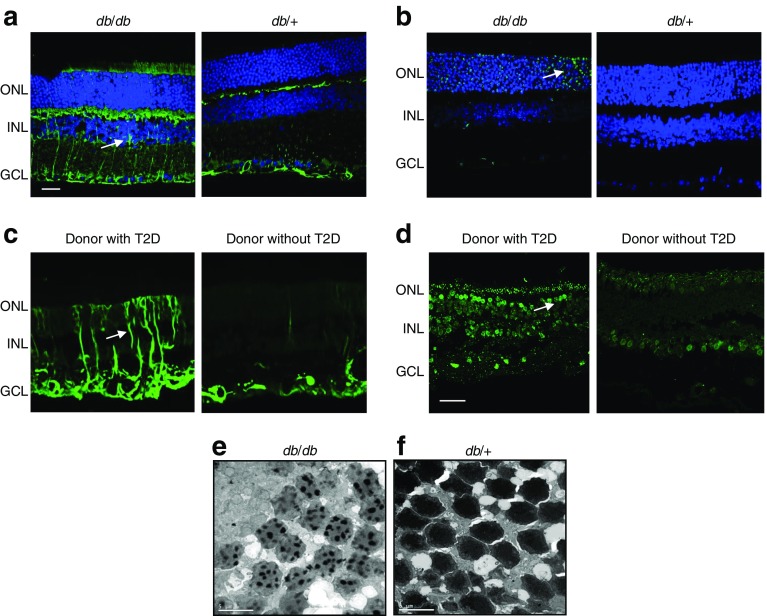
Fig. 4.
Main features of neurodegeneration: glial activation (also known as reactive gliosis) and neural apoptosis. (a, c) Glial activation (green), assessed by analysis of glial fibrillary acidic protein (GFAP) expression, and (b, d) neural apoptosis, analysed using TUNEL assay in retinas from (a, b) an experimental model of type 2 diabetes (db/db mouse) and a control (db/+) mouse and (c, d) human diabetic and non-diabetic donors. (e) Image obtained by transmission electron microscopy showing DNA fragmentation in photoreceptors in db/db mice, which is characteristic of the apoptotic process. The nuclei of cells are stained in blue. The arrows indicate glial activation (a, c) and apoptotic cells (b, d). (a–d) Scale bar, 20 μm; (e) scale bar, 5μm. GCL, ganglion cell layer; INL, inner nuclear layer; ONL, outer nuclear layer; T2D, type 2 diabetes. (a, b, d, e), images from R. Simó’s laboratory, not previously published; (c) Adapted from Carrasco et al [86], distributed under the terms of the Creative Commons Attribution-NonCommercial-NoDerivatives License 3.0 (http://creativecommons.org/licenses/by-nc-nd/3.0/). This figure is available as part of a downloadable slideset

