

The specific patterns of sequence polymorphisms of T-cell epitopes and the immune mechanisms of the HBV epitope mutation-linked disease progression are largely unclear. In this study, we systematically evaluated the contribution of CD8+ T cells to the disease progress-associated evolution of HBV. By evaluation of patient T-cell responses based on the peptide repertoire, we comprehensively characterized the association of clinical parameters in chronic hepatitis B with the antiviral T-cell response-associated mutations of the viruses from the single-epitope level to the overall HLA-I-restricted peptide levels. Furthermore, we investigated the molecular basis of the HLA-A2-restricted peptide immune escape and found that the solvent-exposed C-terminal portion of the epitopes is highly variable under CDR3β recognition. Our work may provide a comprehensive evaluation of viral mutations impacted by the host CTL response in HBV disease progression in the context of the full repertoire of HBc-derived epitopes.
KEYWORDS: chronic hepatitis B, HLA-A2, viral fitness, epitope variation pattern, immunopathogenesis
ABSTRACT
Under the immune pressure of cytotoxic T cells (CTLs), hepatitis B virus (HBV) evolves to accumulate mutations more likely within epitopes to evade immune detection. However, little is known about the specific patterns of the immune pressure-associated HBV mutation of T-cell epitopes and their link to disease progression. Here, we observed a correlation of the accumulated variants on HBV core protein (HBc) with the disease severity of HBV infection. Further analysis indicated that these substitutions were mostly located within CD8+ T-cell epitopes of HBc protein, which were systematically screened and identified in an unbiased manner in our study. From individual peptide level to the human leukocyte antigen I (HLA-I)-restricted population level, we elucidated that the mutations in these well-defined HLA-I-restricted T-cell epitopes significantly decreased antiviral activity-specific CTLs and were positively associated with clinical parameters and disease progression in HBV-infected patients. The molecular pattern for viral epitope variations based on the sequencing of 105 HBV virus genomes indicated that the C-terminal portion (Pc), especially the Pc-1 and Pc-2 positions, have the highest mutation rates. Further structural analysis of HLA-A*02 complexed to diverse CD8+ T-cell epitopes revealed that the highly variable C-terminal bulged peak of M-shaped HBc-derived epitopes are solvent exposed, and most of the CDR3βs of the T-cell receptor hover over them. These data shed light on the molecular and immunological mechanisms of T-cell immunity-associated viral evolution in hepatitis B progression, which is beneficial for designing immunotherapies and vaccines.
IMPORTANCE The specific patterns of sequence polymorphisms of T-cell epitopes and the immune mechanisms of the HBV epitope mutation-linked disease progression are largely unclear. In this study, we systematically evaluated the contribution of CD8+ T cells to the disease progress-associated evolution of HBV. By evaluation of patient T-cell responses based on the peptide repertoire, we comprehensively characterized the association of clinical parameters in chronic hepatitis B with the antiviral T-cell response-associated mutations of the viruses from the single-epitope level to the overall HLA-I-restricted peptide levels. Furthermore, we investigated the molecular basis of the HLA-A2-restricted peptide immune escape and found that the solvent-exposed C-terminal portion of the epitopes is highly variable under CDR3β recognition. Our work may provide a comprehensive evaluation of viral mutations impacted by the host CTL response in HBV disease progression in the context of the full repertoire of HBc-derived epitopes.
INTRODUCTION
Hepatitis B virus (HBV) chronically infects 240 million people worldwide and is associated with a much higher risk for progressive cirrhosis, liver failure, and hepatocellular carcinoma (1). The virus-specific cytotoxic T lymphocyte (CTL)-mediated immune responses most likely play a dominant role in determination of disease progression and outcome, as a potent HBV-specific CTL response is observed during acute hepatitis B (AHB) with viral control and viral clearance. In contrast, the viral CTL response is minimal or undetectable in chronic hepatitis B (CHB) with viral persistence and immune tolerance (2–4). The key role of virus-specific CTLs in HBV clearance is further supported by CD8+ T-cell depletion experiments in chimpanzees (5).
Analysis of specific CTLs shows that the highly conserved HBV core protein (HBc) elicits the strongest CTL responses, which are associated with viral control (6, 7). In CHB, HBV mutational escape may occur in the presence of immune selection pressure for viral adaption to host immune responses and persistent infection. The highly expressed HBc is selected to have relatively low epitope density for evolutionary selection (8). Systematic analysis of HBV precore/core sequences in concert with the host human leukocyte antigen (HLA) class I genotype of CHB demonstrates that seven of nine frequent residue substitutions are located inside CTL epitopes (9). Mutations in HBc are associated with HLA class I alleles in response to CD8+ T-cell selection pressure (10). Furthermore, increased mutations in T-cell epitopes of the core protein are significantly associated with the development of CHB, transition from the immunotolerant to immunoactive phase, and disease progression (11–13). HBV mutations under immune selection are not equally distributed inside or in the flanking region of HLA class I- and class II-restricted epitopes from viral antigens. HLA-associated polymorphisms in CHB have been observed on both anchor and non-anchor residues within epitopes that may lead to altered scores for binding to HLA molecules or T-cell recognition by T-cell receptors (9, 14, 15). However, several virus-specific CTL epitopes can be recognized by T cells in the context of a wide range of HLA alleles, possibly showing promiscuous recognition of a given viral peptide (16). In addition, it is also possible that mutations in immunodominant epitopes facilitate induction of subdominant CTLs with antiviral activity (17). As the HBV genome of only 3.2 kb encodes multiple overlapping viral proteins, mutations in T-cell epitopes may simultaneously affect the function of viral proteins and subsequent viral replication (18, 19). As a consequence, the full repertoire of CTL epitopes has not been determined in CHB, and it is largely unclear if sequence polymorphisms follow any specific patterns of amino acid substitution.
Here, we systematically screened and identified HLA-A2-restricted epitopes from the HBc of HBV genotypes B and C using an overlapping 9-mer peptide pool to assess their structural and immunological functions. We analyzed 239 HBV core sequences in concert with the host HLA-A genotype and identified frequent amino acid substitutions within all HLA-A2-restricted epitopes in statistical support of CTL-associated selection. Importantly, the amino acid substitution pattern and its structural mechanism were further evaluated in response to selection pressure.
RESULTS
The impact of HBc variants on clinical disease severity of HBV infection.
To investigate the impact of accumulated variations on viral persistence and disease progress of the patients, 239 CHB patients and 146 ACLF patients were enrolled (Table 1). A total of 171 HBc sequences of genotype B and 159 HBc sequences of genotype C from the protein database of the NCBI were aligned. The amino acid variation cutoff was set as more than 10% difference. Patients infected with HBV containing more variations in HBc exhibited much higher alanine aminotransferase (ALT) levels and aspartate aminotransferase (AST) levels (Fig. 1A and B), and a similar trend was observed for HBV DNA loads, although the difference did not reach statistical significance (Fig. 1C). Moreover, the variation in numbers of HBc was positively correlated with disease progression in HBV-infected patients (Fig. 1D). Meanwhile, the impact of amino acid variants of another viral main structure protein, HBs, on disease severity was also explored. Although a similar trend was observed for HBs, the correlation between HBs variation and disease severity was less evident (data not shown). Thus, we focused on HBc for further study. Considering that HBV mutation was generally related to host T-cell responses against the virus-derived T-cell epitopes, a systematic screening of the CD8+ T-cell epitopes on HBc was performed to investigate the mechanism underpinning the link between HBc variants and patient clinical indexes.
TABLE 1.
Clinical and virologic characteristic of CHB-M, CHB-S, and ACLF patientsa
| Characteristic | Value(s) for: |
P value | ||
|---|---|---|---|---|
| CHB-M | CHB-S | ACLF | ||
| No. of patients | 116 | 123 | 146 | |
| Age (yr; means ± SD) | 41.0 ± 13.0 | 38.8 ± 13.4 | 46.2 ± 11.9 | <0.01 |
| Gender (no. of M/F) | 101/15 | 106/17 | 117/29 | >0.05 |
| No. (%) of HLA-A2-positive patients | 47 (40.5) | 55 (44.7) | 81 (55.5) | >0.05 |
| No. (%) of patients by HBV genotype | ||||
| B | 27 (23.3) | 37 (30.1) | 43 (29.5) | >0.05 |
| C | 88 (75.9) | 84 (68.3) | 99 (67.8) | >0.05 |
| No. (%) of patients HBeAg positive | 84 (72.4) | 52 (42.3) | 40 (27.4) | <0.01 |
| No. of HBV DNA (copies/ml) | ||||
| Mean | 3.1 × 10⁷ | 1.4 × 10⁷ | 1.1 × 10⁷ | >0.05 |
| Range | 2,354 to 1.6 × 10⁹ | 500 to 2.6 × 10⁸ | 500 to 5.3 × 10⁸ | |
| ALT (IU/liter) (means ± SD) | 171.4 ± 250.3 | 455.2 ± 373.2 | 251.9 ± 380.2 | <0.01 |
| AST (IU/liter) (means ± SD) | 113.9 ± 131.8 | 285.9 ± 267.1 | 274.1 ± 396.0 | <0.01 |
HBV, hepatitis B virus; CHB-M, mild chronic hepatitis B; CHB-S, severe chronic hepatitis B; ACLF, acute-on-chronic liver failure; M, male; F, female; HBeAg, hepatitis B e antigen; ALT, alanine aminotransferase; AST, aspartate aminotransferase.
FIG 1.

Impact of HBc variations on ALT levels, viral DNA loads, and disease progression in HBV-infected patients. Distribution of serum ALT and AST levels (A and B) and HBV DNA loads (C) in CHB patients infected with HBV containing no variation (none), low variations (variation numbers 1 to 3, low), and high variations (variation numbers 4 to 15, high) within HBc. The variation cutoff numbers for low and high variations were arbitrarily set to obtain a good distribution of patient numbers in each group for statistical analysis. Student's t test was used to determine P values. (D) Distribution of the numbers of HBc variation in CHB and ACLF patients. Pearson's χ2 test was used to determine P values. The number of patients in each group is shown. *, P < 0.05; **, P < 0.01.
Systematic screening of potential 9-mer HLA-A*0201-restricted epitopes in HBc of genotypes B and C.
An overlapping 9-mer peptide pool covering HBc (amino acid 1 to 150) and its dominant variants was used to screen potential HLA-A2-restricted epitopes within HBc of genotypes B and C, two prevalent genotypes in China. As shown in the T2 binding assay (Fig. 2A), four peptides had high affinity for binding to HLA-A*0201 molecules, as evidenced by a fluorescence index (FI) value of >1.5 (3.38 for HBc60-68 [V60], 3.06 for HBc123-131 [P130], 1.91 for HBc123-131 [T130], and 2.41 for HBc141-149 [S141]). The two HLA-A2-restricted CD8+ T-cell epitopes, HBc60-68 (V60) and HBc141-149, have been reported by us (15, 19). The P130T variation was chosen for further study.
FIG 2.

HBc P130T variation causes decreased antiviral activity of peptide-specific CTLs. (A) The binding affinity of all 191 nonapeptides derived from the HBc of HBV genotypes B and C to HLA-A2 molecules was detected by MHC stabilization assays with T2 cells. HBc18-27 served as the positive control (PC). An arbitrarily chosen FI value of >1.5 was used as a cutoff for further analysis. Peptides of wild types (wt) and variants (mut) are shown in black and red columns, respectively. (B to D) Six- to 8-week-old HLA-A2.1/Kb transgenic mice were inoculated with an HBV DNA prime/peptide boost regimen at weeks 1, 3, and 4. Mice were sacrificed 1 week after the last immunization and the splenocytes were separated. Mice immunized with HBc82-90 and HBc18-27 peptide served as negative control (NC) and PC for immunization, respectively. (B) After in vitro stimulation for 10 days, the splenocytes were harvested and stained with HLA-A*0201/P130, HLA-A*0201/T130, HLA-A*0201/flu, or HBc18-27 tetramer. HLA-A*0201/flu tetramer served as the isotype tetramer control. (C) Fresh splenocytes (1 × 10⁶) from immunized mice were stimulated with P130, T130, HBc82-90, or HBc18-27 peptide to detect peptide-specific CTLs by IFN-γ ELISPOT assays. (D) HepG2 cells transfected with pcDNA3.1-HBcP130 or pcDNA3.1-HBcT130 were labeled with CFSE as target cells and mixed with P130, T130, HBc82-90, or HBc18-27 peptide-stimulated splenocytes at different ratios (1:1, 1:10, and 1:20). The killing of target cells was detected by FACS. E:T, effector-to-target cell ratio. (E to I) F1 hybrids of HBV transgenic BALB/c mice and HLA-A2.1/kb transgenic mice that were double positive for serum HBsAg/HBV DNA and HLA-A*0201 expression were immunized with an HBV DNA prime/peptide boost regimen as described obviously. (E) Expression of HLA-A2 was determined by FACS in the liver and spleen of F1 hybrids. (F) Serum HBsAg was measured by ELISA. OD, optical density. (G) Serum HBV DNA copies were detected by real-time PCR analysis. (H) IFN-γ secretion of peptide-specific CTLs was detected by ELISPOT assays. (I) The killing assay was performed as described in the legend to Fig. 2D. The data show means ± standard deviations from five mice. Student's t test was used to determine P values. *, P < 0.05; **, P < 0.01. Data are representative of three independent experiments with similar results.
We next examined whether P130 could induce a peptide-specific CTL response in HLA-A2.1/Kb transgenic mice as well as the effect of the P130T variation. As shown in Fig. 2B, a much higher proportion of P130 tetramer+ CD8+ T cells was detected than T130 tetramer+ CD8+ T cells (33.36% ± 7.35% versus 9.01% ± 1.53%; P < 0.05). Similar results were obtained in enzyme-linked immunosorbent spot (ELISPOT) assays (Fig. 2C). Furthermore, specific CTLs from P130-immunized mice exhibited higher antiviral cytotoxicity than those from T130-immunized mice (P < 0.05) (Fig. 2D).
F1 hybrids of HLA-A2.1/Kb mice and HBV transgenic mice were generated as the experimental model to determine the antiviral activity of P130- and T130-specific CTL responses. Expression of HLA-A2 was verified by fluorescence-activated cell sorting (FACS) in the liver and spleen of F1 hybrids (Fig. 2E). Much lower expression of HLA-A2 was observed in hepatocytes. This may be due to relatively low expression of major histocompatibility complex (MHC) molecules in liver and high MHC expression in lymphocytes. The HLA-A2 expression level in hepatocytes of HLA-A2 transgenic mice was only slightly higher than that of HBV/HLA-A2 transgenic mice. The difference in HLA-A2 expression in hepatocytes between HLA-A2 transgenic mice and HBV/HLA-A2 hybrid mice by a gene dosage effect was not as evident as that in splenocytes, which may be due to much lower expression of HLA-A2 in liver. As shown in Fig. 2F, compared to the negative control, HBsAg levels in P130- and T130-immunized mice significantly decreased. Notably, P130-immunized mice displayed an approximately 15% greater decrease in HBsAg levels than T130-immunized mice (P < 0.05). Similar results were obtained in the quantification of serum HBV-DNA levels (Fig. 2G). An approximately 57-fold reduction of viral DNA levels in P130-immunized mice and 7-fold reduction in T130-immunized mice were observed compared to levels for control mice. The relatively moderate difference of anti-HBV activity between the two peptides may be due to high levels of viral replication in mice, immunosuppressive microenvironment in liver, and inadequate viral suppression capacity of a single CTL clone. P130 peptide elicited stronger specific CTL responses than T130 (P < 0.05) (Fig. 2H). Interestingly, moderate cross-reactivity was observed between the P130- and T130-specific T-cell responses. Similar results were observed by cytotoxicity assays (Fig. 2I). These data indicate that the HBc P130T variation results in decreased antiviral CTL responses.
Molecular basis for the P130T variation.
To address the underlying mechanism of the different binding capacities of P130 and T130 to HLA-A*0201, we comparatively analyzed the binding stability of these two peptides by in vitro refolding assay (Fig. 3A) and circular dichroism spectroscopy (Fig. 3B). Both of the peptides could help HLA-A*0201 to renature in vitro but with a higher efficacy for P130. The midpoint transition temperature of the well-refolded HLA-A*0201/P130 peptide (43°C) was moderately higher than that of HLA-A*0201/T130 (40°C). The different binding capacities of P130 and its mutant T130 were also shown in the T2 cell binding assay (Fig. 3C). None of the N- or C-terminally truncated or extended peptides of P130 and T130 displayed high binding affinity to HLA-A*0201 molecules, i.e., all of their FIs were <0.2 (data not shown), which indicates that P130 and T130 are the optimized epitopes.
FIG 3.

Affinity of binding of the peptides P130 and T130 to HLA-A*0201 and the structure of the HLA-A*0201/P130 and HLA-A*0201/T130 complexes. (A) In vitro refolding of P130 (GVWIRTPPA) or T130 (GVWIRTPTA) peptide with HLA-A*0201 heavy chain and β2m. The refolded complexes were detected by size exclusion chromatography on a HiLoad 16/60 Superdex 200 column. The peaks of the HLA complexes with the expected molecular mass of 45 kDa eluted at the estimated volume of 85 ml. mAU, milli-absorbance units. (B) The thermostabilities of the HLA-A*0201/P130 and HLA-A*0201/T130 complexes were analyzed by circular dichroism spectroscopy. The temperature was increased by 1°C/min. The denaturation curves were generated using the Origin 8.0 program (OriginLab). (C) Flow cytometry analysis of P130 and T130 peptide by T2 binding assays. HBc82-90 and HBc18-27 served as the negative (NC) and positive control (PC), respectively. (D) The superior view of the aligned P130 (purple) and T130 (orange) when presented by HLA-A*0201. The crystal structures of HLA-A*0201/P130 and HLA-A*0201/T130 complexes were determined to 2.0-Å resolution. The names of conserved residues are shown in black, and P8-Pro in P130 and P8-Thr in T130 are denoted in purple and orange fonts, respectively. (E) The side view of P130 and T130 shows the conformational shift of P5-Arg and P6-Thr. (F) The hydrogen bonds between P6-Thr of P130 with Thr73 and Arg97 of HLA-A*0201, involving a water molecule. (G) The hydrogen bonds between P8-Thr of T130 with Lys146 HLA-A*0201.
Furthermore, we solved the crystal structure of HLA-A*0201 complexed to P130 and T130 with high resolutions of 1.7 Å and 2.0 Å, respectively (Table 2). The overall structure of HLA-A*0201/P130 is similar to that of HLA-A*0201/T130 (Fig. 3D and E). However, there are two major conformational shifts, aside from the mutated P8-Pro to P8-Thr, between the two structures. The P5-Arg of T130 swings to the α2-helix of HLA-A*0201 compared to the position of P5-Arg of P130. Moreover, the P6-Thr of T130 shifts slightly upward compared to the lower position of P6-Thr of P130. Detailed HLA I-peptide interaction analysis indicated that P6-Thr of P130 forms multiple hydrogen bonds within the HLA-A*0201 groove (Fig. 3F). One direct hydrogen bond is formed between the P6-Thr of P130 and Thr73 on the HLA-A*0201 α2-helix. The P6-Thr of P130 also interacts with Arg97 through a water molecule within the peptide binding groove. In contrast, no hydrogen bonds can be found between the P6-Thr of T130 and the residues within HLA-A*0201 (Fig. 3G). However, the mutated residue P8-Thr of T130 forms a hydrogen bond with Lys146, which may contribute to the conformational twisting of P5-Arg and P6-Thr. Thus, the conformational differences may contribute to the variance in binding affinity of the two peptides to HLA-A2 molecules.
TABLE 2.
X-ray data processing and refinement statistics
| Parameter | Value(s) for: |
|
|---|---|---|
| HLA-A*0201/T130 | HLA-A*0201/P130 | |
| PDB code | 5WSH | 5E00 |
| Data collection statistics | ||
| Space group | C2— | P212121 |
| Cell parameters (Å) | ||
| a | 112.159 | 48.608 |
| b | 78.675 | 72.006 |
| c | 60.295 | 123.788 |
| α | 90.0 | 90.0 |
| β | 96.9 | 90.0 |
| γ | 90.0 | 90.0 |
| Wavelength (Å) | 1.54178 | 1.00000 |
| Resolution (Å) | 50.0–2.0 (2.07–2.0)a | 50.0–1.70 (1.76–1.70) |
| Total no. of reflections | 197,729 | 381,837 |
| Completenessb (%) | 93.3 (99.3) | 99.4 (100) |
| Rmerge (%) | 7.7 (36.1) | 5.9(28.5) |
| I/σ | 22.6(4.3) | 32.2(7.8) |
| Refinement statistics | ||
| R (%) | 16.2 | 18.8 |
| Rfree (%) | 19.6 | 22.5 |
| RMSDc | ||
| Bonds (Å) | 0.005 | 0.008 |
| Angles (°) | 0.874 | 1.182 |
| Ramachandran map | ||
| Most favored (%) | 93.2 | 91.4 |
| Additional allowed (%) | 6.5 | 8.3 |
| Generously allowed (%) | 0.3 | 0.3 |
| Disallowed (%) | 0.0 | 0.0 |
Values in parentheses refer to statistics in the outermost resolution shell.
Data completeness was determined by dividing the number of independent reflections by the total theoretical number.
RMSD, root mean squared deviations.
HBc P130T variation in HBV-infected patients is associated with severe hepatitis and disease progression.
Peptide-specific CTLs were detected ex vivo using fresh peripheral mononuclear blood cells (PBMCs) from 19 HLA-A2-positive AHB patients by gamma interferon (IFN-γ) ELISPOT assay. As shown in Fig. 4A, patients infected with wild-type HBV exhibited a significantly higher peptide-specific CTL response than patients infected with the HBc P130T variants (spot-forming cells [SFCs], 160.6 ± 86.6 versus 80.8 ± 36.4; P < 0.05).
FIG 4.

Analyses of the clinical relevance of the HBc P130T variation in HBV-infected patients. (A) Measurement of peptide-specific CTLs in PBMCs from AHB patients by ELISPOT assays. PBMCs (2 × 10⁵/well) isolated from HLA-A2-positive patients (n = 19) grouped as infected with wild-type (HBcP130, n = 13) or variant (HBcT130, n = 6) virus were stimulated with peptides P130, T130, HBc82-90, or HBc18-27, respectively. HBc82-90 and HBc18-27 served as negative and positive controls. (B to E) Two hundred twenty-one CHB patients were divided into HLA-A2-positive (A2 pos) and -negative (A2 neg) groups infected with wild-type (P130) or variant (T130) HBV. Serum levels of ALT (B), AST (C), and HBV DNA (D) in CHB patients were detected. Student's t test was used to determine P values. (E) Analysis of the prevalence of the HBcP130T variation in CHB-M, CHB-S, and ACLF patients. (F and G) Analysis of the prevalence of the HBcP130T variation in HLA-A2-positive and -negative patients (F) or patients with ALT of ≤40 and >40 (G). (H) Measurement of peptide-specific CTLs in PBMCs from CHB patients by ELISPOT assays. PBMCs (2 × 10⁵/well) isolated from HLA-A2-positive patients (n = 22) grouped as infected with wild-type (HBcP130, n = 14) or variant (HBcT130, n = 8) virus were stimulated with peptides P130, T130, or HBc82-90 as a negative control. The number of patients in each group is shown. Pearson's χ2 test was used to determine P values. *, P < 0.05; **, P < 0.01.
A total of 239 CHB patients and 146 ACLF patients (Table 1) then were enrolled to investigate the clinical and virological features impacted by the HBc P130T mutation. The population size provided an adequate number of patients in each group for assessing the comparison of significance. The viruses from 76.2% (182/239) of the CHB patients possessed a HBc P130, and 16.3% (39/239) of patients had the HBc T130 variant (18/239 for other variants). To address the HLA-A*02-associated selection pressure on the P130T variation, we divided all patients into two groups: HLA-A2 positive and HLA-A2 negative. In the HLA-A2-positive group, there was a trend that patients with wild-type virus had higher ALT (Fig. 4B) and AST levels (Fig. 4C) than those with HBc P130T variants, but the difference did not reach statistical significance. Patients infected with HBc P130T variants exhibited significantly higher DNA loads (approximately 3-fold higher) than those with wild-type isolates (P < 0.05) (Fig. 4D). Notably, P130T variation was positively associated with the disease progression in HLA-A2-positive patients (Fig. 4E). In contrast, no such differences were observed in HLA-A2-negative patients. Compared to HLA-A2-negative patients, HLA-A2-positive patients exhibited a relatively higher P130T variation rate (HLA-A2 positive versus HLA-A2 negative, 25.3% versus 11.9%) (Fig. 4F). This trend was only observed in immune-active CHB but not in tolerant CHB (Fig. 4G). Moreover, a significantly higher HBc-specific CD8+ T-cell response was observed in patients infected with P130 virus than in those with T130 variants (SFCs, 62.0 ± 25.9 versus 38.9 ± 10.1; P < 0.05) (Fig. 4H). These results indicate that immune pressure by CTLs is related to mutation rate within the epitope.
Clinical effect of HLA-A*02-associated selection pressure on HBV evolution.
To investigate the overall impact of the variation within the HLA-A*02 epitopes on the clinical progression of HBV-infected patients, all 11 defined HLA-A2-restricted CD8+ T-cell epitopes in HBc by others and our group were included for analysis (Table 3). As shown in Fig. 5A, among the HLA-A2-positive CHB, patients infected with HBV variants within the epitopes had approximately 5-fold higher viral DNA levels than those with wild-type isolates (P < 0.05). In contrast, no such difference was observed in HLA-A2-negative patients. Interestingly, the impact of HLA-A2-associated HBc variation on HBV DNA levels was somewhat different between genotypes B and C, with a more efficient impact on genotype B (Fig. 5B). A similar trend was observed for ALT and AST levels, but the difference did not reach statistical significance (Fig. 5C and D). Furthermore, the prevalence of variations in HLA-A2-restricted epitopes increased with disease progression in HLA-A2-positive but not HLA-A2-negative patients (Fig. 5E). Notably, relatively higher percentages of variations in HLA-A2-restricted epitopes were observed in HLA-A2-positive patients than in HLA-A2-negative patients (HLA-A2 positive versus HLA-A2 negative, 64.7% versus 58.4%) (Fig. 5F). High background variation rates within these HLA-A2-restricted epitopes in HLA-A2-negative patients may be due to infection of the variants in the beginning, mutations that may simultaneously affect viral replication, etc. Thus, although both the HLA-A2-negative and HLA-A2-positive patients had baseline variation rates in these HLA-A2-restricted epitopes, a relatively higher percentage of epitope variations in HLA-A2-positive patients may be associated with the immune impact. In addition, higher epitope mutation rate in HLA-A2-positive patients was only observed in immune-active CHB but not in tolerant CHB (Fig. 5G).
TABLE 3.
List of CD8 epitopes from HBc included in the analysis
| Start position | Stop position | HLA | Sequence |
|---|---|---|---|
| 7 | 16 | A0206 | KEFGASVELL |
| 11 | 27 | A2, class II | ATVELLSFLPSDFFPSV |
| 18 | 27 | A2 | FLPADFFPSV |
| 19 | 27 | B5101, B3501, B0702 | LPSDFFPSV |
| 23 | 31 | A24 | FFPSIRDLL |
| 30 | 38 | A101 | LLDTASALY |
| 42 | 50 | B41 | LESPEHCSP |
| 60 | 68 | A2 | VCWGELMNL |
| 63 | 71 | B44 | GDLMNLATW |
| 64 | 72 | A0201 | ELMTLATWV |
| 108 | 118 | A0201 | LTFGRETVLEN |
| 76 | 89 | Class I | LEDPASRDLVVSYV |
| 88 | 96 | A11 | YVNVNMGLK |
| 101 | 110 | A24 | LWFHISCLTF |
| 104 | 112 | A33 | HISCLTFGR |
| 107 | 115 | A2 | CLTFGRETV |
| 112 | 122 | B49 | RETVIEYLVSF |
| 115 | 124 | A2 | VLEYLVSFGV |
| 117 | 125 | A24 | EYLVSFGVW |
| 119 | 127 | A3303 | LVSFGVWIR |
| 122 | 133 | A33 | FGVWIRTPPAYR |
| 123 | 131 | A2 | GVWIRTPPA |
| 139 | 148 | A2 | ILSTLPETTV |
| 141 | 149 | A2 | STLPETTVV |
| 141 | 151 | A1101, A68, A31 | STLPETTVVRR |
FIG 5.

Clinical association of substitutions within HLA-A2-restricted and A24-restricted epitopes of HBc in HBV-infected patients. Distribution of serum HBV DNA loads (A and B) and ALT (C) and AST (D) levels in HLA-A2-positive (A2 pos) or -negative (A2 neg) CHB infected with HBV isolates of HBc variations located inside (A2 in) or outside (A2 out) HLA-A2-restricted epitopes. Student's t test was used to determine P values. (E) Distribution of the rate of the variation of HLA-A2-restricted HBc epitopes in CHB and ACLF patients. (F and G) Analysis of the rate of the variations of HLA-A2-restricted epitopes in HLA-A2-positive and -negative patients (F) or patients with ALT of ≤40 and >40 (G). Distribution of serum HBV DNA loads (H) and ALT (I) and AST (J) levels in HLA-A24-positive (A24 pos) or -negative (A24 neg) CHB infected with HBV isolates of HBc variations located inside (A24 in) or outside (A24 out) HLA-A24-restricted epitopes. (K) Distribution of the rate of the variation of HLA-A24-restricted HBc epitopes in CHB and ACLF patients. The number of patients in each group is shown. Pearson's χ2 test was used to determine P values. *, P < 0.05; **, P < 0.01.
We further analyzed clinical association of variations in HLA-A24-restricted epitopes. Three defined HLA-A24-restricted CD8+ T-cell epitopes in HBc were included for analysis (Table 3). HLA-A24-positive patients infected with variants within the epitopes exhibited higher HBV DNA, ALT, and AST levels than those infected with wild-type isolates (Fig. 5H, I, and J), and the prevalence of variations within epitopes increased with the disease progression (Fig. 5K). Together, the results indicate that the CTL-mediated selection pressure is associated with mutations of epitopes.
Landscape of HBV variations on HBc associated with virus-specific CD8+ T-cell responses.
We further analyzed the variation rate of each amino acid position on HBc with the coverage of all published HLA class I-restricted T-cell epitopes in the Immune Epitope Database (Fig. 6A and Table 3). The clinical relevance of hot variation sites with variation rates of ≥10% was analyzed. As shown in Fig. 6B and C, compared to patients infected with wild-type isolates, most patients infected with variants exhibited higher ALT levels and AST levels, especially variation at positions P5, L60, S87, and I97. Similar results were observed in HBV DNA levels (Fig. 6D). Patients infected with variants at positions I27, L60, P130, and P135 had much higher HBV DNA loads than those infected with wild-type virus. Furthermore, the prevalence of six variations (P5, S35, L60, S87 I97, and P130) significantly increased with the disease progression (Fig. 6E). Of note, relatively higher viral DNA loads and more severe liver disease in patients infected with variants were observed in HLA-A2/A24-positive but not -negative patients. Only the information of HLA-A2 and -A24 typing are available for the patients, so they were divided by their HLA-A2 and -A24 alleles (Fig. 6B to E). It is possible that the reason that some variations within epitopes did not result in significant differences of clinical parameters is because of the diluted effect of mixed HLA-A types included in the analysis.
FIG 6.

Analysis of the clinical relevance of the HBc variations within HLA I-restricted epitopes in HBV-infected patients. (A) Statistical analysis of variation rate for each position of HBc in 239 CHB patients. Variation rates of more than 10% were chosen as hot variations. Main substitution amino acids of each site are labeled. The coverage of all published HLA class I-restricted T-cell epitopes in the Immune Epitope Database is indicated by red (HLA-A2 restricted) and black (not HLA-A2 restricted) sticks. aa, amino acid. Serum ALT (B) and AST (C) levels and HBV DNA loads (D) in CHB patients infected with wild-type virus (wt) and variants with hot variations (mut) were compared. Patients infected with variants located in HLA-A2 (V13, I27, L60, and P130)- and HLA-A24 (I27)-restricted epitopes were divided into HLA-A2-positive (A2 pos) and HLA-A2-negative (A2 neg) groups or HLA-A24-positive (A24 pos) and -negative (A24 neg) groups. Student's t test was used to determine P values. (E) Distribution of the hot variations in CHB-M, CHB-S, and ACLF patients. The number of patients in each group is shown. Pearson's χ2 test was used to determine P values. *, P < 0.05; **, P < 0.01.
The position-related substitution bias of HLA-A*0201 epitopes.
Finally, we retrieved the CD8+ T-cell epitopes in HBc (HBc18-27, HBc60-68, HBc123-131, and HBc141-149 complexed to HLA-A*02) and HBV pol110-118 epitope presented by HLA-A*1101, the structures of which have been resolved. In general, HLA-A2 presents HBc-derived epitopes in an M-shaped conformation, whereas the HBV pol110-118 epitope presented by HLA-A*1101 shows an n-shaped conformation in the bulged middle portion (Fig. 7A, left). Two primary anchor residues insert into the B and F pockets of HLA-A2, while a secondary anchor at P6 (9-mer peptide) or P7 (10-mer peptide) also protrude a side chain into the groove, but the protrusion is much shallower than that of the primary anchors. Thus, the solvent-exposed middle portion of the peptides can be divided into two different parts by the secondary anchor in the median portion of the peptide: the N-terminal part comprising P4 and P5 for 9-mer peptides or P4 to P6 for 10-mer peptides and the C-terminal part, including P7 and P8 for the 9-mer peptide or P8 and P9 for 10-mer peptides (Fig. 7A, right). We found that the accumulated mutation rates were similar (8 to 19 substitutions per 1,000 sites) for the primary anchor residues at P2 and Pc (C-terminal position), as well as for the secondary anchor residue. Strikingly, the solvent-exposed C-terminal portion of the epitopes has the highest mutation rate (65 substitutions/1,000 sites) of the analyzed positions, including the solvent-exposed N-terminal portion (16 substitutions/1,000 sites) (Fig. 7B). Similar frequencies and patterns of sequence polymorphisms in the epitopes were observed between genotypes B and C (Fig. 7C and D).
FIG 7.
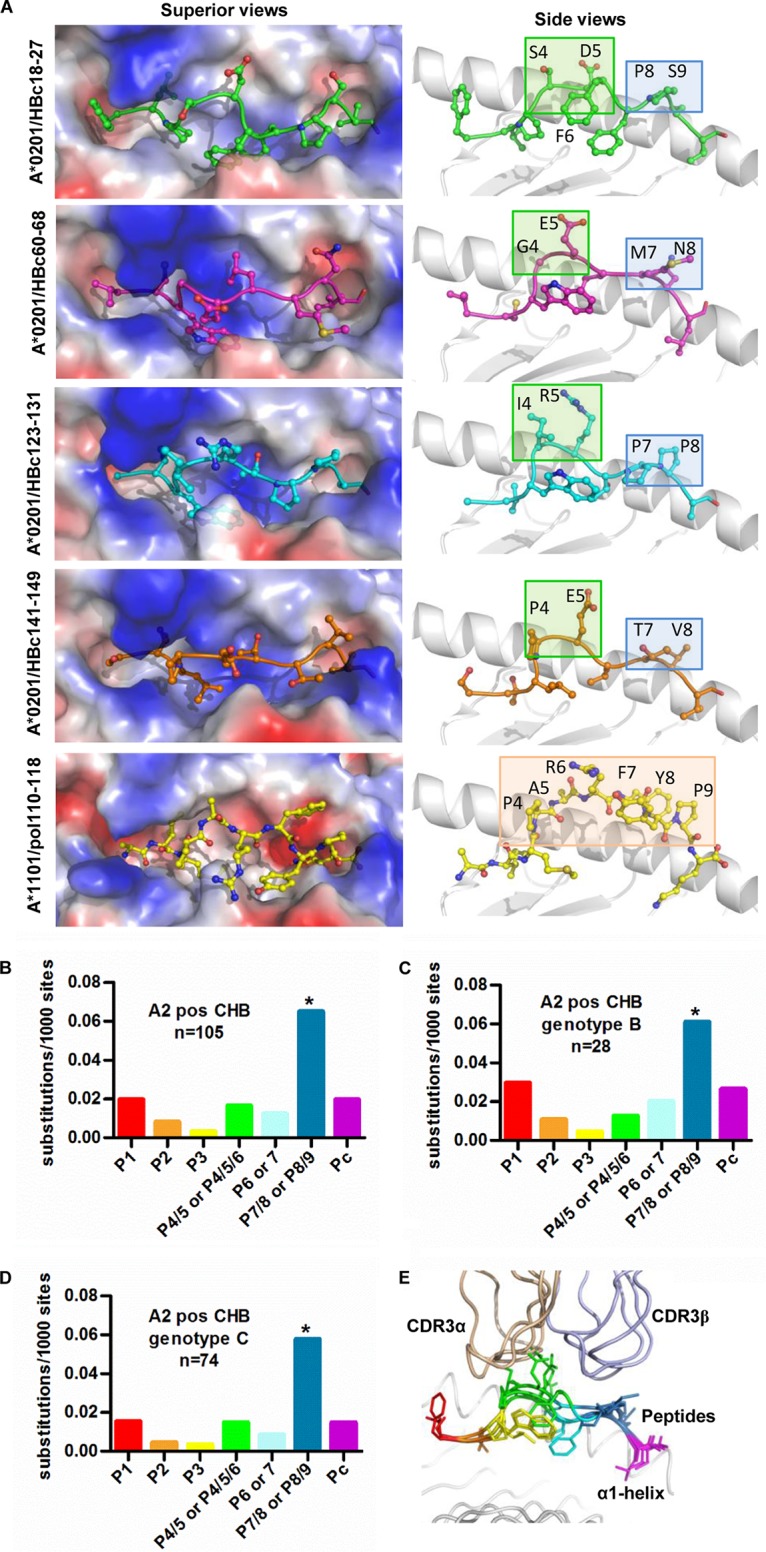
Analysis of HLA-A*02-associated viral sequence polymorphisms in HBc epitopes. (A) The structures of HLA-A*02 complexed with CD8+ T-cell epitopes. The structures of HBc18-27, HBc60-68, HBc123-131, and HBc141-149 epitopes available online are shown with sticks and spheres. The vacuum electrostatic potential surface of the peptide binding grooves of HLA-A*02 is shown. To clearly show the anchors in the pockets, the α2 helices were deleted in side view. The superior (left) and side (right) view of the HLA-A*0201 epitope is shown. (B to D) The site substitution frequencies among the 11 available HLA-A*0201 epitopes on HBc were calculated using the HBV genome sequence of all genotypes (B), genotype B (C), and genotype C (D) from 105 HLA-A*02-positive CHB patients. Pearson's χ2 test was used to determine P values. *, P < 0.05. (E) The impacts of substitution on different position of HLA-A*0201-restricted epitopes on TCRα and TCRβ recognition. The TCR recognition pattern of four HLA-A*0201-restricted peptides is shown. HBc18-27 (1HHH), blue; HBc 60-68 (4K7F), purple; HBc123-131 (5E00), orange; HBc141-149, cyan. The structures of TCR/MHC/peptide A6 (1AO7) and JM22 (1OGA) were used for the modeling by the superimposition of HLA-A*0201.
The T-cell receptor (TCR) binding pattern based on the previously determined HBc-derived peptides presented by HLA-A*0201 (20) shows that the CDR3αs of the TCRs largely dock over the solvent-exposed N-terminal part of the peptides, while the TCR CDR3βs hover over the solvent-exposed C-terminal part but also occasionally cover the P5 and P6 residues (Fig. 7E). This indicates that the high substitution frequency in position 7/8 in 9-mer epitopes or 8/9 in 10-mer epitopes causes immune evasion by avoiding T-cell recognition.
DISCUSSION
Immune escape mutations within HLA class I-associated epitopes are associated with viral adaption to the host CD8+ T-cell response in CHB. Previous studies showed that HBV preferably accumulates escape mutations within the highly expressed core proteins to reduce the number of epitopes (8, 9), and mutations in immune epitopes within the core gene were significantly correlated with higher stages of liver fibrosis and disease progression of CHB (6, 10, 12, 18). These studies support the notion that the HBc epitope repertoire elicits a key role against HBV infection, which is involved in viral immune escape and adaption mechanisms. However, most studies have utilized viral sequence phylogenetic analyses for identifying certain mutations that may be associated with HLA alleles or disease progression. As a consequence, the exact role of the HBc epitope repertoire has not been fully determined in CHB due to the existence of epitopes with resistance to immune selection, inadequate immunological data, and the complexity of disease course. Here, we used an overlapping 9-mer peptide pool to unbiasedly screen B and C genotype-derived HBc-specific CTL epitopes. CHB patients infected with viral variants in 11 HLA-A2-restricted epitopes of HBc exhibited much higher HBV DNA loads than those infected with the wild type in HLA-A2-positive CHB, which provides direct evidence that the HBc-specific CTL-mediated antiviral defense plays a key role against HBV infection. Moreover, mutations within epitopes are associated with HLA-A2 alleles in response to CD8+ T-cell selection pressure, as the percentage of patients with viral epitope mutations among HLA-A2-positive CHB was higher than that among HLA-A2-negative CHB, and this trend was only observed in immune-active CHB and not tolerant CHB. Finally, structural analysis reveals residue variation bias in the C-terminal portion of these four epitopes. Our work may therefore provide a comprehensive evaluation of the full repertoire of HBc-derived epitopes that bind to HLA-A2 in the context of host CTL response in HBV infection.
HBV-specific CD8+ T cells suppress viral replication and infection through direct killing of infected hepatocytes, IFN-mediated inhibition, or increased sensitivity of virus-infected hepatocytes toward tumor necrosis factor-induced death (4). As HBV transgenic mice were used to determine the antiviral activity of CTLs and only a transient rise of ALT levels was observed after epitope immunization, reduction of serum HBsAg and viral DNA (Fig. 2) may be attributed mainly to IFN-mediated inhibition by epitope-specific CTLs. Our data demonstrated that mutations in T-cell epitopes led to decreased antiviral activity of CTLs and increased viral replication. However, the observed association between accumulated HBc mutations and more severe liver disease in infected patients may not be attributed only to impaired virus-specific CTL response, subsequent uncontrolled viral infection, and persistent infiltration of nonspecific T cells and other lymphocytes in liver. It is very likely that higher immune responses and more severe liver disease could lead to increased HBc mutations to immune pressure. More studies are needed to clarify the mechanisms and driving force of epitope mutation-associated immune escape and liver disease progression.
The specific T-cell response by P130 and its antiviral activity were almost as strong as that of the classic epitope HBc18-27, and P130T variation resulted in a significantly decreased antiviral T-cell response in mice and AHB (Fig. 2 and 4A). Structural analysis indicated that P130T variation is not located in the anchor site, but it affects epitope conformational changes and its interaction with TCR (Fig. 7). In addition, there may exist reciprocal interactions between P130T and other variations in HBc (21). Our analysis showed that HBc I97L caused an abrupt decrease in viral DNA levels in CHB, and P130T seemed to offset this impact (data not shown). This deserves further investigation.
Previous structural studies focusing on MHC class I indicate that minor mutations in CD8+ T-cell epitopes can disrupt T-cell recognition and induce immune escape by the viruses (19, 22). In the present study, the P130T substitution both changes the peptide surface at residue P5-Arg and P8-Pro/Thr and impacts the binding of the secondary anchor P6-Thr to HLA-A*0201 (Fig. 3). The missing hydrogen bonds between P6-Thr with the residues in the groove is concordant with the lower binding affinity of the peptide T130 with HLA-A*0201.
Recent studies (20, 23) indicate that peptide binding is mainly attributed to CDR3α and CDR3β of the TCR. We observed that position 7/8 in 9-mer epitopes or 8/9 in 10-mer epitopes that are contacted by CDR3β have the highest substitution rate (Fig. 7B), indicating that HBV immune escape points toward epitope residues contacted by CDR3β loops. We hypothesize that aside from epitope-reducing mutations in anchor residues to evade immune detection and destruction, HBV accumulates mutations with immunodominance hierarchy patterns that generate specific CD8+ T cells with relatively low antiviral activity. Indeed, persistent skewed CDR3β gene usage was observed in chronic HBV infection, which may be associated with the development and maintenance of hepatitis, pathogenesis, and disease progression (24–26). This further validates our hypothesis that the high substitution frequency in the solvent-exposed C terminus of the epitopes contributes to immune escape by disrupting T-cell recognition and generating CTL subtypes with low antiviral activity. Conceivably, the impact of epitope mutation on viral titers (Fig. 6D) depends on its occurrence on different residue positions within epitopes (e.g., anchor residues or solvent-exposed residues) or immunodominant epitopes.
Our study had several limitations. First, mutations within HLA-A2 epitopes, including P130T, may be either due to CD8+ T-cell selection pressure or just the result of infection with T130 variant from the beginning in CHB. A longitudinal analysis of epitope mutations during HBV infection of individual patients is needed to address this issue in the future. Second, a limited number of patients in each group may hinder analysis of the clinical significance of the HBc variations. A large-scale study with additional patients is required to validate our results. Besides the defined HLA-A2-restricted epitopes in this study, it is worthwhile to investigate the impact of other HLA class I-restricted T-cell epitopes on viral immune escape, viral replication, and disease progression.
In summary, our study provides a comprehensive understanding underpinning the orchestration of the T-cell responses, immune escape-oriented virus evolution, and disease progression in HBV-infected patients. Structural proteomics based on the HLA-I molecules suggests that HBV evolves adaption under immune pressure by variations at the solvent-exposed C terminus of HLA-A2 epitopes that are recognized by CDR3β. Information regarding the sequence mutation pattern within epitopes and longitudinal analysis of epitope variation during CHB is essential to provide further dissection of the impact of CTL-driven selection across viral populations.
MATERIALS AND METHODS
Patients and blood samples.
Clinical information associated with HBc variations was analyzed based on the database of records for HBV-infected patients built by the Beijing 302 Hospital (Beijing, China). The criteria for diagnosis of CHB and acute-on-chronic liver failure (ACLF) complied with those of the management scheme of diagnostic and therapy of viral hepatitis and the diagnostic and treatment guidelines for liver failure, issued by the Chinese Society of Infectious Diseases and Parasitology and the Chinese Society of Hepatology, respectively (27). Based on the severity of HBV infection-associated liver disease, CHB was further divided into two groups: mild chronic hepatitis B (CHB-M) and severe chronic hepatitis B (CHB-S). CHB-M patients were defined as those with symptoms of mild hepatitis or abnormal hepatitis function. CHB-S patients display evident clinical symptoms that meet at least one of the following criteria: serum albumin level of ≤32 g/liter, serum total bilirubin of >85.5 μmol/liter, plasma prothrombin activity of 40 to 60%, and serum cholinesterase of <4,500 IU/liter (28). The clinical characteristics of all enrolled patients are described in Table 1. These 385 patients did not receive any antiviral therapeutic regimens for at least 1 year before clinical and virologic analysis. Therefore, they were suitable for the study on viral replication and T-cell detection.
Blood samples from 19 HLA-A2-restricted AHB and 22 CHB patients were collected, and the standards for diagnosis of AHB were utilized as described previously (29). The patients were assigned to two groups: patients infected with HBV containing HBc P130 or T130. Written informed consent was provided by all study participants. The study protocol was approved by the Ethics Committee of the Beijing 302 Hospital. All patients were negative for hepatitis C virus, hepatitis D virus, and HIV-1 infection and were hospitalized in the Beijing 302 Hospital from September 2010 to September 2011.
Mice.
HLA-A2.1/Kb transgenic mice of the C57BL/6 background (30) were kind gifts from W. L. Huang (IMCAS, Beijing, China). HBV transgenic mice were purchased from the Transgenic Engineering Lab, Infectious Disease Center (Guangzhou, China). F1 hybrids of HLA.A2.1/HBV transgenic mice were obtained by crossing male HLA-A2.1/Kb transgenic mice and female HBV transgenic BALB/c mice, and all tested positive for HLA-A2 expression by PCR (PROTRANS, Deutschland), serum HBV surface antigen (HBsAg) secretion by enzyme-linked immunosorbent assays (ELISA) (Kehua, China), and viral DNA by real-time PCR. All mice were maintained in pathogen-free facilities. Animal experiments were performed in strict accordance with the regulations of the Institute of Microbiology, Chinese Academy of Sciences of Research Ethics Committee, and the protocol was approved by the committee.
Plasmid constructs.
The wild-type HBc gene (P130) and mutated HBc gene (T130) were cloned into pcDNA3.1 (Invitrogen, USA) and designated pcDNA-HBcP130 and pcDNA-HBcT130, respectively.
Peptide synthesis.
To fully identify the potential HBc-derived CTL epitopes, a total of 191 overlapping nonapeptides (8-amino-acid overlap) covering HBc amino acids 1 to 150 were synthesized. The sequence of HBc was summarized from 171 HBc sequences of genotype B and 159 HBc sequences of genotype C, which were carefully searched from the protein database of the NCBI until 1 October 2008. If the variation rate of a certain amino acid exceeded 10%, a batch of peptides associated with this variation site was also synthesized. Additionally, another eight peptides (8- and 10-mers) related to the P130T variation were also evaluated in this study. All peptides were purified to >95% purity at Jier Biological (Shanghai, China). HBc18-27 (FLPSDFFPSV) and HBc82-90 (RELVVSYVN) peptides were used as positive and negative controls, respectively.
Cell culture and transfection.
The T2 cell line was a generous gift from Bin Gao (IMCAS, Beijing, China) and cultured in RPMI 1640 with 10% fetal bovine serum (Gibco BRL, Paisley, UK). The HepG2 cell line was obtained from the ATCC (Manassas, VA, USA) and maintained in Dulbecco's modified Eagle's medium (DMEM) supplemented with 10% fetal bovine serum. Transfections were performed with Lipofectamine 2000 (Invitrogen) as instructed by the manufacturer.
T2 binding assay.
To determine the binding capacity of synthetic peptides to HLA-A*0201 molecules, we performed major histocompatibility complex (MHC) stabilization assays on T2 cells as described previously (31). The fluorescence index (FI) was used to describe the binding capability of each candidate peptide and was determined by the following formula: (mean FITC fluorescence with the given peptide − mean FITC fluorescence without peptide)/(mean FITC fluorescence without peptide). Peptides with an FI of ≥1 were arbitrarily regarded as high-affinity candidate epitopes.
Crystallography and structure determination.
HLA-A*0201/peptide complexes were prepared as described previously (32). First, HLA-A*0201 heavy chains and β2 microglobulin (β2m) were expressed in inclusion bodies in Escherichia coli and then in vitro refolded and assembled into correct advanced structures in the presence of a high concentration of candidate peptides. The soluble refolded portion was concentrated and purified by HiLoad 16/60 Superdex 200 gel filtration chromatography and Resource-Q anion-exchange chromatography (GE Healthcare). The purified complexes were crystallized by the hanging drop vapor diffusion method at 18°C. Single HLA-A*0201-P130 crystals grew at a final concentration of 15 mg/ml in 0.2 M lithium sulfate monohydrate, 0.1 M bis-Tris, pH 6.5, and 25% polyethylene glycol 3350. HLA-A*0201-T130 crystals grew at a final concentration of 15 mg/ml in 3.5 M sodium formate, pH 7.0. For cryoprotection, crystals were transferred to reservoir solutions containing 20% glycerol. The data were collected at 100 K in-house on a Rigaku MicroMax007 rotating-anode X-ray generator operated at 40 KV and 20 mA (Cu Κα; λ = 1.5418 Å) equipped with an R-AXIS VII++ image-plate detector. Data were indexed and scaled using the HKL2000 software package (HKL research). The structures of two HLA/peptide complexes were solved by the molecular replacement method with the program MolRep using Protein Data Bank (PDB) entry 3I6G (33) as the search model.
Thermostability measurements using circular dichroism.
The thermostabilities of HLA-A2/peptide complexes were measured by circular dichroism spectroscopy. All HLA-A2/peptide complexes were prepared as described above and diluted to a final concentration of 150 μg/ml in a solution of 20 mM Tris (pH 8.0) and 50 mM NaCl. Circular dichroism spectra at 218 nm were determined on a Chirascan spectrometer (Applied Photophysics) using a thermostatically controlled cuvette at a rate of 1°C/min between 25 and 90°C. The denaturation curves were generated using the Origin 8.0 program (OriginLab). The midpoint transition temperature was determined as described previously (34).
Mouse immunization.
Six- to 8-week-old HLA-A2.1/kb transgenic mice were injected intramuscularly with 50 μg of plasmid pcDNA-HBcP130 or pcDNA-HBc-T130 at week 1 and subcutaneously with 50 μg of peptides bound to 30 μg of recombinant heat shock protein gp96 (35, 36) at weeks 3 and 4, respectively. Mice were sacrificed at week 5, and splenocytes were isolated as previously described (37). The HLA-A2.1/HBV transgenic mice were immunized with the same formulation. Blood samples were collected at different times by retrobulbar puncture.
Tetramer staining.
Purified splenocytes (1 × 10⁷ cells/well) were stimulated with 20 U/ml interleukin-2 (IL-2) and 50 μg/ml peptides for 10 days. Phycoerythrin (PE)-labeled HLA-A*0201 tetramers loaded with candidate peptides were purchased from EPIGEN (EPIGEN Biotech, Beijing, China). Peptide-stimulated splenocytes were first incubated with PE-tetramer for 45 min at room temperature and then incubated with peridinin chlorophyll protein-conjugated anti-mouse CD3 antibody (Ab) and allophycocyanin (APC)-conjugated anti-mouse CD8 Ab (eBioscience) at 4°C for 30 min. The prepared samples were loaded on a FACSCalibur (BD Biosciences) and analyzed using CellQuest software (BD Biosciences). HLA-A*0201/flu tetramer served as an isotype negative control.
IFN-γ ELISPOT assay.
Epitope-specific CTL responses were detected by enzyme-linked immunosorbent spot (ELISPOT) assays via the manufacturer's instructions. In brief, a total of 106 murine splenocytes or 2 × 10⁵ human peripheral blood mononuclear cells (PBMCs), along with 50 μg/ml of peptides, were added to each well and incubated at 37°C for 24 to 48 h. Phytohemagglutinin served as a positive control. Each test condition was performed in triplicate. The number of IFN-γ spots was counted and analyzed using an automatic ELISPOT reader (Cellular Technology Ltd., USA).
Cytotoxicity assay.
Carboxyfluorescein succinimidyl ester (CFSE)-based cytotoxicity assays were performed as described previously (38). Briefly, HepG2 cells transfected with pcDNA-HBcP130 or pcDNA-HBcT130 were labeled with CFSE as target cells, and then 105 target cells were incubated with respective peptide-stimulated splenocytes at different effector/target ratios (1:1, 10:1, and 20:1) at 37°C for 4 to 6 h. The cell mixtures were stained with propidium iodide using a Vybrant apoptosis assay kit (Invitrogen, USA) and analyzed with a FACSCalibur.
Virology assessment.
The secretion levels of serum HBsAg in HBV transgenic mice were measured by ELISA according to the manufacturer's instructions (Kehua Biotech, Shanghai, China). Serum HBV DNA levels were determined by real-time PCR using the SYBR green premix reagent (TaKaRa Bio Inc., Shiga, Japan).
Statistical analysis.
Student's t test and analysis of variance were used for comparison between two and three independent groups, respectively. The correlation between the rate of variation and disease progression was analyzed using Pearson's χ2 test. A P value of <0.05 was considered significant.
Accession number(s).
The coordinates and structure factors of peptide P130 and T130 complexed to HLA-A*0201 were deposited in PDB under accession codes 5E00 and 5WSH, respectively.
ACKNOWLEDGMENTS
We thank Jianxun Qi and Chai Yan for assistance with analysis of crystal structures.
This work was supported by a grant from the Major State Basic Research Development Program of China (973 Program) (no. 2014CB542602) and Strategic Priority Research Program of the Chinese Academy of Sciences (XDPB03), grants from the National Natural Science Foundation of China (31390432, 81761128002, 81621091, 81471960, 81673654, and 81672815), and One Belt and One Road International Science and Technology Cooperation of Chinese Academy of Sciences (153211KYSB20170001).
REFERENCES
- 1.Neuveut C, Wei Y, Buendia MA. 2010. Mechanisms of HBV-related hepatocarcinogenesis. J Hepatol 52:594–604. doi: 10.1016/j.jhep.2009.10.033. [DOI] [PubMed] [Google Scholar]
- 2.Shimizu Y. 2012. T cell immunopathogenesis and immunotherapeutic strategies for chronic hepatitis B virus infection. World J Gastroenterol 18:2443–2451. doi: 10.3748/wjg.v18.i20.2443. [DOI] [PMC free article] [PubMed] [Google Scholar]
- 3.Tan AT, Loggi E, Boni C, Chia A, Gehring AJ, Sastry KS, Goh V, Fisicaro P, Andreone P, Brander C, Lim SG, Ferrari C, Bihl F, Bertoletti A. 2008. Host ethnicity and virus genotype shape the hepatitis B virus-specific T-cell repertoire. J Virol 82:10986–10997. doi: 10.1128/JVI.01124-08. [DOI] [PMC free article] [PubMed] [Google Scholar]
- 4.Knolle PA, Thimme R. 2014. Hepatic immune regulation and its involvement in viral hepatitis infection. Gastroenterology 146:1193–1207. doi: 10.1053/j.gastro.2013.12.036. [DOI] [PubMed] [Google Scholar]
- 5.Thimme R, Wieland S, Steiger C, Ghrayeb J, Reimann KA, Purcell RH, Chisari FV. 2003. CD8(+) T cells mediate viral clearance and disease pathogenesis during acute hepatitis B virus infection. J Virol 77:68–76. doi: 10.1128/JVI.77.1.68-76.2003. [DOI] [PMC free article] [PubMed] [Google Scholar]
- 6.Webster GJ, Reignat S, Brown D, Ogg GS, Jones L, Seneviratne SL, Williams R, Dusheiko G, Bertoletti A. 2004. Longitudinal analysis of CD8+ T cells specific for structural and nonstructural hepatitis B virus proteins in patients with chronic hepatitis B: implications for immunotherapy. J Virol 78:5707–5719. doi: 10.1128/JVI.78.11.5707-5719.2004. [DOI] [PMC free article] [PubMed] [Google Scholar]
- 7.Liu Q, Zheng Y, Yu Y, Tan Q, Huang X. 2012. Identification of HLA-A*0201-restricted CD8+ T-cell epitope C(6)(4)(-)(7)(2) from hepatitis B virus core protein. Int Immunopharmacol 13:141–147. doi: 10.1016/j.intimp.2012.03.018. [DOI] [PubMed] [Google Scholar]
- 8.Maman Y, Blancher A, Benichou J, Yablonka A, Efroni S, Louzoun Y. 2011. Immune-induced evolutionary selection focused on a single reading frame in overlapping hepatitis B virus proteins. J Virol 85:4558–4566. doi: 10.1128/JVI.02142-10. [DOI] [PMC free article] [PubMed] [Google Scholar]
- 9.Kefalakes H, Budeus B, Walker A, Jochum C, Hilgard G, Heinold A, Heinemann FM, Gerken G, Hoffmann D, Timm J. 2015. Adaptation of the hepatitis B virus core protein to CD8(+) T-cell selection pressure. Hepatology 62:47–56. doi: 10.1002/hep.27771. [DOI] [PubMed] [Google Scholar]
- 10.Abbott WG, Tsai P, Leung E, Trevarton A, Ofanoa M, Hornell J, Gane EJ, Munn SR, Rodrigo AG. 2010. Associations between HLA class I alleles and escape mutations in the hepatitis B virus core gene in New Zealand-resident Tongans. J Virol 84:621–629. doi: 10.1128/JVI.01471-09. [DOI] [PMC free article] [PubMed] [Google Scholar]
- 11.Ghosh S, Mondal RK, Banerjee P, Nandi M, Sarkar S, Das K, Santra A, Banerjee S, Chowdhury A, Datta S. 2012. Tracking the naturally occurring mutations across the full-length genome of hepatitis B virus of genotype D in different phases of chronic e-antigen-negative infection. Clin Microbiol Infect 18:E412–E418. doi: 10.1111/j.1469-0691.2012.03975.x. [DOI] [PubMed] [Google Scholar]
- 12.Lyoo KS, Hong SW, Song MJ, Hur W, Choi JE, Piao LS, Jang JW, Bae SH, Choi JY, Park JW, Choi SW, Yoon SK. 2011. Subgenotype and genetic variability in the precore/core regions of hepatitis B virus in Korean patients with chronic liver disease. Intervirology 54:333–338. doi: 10.1159/000321359. [DOI] [PubMed] [Google Scholar]
- 13.Kim D, Lyoo KS, Smith D, Hur W, Hong SW, Sung PS, Yoon SK, Mehta S. 2011. Number of mutations within CTL-defined epitopes of the hepatitis B virus (HBV) core region is associated with HBV disease progression. J Med Virol 83:2082–2087. doi: 10.1002/jmv.22226. [DOI] [PMC free article] [PubMed] [Google Scholar]
- 14.Desmond CP, Gaudieri S, James IR, Pfafferott K, Chopra A, Lau GK, Audsley J, Day C, Chivers S, Gordon A, Revill PA, Bowden S, Ayres A, Desmond PV, Thompson AJ, Roberts SK, Locarnini SA, Mallal SA, Lewin SR. 2012. Viral adaptation to host immune responses occurs in chronic hepatitis B virus (HBV) infection, and adaptation is greatest in HBV e antigen-negative disease. J Virol 86:1181–1192. doi: 10.1128/JVI.05308-11. [DOI] [PMC free article] [PubMed] [Google Scholar]
- 15.Sun L, Zhang Y, Zhao B, Deng M, Liu J, Li X, Hou J, Gui M, Zhang S, Li X, Gao GF, Meng S. 2014. A new unconventional HLA-A2-restricted epitope from HBV core protein elicits antiviral cytotoxic T lymphocytes. Protein Cell 5:317–327. doi: 10.1007/s13238-014-0041-4. [DOI] [PMC free article] [PubMed] [Google Scholar]
- 16.Bertoni R, Sidney J, Fowler P, Chesnut RW, Chisari FV, Sette A. 1997. Human histocompatibility leukocyte antigen-binding supermotifs predict broadly cross-reactive cytotoxic T lymphocyte responses in patients with acute hepatitis. J Clin Investig 100:503–513. doi: 10.1172/JCI119559. [DOI] [PMC free article] [PubMed] [Google Scholar]
- 17.Riedl P, Wieland A, Lamberth K, Buus S, Lemonnier F, Reifenberg K, Reimann J, Schirmbeck R. 2009. Elimination of immunodominant epitopes from multispecific DNA-based vaccines allows induction of CD8 T cells that have a striking antiviral potential. J Immunol 183:370–380. doi: 10.4049/jimmunol.0900505. [DOI] [PubMed] [Google Scholar]
- 18.Mohamadkhani A, Jazii FR, Poustchi H, Nouraein O, Abbasi S, Sotoudeh M, Montazeri G. 2009. The role of mutations in core protein of hepatitis B virus in liver fibrosis. Virol J 6:209. doi: 10.1186/1743-422X-6-209. [DOI] [PMC free article] [PubMed] [Google Scholar]
- 19.Zhang Y, Ren Y, Wu Y, Zhao B, Qiu L, Li X, Xu D, Liu J, Gao GF, Meng S. 2013. The L60V variation in hepatitis B virus core protein elicits new epitope-specific cytotoxic T lymphocytes and enhances viral replication. J Virol 87:8075–8084. doi: 10.1128/JVI.00577-13. [DOI] [PMC free article] [PubMed] [Google Scholar]
- 20.Gras S, Burrows SR, Turner SJ, Sewell AK, McCluskey J, Rossjohn J. 2012. A structural voyage toward an understanding of the MHC-I-restricted immune response: lessons learned and much to be learned. Immunol Rev 250:61–81. doi: 10.1111/j.1600-065X.2012.01159.x. [DOI] [PubMed] [Google Scholar]
- 21.Yuan TT, Shih C. 2000. A frequent, naturally occurring mutation (P130T) of human hepatitis B virus core antigen is compensatory for immature secretion phenotype of another frequent variant (I97L). J Virol 74:4929–4932. doi: 10.1128/JVI.74.10.4929-4932.2000. [DOI] [PMC free article] [PubMed] [Google Scholar]
- 22.Liu J, Wu B, Zhang S, Tan S, Sun Y, Chen Z, Qin Y, Sun M, Shi G, Wu Y, Sun M, Liu N, Ning K, Ma Y, Gao B, Yan J, Zhu F, Wang H, Gao GF. 2013. Conserved epitopes dominate cross-CD8+ T-cell responses against influenza A H1N1 virus among Asian populations. Eur J Immunol 43:2055–2069. doi: 10.1002/eji.201343417. [DOI] [PubMed] [Google Scholar]
- 23.Baker BM, Scott DR, Blevins SJ, Hawse WF. 2012. Structural and dynamic control of T-cell receptor specificity, cross-reactivity, and binding mechanism. Immunol Rev 250:10–31. doi: 10.1111/j.1600-065X.2012.01165.x. [DOI] [PubMed] [Google Scholar]
- 24.Yang J, Chen J, Mao H, Yi P, Yan D, He J, Li L. 2012. Skewed T-cell receptor beta chain variable gene (TCRBV) usage among different clinical types of patients with chronic HBV infection. FEMS Immunol Med Microbiol 65:448–455. doi: 10.1111/j.1574-695X.2012.00969.x. [DOI] [PubMed] [Google Scholar]
- 25.Xiong Y, Tan Y, Song YG. 2014. Analysis of T cell receptor Vbeta diversity in peripheral CD4+ and CD8+ T lymphocytes obtained from patients with chronic severe hepatitis B. Hepat Mon 14:e15900. doi: 10.5812/hepatmon.15900. [DOI] [PMC free article] [PubMed] [Google Scholar]
- 26.Yang J, Lu H, Guo R, Yan D, Ye P, Jin L, Chen C, Cao H, Diao H, Li L. 2015. Molecular profile of the T cell receptor beta variable in peripheral blood lymphocytes from chronic asymptomatic HBV carriers. Pathog Dis 73:1–9. doi: 10.1093/femspd/ftu018. [DOI] [PubMed] [Google Scholar]
- 27.Li C, Wang Y, Wang S, Wu B, Hao J, Fan H, Ju Y, Ding Y, Chen L, Chu X, Liu W, Ye X, Meng S. 2013. Hepatitis B virus mRNA-mediated miR-122 inhibition upregulates PTTG1-binding protein, which promotes hepatocellular carcinoma tumor growth and cell invasion. J Virol 87:2193–2205. doi: 10.1128/JVI.02831-12. [DOI] [PMC free article] [PubMed] [Google Scholar]
- 28.Xu Z, Ren X, Liu Y, Li X, Bai S, Zhong Y, Wang L, Mao P, Wang H, Xin S, Wong VW, Chan HL, Zoulim F, Xu D. 2011. Association of hepatitis B virus mutations in basal core promoter and precore regions with severity of liver disease: an investigation of 793 Chinese patients with mild and severe chronic hepatitis B and acute-on-chronic liver failure. J Gastroenterol 46:391–400. doi: 10.1007/s00535-010-0315-4. [DOI] [PMC free article] [PubMed] [Google Scholar]
- 29.Tan AT, Koh S, Goh W, Zhe HY, Gehring AJ, Lim SG, Bertoletti A. 2010. A longitudinal analysis of innate and adaptive immune profile during hepatic flares in chronic hepatitis B. J Hepatol 52:330–339. doi: 10.1016/j.jhep.2009.12.015. [DOI] [PubMed] [Google Scholar]
- 30.Vitiello A, Marchesini D, Furze J, Sherman LA, Chesnut RW. 1991. Analysis of the HLA-restricted influenza-specific cytotoxic T lymphocyte response in transgenic mice carrying a chimeric human-mouse class I major histocompatibility complex. J Exp Med 173:1007–1015. doi: 10.1084/jem.173.4.1007. [DOI] [PMC free article] [PubMed] [Google Scholar]
- 31.Zhou M, Xu D, Li X, Li H, Shan M, Tang J, Wang M, Wang FS, Zhu X, Tao H, He W, Tien P, Gao GF. 2006. Screening and identification of severe acute respiratory syndrome-associated coronavirus-specific CTL epitopes. J Immunol 177:2138–2145. doi: 10.4049/jimmunol.177.4.2138. [DOI] [PubMed] [Google Scholar]
- 32.Garboczi DN, Hung DT, Wiley DC. 1992. HLA-A2-peptide complexes: refolding and crystallization of molecules expressed in Escherichia coli and complexed with single antigenic peptides. Proc Natl Acad Sci U S A 89:3429–3433. doi: 10.1073/pnas.89.8.3429. [DOI] [PMC free article] [PubMed] [Google Scholar]
- 33.Liu J, Sun Y, Qi J, Chu F, Wu H, Gao F, Li T, Yan J, Gao GF. 2010. The membrane protein of severe acute respiratory syndrome coronavirus acts as a dominant immunogen revealed by a clustering region of novel functionally and structurally defined cytotoxic T-lymphocyte epitopes. J Infect Dis 202:1171–1180. doi: 10.1086/656315. [DOI] [PMC free article] [PubMed] [Google Scholar]
- 34.Tobita T, Oda M, Morii H, Kuroda M, Yoshino A, Azuma T, Kozono H. 2003. A role for the P1 anchor residue in the thermal stability of MHC class II molecule I-Ab. Immunol Lett 85:47–52. doi: 10.1016/S0165-2478(02)00206-7. [DOI] [PubMed] [Google Scholar]
- 35.Li Y, Song H, Li J, Wang Y, Yan X, Zhao B, Zhang X, Wang S, Chen L, Qiu B, Meng S. 2011. Hansenula polymorpha expressed heat shock protein gp96 exerts potent T cell activation activity as an adjuvant. J Biotechnol 151:343–349. doi: 10.1016/j.jbiotec.2010.12.006. [DOI] [PubMed] [Google Scholar]
- 36.Li H, Zhou M, Han J, Zhu X, Dong T, Gao GF, Tien P. 2005. Generation of murine CTL by a hepatitis B virus-specific peptide and evaluation of the adjuvant effect of heat shock protein glycoprotein 96 and its terminal fragments. J Immunol 174:195–204. doi: 10.4049/jimmunol.174.1.195. [DOI] [PubMed] [Google Scholar]
- 37.Liu Z, Li X, Qiu L, Zhang X, Chen L, Cao S, Wang F, Meng S. 2009. Treg suppress CTL responses upon immunization with HSP gp96. Eur J Immunol 39:3110–3120. doi: 10.1002/eji.200939593. [DOI] [PubMed] [Google Scholar]
- 38.Jedema I, van der Werff NM, Barge RM, Willemze R, Falkenburg JH. 2004. New CFSE-based assay to determine susceptibility to lysis by cytotoxic T cells of leukemic precursor cells within a heterogeneous target cell population. Blood 103:2677–2682. doi: 10.1182/blood-2003-06-2070. [DOI] [PubMed] [Google Scholar]