Abstract
Emerging two-dimensional (2D) nanomaterials, such as transition-metal dichalcogenide (TMD) nanosheets (NSs), have shown tremendous potential for use in a wide variety of fields including cancer nanomedicine. The interaction of nanomaterials with biosystems is of critical importance for their safe and efficient application. However, a cellular-level understanding of the nano-bio interactions of these emerging 2D nanomaterials (i.e., intracellular mechanisms) remains elusive. Here we chose molybdenum disulfide (MoS2) NSs as representative 2D nanomaterials to gain a better understanding of their intracellular mechanisms of action in cancer cells, which play a significant role in both their fate and efficacy. MoS2 NSs were found to be internalized through three pathways: clathrin → early endosomes → lysosomes, caveolae → early endosomes → lysosomes, and macropinocytosis → late endosomes → lysosomes. We also observed autophagy-mediated accumulation in the lysosomes and exocytosis-induced efflux of MoS2 NSs. Based on these findings, we developed a strategy to achieve effective and synergistic in vivo cancer therapy with MoS2 NSs loaded with low doses of drug through inhibiting exocytosis pathway-induced loss. To the best of our knowledge, this is the first systematic experimental report on the nano-bio interaction of 2D nanomaterials in cells and their application for anti-exocytosis-enhanced synergistic cancer therapy.
Keywords: two-dimensional nanosheets, MoS2, intracellular trafficking network, nano-bio interactions, enhanced cancer therapy
Graphical abstract
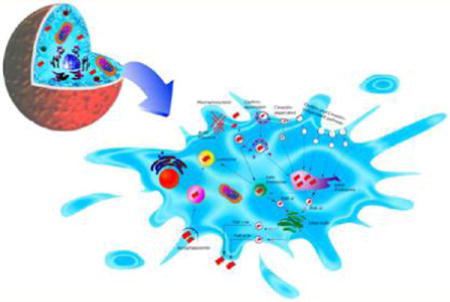
Over the past decade, two-dimensional (2D) nanomaterials such as transition-metal dichalcogenides (TMDs) have attracted tremendous attention for a wide range of applications (e.g., electronics/optoelectronics as well as energy storage and conversion).1–6 More recently, these emerging 2D nanomaterials have shown great potential for various biomedical applications due to their extraordinary physical, chemical, and biological properties.7–12 For example, 2D nanosheets (NSs) possess ultrahigh surface-to-volume ratio, making them invaluable for drug delivery systems that require extensive surface interactions on a small scale.13,14 The ultrathin thinness of these 2D NSs also enables them to respond rapidly to external stimuli (e.g., light and pH), which has proven utility in multiresponsive drug-release and various optical-therapy strategies (e.g., PTT, photodynamic therapy). Moreover, NSs are exceptionally promising for optimizing the mechanical properties of biomedical nanocomposites because of their typically high surface-area-to-volume ratios and modulus values.15 Notably, theranostic 2D NSs have shown significant promise especially in applications for cancer nanomedicine.12–14,16–20
Despite impressive preliminary findings, the current literature on 2D nanomaterials also reflects complex challenges, namely safety concerns regarding their impact on biosystems and patient health.16,21–23 These issues are closely related to both the ways in which they interact with cells and their intracellular fate.24 Therefore, a fundamental understanding of those interactions is essential for their safe biomedical applications, eventually allowing us to reap the maximum benefits of these materials while limiting their adverse effects.25–28 Moreover, once we understand the intracellular mechanisms and fate of 2D nanomaterials in detail, different strategies may be developed for more-precise diagnostics and therapies, especially in cancer nanomedicine. However, because of the intrinsic complexity of cellular trafficking vesicles and nano-bio interactions, the detailed intracellular mechanisms affecting 2D nanomaterials, which play a significant role in their fate and efficacy, are not yet fully understood. While a recent study has shed some light on the receptor-mediated transport of 2D nanomaterials via computer simulation and theoretical derivation,24 there has been no experimental report of a systemic study of the detailed molecular mechanisms and kinetic pathways of these 2D nanomaterials until now.
Molybdenum disulfide (MoS2) is a highly typical member of the 2D TMD family and has been widely publicized for its superior advantages. Examples include MoS2-based nanoprobes for biosensors,29 MoS2 photothermal agents for cancer photothermal therapy (PTT),30 drug-delivery MoS2 NSs for imaging and combined cancer treatment,16,17,31 and MoS2 nanofilms for rapid-onset antibacterial effects.32 Here we utilized MoS2-based NSs as representative 2D nanomaterials to explore the relevant intracellular mechanisms in two common cancer cell lines (cervical cancer HeLa cells and breast cancer MCF-7 cells) and one healthy cell line (human aortic endothelial cells or HAOEC). Different types of endocytosis, autophagy, and exocytosis pathway markers were applied to clarify the uptake and intracellular trafficking of 2D NSs in the presence or absence of a variety of pharmacological inhibitors. As demonstrated below, the NSs were internalized through three different endocytosis pathways in cancer cells: clathrin → early endosomes → lysosomes, caveolae → early endosomes → lysosomes, and macropinocytosis → late endosomes → lysosomes. Autophagy also mediated the accumulation of NSs in lysosomes. Internalized NSs were also secreted from cells via exocytosis; conversely, inhibition of exocytosis significantly reduced the exocytosis-induced loss of NSs from cancer cells. Inspired by anti-exocytosis-induced accumulation in cancer cells, a strategy for effective synergistic cancer therapy involving anti-exocytosis-enhanced chemotherapy and low-dose PTT was proposed. Therefore, our study systematically reveals the intracellular mechanisms that affect the therapeutic effectiveness of MoS2-based NSs, which may help build a foundation for the emerging field of 2D nanomaterials in biomedicine.
RESULTS AND DISCUSSION
Preparation and Characterization of MoS2-based NSs
As shown in Figure 1a, 2D MoS2 NSs were prepared via a chemical exfoliation method according to a previous report.14 To improve stability in physiological solutions, lipoic acid-conjugated PEG (LA-PEG) containing a disulfide group on the PEG terminal was used to functionalize MoS2 NSs simply by mixing them under sonication and incubating at room temperature in water. As shown in Figure 1b, PEGylated MoS2 showed no observable aggregation even after 48 h incubation in water, PBS, and cell culture medium, demonstrating the successful coating with PEG and the superior colloidal stability of PEGylated MoS2. X-ray photoelectron spectroscopy (XPS) was conducted to further confirm the functionalization of the PEGylated MoS2 NSs (Figures S1 and S2). The XPS spectra of the LA-PEG-functionalized MoS2 sample showed characteristic MoS2 peaks as well as additional peaks in accordance with LA-PEG, confirming MoS2 functionalization. Atomic force microscopy (AFM) and transmission electron microscopy (TEM) were used to further characterize MoS2 NSs after PEGylation. PEGylated MoS2 NSs showed an average diameter of 116 nm and an average thickness of ∼2.5 nm (Figure 1c,d). The photothermal effect of PEGylated MoS2 NSs was characterized using an IR thermal camera, which showed strong concentration dependence, with the highest temperature increase being about 50 °C after 5 min of irradiation at a concentration of 0.1 mg mL−1, while that of water under the same laser power density was only 4 °C (Figures 1e and S3).
Figure 1.
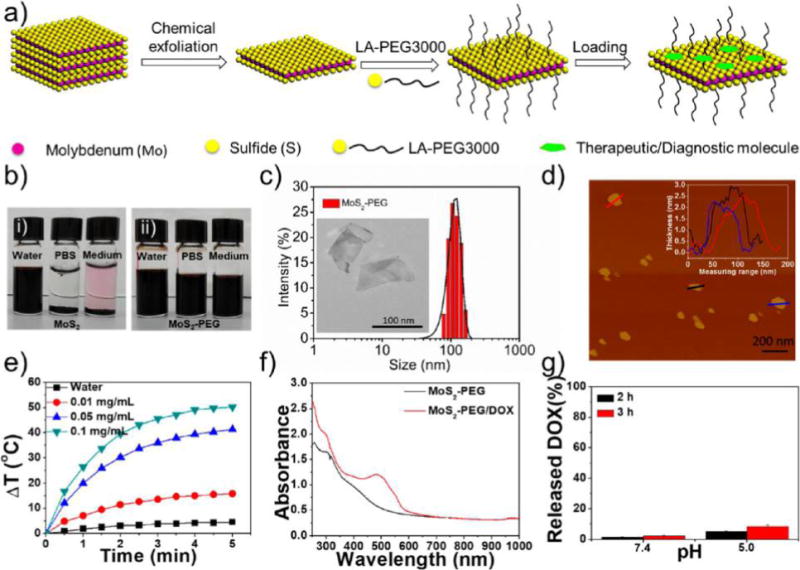
Synthesis and characterization of MoS2-based NSs. (a) Scheme of the exfoliation, PEGylation, and loading of MoS2 NSs with therapeutic/diagnostic molecules. (b) Colloidal stability of (i) MoS2 NSs and (ii) PEGylated MoS2 NSs in water, PBS, and cell culture medium after 48 h incubation. (c) DLS hydrodynamic size distribution of PEGylated MoS2 NSs. Inset: TEM image of PEGylated MoS2 NSs. (d) AFM image of PEGylated MoS2 NSs. The inset shows the thickness of PEGylated MoS2 NSs. (e) Photothermal heating curves of pure water and MoS2-PEG solutions with different concentrations (0.01, 0.05, and 0.1 mg/mL) under 808 nm laser irradiation at a power density of 1 W/cm2. (f) UV–vis-NIR absorbance spectra of PEGylated MoS2 NSs and PEGylated MoS2/DOX NSs. (g) The released DOX percentage from fluorescent NSs at pH 7.4 and 5.0 after 2 or 3 h incubation.
Figure 2.
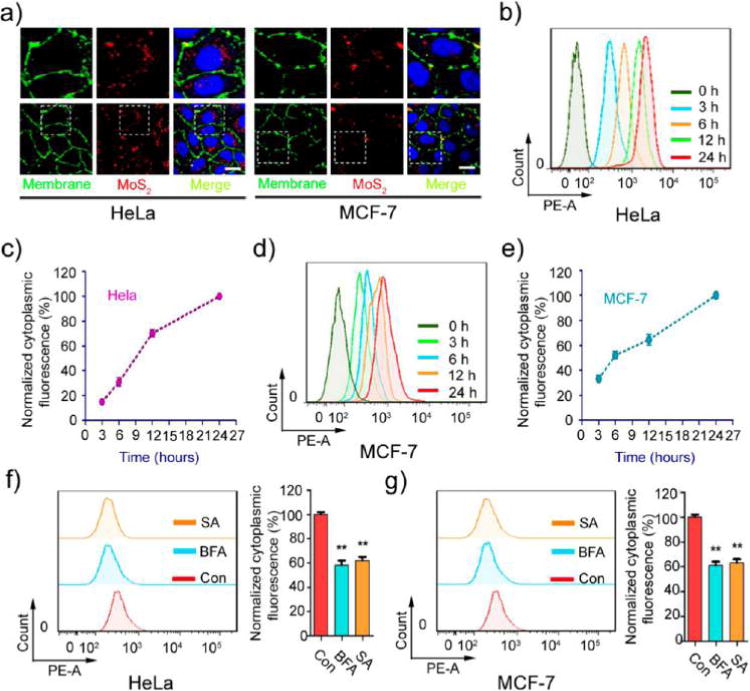
Effect of energy on MoS2-based NSs’ uptake. (a) The uptake of fluorescent MoS2-based NSs (10 μg/mL) was tested by confocal laser scanning microscopy after 2 h incubation with HeLa and MCF-7 cells. The images in the top row are enlarged versions of the image area in the white box seen in the bottom row. Cell membrane was labeled with molecular probe (red). Scale bars: 10 μm. The uptake of fluorescent MoS2-based NSs was measured by flow cytometer at indicated incubation times in (b) HeLa and (d) MCF-7 cells. Statistical analysis of intracellular fluorescence in (c) HeLa and (e) MCF-7 cells. Cells were pretreated with or without the metabolic inhibitor sodium azide (0.1%) and bafilomycin A (0.05 μM) for 30 min. Then cells were incubated with fluorescent MoS2-based NSs for 2 h. Cytoplasmic fluorescence was measured by flow cytometer in (f) HeLa and (g) MCF-7 cells.
Fluorescence Marking of MoS2-based NSs
To characterize the intracellular trafficking network of these NSs, doxorubicin (DOX), which can act as both a therapeutic drug and a fluorescent probe, was loaded and tightly attached to the surface of MoS2 NSs. After removal of excess free DOX molecules through centrifugal filtration, ultraviolet–visible-near-infrared (UV–vis-NIR) spectra were recorded to determine the loading ratios on PEGylated MoS2 NSs (Figure 1f). The loading percentage of DOX on PEGylated MoS2 NSs reached nearly 100%. As shown in Figures S4–S5, the ζ potential of PEGylated MoS2 NSs changed dramatically, while the DLS size distribution changed little after DOX loading. To eliminate the influence of the dissociated fluorescent probe from NSs, we also checked the release of DOX at two different pH values (7.4 and 5.0). As shown in Figure 1g, only 2% of fluorescent DOX was released from PEGylated MoS2/DOX NSs at pH 7.4 after 2 h of incubation. Even in the acid environment of pH 5.0 (pH 6.5: tumor extracellular environment; pH 5.0–5.5: endosome or lysosome), only 8% of fluorescent DOX was released after 3 h of incubation, similar to a previous report.14 Comparably slow release of DOX was also confirmed in both cell culture medium and serum (Figure S6). Meanwhile, nearly all the fluorescence of the free DOX was localized in the nucleus (Figures S7–S8), which was also previously reported by many other groups.33–35 Therefore, it is safe to conclude that the fluorescence we detected in the cytoplasm was actually attributable to the fluorescent NSs (i.e., PEGylated MoS2/DOX NSs), as the released DOX was present in the nucleus. It is worth mentioning that, despite the slow release of DOX under the above conditions, NIR-triggered burst-release of DOX could be achieved with irradiation using an 808 nm laser (Figure S9), which guaranteed the detachment of the cargo and thus a valid therapeutic effect when applied in vivo for photothermal combined therapy in the studies described below.
Energy-Dependent Nanocell Interaction between NSs and Cells
The potency of the therapeutic/diagnostic molecule-attached MoS2 depends on internalization and sustained retention of NSs by cancer cells. Therefore, PEGylated MoS2/DOX NSs were utilized to explore this process, with cervical cancer cells (HeLa) and breast cancer cells (MCF-7) as model cell lines. As shown in Figure 2a, the fluorescent NSs were ingested by both HeLa and MCF-7 cells and became localized in the cytoplasm. Additionally, the internalization of MoS2 NSs was time dependent (Figure 2b,d) in both HeLa and MCF-7 cells. However, the speed of cellular uptake differed between these two cell lines (Figure 2c,e). During the first 10 h, MCF-7 demonstrated faster uptake ratio than HeLa. The internalized NSs reached about 32% by the first 3 h and 51% by the first 6 h in MCF-7. HeLa demonstrated 14% and 30%, respectively (the intracellular fluorescence at 24 h is designated as 100%).
Molecules generally enter cells by passive diffusion, whereas nanomaterials usually require endocytosis, which is energy dependent.36,37 To determine whether the internalization of these NSs was energy dependent, different metabolic inhibitors, including sodium azide (which depletes intracellular ATP)38 and bafilomycin A (which inhibits the v-ATPase function)39 were used to examine the effect of energy on MoS2-based NSs uptake. Pre-incubation with different metabolic inhibitors dramatically suppressed the uptake of NSs into cells (Figure 2f,g). It is well-known that proteins involved in endocytosis are sensitive to temperature and that endocytosis is reduced at low temperatures.40 Therefore, we incubated NSs with HeLa and MCF-7 cells at both 37 and 4 °C for 2 h. Figure S10a–d shows a comparison of the intracellular fluorescence of both cell types incubated at these two temperatures. Cellular uptake of fluorescent NSs was significantly diminished at the lower temperature in both HeLa and MCF-7 cells. These data confirm the contention that the cellular uptake mechanism of MoS2-based NSs in HeLa and MCF-7 cells is indeed energy-dependent endocytosis, rather than simple passive diffusion.
Endocytosis Pathways of MoS2-based NSs
Endocytosis is generally divided into the following pathways: macropinocytosis, clathrin-dependent, caveolae-dependent, clathrin-independent, or caveolae-independent.37,41 Macropinocytosis is controlled by Rab34, which is considered a biomarker for this process.42 Clathrin-independent and caveolae-independent endocytosis primarily includes Afr6-, Cdc42-, RhoA-, and Flotillin-dependent pathways. To identify the pathways through which MoS2-based NSs enter cells, we transfected HeLa and MCF-7 cells with EGFP-Clathrin, Caveolin, Rab34, Arf6, RhoA, Cdc42, and Flotillin and then incubated the cells with fluorescent PEGylated MoS2/DOX NSs for 2 h. We observed the co-localization of NS-positive vesicles with Clathrin-, Caveolin-, and Rab34-positive vesicles in both HeLa and MCF-7 cells (Figure 3a–c and 3e–g). We further extracted the intensity of each color in the images and performed semiquantitative statistical analysis of Pearson’s correlation coefficient to evaluate co-localization between fluorescent MoS2 NSs and different markers (Figure 3d,h). The Rr ranged from 0.43 to 0.68, indicating good linear relationships between pairs of colors and good co-localization between different markers. However, we found no merging of NS-positive vesicles with Arf6-, RhoA-, Cdc42-, or Flotillin-positive vesicles (Figures S11–S12). We also used siRNA to knock down Arf6 in MCF-7 cells and then used FACS to quantify the internalization of fluorescent MoS2-based NSs (Figure S13). Our data show that the Afr6-mediated endocytosis pathway was not involved in internalization, which indicates our immunofluorescence data are reliable. These data indicate that the uptake of MoS2-based NSs in HeLa and MCF-7 cells is predominantly achieved via the clathrin-dependent, caveolin-dependent, and macropinocytosis pathways rather than the clathrin- or caveolin-independent pathways. To further confirm our conclusion, we employed various pharmacological inhibitors affecting different endocytic pathways to assess their contributions in the two cell lines. We used sucrose and chlorpromazine to block clathrin-mediated endocytosis,40,43 nystatin to prevent caveolae-mediated endocytosis,40 and rottlerin to avoid uptake by macropinocytosis.44 Figure S14 shows the cytoplasmic fluorescence, measured by FACS, of HeLa and MCF-7 cells in the presence of different inhibitors. Both HeLa and MCF-7 cells were exposed to various inhibitors for 2 h and then incubated with fluorescent NSs for an additional 3 h. Although metabolic activity was not influenced by the addition of these inhibitors in either cell line (Figure S15–16), internalization of fluorescent NSs was substantially blocked. For example, the caveolae-dependent endocytosis inhibitor nystatin drastically reduced the uptake of fluorescent NSs in both HeLa and MCF-7 cells. More than 60% of the fluorescent NSs were blocked in HeLa cells, and >70% of fluorescent NSs were blocked in MCF-7 cells. The macropinocytosis pathway inhibitor rottlerin inhibited approximately 35% and 55% of the uptake of fluorescent NSs in HeLa and MCF-7 cells, respectively. Likewise, the clathrin-dependent pathway inhibitors sucrose and chlorpromazine had the same effect on HeLa and MCF-7 cells, blocking about 30% of uptake in both cell lines. We also investigated the interaction of these NSs with healthy cells such as HAOEC. We found that NSs entered HAOEC mainly though the caveolae- and macropinocytosis-dependent pathways, while the clathrin-dependent pathway was not involved (Figure S17). The cellular metabolic activity of HAOEC was also not influenced by the addition of different endocytosis inhibitors (Figure S18). Therefore, our results imply that clathrin-dependent, caveolin-dependent, and macropinocytosis pathways were involved in the internalization of MoS2-based NSs in these two cancer cell lines, with caveolae-dependent endocytosis making the greatest contribution. Caveolae- and macropinocytosis-dependent pathways may participate in the internalization of MoS2-based NSs in healthy cells. Moreover, cancer cell lines seem to be more sensitive to these pharmacological inhibitors, which points to more endocytosis-mediated internalization of MoS2-based NSs.
Figure 3.
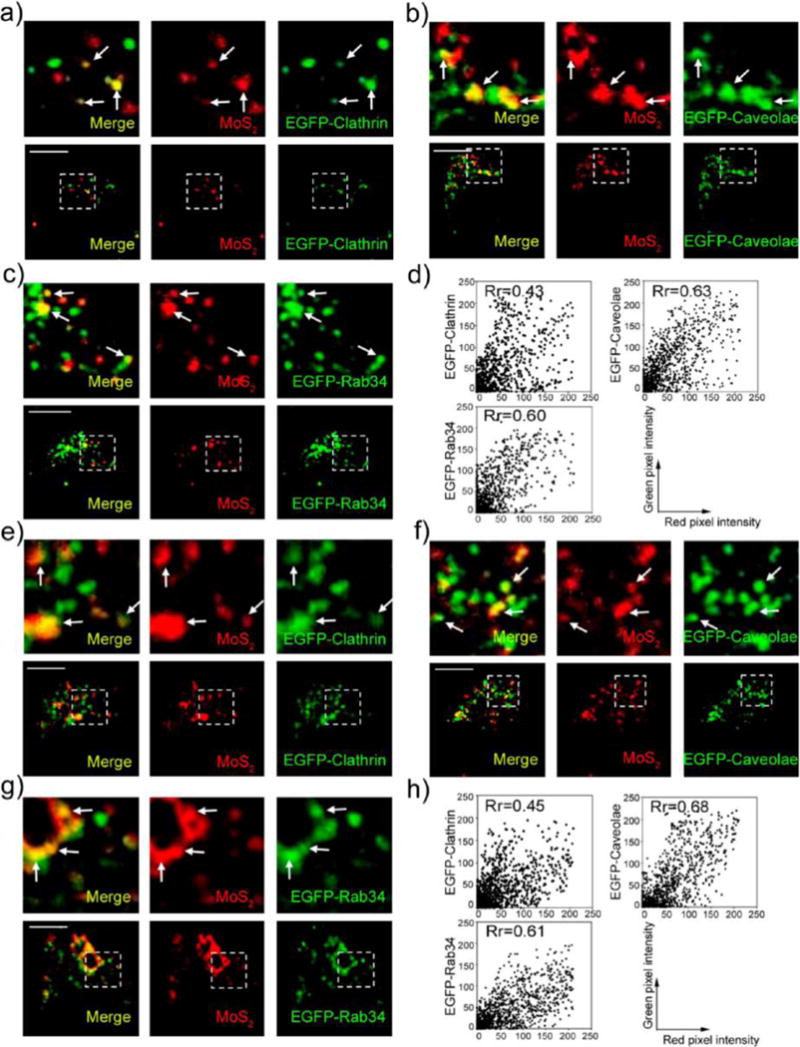
MoS2-based NSs enter cells through clathrin-dependent, caveolin-dependent, and macropinocytosis pathways. Confocal images of (a) EGFP-clathrin-transfected, (b) EGFP-caveolae-transfected, and (c) EGFP-Rab34-transfected Hela cells incubated with fluorescent MoS2-based NSs (10 μg/mL) for 2 h. (d) Scatterplot of red and green pixel intensities of the cells shown in (a–c). Confocal images of (e) EGFP-clathrin-transfected, (f) EGFP-caveolae-transfected, and (g) EGFP-Rab34-transfected MCF-7 cells incubated with fluorescent MoS2-based NSs (10 μg/mL) for 2 h. (h) Scatterplot of red and green pixel intensities of the cells shown in (e–g). Scale bars: 10 μm.
Accumulation of MoS2-based NSs in Lysosomes
In classical endocytosis pathways, after cellular internalization, nanomaterials are transported to early endosomes first, late endosomes shortly afterward, and finally lysosomes.45 Rab5 is widely used as a marker of early endosomes and Rab7 as a marker of late endosomes. As expected, we found that our fluorescent NSs were transported through this pathway in HeLa and MCF-7 cells (Figure 4a,b). We incubated the EGFP-Rab5- and EGFP-Rab7-transfected cells with our fluorescent NSs for 2 h and then assessed the co-localization of fluorescent NSs with Rab5-positive early endosomes and Rab7-positive late endosomes. As presented in Figure 4c–f, fluorescent NSs co-localized perfectly with both EGFP-Rab5-labeled early endosomes and EGFP-Rab7-labeled late endosomes in HeLa and MCF-7 cells. Furthermore, we found that our fluorescent NSs merged well with the lysosomes when we marked the vesicle with the protein Lamp1 (Figure 4g,h). Pearson’s correlation coefficient analysis further confirmed perfect co-localization with an Rr value ranging from 0.58 to 0.73 (Figure S19). These results indicate that these fluorescent NSs were taken up by cells through clathrin-dependent and caveolae-dependent endocytosis and then transported to early endosomes and eventually late endosomes, finally accumulating in lysosomes. However, in the macropinocytosis pathway, we found no co-localization between EGFP-Rab34-labeled macropinosomes and DsRed-Rab5-labeled early endosomes in MCF-7 cells (Figure S20a). In contrast, EGFP-Rab34-labeled macropinosomes co-localized well with Rab7-positive late endosomes (Figure S20b). Our previous work also shows that EGFP-Rab34-labeled macropinosomes deliver their contents to late endosomes rather than early endosomes in HeLa cells.14 Interestingly, we found that in HAOEC, fluorescent NSs could also be transported to endosomes and finally accumulate in lysosomes (Figure S21). Moreover, in HAOEC, EGFP-Rab34-labeled macropinosomes did not merge with DsRed-Rab5-labeled early endosomes, but instead merged with Rab7-positive late endosomes (Figure S22). Therefore, our data indicate that fluorescent MoS2-based NSs may accumulate in lysosomes through endosomes in both cancer cells and healthy cells. Additionally, “macropinocytosis (Rab34-labeled) → late endosomes (Rab7-labeled) → lysosomes” may be a possible endocytosis pathway in the turnover of MoS2-based NSs in both cancer cells and healthy cells.
Figure 4.
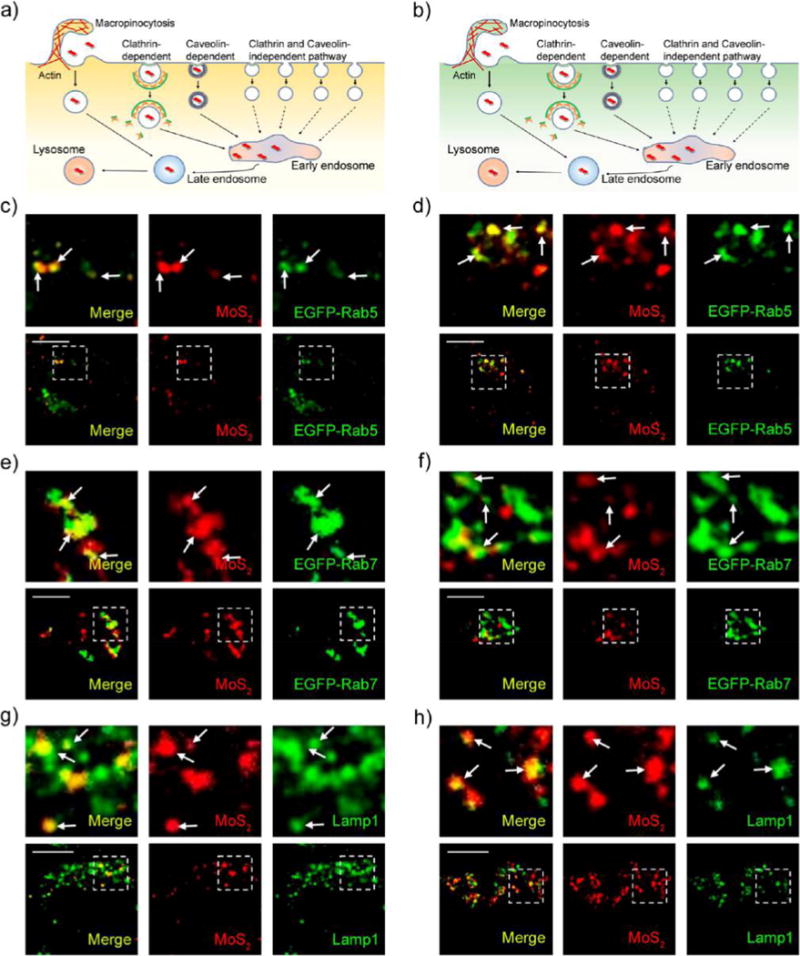
MoS2-based NSs accumulate in lysosomes. Schematic representation of the routes through which they enter the cell and accumulate in lysosomes in (a) HeLa and (b) MCF-7 cells. Confocal images of EGFP-Rab5-transfected (c) HeLa and (d) MCF-7 cells incubated with fluorescent MoS2-based NSs (10 μg/mL) for 2 h. Confocal images of EGFP-Rab7-transfected (e) HeLa and (f) MCF-7 cells incubated with fluorescent MoS2-based NSs (10 μg/mL) for 2 h. Confocal images of (g) HeLa and (h) MCF-7 cells incubated with fluorescent MoS2-based NSs (10 μg/mL) for 2 h. The immunofluorescence experiment was performed to detect lysosomes with the primary antibody against Lamp1. Scale bars: 10 μm.
Autophagy-Mediated Intracellular Fate of MoS2-based NSs
Various nanomaterials can escape from endosomes and accumulate in cytosol,46–49 including MoS2-based NSs.47 They may also escape from Rab34-positive macropinosomes, which has been attributed to a high rate of leakiness.50 Therefore, it is possible that the internalized NSs escape from endosomes and macropinosomes, resulting in the accumulation of NSs in cytosol. Autophagy is a cellular process for lysosome-based degradation of aggregates, damaged organelles, and invading pathogens.51 In recent years, autophagy has been shown to play an important role in modulating the intracellular fate of nanomaterials.13 Some studies have reported that autophagy sequesters intracellular leaked nanomaterials and delivers them to lysosomes.13,28,52–55 Figure S23 shows that the formation of autophagosomes is time dependent after treatment with PEGylated MoS2 NSs. To examine the role of autophagy in determining the intracellular trafficking fate of MoS2-based NSs, we incubated EGFP-LC3-transfected HeLa and MCF-7 cells with fluorescent NSs and assessed co-localization between EGFP-LC3-positive autophagosomes and fluorescent NSs. We found that autophagosomes can capture these NSs in both HeLa and MCF-7 cells (Figure 5a,b; Figure S24a,b). We further found that the NS-captured autophagosomes translocated to fuse with lysosomes in HeLa and MCF-7 cells (Figure 5c,d; Figure S24c,d). These findings suggest that the autophagosomes sequester the NSs and then deliver them to lysosomes. However, we found that the effect of autophagy on autophagy-mediated lysosomal accumulation of MoS2-based NSs differs between HeLa and MCF-7 cells. Compared with MCF-7 cells, there were more merged vesicles of EGFP-LC3-positive autophagosomes with fluorescent NSs in HeLa cells. About 74% of HeLa cells had more than three merged vesicles in the cytoplasm compared to 23% in MCF-7 cells (Figure 5e). Therefore, there were many more autophagosomes that could sequester the fluorescent NSs in HeLa cells than in MCF-7 cells. Moreover, we found more autophagosomes in NS-treated HeLa cells than in MCF-7 cells (Figure 5f). To further confirm our results, we performed TEM to identify autophagosomes in PEGylated MoS2 NS-treated HeLa and MCF-7 cells. As presented in Figure 5g,h, we consistently found more autophagosomes in HeLa cells than in MCF-7 cells. In HAOEC, these NSs also induced formation of autophagosomes (Figure S25a,b), which sequestered the NSs and delivered them to lysosomes (Figure S25c,d). Taken together, these data support the contention that autophagy plays an important role in the autophagy-mediated lysosomal accumulation of MoS2-based NSs and that the effect is much more noticeable in HeLa than in MCF-7 cells.
Figure 5.
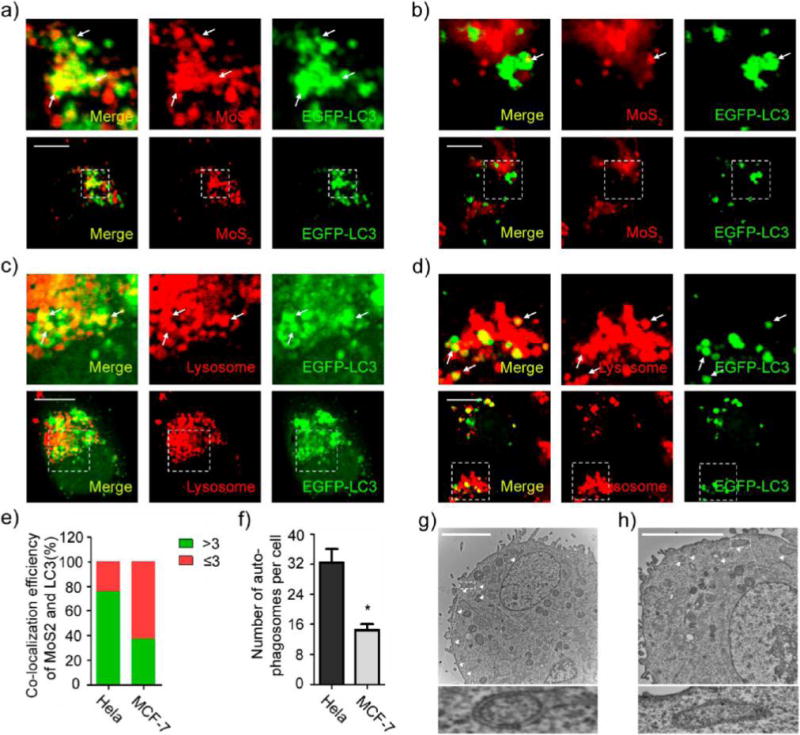
Autophagy involves the accumulation of MoS2-based NSs in lysosomes. Confocal images of EGFP-LC3 transfected (a) HeLa and (b) MCF-7 cells incubated with fluorescent MoS2-based NSs (10 μg/mL). Confocal images of EGFP-LC3-transfected (c) HeLa and (d) MCF-7 cells incubated with PEGylated MoS2 NSs (10 μg/mL) for 24 h and then treated with Lyso-Tracker Red probes for 30 min. (e) Statistical analysis of the numbers of co-localized vesicles between LC3 and fluorescent MoS2-based NSs per cell. (Green = >3 co-localized vesicles; red = ≤3 co-localized vesicles). (f) Statistical analysis of the number of autophagosomes per cell after treatment. TEM images of (g) HeLa and (h) MCF-7 cells incubated with PEGylated MoS2 NSs without loading content. Autophagosomes are formed after the same treatment. Triangles (Δ) indicate autophagosomes. Scale bars: 10 μm.
Exocytosis Pathways of MoS2-based NSs
Cells take in nanomaterials through endocytosis and via exocytosis secrete the ingested contents through the cell membrane and into the extracellular space using specific secretory vesicles. Classic secretory vesicles (marked by Rab3 and Rab26) and GLUT4 translocation vesicles (marked by Rab8 and Rab10) aid in the process.42,56 To investigate whether MoS2-based NSs can be transported out of cells via exocytosis pathways, we incubated HeLa and MCF-7 cells transfected with EGFP-Rab3, Rab26, Rab8, or Rab10 with fluorescent NSs for 2 h. The fluorescent NSs co-localized with EGFP-Rab3 and Rab26-marked classic secretory vesicles (Figure 6-d) as well as Rab8 and Rab10-positive GLUT4 translocation vesicles (Figure 6e,h) in both HeLa and MCF-7 cells. The Rr value of Pearson’s correlation coefficient analysis ranges from 0.31 to 0.81 (Figure S26), which is consistent with our confocal images. These findings indicate that MoS2-based NSs can indeed be secreted to the extracellular space via classic secretory vesicles and GLUT4 translocation vesicles in HeLa and MCF-7 cells. Since Rab3- and Rab26-positive classic secretory vesicles and Rab8- and Rab10-positive GLUT4 translocation vesicles are formed by the Golgi body,42 it is possible that the NSs are transported into the Golgi and then sorted into those classic secretory vesicles translocation vesicles. Additionally, it is well-known that the Golgi body receives the contents of early and late endosomes.42 Rab14- and Rab22-positive vesicles are responsible for delivery of these contents from the early endosome to the Golgi, while Rab24-positive vesicles are responsible for delivery from the late endosome to the Golgi.42,57 Therefore, we examined the transportation of fluorescent NSs from the early and late endosomes to the Golgi. We incubated EGFP-Rab14-, Rab22-, and Rab24-transfected HeLa and MCF-7 cells with fluorescent NSs for 2 h. We then assessed the co-localization between fluorescent NSs and EGFP-Rab14, Rab22, and Rab24-positive vesicles. As presented in Figure S27a–d, EGFP-Rab22- and EGFP-Rab14-positive vesicles can co-localize with early endosomes and fluorescent NSs in both HeLa and MCF-7 cells. As expected, EGFP-Rab24-positive vesicles are able to co-localize with late endosomes and fluorescent NSs in both HeLa and MCF-7 cells (Figure S27e,f). In HAOEC, we found that fluorescent NSs could also be secreted to the extracellular space via classic secretory vesicles and GLUT4 translocation vesicles from both early and late endosomes (Figures S28–S29). However, fluorescent NSs did not merge perfectly with different exocytosis markers in HAOEC when compared with HeLa and MCF-7 cancer cells, which indicates that exocytosis may be more discernible in cancer cells. These data suggest that the Golgi body might receive MoS2-based NSs from early and late endosomes and then secrete them from the cell via classic secretory vesicles and GLUT4 translocation vesicles. There is no difference in exocytosis pathways between cancer cells (Figure 7a,b) and healthy cells (Figure S30a).
Figure 6.
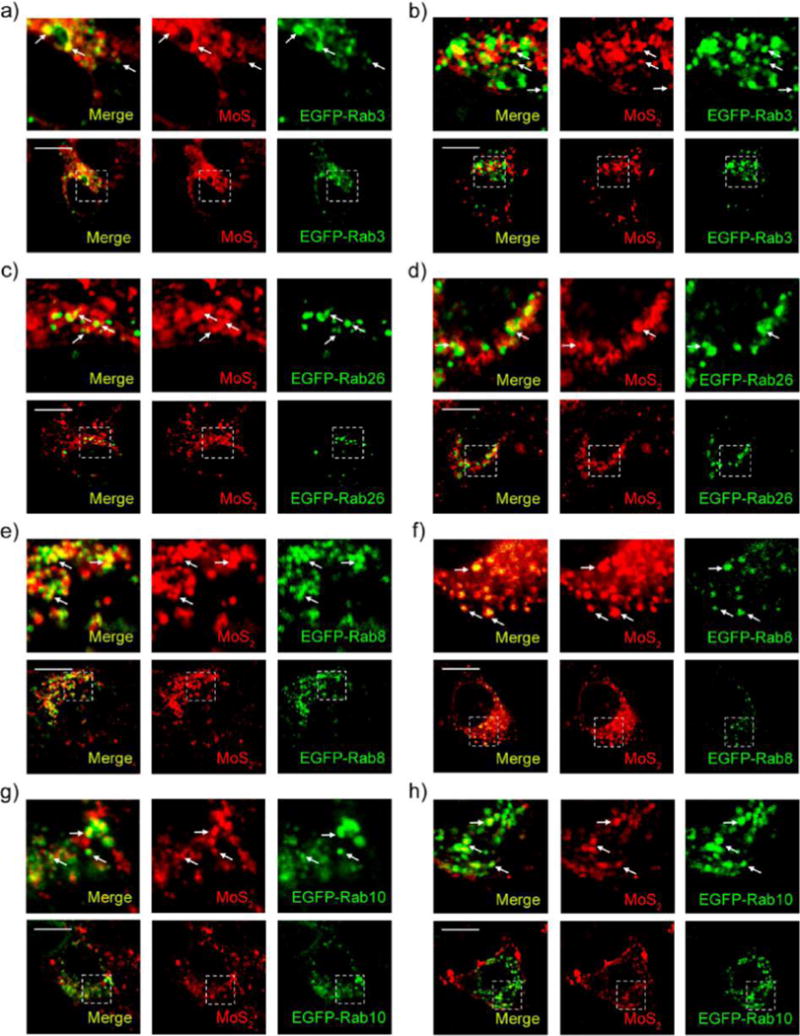
Exocytosis of MoS2-based NSs. Confocal images of EGFP-Rab3-transfected (a) HeLa and (b) MCF-7 cells incubated with fluorescent MoS2-based NSs (10 μg/mL) for 2 h. Confocal images of EGFP-Rab26-transfected (c) HeLa and (d) MCF-7 cells incubated with fluorescent MoS2-based NSs (10 μg/mL) for 2 h. Confocal images of EGFP-Rab8-transfected (e) HeLa and (f) MCF-7 cells incubated with fluorescent MoS2-based NSs for 2 h. Confocal images of EGFP-Rab10-transfected (g) HeLa and (h) MCF-7 cells incubated with fluorescent MoS2-based NSs (10 μg/mL) for 2 h. Scale bars: 10 μm.
Figure 7.
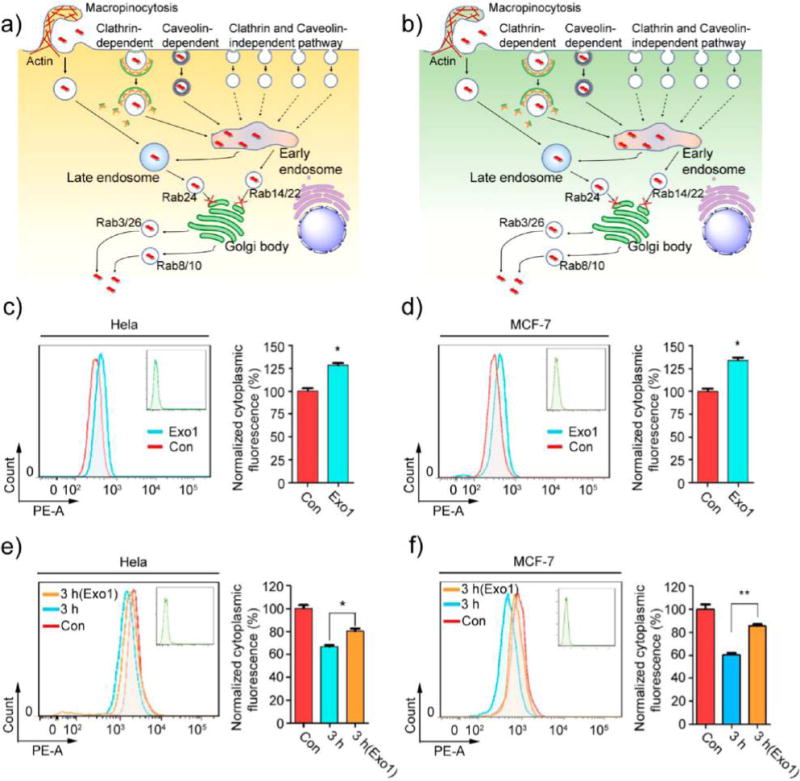
Inhibition of exocytosis increases the accumulation of MoS2-based NSs. Schematic representation of exocytosis pathways in (a) HeLa and (b) MCF-7 cells. (c) HeLa and (d) MCF-7 cells were pretreated with Exo1 for 2 h, and then cells were incubated with fluorescent MoS2-based NSs (10 μg/mL) for 3 h. Cytoplasmic fluorescence was measured by flow cytometer. (e) HeLa and (f) MCF-7 cells were incubated in the presence or absence of Exo1 for 2 h after fluorescent MoS2-based NS treatment. After that, we renewed the culture medium with fresh DMEM and incubated the cells for 3 h. Cytoplasmic fluorescence was then measured by flow cytometer.
Blocking Exocytosis Results in More Accumulation of MoS2-based NSs in Cells
In both cancer cells and healthy cells, Rab22- and Rab24-positive vesicles are involved in the delivery of MoS2-based NSs from early and late endosomes (respectively) to the Golgi. Then Rab3- and Rab26-positive classic secretory vesicles, as well as Rab8- and Rab10-positive GLUT4 translocation vesicles, help secrete these NSs from the cells via exocytosis. Exocytosis of MoS2-based NSs reduces the number of accumulated NSs in the cells, which of course reduces the potency of the therapeutic effect. Therefore, it is possible to use inhibitors to block exocytosis and increase the accumulation of MoS2-based NSs in cells. It has been reported that 2-(4-fluorobenzoylamino)-benzoic acid methyl ester (Exo1) can induce the collapse of the Golgi apparatus and function as a chemical inhibitor of the exocytosis pathway.58 Thus, we used Exo1 to inhibit the exocytosis pathway and examined the cytoplasmic fluorescence of these fluorescent NSs. Cellular metabolic activity was not affected (Figure S31–32). After 2 h pretreatment with Exo1, cytoplasmic fluorescence in HeLa cells increased about 28% after another 3 h incubation with fluorescent NSs (Figure 7c). In MCF-7 cells, cytoplasmic fluorescence increased about 36% (Figure 7d), confirming that the inhibition of the exocytosis pathway significantly increased the accumulation of MoS2-based NSs in cells. To further verify these findings, we renewed the culture medium after treatment with fluorescent NSs and incubated the cells in the presence or absence of Exo1 for 2 h. We then renewed the culture medium a second time and incubated the cells for another 3 h, after which the cytoplasmic fluorescence in both HeLa and MCF-7 cells was measured. In HeLa cells, we found the cytoplasmic fluorescence to be about 35% lower than the control group. However, the Exo1-treated group’s fluorescence was only about 19% lower (Figure 7e). In MCF-7 cells, the cytoplasmic fluorescence was reduced about 41% compared with controls, but that of the Exo1-treated group was reduced by only about 15% (Figure 7f). Similar results were also obtained by testing the concentration of NSs in the supernatant (Figure S33), further confirming the obvious effect on exocytosis in HeLa and MCF-7 cells. The accumulation of these NSs induced by anti-exocytosis was more readily observable during prolonged incubation (24 h) of both cancer cell lines (Figure S34). In HAOEC, pretreatment with Exo1 also increased the amount of intracellular NSs (Figures S30b,c and S35), but not as much as in cancer cells, indicating that exocytosis may be more important than the role it plays in normal cells. In sum, our findings imply that large numbers of MoS2-based NSs can be transported out of cells via exocytosis in cancer cells, but blocking that pathway can help retain a significant amount of these NSs. Moreover, the exocytosis-mediated secretion of MoS2-based NSs is much more noticeable in MCF-7 cells, indicating that MCF-7 cells are drastically more sensitive to the exocytosis pathway-inhibitor Exo1.
Triple-Combination Therapy Strategy Preliminarily Tested in Vitro
Generally, a strong photothermal effect (>50 °C) induces complete cell necrosis, and a mild local photo-thermal effect (∼43 °C) increases the fluidity of the cytomembrane, which contributes to enhanced cellular uptake for effective delivery of drugs. Moreover, the NIR-mediated photothermal effect can elicit specific therapeutic results within the irradiated area without systemic toxicity and spatiotemporally control drug release from the nanocarrier.59,60 Since PEGylated MoS2/DOX NSs were eventually expelled from cells via exocytosis pathways (systematic investigation of the intracellular fate of MoS2-based NSs summarized in Figure 8a), we might further enhance the therapeutic effect and reduce the dose of PEGylated MoS2/DOX NSs by inhibiting the exocytosis process soon after increasing local concentrations of both the drug (chemotherapy) and the nanomaterial (PTT). Therefore, our introduction of Exo1 inhibitors effectively led to a triple-combination therapy strategy. After confirming the biocompatibility of Exo1, we conducted different treatments: (1) PEGylated MoS2 NSs, (2) DOX, (3) PEGylated MoS2/DOX NSs, (4) PEGylated MoS2/DOX NSs + Exo1, (5) PEGylated MoS2 NSs + NIR, (6) PEGylated MoS2 NSs + NIR + Exo1, (7) PEGylated MoS2/DOX NSs + NIR, and (8) PEGylated MoS2/DOX NSs + NIR + Exo1 for 1, 2, or 3 h ([DOX] = 50 μg/mL, [MoS2] = 50.2 μg/mL, [Exo1] = 50 μg/mL), respectively. NIR treatment consists of irradiation with an 808 nm laser at a low power density of 0.4 W/cm2 for 5 min after different incubation times. As shown in Figure 8b,c, only the PEGylated MoS2 NS treatment showed no toxicity in either cell line due to the low dosage. For the chemotherapy groups (“PEGylated MoS2/DOX NSs” and “PEGylated MoS2/DOX NSs + Exo1”), the Exo1-pretreatment group showed higher toxicity than the group without pretreatment (e.g., 40.5% vs 69.4% of viability after 3 h incubation in MCF-7 cells) due to the higher localized concentration of drugs. For the PTT groups (“PEGylated MoS2 NSs + NIR” or “PEGylated MoS2 NSs + NIR + Exo1”), with the treatment of these NSs and inhibited exocytosis, albeit at a low dose and power density (0.4 W/cm2), PEGylated MoS2 NSs with Exo1 pretreatment still showed therapeutic effect (e.g., 75.8% of viability after 3 h incubation in MCF-7 cells), while the group without Exo1 pretreatment showed no obvious therapeutic effect (e.g., 90.1% of viability after 3 h incubation in MCF-7 cells) due to the gentle increase in temperature at a low dosage and power density.
Figure 8.
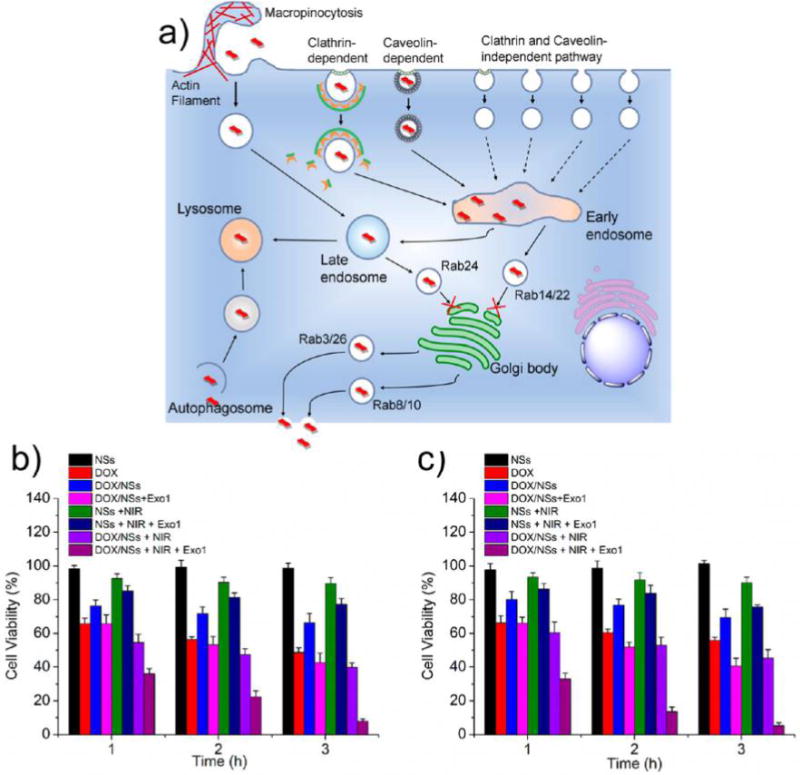
(a) Schematic diagram illustrating the intracellular fates of MoS2-based NSs. The process of trafficking starts with the internalization of NSs through macropinocytosis and both clathrin- and caveolae-dependent endocytosis, and then NSs are transported to early endosomes, shortly after that to late endosomes, and finally to lysosomes; autophagy is involved in the delivery of NSs to lysosomes; exocytosis participates in the secretion of NSs out of the cells; Exo1 inhibits the exocytosis pathways, which leads to the accumulation of MoS2-based NSs in cells. Cell viabilities of (b) HeLa and (c) MCF-7 cells after various treatments indicated: (1) PEGylated MoS2 NSs, (2) DOX, (3) PEGylated MoS2/DOX NSs, (4) PEGylated MoS2/DOX NSs + Exo1, (5) PEGylated MoS2 NSs + NIR, (6) PEGylated MoS2 NSs + NIR + Exo1, (7) PEGylated MoS2/DOX NSs + NIR, and (8) PEGylated MoS2/DOX NSs + NIR + Exo1 for 1, 2, or 3 h ([DOX] = 50 μg/mL, [MoS2] = 50.2 μg/mL, [Exo1] = 50 μg/mL), respectively. NIR: 808 nm laser at a low power density of 0.4 W/cm2 for 5 min after different incubation times. Exo1: pretreated with the cells for 2 h before the different incubation times. Afterward, cells were washed with PBS and incubated for another 24 h in fresh medium before the MTT assay.
The enhanced therapeutic effect may be explained as follows (Figure 9). Although the same level of heat was generated, the inhibition of Exo1 allowed more PEGylated MoS2 NSs to accumulate in the cancer cells, and the gentle heat generated by these NSs directly damaged the organelles and proteins inside the cells. However, without the inhibition of Exo1, a certain fraction of the NSs was expelled from the cells. Because of the protection of the cell membranes and cellular homeostasis, the gentle heat generated by these NSs did not directly influence the organelles or proteins inside the cells. The in vitro effectiveness of this anti-exocytosis-enhanced synergistic therapy strategy was confirmed in both HeLa and MCF-7 cells, as the “PEGylated MoS2/DOX NSs + NIR + Exo1” group demonstrated significant therapeutic effects (i.e., more than 90% cancer cells were killed in both cell lines) at a low MoS2 concentration, low power density (0.4 W/cm2), and short incubation time (3 h).
Figure 9.
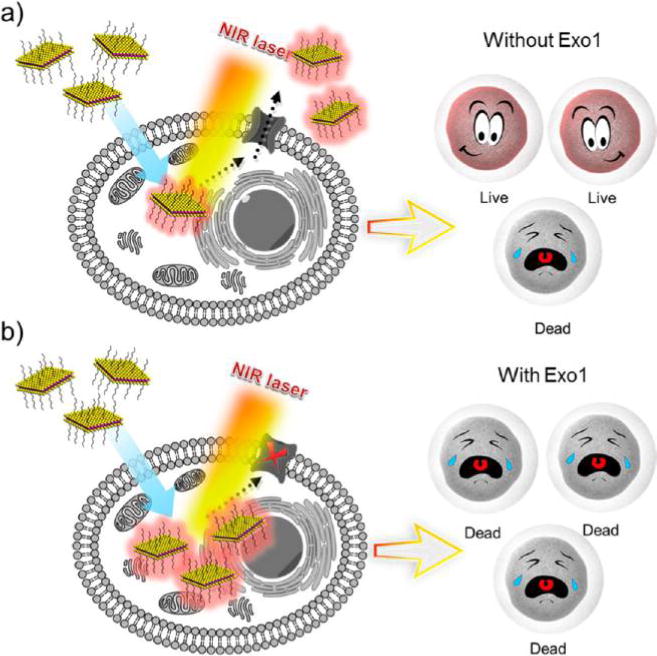
Schematic representation of different therapeutic effects (a) without or (b) with the inhibition of Exo1. Although the same level of heat was generated due to the inhibition of Exo1, more PEGylated MoS2 NSs accumulated in the cancer cells, and the gentle heat generated by these NSs directly damaged the organelles and proteins inside the cells. However, without the inhibition of Exo1, a certain number of the NSs were expelled from the cells. Because of the protection of the cell membranes and cellular homeostasis, the gentle heat generated by these NSs did not directly affect the organelles and proteins inside the cells.
In Vivo Triple-Combination Therapy with Low Doses
Encouraged by the effectiveness of this anti-exocytosis-enhanced synergistic strategy in vitro, we then carried out in vivo experiments to further explore its potential applications. We first performed an H&E-stained histological study to test the toxicity of Exo1 in vivo. No noticeable tissue damage in the major organs could be observed at our tested dose and time (Figure S36). MCF-7 breast tumor-bearing nude mice were treated with Treatment 1 (Saline), Treatment 2 (Exo1), Treatment 3 (DOX), Treatment 4 (PEGylated MoS2/DOX NSs), Treatment 5 (PEGylated MoS2/DOX NSs + Exo1), Treatment 6 (PEGylated MoS2/DOX NSs + NIR), or Treatment 7 (PEGylated MoS2/DOX NSs + NIR + Exo1). The doses of PEGylated MoS2, DOX, and Exo1 were 4.01, 4, and 4 mg/kg, respectively. PEGylated MoS2 and PEGylated MoS2/DOX NSs were administrated via intravenous (i.v.) injection, while Exo1 was administered via intratumoral (i.t.) injection. After 8 h, NIR treatment (Treatments 6 and 7) was performed via irradiation under an 808 nm laser (0.4 W/cm2) for 15 min at the tumor sites. Temperature changes in the tumor sites were monitored by an IR thermal camera during irradiation (Figure 10a). After 15 min irradiation, the temperature increases in the tumor sites in Treatments 6 and 7 were similar (∼14 °C), while those of Treatments 1–5 maintained a constant body temperature (Figure 10b). During the treatment process, tumor volumes of the different groups were calculated every 2 days based on the width and length of the tumors. The loading of DOX on NSs effectively extended its circulation time, and local treatments with NIR or Exo1 did not affect the circulation time of PEGylated MoS2/DOX NSs (Figure S37). As shown in Figure 10c, the local injection of Exo1 (Treatment 2) did not elicit any inhibition of tumor growth at the tested dose, and Treatments 3–7 all decreased the rate of tumor growth when compared with saline. However, anti-exocytosis-enhanced chemotherapy (Treatment 5) showed therapeutic effects superior to single chemotherapy via free DOX (Treatment 3) or the NS delivery platform (Treatment 4), while also achieving therapeutic effects similar to the combined PTT and chemotherapy strategy (Treatment 6), an approach previously reported.14 Moreover, significantly greater therapeutic effect was observed in the triple-combination therapy group (anti-exocytosis-enhanced PTT and chemotherapy) compared to Treatments 5 and 6, which could be explained by the higher drug concentrations and the direct PTT effect inside the tumor cells. Specifically, due to the effect of Exo1, the accumulated PEGylated MoS2/DOX NSs could be more concentrated inside the tumor cells in Treatment 7, which would lead to the following: (i) more DOX would be released (triggered by NIR) inside the tumor cells, (ii) the heat generated by these NSs could directly damage the organelles and proteins inside the cells, and (iii) an enhanced synergistic effect could be caused by more direct and potent chemotherapy and PTT inside the tumor cells. In other words, the significant therapeutic effect was caused by increasing the number of drug-loaded NSs internalized by tumor cells (i.e., more triggered release of DOX inside the cells, and direct photothermal damage to the organelles and proteins inside the cells), rather than by altering the total concentration (i.e., both inside and outside the cancer cells) in tumor tissues (which could also be responsible for the similar PTT effect generated in Treatments 6 and 7). Moreover, the Kaplan–Meier survival curve of another batch of mice subjected to different treatments further confirmed the therapeutic efficacy of this strategy (Figure S38). These results were consistent with those of in vitro studies, indicating the promise of this anti-exocytosis-enhanced triple-combination therapy strategy. Meanwhile, there was no obvious influence on body weight in any of the experimental groups (Figure 10d) and no noticeable tissue damage in the major organs of the triple-combination therapy group when compared with the control group (Figure 10e), indicating the absence of acute side effects.
Figure 10.
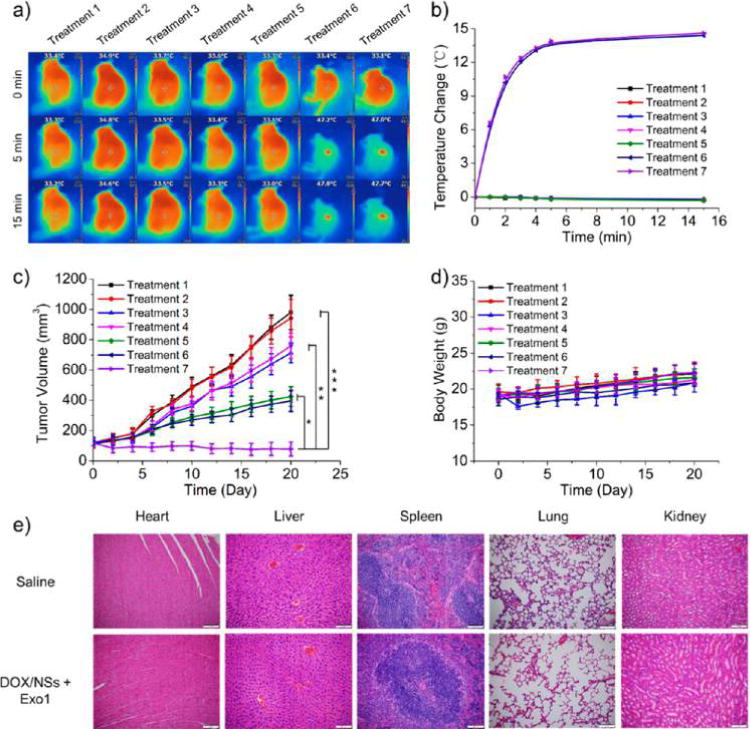
MoS2-based NSs for an in vivo triple-combination therapy with low dose. Treatment 1: Saline; Treatment 2: Exo1; Treatment 3: DOX; Treatment 4: PEGylated MoS2/DOX NSs; Treatment 5: PEGylated MoS2/DOX NSs + Exo1; Treatment 6: PEGylated MoS2/DOX NSs + NIR; Treatment 7: PEGylated MoS2/DOX NSs + NIR + Exo1. The doses of PEGylated MoS2, DOX and Exo1 were 4.01, 4, and 4 mg/kg, respectively. NIR treatment was conducted by irradiating under an 808 nm laser (0.4 W/cm2) for 15 min at the tumor sites. (a) Photothermal images of MCF-7 tumor-bearing mice with different treatments were recorded by an IR thermal camera. (b) Temperature changes at tumor sites were monitored by the IR thermal camera during laser irradiation. (c) Tumor volume growth curves after various treatments for the different groups. (d) Body weight of MCF-7 tumor-bearing mice was measured every other day post treatment (n = 5, *** p < 0.001, ** p < 0.01, * p < 0.05). (e) H&E-stained histological images of tissue sections from heart, liver, spleen, lung, and kidney after 1 month of treatment with PEGylated MoS2/DOX NSs together with Exo1. Saline was applied as control.
CONCLUSIONS
We utilized MoS2 NSs as representative 2D nanomaterials to systematically explore in detail the pathways for endocytosis/exocytosis, cellular trafficking, and nanocell activity (i.e., intracellular fate) relevant to emerging 2D nanomaterials. The MoS2 NSs were internalized through three different endocytosis pathways, and autophagy mediated their accumulation in lysosomes. Additionally, our data established that internalized MoS2 NSs can be secreted from cells via exocytosis and that inhibiting exocytosis significantly reduces the exocytosis-induced loss of MoS2 NSs by cancer cells. A triple-combination therapy strategy based on anti-exocytosis-enhanced chemotherapy and low-dose PTT was proposed and demonstrated to be effective, implying potential biomedical applications. However, this strategy is still in in its infancy. Although some recent studies show the degradability of MoS2 NSs,61,62 the penetration depth of NIR laser in tissues may be improved by clinical endoscope-based devices with embedded laser optical fibers,63 and Exo1 may be intravenously injected by co-loading on the surface of these NSs, more systematic studies are absolutely necessary for its potential application in the future. Nevertheless, a more-detailed understanding of the interaction of 2D nanomaterials with living cells is still crucial for their safe biomedical application, both to reap maximum benefit and limit adverse health effects, which ultimately arise from interactions at the cellular and subcellular levels. The therapy strategy we propose in the current study is just one promising example of advances based on a deeper understanding of the intracellular fate of such 2D nanomaterials.
METHODS
Materials
MoS2 powder, n-butyllithium (1.6 M in hexane), hexane, doxorubicin (DOX), and MTT were obtained from Sigma-Aldrich. LA-PEG was purchased from Nanocs (New York, NY, USA). All other agents used were of the highest commercial grade available. HyPure Molecular Biology grade Water (Hyclone) was used to prepare all solutions.
MoS2 Nanosheets Synthesis and PEG Coating
In a typical procedure, 5 mg of MoS2 powder was immersed in 10 mL of n-butyllithium (1.6 M in hexane) and stirred for 48 h at room temperature. The cloudy dispersion was then subjected to centrifugation at 5000 rpm for 10 min to precipitate all of the materials. After that, the sediment was redispersed in hexane and centrifuged at 5000 rpm for 10 min (2 times) to remove all free unbound molecules. To the semi-dried mixture, 30 mL of deionized (DI) water was added and sonicated for about 5 h to achieve exfoliation. The nanosheets (NSs) produced were then centrifuged at top speed and washed with DI water 3 times before being collected and stored in DI water. The supernatant was dialyzed against DI water using membranes with a molecular weight cutoff (MWCO) of 14 kDa for 2 days to remove lithium compounds and other residual ions. This yielded MoS2 NSs dispersed in water for future use. For the PEG coating, 10 mg of MoS2 NSs was dispersed in 5 mL DI water containing 50 mg of predissolved LA-PEG (Lipoic acid PEG amine, 5 kDa, water-soluble and can be used directly in aqueous buffer). After ultrasonicating for 30 min and stirring overnight, excess LA-PEG was removed via centrifugal filtration with 100 kDa MWCO filters (Millipore) and several washes with DI water. The final PEGylated MoS2 sample was resuspended in DI water for future use.
Characterization
The morphology of MoS2 after PEG coating was characterized by colloidal stability, ζ potential, size distribution, AFM (FASTSCANBIO, Germany), and TEM (JEM-2100UHR, JEOL, Japan). UV–vis-NIR absorption spectra were recorded by an Infinite M200 Pro TECAN GENIOS. The compositions of the PEGylated MoS2 NSs collected from PBS and medium (after 48 h incubation) were analyzed by XPS (ESCALAB 250Xi, Japan).
Fluorescent Drug Loading and Release
For drug loading, 0.2 mg/mL of PEGylated MoS2 NSs was mixed with 0.5 mg/mL of DOX in phosphate buffer (pH 8.0, 20 mM). After stirring at room temperature for 24 h, excess unbound DOX was washed away by filtering the solution through a 100 kDa Millipore filter and rinsing with DI water several times. UV–vis-NIR spectra of MoS2-PEG before and after drug loading were recorded to determine drug-loading ratios. An absorption peak of 490 nm was used to determine the DOX concentrations. For drug release, a solution of PEGylated MoS2/DOX NSs (2 mg mL−1, 1 mL) was packaged in a dialysis bag (MWCO = 14 kDa) and immersed in 19 mL of PBS at pH = 5.0 or 7.4 at room temperature. At certain time intervals, 2 mL of the outside solution was collected, measured by the absorbance spectrometer to determine the concentrations of released drugs, and then poured back to ensure constant volume. Experiments designed to determine the release profiles in cell culture medium and serum were performed accordingly.
Measurement of Photothermal Performance
To measure the photothermal performance of the PEGylated MoS2 NSs, 1 mL aqueous dispersion of PEGylated MoS2 NSs with different concentrations (0.01, 0.05, and 0.1 mg/mL) was introduced into a quartz cuvette and irradiated with an 808 nm NIR laser at a power density of 1 W/cm2 for 5 min. An IR thermal camera (TI100 Infrared Camera FLKTI100 9HZ, FLUKE) was used to record the changes in temperature of the PEGylated MoS2 NSs aqueous solution.
Cell Culture
HeLa and MCF-7 cells were cultured in Dulbecco’s modified Eagle’s medium (DMEM, Gibco) supplemented with 10% heat-inactivated fetal bovine serum (FBS, Gibco) at 37 °C in 5% CO2. HAOEC were cultured in endothelial growth medium (catalog number 211-500; Cell Applications, Inc.) in a 37 °C, 5% CO2 humidified incubator.
Assessment of Cell Viability
Cell viability was determined by MTT. Cells were seeded in 96-well plates and then incubated with different inhibitors at the indicated concentrations for 24 h. Following this, 20 μL MTT (2 mg/mL) was added, and cells were incubated for another 4 h. Finally, 200 μL DMSO was added, and the plates were read at a wavelength of 490 nm.
Plasmid and Transfection
The Rab genes in the T Vector were kindly provided by Professor Jiahuai Han and subsequently subcloned into DsRed-C1 and EGFP-C1 vectors. The EGFP-LC3 plasmid was cloned in our laboratory. The plasmids were transiently transfected into HeLa and MCF-7 cells with the addition of Lipofectamine 2000 (Invitrogen) according to the manufacturer’s instructions.
Cellular Uptake of 2D NSs
Non-transfected or EGFP-Rabs-transfected HeLa and MCF-7 cells were incubated with 10 μg/mL fluorescent NSs at 37 °C for 3 h. Then the cells were washed with PBS and fixed with 4% paraformaldehyde for 15 min. Finally, the cellular uptake of the NSs was examined by confocal laser scanning microscopy (Olympus FV1000–81, Tokyo, Japan).
Immunofluorescence
The cells were washed with PBS, fixed by 4% paraformaldehyde for 15 min, and permeabilized by 0.01% Triton-100 for 2 min. Then the cells were incubated with primary antibodies: Rab5, Rab7, and Lamp1. Finally, FITC- and Alexa Fluor 647-labeled secondary antibodies were used to detect the primary antibodies.
Electron Microscopy Analysis
Cells were collected and fixed in 2.5% glutaraldehyde in natrium cacodylicum (pH = 7.4) for 4 h at 4 °C. Then cells were embedded, sectioned, and double stained with uranyl acetate and lead citrate for observation under transmission electron microscope (Hitachi H-7500).
Pearson’s Correlation Coefficient analysis
The software ImageJ was applied to analyze the pixel intensity of each image, and then Pearson’s correlation coefficient was further analyzed.
Immunoblotting
In brief, cell lysates were resolved on 12% SDS-PAGE and analyzed by immunoblotting using LC3, Arf6, and GAPDH antibodies, followed by enhanced chemiluminescence (ECL) detection (Thermo Scientific).
Intracellular Fluorescence Assay
Cells were incubated with and without fluorescent NSs for the indicated time periods. Then cells were washed and collected for intracellular fluorescence assay using a Partec PAS III flow cytometer.
Cytotoxicity Assays
For the cell viability assay, HeLa or MCF-7 cells were preseeded in 96-well plates at 5000/well and incubated with nystatin, sucrose, chlorpromazine, rottlerin, or Exo1 for 2 h. Then the cells were washed with PBS, and the standard cell-viability MTT assay was carried out to determine the respective cell viabilities. For long-term cytotoxicity assay of Exo1, cells were preseeded in 96-well plates at 5000/well and incubated with Exo1 for 24 or 48 h, and then the standard cell-viability MTT assay was carried out to determine the respective cell viabilities.
In Vitro Triple-Combination therapy
To study the effect of the in vitro triple-combination therapy of PEGylated MoS2 NSs, the viabilities of HeLa and MCF-7 cells were tested by MTT assays after various treatments. More specifically, HeLa and MCF-7 cells were treated as follows: (1) PEGylated MoS2 NSs, (2) DOX, (3) PEGylated MoS2/DOX NSs, (4) PEGylated MoS2/DOX NSs + Exo1, (5) PEGylated MoS2 NSs + NIR, (6) PEGylated MoS2 NSs + NIR + Exo1, (7) PEGylated MoS2/DOX NSs + NIR, and (8) PEGylated MoS2/DOX NSs + NIR + Exo1 for 1, 2, or 3 h ([DOX] = 50 μg/mL, [MoS2] = 50.2 μg/mL, [Exo1] = 50 μg/mL), respectively. NIR treatment was conducted by irradiation with an 808 nm laser at a low power density of 0.4 W/cm2 for 5 min after each incubation time point. Exo1 treatment was performed by pre-treating cells for 2 h before the different incubation times. Afterward, the cells were washed with PBS and incubated for an additional 24 h in fresh medium before the MTT assay.
Xenograft Tumor Model
Severe combined immunodeficient (SCID) nude mice were provided by the Institute of Laboratory Animal Sciences, Chinese Academy of Medical Science. The Administrative Committee on Animal Research at Tsinghua University approved the protocols for all animal assays in this paper. About 100 μL of MCF-7 cells (2 × 10⁶ cells) in PBS were implanted subcutaneously into the back of each mouse (∼18.9 g). The tumor size and volume (V) was calculated as 4π/3 × (length/2) × (width/2)2 using a Vernier caliper.
In Vivo Triple-Combination therapy
When the tumor size reached approximately 100 mm3 (designated as Day 0), mice were randomly divided into seven groups (n = 5 per group) and subjected to different treatments. Treatment 1: Saline; Treatment 2: Exo1; Treatment 3: DOX; Treatment 4: PEGylated MoS2/DOX NSs; Treatment 5: PEGylated MoS2/DOX NSs + Exo1; Treatment 6: PEGylated MoS2/DOX NSs + NIR; Treatment 7: PEGylated MoS2/DOX NSs + NIR + Exo1. The doses of PEGylated MoS2, DOX and Exo1 were 4.01 mg/kg, 4 mg/kg, and 4 mg/kg, respectively. Saline, DOX, and PEGylated MoS2/DOX NSs were injected via intravenous (i.v.) injection, while Exo1 was intratumorally (i.t.) injected at the same time. NIR treatment was conducted by irradiating under an 808 nm laser (0.4 W/cm2) for 15 min at the tumor sites 8 h after injection. The body weight and tumor size of each mouse were measured and recorded every other day for 3 weeks. To better assess the survival of MCF-7 tumor-bearing mice, another batch of 70 mice was divided into groups and given different treatments (n = 10 per group). Survival curves were recorded based on the Kaplan–Meier method.
Pharmacokinetics
Blood circulation of DOX was tested by collecting 30 μL of blood from the mice in different groups (Treatments 3–7) at different time intervals (n = 10 per group). The blood samples were weighed and then treated with 300 μL of lysis buffer (1% SDS, 1% Triton-100, 40 mM Tris acetate, 10 mM EDTA, and 10 mM DTT). The DOX was extracted from blood by adding 300 μL of HCl/isopropanol. After incubation in the dark overnight, the mixture was centrifuged to obtain the DOX in the supernatant, and the amount of DOX was determined by absorbance (the absorbance due to background was subtracted from the spectra).
Hematocylin and Eosin (H&E)-Stained Histology
To access the toxicity of Exo1 in vivo, H&E-stained histological images of heart, liver, spleen, lung, and kidney sections from healthy Balb/c mice (with i.v. injection of 6 mg/kg of Exo1) at 1, 7, 14, and 30 days post-injection were obtained.
Moreover, healthy Balb/c mice that received i.v. injections of PEGylated MoS2/DOX NSs and Exo1, with high doses of PEGylated MoS2, DOX, and Exo1 (at 6 mg/kg, 6 mg/kg, and 6 mg/kg, respectively), were also studied for histology to assess the toxicity of the proposed strategy. After one month of treatment, all mice were humanely killed, and their organs harvested, fixed in a 10% formalin solution, and embedded in paraffin for H&E staining.
Supplementary Material
Acknowledgments
We thank Prof. Jinjun Shi from Harvard Medical School for helpful discussions. This work was supported by grants from the US National Institutes of Health (NIH) HL127464; the David H. Koch-Prostate Cancer Foundation (PCF) Program in Cancer Nanotherapeutics; National Research Foundation of Korea grant K1A1A2048701; Natural Science Foundation of Guangdong Province 2016A030310023; China Postdoctoral Science Foundation 2016M600676; Tsinghua Scholarship for Overseas Graduate Studies 2013159.
W.T., O.C.F., and X.Z. conceived the idea and designed the study. W.T. and O.C.F. directed the project. X.Z., X.J., N.K., and Y.C. performed all the experiments and analyzed the data. X.X., L.D., T.C., Y.L., T.G., and H.C. helped with nanosheet preparation and in vitro and in vivo experimental assays. W.T., M.M., A.B., Z.B., and Y.C. provided technical support and corrections to the manuscript. W.T. and O.C.F. provided reagents and conceptual advice. X.Z., X.J., and N.K. wrote the manuscript and revised it according to the comments of W.T. and O.C.F. Requests for materials should be addressed to W.T.
Footnotes
Supporting Information
The Supporting Information is available free of charge on the ACS Publications website at DOI: 10.1021/acsnano.8b00516.
Characterization of the MoS2-based NSs; mechanism studies of the Arf6, RhoA, sdc42, and Flotillin-based endocytosis pathways; in vitro cytotoxicity of Nys, Suc, Chl, Rot, and Exo1 in HeLa and MCF-7 cells; mechanism studies of exocytosis pathways based on Rab5, Rab34, Rab7, Rab22, Rab14, and Rab 24 (PDF)
ORCID
Morteza Mahmoudi: 0000-0002-2575-9684
Wei Tao: 0000-0002-4277-3728
Omid C. Farokhzad: 0000-0003-2009-270X
Notes
The authors declare the following competing financial interest(s): O.C.F. declares financial interests in Selecta Biosciences, Tarveda Therapeutics, and Placon Therapeutics.
References
- 1.Wang QH, Kalantar-Zadeh K, Kis A, Coleman JN, Strano MS. Electronics and Optoelectronics of Two-Dimensional Transition Metal Dichalcogenides. Nat Nanotechnol. 2012;7:699–712. doi: 10.1038/nnano.2012.193. [DOI] [PubMed] [Google Scholar]
- 2.Chhowalla M, Shin HS, Eda G, Li LJ, Loh KP, Zhang H. The Chemistry of Two-Dimensional Layered Transition Metal Dichalcogenide Nanosheets. Nat Chem. 2013;5:263–275. doi: 10.1038/nchem.1589. [DOI] [PubMed] [Google Scholar]
- 3.Jariwala D, Sangwan VK, Lauhon LJ, Marks TJ, Hersam MC. Emerging Device Applications for Semiconducting Two-Dimensional Transition Metal Dichalcogenides. ACS Nano. 2014;8:1102–1120. doi: 10.1021/nn500064s. [DOI] [PubMed] [Google Scholar]
- 4.Johari P, Shenoy VB. Tuning the Electronic Properties of Semiconducting Transition Metal Dichalcogenides by Applying Mechanical Strains. ACS Nano. 2012;6:5449–5456. doi: 10.1021/nn301320r. [DOI] [PubMed] [Google Scholar]
- 5.Yuan J, Najmaei S, Zhang Z, Zhang J, Lei S, P MA, Yakobson BI, Lou J. Uenching and Charge Transfer in Artificial Heterostacks of Monolayer Transition Metal Dichalcogenides and Few-Layer Black Phosphorus. ACS Nano. 2015;9:555–563. doi: 10.1021/nn505809d. [DOI] [PubMed] [Google Scholar]
- 6.Tan C, Zhang H. Two-Dimensional Transition Metal Dichalcogenide Nanosheet-Based Composites. Chem Soc Rev. 2015;44:2713–2731. doi: 10.1039/c4cs00182f. [DOI] [PubMed] [Google Scholar]
- 7.Sun G, Liu J, Zhang X, Wang X, Li H, Yu Y, Huang W, Zhang H, Chen P. Fabrication of Ultralong Hybrid Microfibers from Nanosheets of Reduced Graphene Oxide and Transition-Metal Dichalcogenides and their Application As Supercapacitors. Angew Chem, Int Ed. 2014;53:12576–12580. doi: 10.1002/anie.201405325. [DOI] [PubMed] [Google Scholar]
- 8.Lopez-Sanchez O, Lembke D, Kayci M, Radenovic A, Kis A. Ultrasensitive Photodetectors Based on Monolayer MoS2. Nat Nanotechnol. 2013;8:497–501. doi: 10.1038/nnano.2013.100. [DOI] [PubMed] [Google Scholar]
- 9.Li H, Wu J, Yin Z, Zhang H. Preparation and Applications of Mechanically Exfoliated Single-Layer and Multilayer MoS2 and WSe2 Nanosheets. Acc Chem Res. 2014;47:1067–1075. doi: 10.1021/ar4002312. [DOI] [PubMed] [Google Scholar]
- 10.Ou JZ, Chrimes AF, Wang Y, Tang SY, Strano MS, Kalantar-zadeh K. Ion-Driven Photoluminescence Modulation of Quasi-Two-Dimensional MoS2 Nanoflakes for Applications in Biological Systems. Nano Lett. 2014;14:857–863. doi: 10.1021/nl4042356. [DOI] [PubMed] [Google Scholar]
- 11.Tao W, Ji X, Xu X, Islam MA, Li Z, Chen S, Saw PE, Zhang H, Bharwani Z, Guo Z, Shi J, Farokhzad OC. Antimonene Quantum Dots: Synthesis and Application As Near-Infrared Photo-thermal Agents for Effective Cancer Therapy. Angew Chem, Int Ed. 2017;56:11896–11900. doi: 10.1002/anie.201703657. [DOI] [PMC free article] [PubMed] [Google Scholar]
- 12.Cheng L, Liu J, Gu X, Gong H, Shi X, Liu T, Wang C, Wang X, Liu G, Xing H, Bu W, Sun B, Liu Z. PEGylated WS2 Nanosheets As a Multifunctional Theranostic Agent for In Vivo Dual-Modal CT/Photoacoustic Imaging Guided Photothermal Therapy. Adv Mater. 2014;26:1886–1893. doi: 10.1002/adma.201304497. [DOI] [PubMed] [Google Scholar]
- 13.Tao W, Zhu X, Yu X, Zeng X, Xiao Q, Zhang X, Ji X, Wang X, Shi J, Zhang H, Mei L. Black Phosphorus Nanosheets As a Robust Delivery Platform for Cancer Theranostics. Adv Mater. 2017;29:1603276. doi: 10.1002/adma.201603276. [DOI] [PMC free article] [PubMed] [Google Scholar]
- 14.Liu T, Wang C, Gu X, Gong H, Cheng L, Shi X, Feng L, Sun B, Liu Z. Drug Delivery with PEGylated MoS2 Nano-Sheets for Combined Photothermal and Chemotherapy of Cancer. Adv Mater. 2014;26:3433–3440. doi: 10.1002/adma.201305256. [DOI] [PubMed] [Google Scholar]
- 15.Chimene D, Alge DL, Gaharwar AK. Two-Dimensional Nanomaterials for Biomedical Applications: Emerging Trends and Future Prospects. Adv Mater. 2015;27:7261–7284. doi: 10.1002/adma.201502422. [DOI] [PubMed] [Google Scholar]
- 16.Liu T, Shi S, Liang C, Shen S, Cheng L, Wang C, Song X, Goel S, Barnhart TE, Cai W, Liu Z. Iron Oxide Decorated MoS2 Nanosheets with Double PEGylation for Chelator-Free Radiolabeling and Multimodal Imaging Guided Photothermal Therapy. ACS Nano. 2015;9:950–960. doi: 10.1021/nn506757x. [DOI] [PMC free article] [PubMed] [Google Scholar]
- 17.Yin W, Yan L, Yu J, Tian G, Zhou L, Zheng X, Zhang X, Yong Y, Li J, Gu Z, Zhao Y. High-Throughput Synthesis of Single-Layer MoS2 Nanosheets As a Near-Infrared Photothermal-Triggered Drug Delivery for Effective Cancer Therapy. ACS Nano. 2014;8:6922–6933. doi: 10.1021/nn501647j. [DOI] [PubMed] [Google Scholar]
- 18.Wang H, Yang X, Shao W, Chen S, Xie J, Zhang X, Wang J, Xie Y. Ultrathin Black Phosphorus Nanosheets for Efficient Singlet Oxygen Generation. J Am Chem Soc. 2015;137:11376–11382. doi: 10.1021/jacs.5b06025. [DOI] [PubMed] [Google Scholar]
- 19.Lv R, Yang D, Yang P, Xu J, He F, Gai S, Li C, Dai Y, Yang G, Lin J. Integration of Upconversion Nanoparticles and Ultrathin Black Phosphorus for Efficient Photodynamic Theranostics under 808 nm Near-Infrared Light Irradiation. Chem Mater. 2016;28:4724–4734. [Google Scholar]
- 20.Jiang T, Sun W, Zhu Q, Burns NA, Khan SA, Mo R, Gu Z. Furin-Mediated Sequential Delivery of Anticancer Cytokine and Small-Molecule Drug Shuttled by Graphene. Adv Mater. 2015;27:1021–1028. doi: 10.1002/adma.201404498. [DOI] [PMC free article] [PubMed] [Google Scholar]
- 21.Shah P, Narayanan TN, Li CZ, Alwarappan S. Probing the Biocompatibility of MoS2 Nanosheets by Cytotoxicity Assay and Electrical Impedance Spectroscopy. Nanotechnology. 2015;26:315102. doi: 10.1088/0957-4484/26/31/315102. [DOI] [PubMed] [Google Scholar]
- 22.Teo WZ, Chng EL, Sofer Z, Pumera M. Cytotoxicity of Exfoliated Transition-Metal Dichalcogenides (MoS2, WS2, and WSe2) is Lower than that of Graphene and its Analogues. Chem - Eur J. 2014;20:9627–9632. doi: 10.1002/chem.201402680. [DOI] [PubMed] [Google Scholar]
- 23.Chng EL, Sofer Z, Pumera M. MoS2 Exhibits Stronger Toxicity with Increased Exfoliation. Nanoscale. 2014;6:14412–14418. doi: 10.1039/c4nr04907a. [DOI] [PubMed] [Google Scholar]
- 24.Mao J, Chen P, Liang J, Guo R, Yan LT. Receptor-Mediated Endocytosis of Two-Dimensional Nanomaterials Undergoes Flat Vesiculation and Occurs by Revolution and Self-Rotation. ACS Nano. 2016;10:1493–1502. doi: 10.1021/acsnano.5b07036. [DOI] [PubMed] [Google Scholar]
- 25.Jiang X, Rocker C, Hafner M, Brandholt S, Dorlich RM, Nienhaus GU. Endo- and Exocytosis of Zwitterionic Quantum Dot Nanoparticles by Live HeLa Cells. ACS Nano. 2010;4:6787–6797. doi: 10.1021/nn101277w. [DOI] [PubMed] [Google Scholar]
- 26.Behzadi S, Serpooshan V, Tao W, Hamaly MA, Alkawareek MY, Dreaden EC, Brown D, Alkilany AM, Farokhzad OC, Mahmoudi M. Cellular Uptake of Nanoparticles: Journey Inside the Cell. Chem Soc Rev. 2017;46:4218–4244. doi: 10.1039/c6cs00636a. [DOI] [PMC free article] [PubMed] [Google Scholar]
- 27.Shi J, Kantoff PW, Wooster R, Farokhzad OC. Cancer Nanomedicine: Progress, Challenges and Opportunities. Nat Rev Cancer. 2017;17:20–37. doi: 10.1038/nrc.2016.108. [DOI] [PMC free article] [PubMed] [Google Scholar]
- 28.Ding L, Zhu X, Wang Y, Shi B, Ling X, Chen H, Nan W, Barrett A, Guo Z, Tao W, Wu J, Shi X. Intracellular Fate of Nanoparticles with Polydopamine Surface Engineering and a Novel Strategy for Exocytosis-Inhibiting, Lysosome Impairment-Based Cancer Therapy. Nano Lett. 2017;17:6790–6801. doi: 10.1021/acs.nanolett.7b03021. [DOI] [PubMed] [Google Scholar]
- 29.Zhu C, Zeng Z, Li H, Li F, Fan C, Zhang H. Single-Layer MoS2-Based Nanoprobes for Homogeneous Detection of Biomolecules. J Am Chem Soc. 2013;135:5998–6001. doi: 10.1021/ja4019572. [DOI] [PubMed] [Google Scholar]
- 30.Chou SS, Kaehr B, Kim J, Foley BM, De M, Hopkins PE, Huang J, Brinker CJ, Dravid VP. Chemically Exfoliated MoS2 As Near-Infrared Photothermal Agents. Angew Chem, Int Ed. 2013;52:4160–4164. doi: 10.1002/anie.201209229. [DOI] [PMC free article] [PubMed] [Google Scholar]
- 31.Wang S, Chen Y, Li X, Gao W, Zhang L, Liu J, Zheng Y, Chen H, Shi J. Injectable 2D MoS2-Integrated Drug Delivering Implant for Highly Efficient NIR-Triggered Synergistic Tumor Hyperthermia. Adv Mater. 2015;27:7117–7122. doi: 10.1002/adma.201503869. [DOI] [PubMed] [Google Scholar]
- 32.Liu C, Kong D, Hsu P-C, Yuan H, Lee H-W, Liu Y, Wang H, Wang S, Yan K, Lin D, Maraccini PA, Parker KM, Boehm AB, Cui Y. Rapid Water Disinfection Using Vertically Aligned MoS2 Nanofilms and Visible Light. Nat Nanotechnol. 2016;11:1098–1104. doi: 10.1038/nnano.2016.138. [DOI] [PubMed] [Google Scholar]
- 33.Wang Y, Liu Y, Liu Y, Wang Y, Wu J, Li R, Yang J, Zhang N. PH-Sensitive Pullulan-Based Nanoparticles for Intracellular Drug Delivery. Polym Chem. 2014;5:423–432. [Google Scholar]
- 34.He H, Ren Y, Wang Z, Xie Z. A PH-Responsive Poly (Ether Amine) Micelle with Hollow Structure for Controllable Drug Release. RSC Adv. 2016;6:91940–91948. [Google Scholar]
- 35.Hu Y, He L, Ding J, Sun D, Chen L, Chen X. One-Pot Synthesis of Dextran Decorated Reduced Graphene Oxide Nanoparticles for Targeted Photo-Chemotherapy. Carbohydr Polym. 2016;144:223–229. doi: 10.1016/j.carbpol.2016.02.062. [DOI] [PubMed] [Google Scholar]
- 36.Cleal K, He L, Watson PD, Jones AT. Endocytosis, Intracellular Traffic and Fate of Cell Penetrating Peptide Based Conjugates and Nanoparticles. Curr Pharm Des. 2013;19:2878–2894. doi: 10.2174/13816128113199990297. [DOI] [PubMed] [Google Scholar]
- 37.Mayor S, Pagano RE. Pathways of Clathrin-Independent Endocytosis. Nat Rev Mol Cell Biol. 2007;8:603–612. doi: 10.1038/nrm2216. [DOI] [PMC free article] [PubMed] [Google Scholar]
- 38.Lichstein HC. Studies of the Effect of Sodium Azide on Microbic Growth and Respiration. J Bacteriol. 1944;47:239–251. doi: 10.1128/jb.47.3.221-230.1944. [DOI] [PMC free article] [PubMed] [Google Scholar]
- 39.Bertram G, Wessing A. Intracellular PH Regulation by the Plasma Membrane V-ATPase in Malpighian Tubules of Drosophila Larvae. J Comp Physiol, B. 1994;164:238–246. doi: 10.1007/BF00354085. [DOI] [PubMed] [Google Scholar]
- 40.Vancura A. Membrane Trafficking. In: Walker J M, editor. Methods Mol Biol. Humana Press; Totowa, N.J.: 2008. pp. 319–332. [Google Scholar]
- 41.Conner SD, Schmid SL. Regulated Portals of Entry into the Cell. Nature. 2003;422:37–44. doi: 10.1038/nature01451. [DOI] [PubMed] [Google Scholar]
- 42.Stenmark H. Rab GTPases As Coordinators of Vesicle Traffic. Nat Rev Mol Cell Biol. 2009;10:513–525. doi: 10.1038/nrm2728. [DOI] [PubMed] [Google Scholar]
- 43.dos Santos T, Varela J, Lynch I, Salvati A, Dawson KA. Effects of Transport Inhibitors on the Cellular Uptake of Carboxylated Polystyrene Nanoparticles in Different Cell Lines. PLoS One. 2011;6:e24438. doi: 10.1371/journal.pone.0024438. [DOI] [PMC free article] [PubMed] [Google Scholar]
- 44.Sarkar K, Kruhlak MJ, Erlandsen SL, Shaw S. Selective Inhibition by Rottlerin of Macropinocytosis in Monocyte-Derived Dendritic Cells. Immunology. 2005;116:513–524. doi: 10.1111/j.1365-2567.2005.02253.x. [DOI] [PMC free article] [PubMed] [Google Scholar]
- 45.Sakhrani NM, Padh H. Organelle Targeting: Third Level of Drug Targeting. Drug Des, Dev Ther. 2013;7:585–599. doi: 10.2147/DDDT.S45614. [DOI] [PMC free article] [PubMed] [Google Scholar]
- 46.Oh N, Park JH. Endocytosis and Exocytosis of Nanoparticles in Mammalian Cells. Int J Nanomed. 2014;9:51–63. doi: 10.2147/IJN.S26592. [DOI] [PMC free article] [PubMed] [Google Scholar]
- 47.Kim J, Kim H, Kim WJ. Single-Layered MoS2–PEI–PEG Nanocomposite-Mediated Gene Delivery Controlled by Photo and Redox Stimuli. Small. 2016;12:1184–1192. doi: 10.1002/smll.201501655. [DOI] [PubMed] [Google Scholar]
- 48.Gilleron J, Querbes W, Zeigerer A, Borodovsky A, Marsico G, Schubert U, Manygoats K, Seifert S, Andree C, Stoter M, Epstein-Barash H, Zhang L, Koteliansky V, Fitzgerald K, Fava E, Bickle M, Kalaidzidis Y, Akinc A, Maier M, Zerial M. Image-Based Analysis of Lipid Nanoparticle-Mediated siRNA Delivery, Intracellular Trafficking and Endosomal Escape. Nat Biotechnol. 2013;31:638–646. doi: 10.1038/nbt.2612. [DOI] [PubMed] [Google Scholar]
- 49.Dominska M, Dykxhoorn DM. Breaking Down the Barriers: siRNA Delivery and Endosome Escape. J Cell Sci. 2010;123:1183–9. doi: 10.1242/jcs.066399. [DOI] [PubMed] [Google Scholar]
- 50.Meier O, Boucke K, Hammer SV, Keller S, Stidwill RP, Hemmi S, Greber UF. Adenovirus Triggers Macropinocytosis and Endosomal Leakage Together with its Clathrin-Mediated Uptake. J Cell Biol. 2002;158:1119–1131. doi: 10.1083/jcb.200112067. [DOI] [PMC free article] [PubMed] [Google Scholar]
- 51.Mizushima N, Komatsu M. Autophagy: Renovation of Cells and Tissues. Cell. 2011;147:728–741. doi: 10.1016/j.cell.2011.10.026. [DOI] [PubMed] [Google Scholar]
- 52.Zhang X, Dong Y, Zeng X, Liang X, Li X, Tao W, Chen H, Jiang Y, Mei L, Feng SS. The Effect of Autophagy Inhibitors on Drug Delivery Using Biodegradable Polymer Nanoparticles in Cancer Treatment. Biomaterials. 2014;35:1932–1943. doi: 10.1016/j.biomaterials.2013.10.034. [DOI] [PubMed] [Google Scholar]
- 53.Zhang J, Zhang X, Liu G, Chang D, Liang X, Zhu X, Tao W, Mei L. Intracellular Trafficking Network of Protein Nanocapsules: Endocytosis, Exocytosis and Autophagy. Theranostics. 2016;6:2099–2113. doi: 10.7150/thno.16587. [DOI] [PMC free article] [PubMed] [Google Scholar]
- 54.Zhang X, Liang X, Gu J, Chang D, Zhang J, Chen Z, Ye Y, Wang C, Tao W, Zeng X, Liu G, Zhang Y, Mei L, Gu Z. Investigation and Intervention of Autophagy to Guide Cancer Treatment with Nanogels. Nanoscale. 2017;9:150–163. doi: 10.1039/c6nr07866d. [DOI] [PubMed] [Google Scholar]
- 55.Zhang J, Chang D, Yang Y, Zhang X, Tao W, Jiang L, Liang X, Tsai H, Huang L, Mei L. Systematic Investigation on the Intracellular Trafficking Network of Polymeric Nanoparticles. Nanoscale. 2017;9:3269–3282. doi: 10.1039/c7nr00532f. [DOI] [PubMed] [Google Scholar]
- 56.Bhuin T, Roy JK. Rab Proteins: the Key Regulators of Intracellular Vesicle Transport. Exp Cell Res. 2014;328:1–19. doi: 10.1016/j.yexcr.2014.07.027. [DOI] [PubMed] [Google Scholar]
- 57.Hutagalung AH, Novick PJ. Role of Rab GTPases in Membrane Traffic and Cell Physiology. Physiol Rev. 2011;91:119–149. doi: 10.1152/physrev.00059.2009. [DOI] [PMC free article] [PubMed] [Google Scholar]
- 58.Feng Y, Yu S, Lasell TK, Jadhav AP, Macia E, Chardin P, Melancon P, Roth M, Mitchison T, Kirchhausen T. Exo1: a New Chemical Inhibitor of the Exocytic Pathway. Proc Natl Acad Sci U S A. 2003;100:6469–6474. doi: 10.1073/pnas.0631766100. [DOI] [PMC free article] [PubMed] [Google Scholar]
- 59.Song X-R, Wang X, Yu S-X, Cao J, Li S-H, Li J, Liu G, Yang H-H, Chen X. Co9Se8 Nanoplates As a New Theranostic Platform for Photoacoustic/Magnetic Resonance Dual-Modal-Imaging-Guided Chemo-Photothermal Combination Therapy. Adv Mater. 2015;27:3285–3291. doi: 10.1002/adma.201405634. [DOI] [PMC free article] [PubMed] [Google Scholar]
- 60.Chu C, Lin H, Liu H, Wang X, Wang J, Zhang P, Gao H, Huang C, Zeng Y, Tan Y, Liu G, Chen X. Tumor Microenvironment-Triggered Supramolecular System As an In Situ Nanotheranostic Generator for Cancer Phototherapy. Adv Mater. 2017;29:1605928. doi: 10.1002/adma.201605928. [DOI] [PMC free article] [PubMed] [Google Scholar]
- 61.Hao J, Song G, Liu T, Yi X, Yang K, Cheng L, Liu Z. In Vivo Long-Term Biodistribution, Excretion, and Toxicology of PEGylated Transition-Metal Dichalcogenides MS2 (M = Mo, W, Ti) Nanosheets Adv Sci. 2017;4:1600160. doi: 10.1002/advs.201600160. [DOI] [PMC free article] [PubMed] [Google Scholar]
- 62.Chen L, Feng Y, Zhou X, Zhang Q, Nie W, Wang W, Zhang Y, He C. One-Pot Synthesis of MoS2 Nanoflakes with Desirable Degradability for Photothermal Cancer Therapy. ACS Appl Mater Interfaces. 2017;9:17347–17358. doi: 10.1021/acsami.7b02657. [DOI] [PubMed] [Google Scholar]
- 63.Chen Q, Xu L, Liang C, Wang C, Peng R, Liu Z. Photothermal Therapy with Immune-Adjuvant Nanoparticles Together with Checkpoint Blockade for Effective Cancer Immunotherapy. Nat Commun. 2016;7:13193. doi: 10.1038/ncomms13193. [DOI] [PMC free article] [PubMed] [Google Scholar]
Associated Data
This section collects any data citations, data availability statements, or supplementary materials included in this article.


