Introduction:
Deaths from prescription opioids have sharply increased in the U.S.(1) In response, the Centers for Disease Control and Prevention recently issued recommendations for opioid prescribing for chronic pain.(2) In light of this and other public health efforts, an integral piece of epidemiologic information about opioid misuse remains unanswered: the distribution of opioid use across the population. This fact has important policy implications. If opioid use is concentrated among a small fraction of patients, this would argue for focused efforts aimed at reducing utilization among these individuals. Conversely, if opioid use is evenly distributed, this would argue for broader, population-wide policies aimed at reducing opioid use.
Objective:
To identify the extent to which population-level opioid use among privately insured, cancer-free adults in the United States during 2001–2013 was concentrated among a small fraction of opioid users.
Methods and Findings:
Data consisted of pharmacy claims for 20,499,750 privately insured individuals ages 18–64 years who were continuously enrolled for at least one calendar year between 2001 and 2013 (Marketscan®, Truven Health Analytics, Ann Arbor, MI), and who filled at least one prescription for an opioid during this time. Marketscan® provides data on health care utilization for patients enrolled in private insurance plans through a participating employer, health plan, or government organization. Compared to the U.S. population, the Marketscan® population is slightly more female, more likely to live in the southern U.S., and less likely live in the western U.S.(3) We isolated prescriptions for common orally administered opioids: hydrocodone (except as part of a cold/cough formulation), hydromorphone, methadone, morphine, oxymorphone, and oxycodone. We excluded methadone, since many patients use methadone to manage addiction instead of pain.(4)
From an initial sample of 93,282,214 prescriptions, we excluded 719,080 (0.8%) for which the quantity supplied or dosage was missing. After converting each prescription to oral morphine equivalents (MEQs),(5) we calculated the total annual MEQs for each patient in our sample. We then calculated the total MEQs utilized by the entire sample, as well as the share of this total used by patients in each percentile group (e.g., top percentile in terms of MEQ) on an annual basis. After excluding patients with a history of cancer, defined as having any claim with a relevant diagnosis code (n=969,163) (6), our final sample consisted of 19,530,587 patients and 31,156,099 person-year observations. Patients were followed for every calendar year in which they maintained continuous enrollment (mean follow-up 4 years, inter-quartile range 2–6 years).
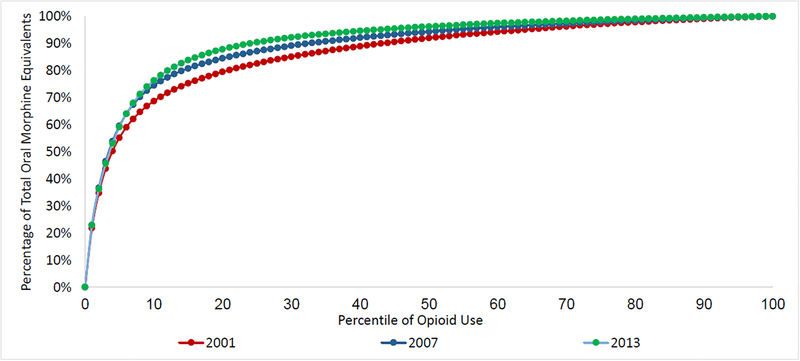
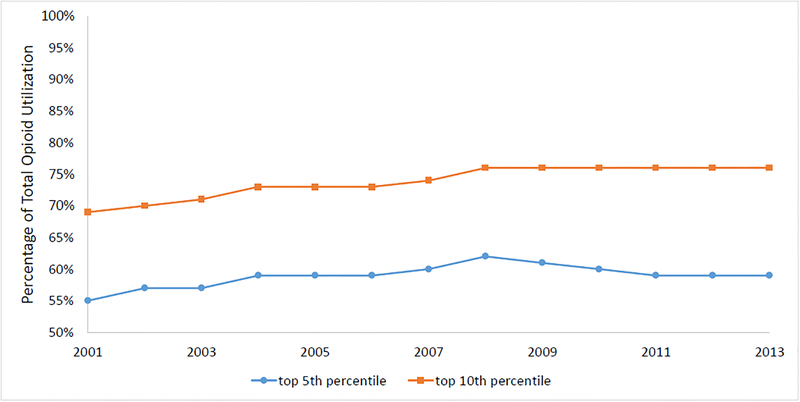
In 2013, the top 5 percent of individuals using opioids (i.e., the 95th percentile) accounted for 59% of all MEQs and the top 10 percent accounted for 76% of MEQs (Figure 1). By contrast, in 2001, the top 5 percent of individuals accounted for 55% of all MEQs and the top 10 percent of individuals accounted for 69% of all MEQs, suggesting that opioid use became more concentrated in a smaller number of users over the study period (p<0.001 for both differences; Figure 2). Compared to other opioid users, the top 10 percent of individuals in terms of opioid use were older (average age 47 vs. 41 years) and more likely to be male (46% vs. 44%; p<0.001 for both differences). Overall, 35% of patients in this top 10 percent group remained in this group throughout their duration in the sample. Overall, 0.4% of all patients were prescribed an average daily dose over 90MEQ, the CDC-recommended limit.
Figure 1 -. Distribution of Opioid Use, 2001–2013.
Figure 1 shows the percentage of total opioid utilization (measured in oral morphine equivalents) accounted for by patients in a given percentile of opioid use for each year between 2001 and 2013. For example, in 2013, the top 1 percent of individuals using a prescribed opioid (i.e., the 99th percentile in the Figure) accounted for 23 percent of total morphine equivalents, while the top 5 percent of individuals (95th percentile) accounted for 59 percent of total morphine equivalents and the top 10 percent (90th percentile) accounted for 76 percent of total morphine equivalents.
Figure 2 -. Distribution of Opioid Use by Year, 2001–2013.
Figure 2 shows the percentage of total opioid utilization (measured in oral morphine equivalents) accounted for by patients in the top 5 and top 10 percent of individuals using a prescribed opioid (in terms of oral morphine equivalents) in a given year. For example, in 2001, the top 10 percent of individuals using a prescribed opioid accounted for slightly under 70 percent of all morphine equivalents utilized that year.
Discussion.
In a sample of privately insured, cancer-free U.S. adults ages 18–64, the top 10 percent of patients accounted for the vast majority of opioid utilization. Extrapolating to the entire population of prescription opioid users in the U.S.—roughly 100 million people(7)—suggests that 10 million people account for most of US opioid use. Further research efforts aimed at characterizing this population, analyzing the incidence of opioid-related adverse events, and identifying approaches to reduce its opioid utilization may have the largest impact in lowering total population-level use, especially since opioid-related events are most common at the highest MEQs.(8) In addition, understanding the distribution of prescription opioid use in other populations not studied here (e.g. Medicare), and the distribution of opioid prescribing across physicians, is important.
Study limitations included the inability to specifically determine whether opioid use was inappropriate and the inability to differentiate between scheduled versus as-needed dosing, as well as restricting analysis to the opioids listed above.
Acknowledgements:
The authors report funding from the Office of the Director, National Institutes of Health (Dr. Jena, NIH Early Independence Award, Grant 1DP5OD017897–01), and the National Institute on Drug Abuse (Dr. Sun, K08 Award, Grant K08DA042314–01). Dr. Sun has a consulting arrangement with Egalet, Inc. unrelated to this work. Dr. Jena reports receiving consulting fees unrelated to this work from Pfizer, Inc., Hill Rom Services, Inc., Bristol Myers Squibb, Novartis Pharmaceuticals, Vertex Pharmaceuticals, and Precision Health Economics, a company providing consulting services to the life sciences industry.
Footnotes
Publisher's Disclaimer: This is the prepublication, author-produced version o f a manuscript accepted for publication in Annals of Internal Medicine. This version does not include post-acceptance editing and formatting. The American College of Physicians, the publisher of Annals of Internal Medicine, is not responsible for the content or presentation of the author-produced accepted version of the manuscript or any version that a third party derives from it. Readers who wish to access the definitive published version of this manuscript and any ancillary material related to this manuscript (e.g., correspondence, corrections, editorials, linked articles) should go to Annals.org or to the print issue in which the article appears. Those who cite this manuscript should cite the published version, as it is the official version of record.
References
- 1.Rudd RA, Aleshire N, Zibbell JE, Gladden RM. Increases in Drug and Opioid Overdose Deaths - United States, 2000–2014. MMWR. Morbidity and mortality weekly report. 2016;64(50–51):1378–82. [DOI] [PubMed] [Google Scholar]
- 2.Dowell D, Haegerich TM, Chou R. CDC Guideline for Prescribing Opioids for Chronic Pain - United States, 2016. MMWR. Recommendations and reports: Morbidity and mortality weekly report. Recommendations and reports / Centers for Disease Control. 2016;65(1):1–49. [DOI] [PubMed] [Google Scholar]
- 3.Aizcorbe A, Liebman E, Pack S, Cutler DM, Chernew ME, Rosen AB. Measuring health care costs of individuals with employer-sponsored health insurance in the U.S.: A comparison of survey and claims data. Stat J IAOS. 2012;28(1–2):43–51. [DOI] [PMC free article] [PubMed] [Google Scholar]
- 4.Paulozzi LJ, Budnitz DS, Xi Y. Increasing deaths from opioid analgesics in the United States. Pharmacoepidemiol Drug Saf 2006;15(9):618–27. [DOI] [PubMed] [Google Scholar]
- 5.Principles of Analgesic Use in the Treatment of Acute Pain and Cancer Pain, 6th edition Glenview, IL: American Pain Society; 2008. [Google Scholar]
- 6.Quan H, Li B, Couris CM, Fushimi K, Graham P, Hider P, et al. Updating and validating the Charlson comorbidity index and score for risk adjustment in hospital discharge abstracts using data from 6 countries. Am J Epidemiol 2011;173(6):676–82. [DOI] [PubMed] [Google Scholar]
- 7.Hughes A, Williams MR, Lipari RN, Bose J, Copello EA, Kroutil LA 2016;Pages https://www.samhsa.gov/data/sites/default/files/NSDUH-FFR2-2015/NSDUH-FFR2-2015.htm.
- 8.Dunn KM, Saunders KW, Rutter CM, Banta-Green CJ, Merrill JO, Sullivan MD, et al. Opioid prescriptions for chronic pain and overdose: a cohort study. Ann Intern Med 2010;152(2):85–92. [DOI] [PMC free article] [PubMed] [Google Scholar]


