Abstract
Introduction:
Biomarker computation using deep-learning often relies on a two-step process, where the deep learning algorithm segments the region of interest and then the biomarker is measured. We propose an alternative paradigm, where the biomarker is estimated directly using a regression network. We showcase this image-to-biomarker paradigm using two biomarkers: the estimation of bone mineral density (BMD) and the estimation of lung percentage of emphysema from CT scans.
Materials and methods:
We use a large database of 9,925 CT scans to train, validate and test the network for which reference standard BMD and percentage emphysema have been already computed. First, the 3D dataset is reduced to a set of canonical 2D slices where the organ of interest is visible (either spine for BMD or lungs for emphysema). This data reduction is performed using an automatic object detector. Second, The regression neural network is composed of three convolutional layers, followed by a fully connected and an output layer. The network is optimized using a momentum optimizer with an exponential decay rate, using the root mean squared error as cost function.
Results:
The Pearson correlation coefficients obtained against the reference standards are r = 0.940 (p < 0.00001) and r = 0.976 (p < 0.00001) for BMD and percentage emphysema respectively.
Conclusions:
The deep-learning regression architecture can learn biomarkers from images directly, without indicating the structures of interest. This approach simplifies the development of biomarker extraction algorithms. The proposed data reduction based on object detectors conveys enough information to compute the biomarkers of interest.
Keywords: deep learning, regression, bone mineral density, emphysema, computed tomography
1. INTRODUCTION
Deep learning has been used extensively in medical image analysis,1 replacing all previously known classifiers in applications that include those related to computer-aided detection,2,3 image segmentation4,5 and registration,6 in modalities ranging from calcium scoring in CT images7 to the analysis of histopathology slides8 or even diagnosis9,10 and prognosis.11
We propose deep learning biomarker estimation method based on a regression network where we input to algorithm images containing the structure where the biomarker is computed and output directly the biomarker value. The two chosen biomarkers to showcase the proposed regression architecture are bone mineral density (BMD) and emphysema, which are relevant to the medical community.
Osteoporosis is a common disease characterized by the loss of bone tissue, resulting in fractures that impact substantially health care costs, morbidity and mortality. Osteoporosis impact especially in regions with aging populations, such as Europe,12 and the United States, with more than 10.2 estimated subjects.13 Osteoporotic fractures due to low bone mineral density (BMD) have been increasing in the last decades.14 Early detection of osteoporosis may prevent such fractures and lower the burden of this disease,13 since cost-effective therapeutic possibilities exist.15 However, low BMD remains undiagnosed in the general population.16 BMD estimated thoracic CT scans have been shown to correlate significantly with BMD estimated on lumbar vertebrae,17 and has been suggested as a screening tool for smokers.18 To our knowledge, no study has yet evaluated the performance of a deep learning method for BMD estimation.
Emphysema is a lung disease that gradually damages the alveoli, impeding their proper functioning and reducing the lung capacity of the subject.19 Emphysema is one of the leading causes of chronic obstructive pulmonary disease (COPD), which is responsible for significant costs to health systems and is now the third leading cause of death.20 Emphysema has been traditionally quantified as the percentage of lung volume below a given threshold. This method has shown to correlate well with histopathology21 and has become the de-facto standard for emphysema quantification that is currently adopted as end-points in clinical trials.22
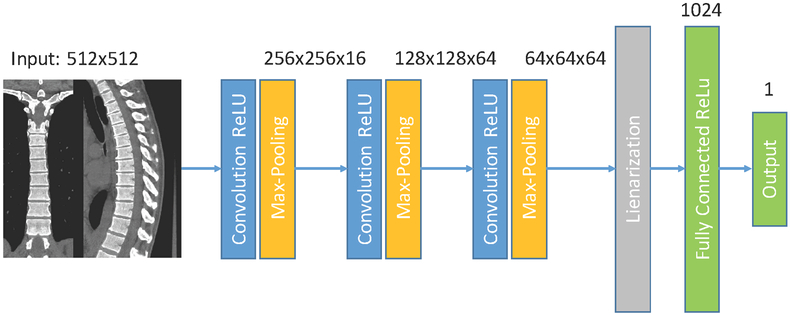
In this paper, we automate the measurement of BMD and emphysema in Chest CT scans using the deep convolutional neural network of Fig. 1. Such network inputs axial, coronal and sagittal reformatted images and outputs the biomarkers directly, without a prior segmentation or identification structures of interest. We use a large cohort consisting of 10,000 CT scans from the COPDGene study23 to train, validate and test the proposed method.
Figure 1.
Regression network used. A composite image is feed to the network, that consist of three convolutional layers followed by max-pooling operations, one fully connected layer and one output layer.
2. METHODS
2.1. Database
The COPDGene multi-center observational study has acquired CT scans of non-hispanic Caucasian and African American individuals with a history of at least 10 pack-years of smoking.23 Images were acquired with a multi-detector CT scanner with at least 16 detector channels. 9925 images of different subjects were used for this study. Each volumetric image is reconstructed with sub-millimeter slice thickness. 7,925 cases of the database are used for training the network, 1,000 cases are used for validation of the training and the selection of the network’s meta-parameters and the final 1,000 cases of the dataset are used for testing, and used only once. We report the results of those 1,000 testing cases.
The reference standard for BMD is generated using the semi-automated N-Vivo software (Image Analysis Inc., Columbia, KY). Manual quality control was performed to exclude fractured vertebrae. The lung parenchyma was segmented in 3D, and the percentage of lung voxels below a given threshold were reported as being emphysema and computed using the Chest Imaging Platform (chestimagingplatform.org).
2.2. Image pre-processing
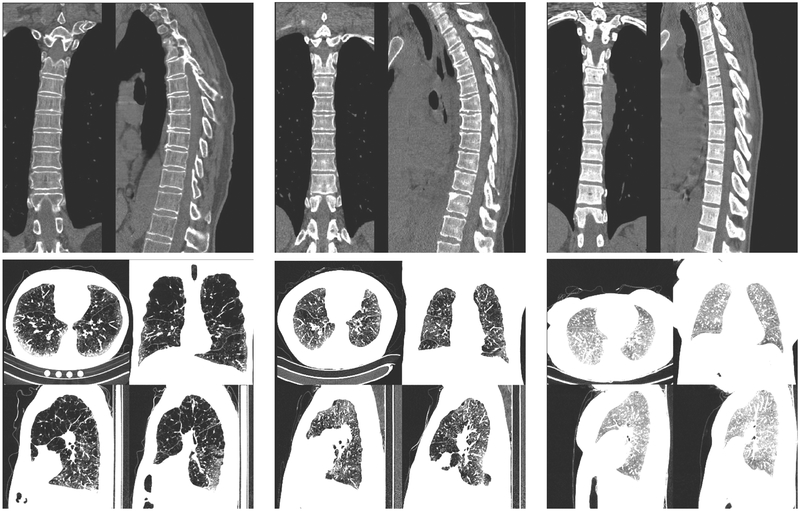
Each volumetric image is processed with an object detector trained to detect relevant structures for the biomarker that is going to be predicted. The object detector is described in24 and adapted for the relevant structures. For BMD estimation, we detect the position of the spine in coronal and sagittal planes and generate a composite image similar to those of the top row of Fig. 2. For the estimation of the percentage of emphysema we select an axial slice where the whole heart is visible, two sagittal slices at the level of the right and left hila and a coronal slice at the level of the ascending aorta, making composite images of those four views, as shown in the bottom row of Fig. 2. This image pre-processing is necessary due memory and processing power constraints of current GPUs. Each image is clamped to the range [−1024, 1500] prior to re-scaling to the range [0, 1].
Figure 2.
Six different cases used to evaluate the deep neural network. The cases expand the range of bone mineral density and emphysema present on the database. Top row: BMD montages, from left to right, the subjects have a reference BMD of 72, 150 and 290 HUs. The system estimated 68, 178 and 270 HUs respectively. Bottom row: emphysema montages. From left to right the subjects have a percentage emphysema of 55%, 25% and 1%. The estimated percentage emphysema is 55%, 19% and 0.4% respectively.
2.3. Deep Learning Architecture and Training Strategy
We use the deep learning network of Fig. 1 to estimate the biomarkers from the images mentioned above. The neural network consists of three convolutional layers followed by rectified linear activations and max-pooling operations and two fully-connected layers with also rectified linear activations, except the output layer. Filter size is set to 5 pixels. We place dropout layers prior to each fully connected layer to prevent overfitting. We set their dropout percentage to 50%. The network is optimized using a momentum optimizer with a learning rate that decays exponentially with the number of iterations. The cost function optimized is the root mean squared error. The parameters of the optimizer are chosen using the validation cases. We train for 10 epochs. The code is implemented using the TensorFlow library.25
2.4. Statistical Analysis
We estimate the linearity of the output of the network to the reference standard using the Pearson correlation coeffcient. To compare agreement among methods, we use Bland-Altman analysis. Statistical analysis is made using MedCalc software (MedCalc Software Bvba, Osten, Belgium).
3. RESULTS
3.1. Bone Mineral Density
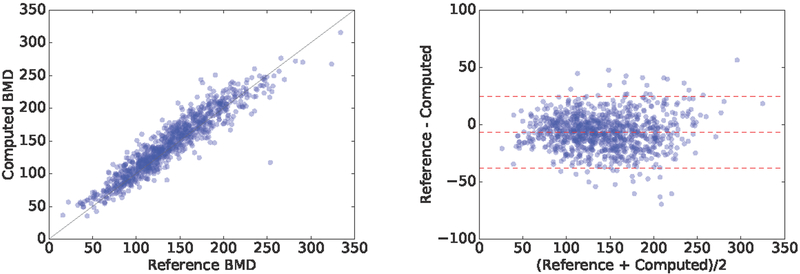
The predicted BMD showed a correlation coefficient of ρ = 0.940; 95%; CI = [0.933 − 0.947]; p < 1e − 4 with the reference standard on the 1000 test cases. Fig. 3 displays the correlation plot. A similar correlation coeffcient is present on the 1000 validation cases (ρ = 0.938; 95%CI = [0.930 − 0.945]; p < 1e − 4). The Bland-Altman plot is shown in Fig. 3. The proposed method overestimates BMD by an average of Hounsfield Units (HU). The standard deviation of the difference among measurements is σ = 15.97 HUs, and the limits of agreement are [−37.7, 24.8] HUs. Examples of the estimated values in few cases are shown in Fig. 2.
Figure 3.
Correlation and Bland-Altman plots of the computed BMD with respect to the reference standard.
3.2. Percentage of Emphysema
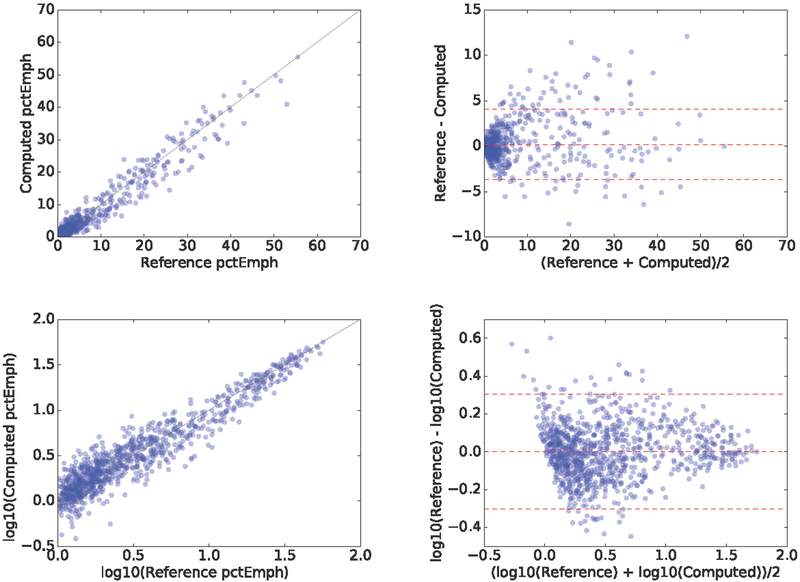
The predicted percentage emphysema had a correlation coefficient of ρ = 0.976; 95%; CI = [0.972 0.978]; p < 1e − 4 with the reference standard on the 1000 test cases, as shown in Fig. 4. Such correlation coeffcient is also present on the 1000 validation cases: ρ = 0.975; 95%CI = [0.972 − 0.978]; p < 1e − 4. The Bland-Altman plot is shown in Fig. 4. The mean difference is 0.2%, the standard deviation of the difference is 1.98 and the limits of agreement are [−3.695, 4.081]. Examples of the estimated values in few cases are shown in Fig. 2.
Figure 4.
Correlation and Bland-Altman plot of the computed emphysema percentage with respect to the reference standard in (top) natural scale and (bottom) log transformed.
We transformed the percentage emphysema measurements to log-scale in order to perform further statistical analysis, since most of the cases are centered around 5 percent units. There correlation coeffcient in log-scale between the proposed method and the reference standard is ρ = 0.938; 95%; CI = [0.930 − 0.945]; p < 1e 4, as shown in Fig. 4. In log-scale, the mean difference is 0.002, the standard deviation of the difference is 0.15 and the limits of agreement are [−0.301, 0.306].
4. DISCUSSION
In this paper, we have proposed the use of deep learning for biomarker quantification directly from 2D images obtained from 3D CT scans, without the prior segmentation of structures of interest. We have achieved strong correlations against reference standards for two use cases: the estimation of BMD measured on vertebrae in the spine (ρ = 0.940; p < 0.0001) and the estimation of percentage of emphysema measured in the lungs (ρ = 0.976; p < 0.0001), demonstrating the performance of the proposed method. The correlation coeffcients are similar between the validation and test sets, showing a good generalization of the method to unseen data.
For BMD, the standard deviation of the agreement between the proposed network and the reference standard was σ= 15.97 HUs. Such σ is lower than the variability in HUs of normal, osteopenic and osteoporotic subjects,26 showing equivalence between the methods. For percentage of emphysema, the limits of agreement measured using Bland-Altman analysis yield [−3.695, 4.081]. These 5% points are within the limits stablished in,21 where a 5 or 10 grading interval in the range [0 – 100] are proposed.
One limitation of the proposed method is the requirement of 2D fields of view of the structures where the biomarkers are computed. Ideally, one would like to regress on the whole CT scan, but it is currently unfeasible due to the limitations of current computational devices, at least at high resolutions. We have solved such issue using a standard object detector. Such object detection could be improved by using a deep learning method. Another limitation is that the CT scans acquired are non-contrast non-ECG gated thoracic CTs. It would be interesting to research how does this method perform when intravenous contrast is injected, augmenting the HUs in regions such as large vessels and the heart.
In this study we have used a very large database of subjects for training, validation and evaluation of the proposed method. A study on the dependance of the performance of the regression network based on the number of training cases used for training would be interesting, as well as to research if transfer learning could be used to learn one regressor from another one. Such tasks are left as future work.
The paradigm of image-to-biomarker directly may enable further research on large clinical datasets in other use cases. Several measurements are included in radiology reports, but the precise area of the image where they have been measured is rarely stored in the PACS systems. By leveraging a method that inputs radiology images and measurements, we could unlock such databases without the need of expensive expert annotations. We also believe that deep learning defines a holistic approach that exploits additional image content in the computation of the biomarkers beyond its established meaning, exploiting the systemic e ect of many diseases, specially in chronic conditions.
ACKNOWLEDGMENTS
This work has been funded by NIH NHLBI grants R01-HL116931 and R21HL140422. The Titan Xp used for this research was donated by the NVIDIA Corporation.
REFERENCES
- [1].Zhou K, Greenspan H, and Shen D, [Deep Learning For Medical Image Analysis], Elsevier; (2017). [Google Scholar]
- [2].Setio AA, Ciompi F, Litjens G, Gerke P, Jacobs C, van Riel SJ, Wille MM, Naqibullah M, Sanchez CI, and van Ginneken B, “Pulmonary nodule detection in ct images: False positive reduction using multi-view convolutional networks,” IEEE Trans Med Imaging 35(5), 1160–1169 (2016). [DOI] [PubMed] [Google Scholar]
- [3].Roth HR, Lu L, Liu J, Yao J, Seff A, Cherry K, Kim L, and Summers RM, “Improving computer-aided detection using convolutional neural networks and random view aggregation,” IEEE Trans Med Imaging 35(5), 1170–81 (2016). [DOI] [PMC free article] [PubMed] [Google Scholar]
- [4].Pereira S, Pinto A, Alves V, and Silva CA, “Brain tumor segmentation using convolutional neural networks in mri images,” IEEE Trans Med Imaging 35, 1240–1251 (2016). [DOI] [PubMed] [Google Scholar]
- [5].Ciresan D, Giusti A, Gambardella LM, and Schmidhuber J, “Deep neural networks segment neuronal membranes in electron microscopy images,” in [Advances in neural information processing systems], 2843–2851 (2012).
- [6].Shun M, Wang ZJ, and Rui L, “A cnn regression approach for real-time 2d/3d registration,” IEEE Trans Med Imaging 35(5), 1352–1363 (2016). [DOI] [PubMed] [Google Scholar]
- [7].Wolterink JM, Leiner T, de Vos BD, van Hamersvelt RW, Viergever MA, and Išgum I, “Automatic coronary artery calcium scoring in cardiac CT angiography using paired convolutional neural networks,” Medical Image Analysis 34, 123–136 (February 2017). [DOI] [PubMed] [Google Scholar]
- [8].Sirinukunwattana K, Ahmed Raza SE, Yee-Wah T, Snead DR, Cree IA, and Rajpoot NM, “Locality sensitive deep learning for detection and classification of nuclei in routine colon cancer histology images,” IEEE Trans Med Imaging 35(5), 1196–1206 (2016). [DOI] [PubMed] [Google Scholar]
- [9].Gulshan V and Peng L et al. , “Development and validation of a deep learning algorithm for detection of diabetic retinopathy in retinal fundus photographs,” JAMA 316(22), 2402–2410 (2016). [DOI] [PubMed] [Google Scholar]
- [10].Esteva A, Kuprel B, Novoa RA, Ko J, Swetter SM, Blau HM, and Thrun S, “Dermatologist-level classification of skin cancer with deep neural networks,” Nature 542(7639), 115–118 (2017). [DOI] [PMC free article] [PubMed] [Google Scholar]
- [11].Gonzalez G and et al. , A. S, “Disease staging and prognosis in smokers using deep learning in chest computed tomography,” American Journal of Respiratory and Critical Care Medicine 197(2), 193–203 (2018). [DOI] [PMC free article] [PubMed] [Google Scholar]
- [12].Johnell O and Kanis JA, “An estimate of the worldwide prevalence and disability associated with osteoporotic fractures,” Osteoporos Int 17(12), 1726–33 (2006). [DOI] [PubMed] [Google Scholar]
- [13].Altkorn D and Cifu AS, “Screening for osteoporosis,” JAMA 313(14), 1467–8 (2015). [DOI] [PubMed] [Google Scholar]
- [14].Sanchez-Riera L, Carnahan E, Vos T, Veerman L, Norman R, Lim SS, Hoy D, Smith E, Wilson N, Nolla JM, Chen JS, Macara M, Kamalaraj N, Li Y, Kok C, Santos-Hernandez C, and March L, “The global burden attributable to low bone mineral density,” Ann Rheum Dis 73(9), 1635–45 (2014). [DOI] [PubMed] [Google Scholar]
- [15].Kanis JA, McCloskey EV, and Johansson H et al. , “European guidance for the diagnosis and management of osteoporosis in postmenopausal women,” Osteoporos Int 24(1), 23–57 (2013). [DOI] [PMC free article] [PubMed] [Google Scholar]
- [16].Siris ES, Miller PD, Barrett-Connor E, Faulkner KG, Wehren LE, Abbott TA, Berger ML, Santora AC, and Sherwood LM, “Identification and fracture outcomes of undiagnosed low bone mineral density in postmenopausal women: results from the national osteoporosis risk assessment,” JAMA 286(22), 2815–22 (2001). [DOI] [PubMed] [Google Scholar]
- [17].Budo MJ, Hamirani YS, Gao YL, Ismaeel H, Flores FR, Child J, Carson S, Nee JN, and Mao S, “Measurement of thoracic bone mineral density with quantitative ct,” Radiology 257(2), 434–40 (2010). [DOI] [PubMed] [Google Scholar]
- [18].Jaramillo JD, Wilson C, and Stinson, et al. , “Reduced bone density and vertebral fractures in smokers. men and copd patients at increased risk,” Ann Am Thorac Soc 12(5), 648–56 (2015). [DOI] [PMC free article] [PubMed] [Google Scholar]
- [19].Dransfield MT, Washko GR, Foreman MG, Estepar RSJ, Reilly J, and Bailey WC, “Gender differences in the severity of ct emphysema in copd,” CHEST Journal 132(2), 464–470 (2007). [DOI] [PubMed] [Google Scholar]
- [20].Lozano R, Naghavi M, and Foreman K et al. , “Global and regional mortality from 235 causes of death for 20 age groups in 1990 and 2010: a systematic analysis for the global burden of disease study 2010,” Lancet 380(9859), 2095–128 (2012). [DOI] [PMC free article] [PubMed] [Google Scholar]
- [21].Thurlbeck WM and Muller NL, “Emphysema: definition, imaging, and quantification,” AJR Am J Roentgenol 163(5), 1017–25 (1994). [DOI] [PubMed] [Google Scholar]
- [22].Chapman KR, Burdon JG, Piitulainen E, Sandhaus RA, Seersholm N, Stocks JM, Stoel BC, Huang L, Yao Z, Edelman JM, McElvaney NG, and Group RTS, “Intravenous augmentation treatment and lung density in severe alpha1 antitrypsin deficiency (rapid): a randomised, double-blind, placebo-controlled trial,” Lancet 386(9991), 360–8 (2015). [DOI] [PubMed] [Google Scholar]
- [23].Regan EA, Hokanson JE, Murphy JR, Make B, Lynch DA, Beaty TH, Curran-Everett D, Silverman EK, and Crapo JD, “Genetic epidemiology of copd (copdgene) study design,” COPD 7(1), 32–43 (2010). [DOI] [PMC free article] [PubMed] [Google Scholar]
- [24].Gonzalez G, Washko GR, and Estepar RS, “Automated agatston score computation in a large dataset of non ecg-gated chest computed tomography,” Proc IEEE Int Symp Biomed Imaging 2016, 53–57 (2016). [DOI] [PMC free article] [PubMed] [Google Scholar]
- [25].Abadi M, Agarwal A, and et al. , B. P, “TensorFlow: Large-scale machine learning on heterogeneous systems,” (2015). Software available from tensorflow.org.
- [26].Schreiber JJ, Anderson PA, Rosas HG, Buchholz AL, and Au AG, “Hounsfield units for assessing bone mineral density and strength: a tool for osteoporosis management,” J Bone Joint Surg Am 93(11), 1057–63 (2011). [DOI] [PubMed] [Google Scholar]


