Abstract
During puberty, the mouse mammary gland develops into a highly branched epithelial network. Owing to the absence of exclusive stem cell markers, the location, multiplicity, dynamics and fate of mammary stem cells (MaSCs), which drive branching morphogenesis, are unknown. Here we show that morphogenesis is driven by proliferative terminal end buds that terminate or bifurcate with near equal probability, in a stochastic and time-invariant manner, leading to a heterogeneous epithelial network. We show that the majority of terminal end bud cells function as highly proliferative, lineage-committed MaSCs that are heterogeneous in their expression profile and short-term contribution to ductal extension. Yet, through cell rearrangements during terminal end bud bifurcation, each MaSC is able to contribute actively to long-term growth. Our study shows that the behaviour of MaSCs is not directly linked to a single expression profile. Instead, morphogenesis relies upon lineage-restricted heterogeneous MaSC populations that function as single equipotent pools in the long term.
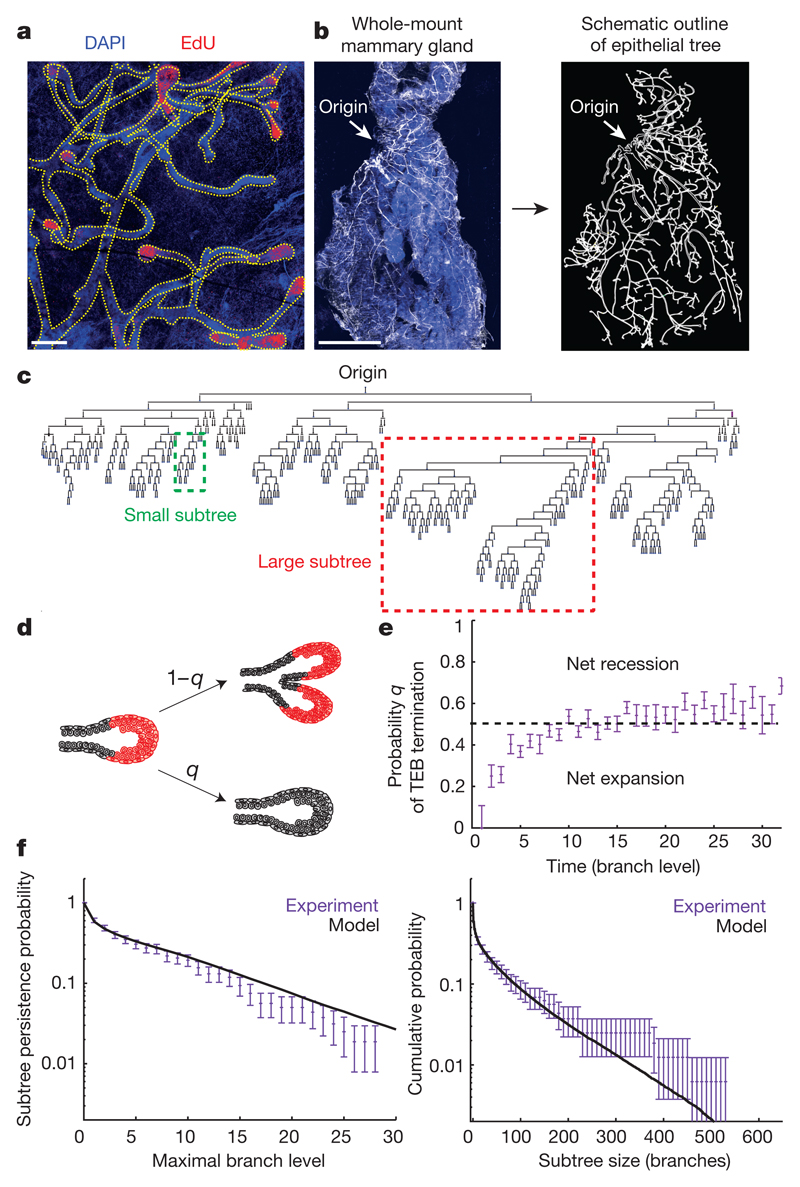
During puberty, ductal elongation is mediated by cellular proliferation at terminal end buds (TEBs)1–3 (Fig. 1a and Extended Data Fig. 1). This proliferation would quickly subside without the support of a distal self-renewing cell population, suggesting that MaSCs must reside either close to or within TEBs4,5. MaSCs have been associated with various morphologically distinct cells6–8, including cap cells that line TEBs1,2, but their true identity has yet to be defined. General markers, such as keratin 14 (K14) and keratin 8 (K8), have been used to study the basal and luminal lineages of MaSCs9–11, but could not be used to exclusively label MaSCs. Attempts to define specific markers, such as Inpp5d (also known as s-Ship), Axin2, Lgr5, and Procr, have led to ambiguous results whereby the genes were either not exclusively expressed in MaSCs or expressed by only a subset of MaSCs9–18. As MaSCs are expected to contribute throughout development, their potency, hierarchical organization and fate must be assessed by functional assays that record their behaviour over the long term. Although a great deal of work has been devoted to the regulation of branching19,20, it remains unclear how MaSCs specify the macroscopic architecture of the gland. To address these questions, we have combined unbiased genetic-lineage tracing and whole-gland mapping to identify the location and number of MaSCs, and to define quantitatively how the fate of MaSCs translates into organ structure.
Figure 1. Pubertal mammary development follows a stochastic growth pattern leading to heterogeneity in the ductal network.
a, Image of the fourth mammary gland showing proliferative cells (EdU+, red) exclusively in TEBs at 3.5 weeks of age. Blue represents nuclei (DAPI). b, Image of a whole-mount fourth mammary gland at 8 weeks of age, stained for K14 (white) and DAPI (blue) alongside its manual reconstruction. c, Reconstructed tree of the mammary gland depicted in b. d, TEBs either terminally differentiate with probability q, or bifurcate into two TEBs with probability 1 − q. e, Probabilities q inferred from reconstructions (n = 10 glands) used to predict f. f, Inter-subtree heterogeneity (data in purple from n = 10 glands) can be predicted quantitatively by a model of equipotent TEBs making stochastic decisions (black line, Supplementary Information). Left, subtree persistence, defined as the distribution of subtrees having a maximal branch level i. Right, subtree size distribution, where subtree size is defined as its total number of branches. Data are mean ± s.d. Scale bars, 300 μm (a) and 5 mm (b).
Non-stereotypical branching pattern
To define the development of the ductal epithelium at the organ scale, we isolated fourth and fifth mammary glands from mice that had reached adulthood (8 weeks) and stained them for K14. To reconstruct the ductal tree and resolve basal and luminal cell identity, we obtained organ-scale images by stitching together over 200 high-resolution Z-stacks (50 steps with a 5-μm step size) (Fig. 1b). The resulting structure of the tree was specified through ‘level indices’, defined as the number of branches between a given duct and the rudimentary tree (Extended Data Fig. 1d). In contrast to regularly branched epithelia, such as that of the lung19, the mammary gland is characterized by morphological heterogeneity20, with both large and small subtrees (Fig. 1c). This raised the question of whether the inter-subtree heterogeneity derives from the early specification of heterogeneous TEBs with defined proliferative potential, or whether mechanical or other local cues21–23 condition disparate fates of an otherwise homogenous population of TEBs.
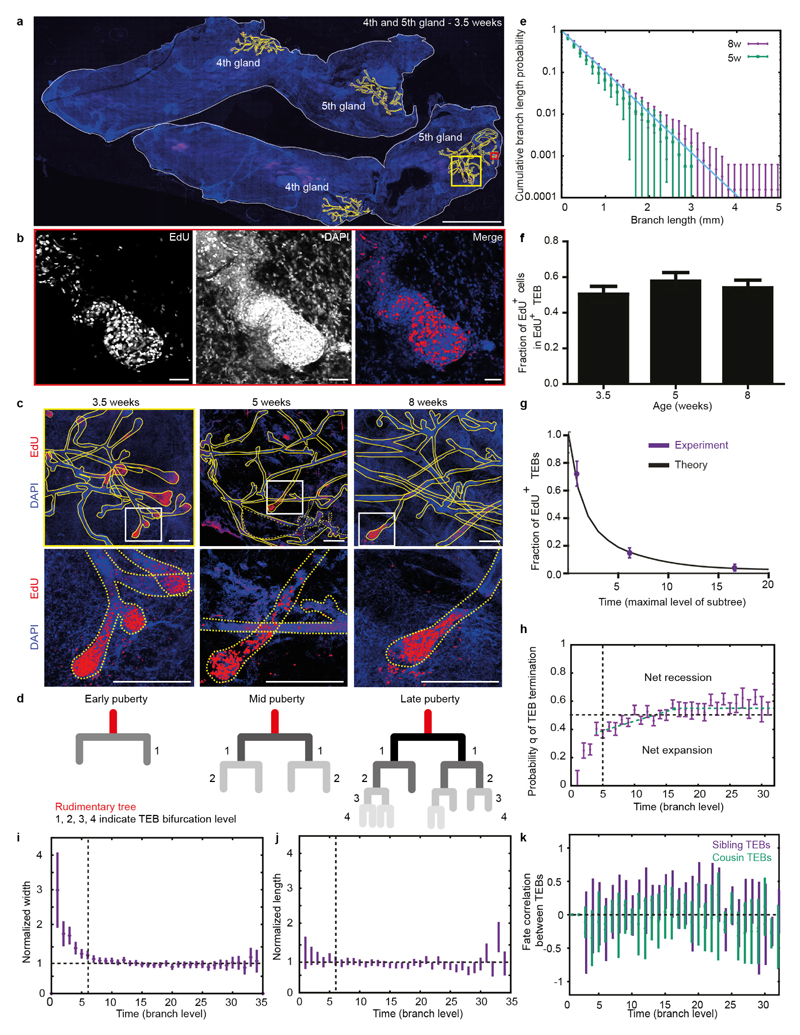
To address this question, we looked for evidence in the growth characteristics of the reconstructed ductal trees. A quantitative comparison of the branch length distributions between the ductal trees of 5-week-old and 8-week-old mice suggested that branching occurs nearly exclusively through TEB bifurcation, as opposed to side-branching from existing ducts (Extended Data Fig. 1e and Supplementary Information). EdU labelling at various stages of puberty confirmed that proliferation occurred at the TEBs but not within existing ducts, as expected for side-branching (Extended Data Fig. 1c). Proliferation did not subside gradually throughout the gland (Extended Data Fig. 1f); instead, during the course of development, an increasing number of TEBs became completely non-proliferative, while the remainder maintained their full proliferative activity until all TEBs had exited the cycle by the end of puberty (Extended Data Fig. 1g). This implies that MaSCs within each TEB act collectively to regulate either bifurcation or termination of the TEB. Indeed, analysis of the frequency of these events from the reconstructions shows that both occur randomly with nearly equal probability at any point along the ductal tree (Fig. 1d, e and Extended Data Fig. 1h). Notably, using only the average balance between TEB bifurcation and termination, we could predict quantitatively the subtree persistence (Fig. 1f), the heterogeneity of the subtree size (Fig. 1f) and the diminishing fraction of proliferative TEBs over time (Extended Data Fig. 1g and Supplementary Information). Together, these findings point to a simple design principle in which all TEBs have the same growth potential and follow a time-invariant stochastic rule throughout pubertal mammary development. Consistent with this behaviour, the average length and width of ducts remain independent of the level at which they occur throughout development (Extended Data Fig. 1i, j).
Location and number of MaSCs
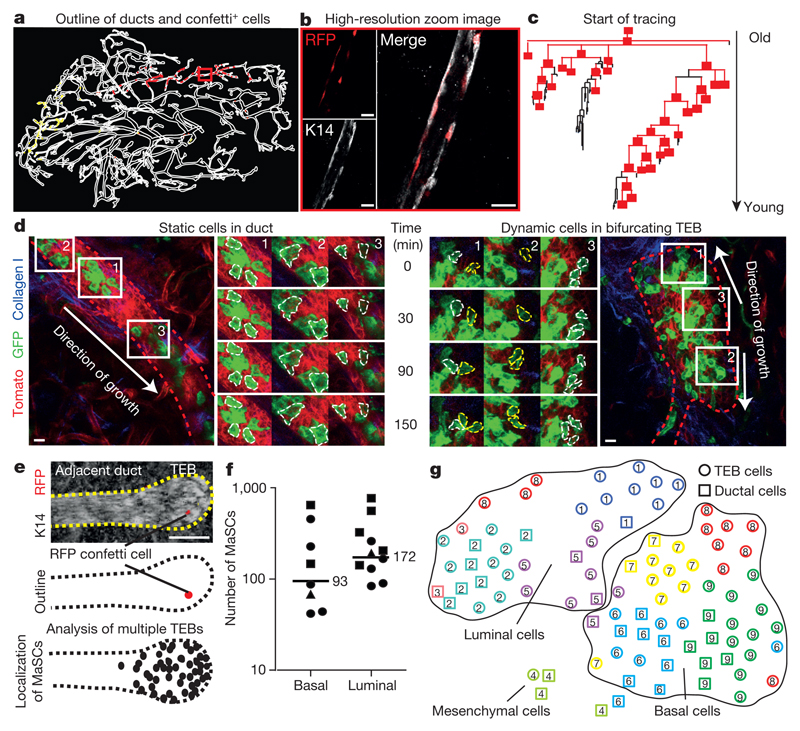
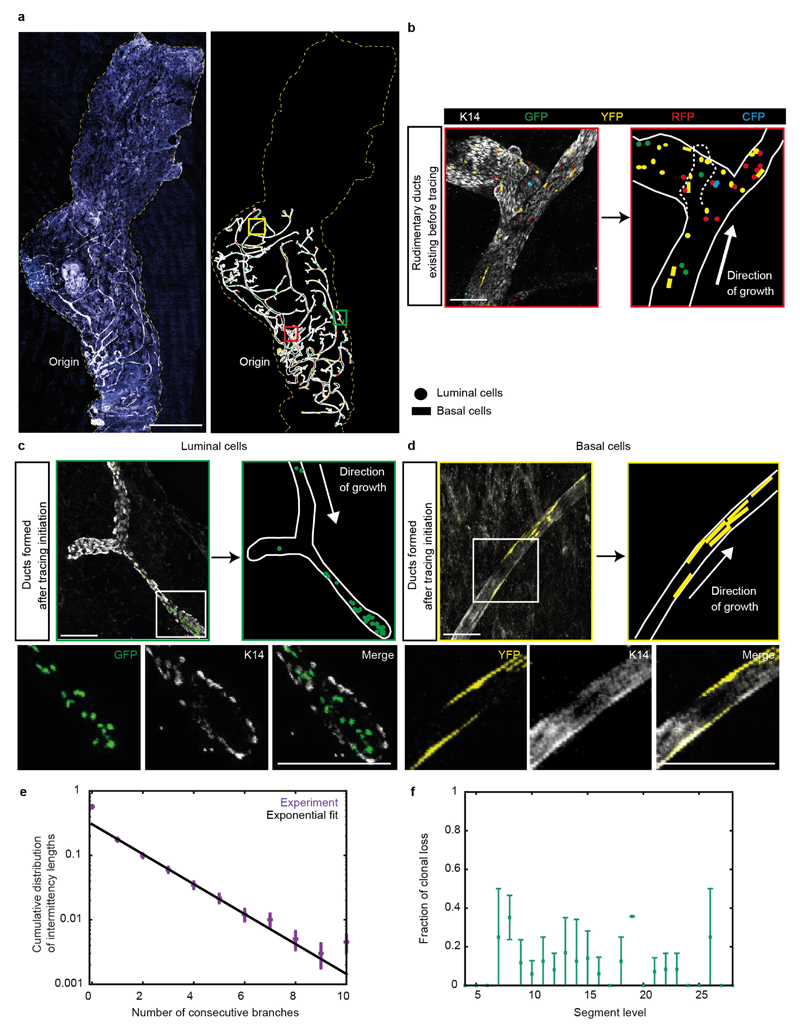
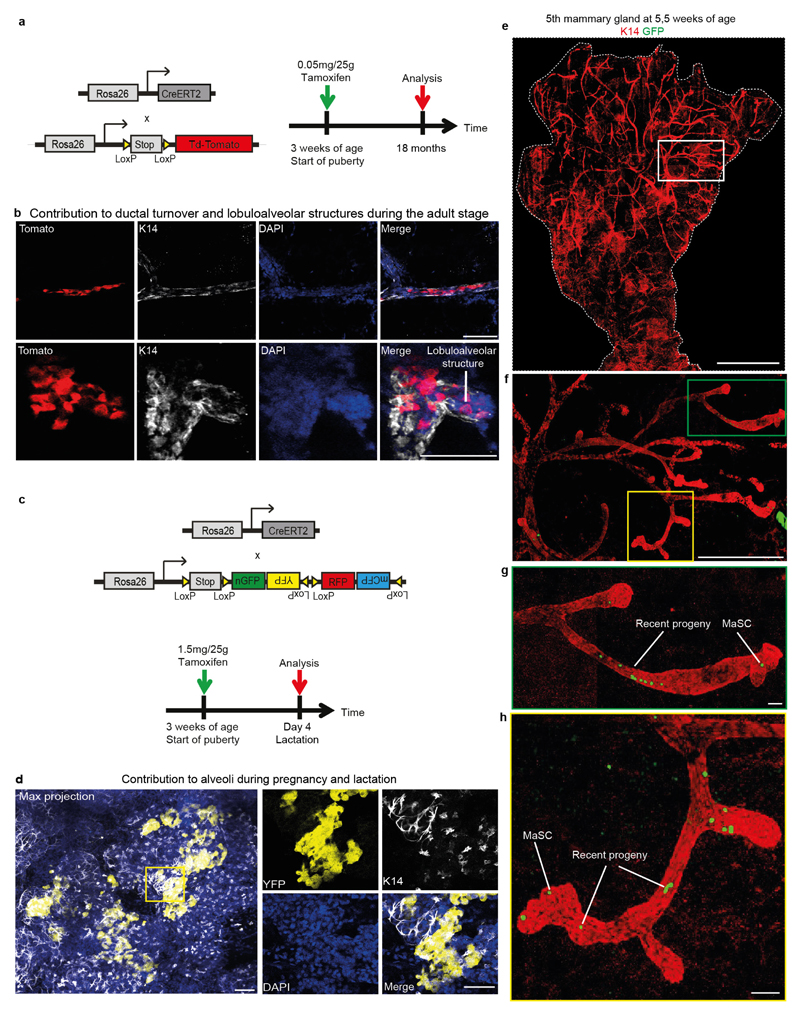
Although the organ-level analysis provides insight into the collective behaviour of MaSCs within a given TEB, it does not reveal the potency, multiplicity and fate behaviour of individual MaSCs. To characterize the behaviour of individual MaSCs, we used an unbiased clonal-lineage-tracing approach promoter using R26-CreERT2;R26-Confetti mice24 (Extended Data Fig. 2a). In these mice, expression of tamoxifen-inducible Cre (CreERT2) is driven by a ubiquitous promoter and not a stem cell promoter, since there is no consensus on markers that specifically label the MaSCs. Upon tamoxifen injection, Cre activity stochastically induces the expression of one of four confetti colours (CFP, GFP, YFP, RFP)24 in both MaSCs and more differentiated cells. Only the labelled cells with stem-cell properties will give rise to long-term clonal outgrowth. Upon injection of an ultra-low dose of tamoxifen (0.2 mg per 25 g body weight, Extended Data Fig. 2b) at the onset of puberty, a level that does not interfere with morphogenesis10,25 (Extended Data Fig. 3), Cre-mediated recombination of the confetti colour randomizer was stochastically induced in a minority of cells (<1%) present in the rudimentary ducts. Mice were euthanized either at mid-puberty (5 weeks) or on reaching adulthood (8 weeks). Whole-mount tree reconstructions revealed the presence of isolated confetti-labelled (confetti+) cells from all four confetti colours in the ducts of the rudimentary tree, consistent with the induction of non-proliferative cells (Extended Data Fig. 4a, b). At higher levels of the epithelial network, which were formed after induction, subtrees were either entirely unlabelled, or consisted of a small fraction of labelled cells bearing only a single confetti colour from either the luminal or basal lineage, but not both (Fig. 2a, b and Extended Data Fig. 4c, d). Since the labelling density was extremely low (only one in three glands was labelled; n = 36 glands), we reasoned that each clone must have originated from a single founder cell. Moreover, as these cells contribute during the entire course of pubertal ductal development (Fig. 2c), we concluded that the founder cell must belong to the self-renewing MaSC pool. Notably, longer-term tracings showed that clones derived from the same assay could contribute to the various stages of remodelling in adulthood, including the oestrous-cycle-driven formation of small lobuloalveolar structures and the pregnancy-driven formation of secretory alveoli (Extended Data Fig. 5a–d).
Figure 2. Number, localization and molecular characterization of pubertal MaSCs.
a, Reconstruction of a whole-mount fifth mammary gland. b, Enlarged image of the red boxed area in a showing part of an RFP+ basal clone. c, Schematic representation of the RFP+ basal clone depicted in a from the start of tracing until the most recently formed ducts. Branches containing at least one RFP+ cell are red and branches without any labelled cells are black. d, Intravital image of a 5-week-old duct (left) or a TEB (right) in the fourth gland of a R26-CreERT2;R26-mTmG mouse. Epithelium is outlined with red dashed line. Enlarged images show migration (cells outlined with white dashed line) or proliferation (cells outlined with yellow dashed line) over time (Supplementary Video). e, Top and middle images are examples of the original image and outline of a TEB and adjacent ductal region containing an RFP+ MaSC. Bottom image shows an average-sized schematic TEB (black dashed line) in which each dot represents the localization of a labelled MaSC in a different TEB (n = 47). f, Quantification of the number of functional MaSCs, based on the labelling density for both the basal and luminal cell lineages. Data points represent different clones and symbols represent different mice (n = 3). g, A t-distributed stochastic neighbour embedding (t-SNE) map of transcriptome similarities between individual ductal and TEB cells isolated from a 5-week-old mammary gland. Clusters with similar transcriptional programs are highlighted with the same numbers and colours. Scale bar, 10 μm (b, d) and 100 μm (e).
To quantify the short-term dynamics of clonally labelled cells, we induced a red-to-green switch at a clonal density in the mammary glands of R26-CreERT2;R26-mTmG mice at the onset of puberty. After two weeks of tracing, we imaged in living mice mammary glands at high resolution for 150 min. In line with EdU labelling (Fig. 1a and Extended Data Fig. 1), intravital imaging revealed that, in contrast to the dynamic and proliferative TEB cells, ductal cells do not actively proliferate or migrate (n = 3 mice, 17 TEBs, 12 ducts) (Fig. 2d and Supplementary Video). Consistent with this observation, the size of labelled ductal cell clusters deposited at 3–5 weeks was identical to that found at 3–8 weeks (Extended Data Fig. 2c–f). Together, these findings imply that labelled ductal cells provide a ‘frozen’ record of MaSC fate once they are deposited, and that spatial information can be translated into temporal information on the past behaviour of MaSCs.
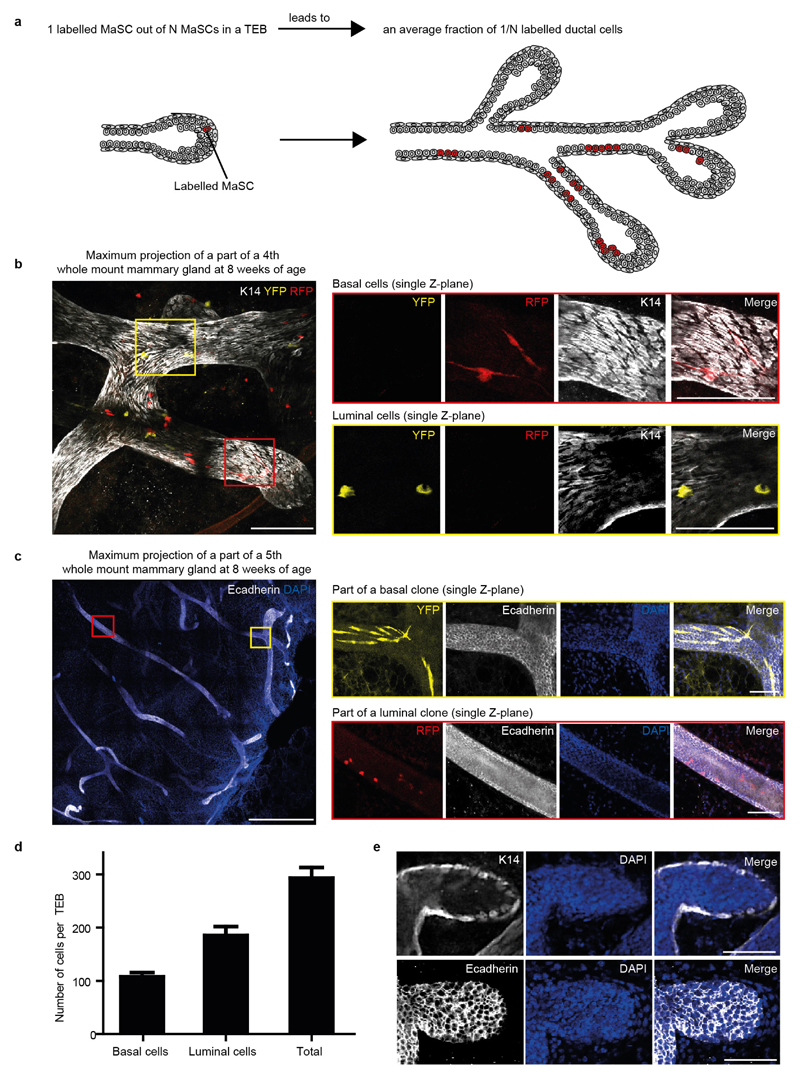
Using this strategy, we sought to define the location of MaSCs. In mid-puberty glands, we scored the position of single confetti+ cells localized either in the TEBs or the immediate ductal region (Fig. 2e and Extended Data Fig. 5e–h). All singly isolated confetti+ cells were localized within the TEB (Fig. 2e) and, since these cells had given rise to confetti+ cells in previously formed ducts, we concluded that these must be MaSCs. To determine the fraction of cells in the TEB that were MaSCs, we analysed subtrees in clonally labelled glands. At clonal density labelling, we reasoned that, in the TEBs where tracing was initiated, only one out of the total number N of MaSCs was confetti-labelled so that, in the ductal tree that was grown afterwards, only a fraction of ductal cells (an average of 1/N) should become labelled with a confetti colour (Extended Data Fig. 6a). By analysing this fraction based on K14 and E-cadherin staining of whole-mount mammary glands (Extended Data Fig. 6b, c), we inferred an estimate of 170 ± 30 (mean ± s.e.m.) luminal MaSCs and 90 ± 30 (mean ± s.e.m.) basal MaSCs per TEB (Fig. 2f). Since these values equate to the approximate total number of luminal and basal cells present in a TEB, respectively (Extended Data Fig. 6d, e), this suggests that most TEB cells function as basally or luminally committed MaSCs.
Molecular characterization of MaSCs
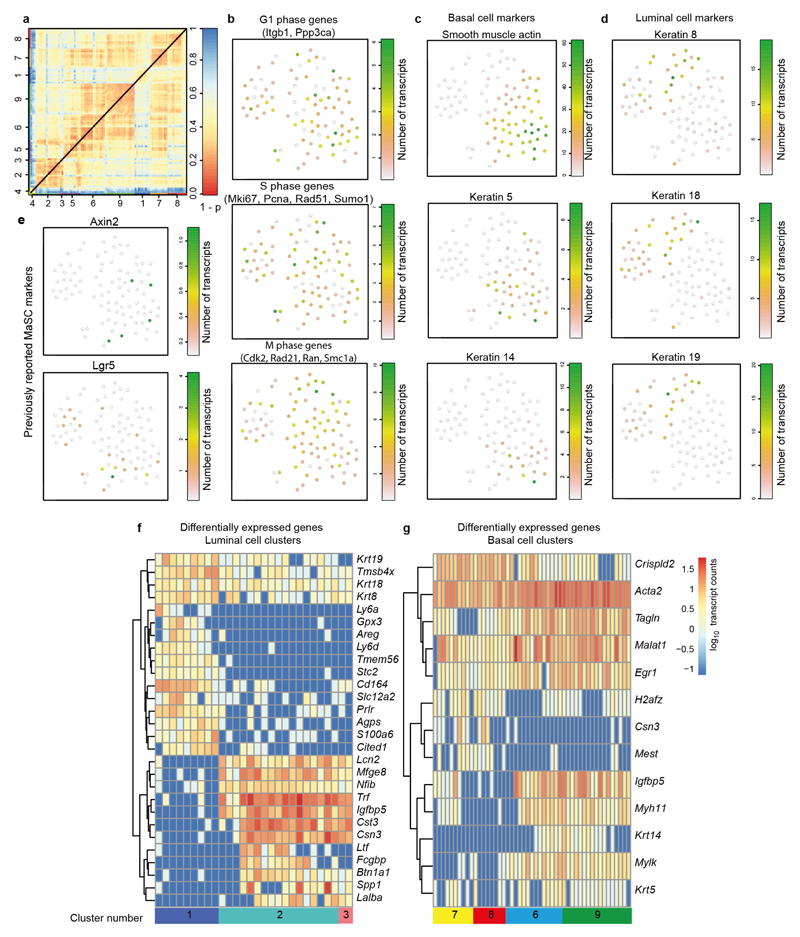
Having identified functionally the location and number of MaSCs, we next aimed to define their molecular signature by single-cell mRNA sequencing. Individual ducts and proliferative TEBs were micro-dissected from 5-week-old MMTV-Cre;R26-loxP-stop-loxP-YFP mice and epithelial cells were sorted by isolating Lin−(CD45−CD31−CD140a−) YFP+ cells using flow cytometry. Since epithelial cells may not be labelled equally in this model, a slight bias towards high YFP expression could not be avoided. Using the StemID algorithm26, we computationally identified nine clusters of cells (n = 91 cells, Fig. 2g, Extended Data Fig. 7a, and Supplementary Table 1). The absence of correlation between cell-cycle genes and cell clusters showed that they were not associated with distinct cell-cycle states (Extended Data Fig. 7b). On the basis of expression of canonical basal cells markers such as K5, K14 and smooth muscle actin, and luminal markers, such as K8, K8, and K19, we could assign clusters to the luminal or basal lineage (Fig. 2g and Extended Data Fig. 7c, d). Previously described MaSC markers, such as Axin2 and Lgr5, were expressed at a low level and detected at random in multiple clusters in both ductal and TEB cells (Extended Data Fig. 7e). Despite our finding that the majority of basal and luminal TEB cells function as MaSCs, differential gene-expression profiling of the clusters suggested that both luminal and basal MaSCs can vary in their transcriptional program (Fig. 2g and Extended Data Fig. 7f, g). For example, Csn3 and Cst3, which are involved in milk production27, are more highly expressed in luminal clusters 2 and 3 than in luminal cluster 1 (Extended Data Fig. 7f). Similarly, Myh11 and Mylk, which are involved in contractile activity28, are more highly expressed in basal clusters 6 and 9 than in basal clusters 7 and 8 (Extended Data Fig. 7g). Together, these observations led us to question whether the various transcriptional programs observed are reflective of a spectrum of primed MaSC states within the TEB.
Short-term functional MaSC heterogeneity
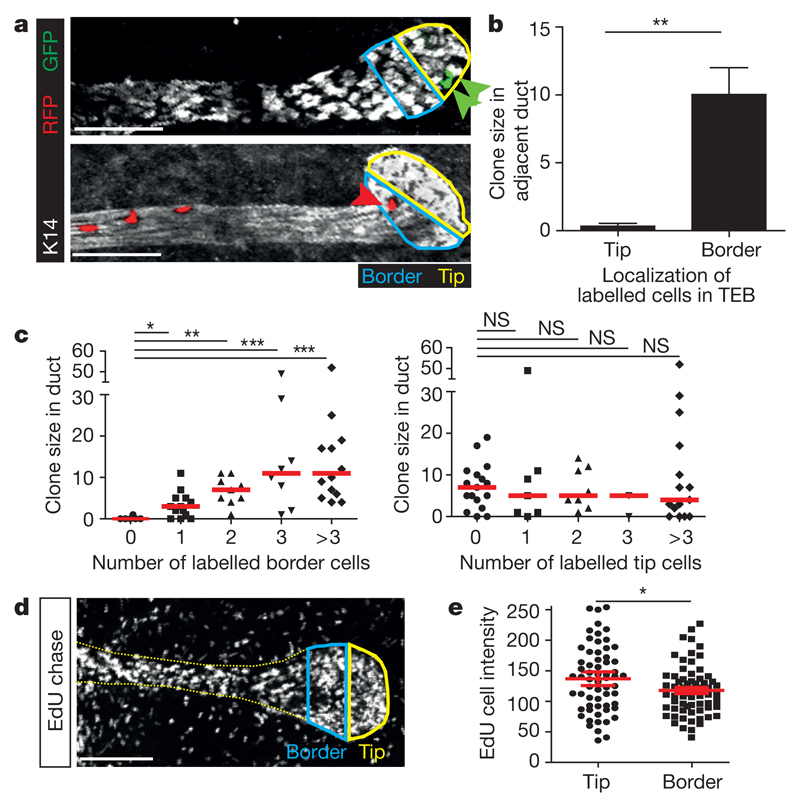
To test whether the molecular heterogeneity of MaSCs might translate to functional heterogeneity, we analysed the short-term capacity of single confetti+ MaSCs to contribute to ductal growth in mid-puberty glands by analysing the size of the subclone in the adjacent duct (Fig. 3a). We found that only single confetti+ MaSCs localized at the border of the TEB (but not at the tip) contributed to the growth of the adjacent duct (Fig. 3b). Consistently, the number of confetti+ cells in the adjacent duct correlated with the number of similarly labelled confetti+ MaSCs at the border of the TEB (but not at the tip) (Fig. 3c). Notably, this spatial advantage of border over tip MaSCs to contribute to ductal expansion is not caused by differences in proliferative activity, since the EdU labelling intensity following a three-day chase was diluted by cell division to a similar degree in both regions (Fig. 3d, e). These results suggest an organization of MaSCs in the TEB that mirrors that of adult stem cells in the intestinal crypt29. In both cases, cells positioned at the border of the niche experience a short-term bias towards differentiation, whereas cells at the base are primed for renewal30. From this short-term positional bias, we expect ‘intermittency’ in the ductal clonal record. Consistently, reconstruction of clones across multiple branch levels showed that MaSCs could cease contributing to ductal expansion over extended periods (Extended Data Fig. 4e, f and Supplementary Information). However, we cannot rule out the alternative possibility that these interruptions could be caused by a small population of cells (<5–10%) that move in and out of quiescence.
Figure 3. Border (but not tip) MaSCs contribute to ductal extension in the short term.
a, Representative images of TEBs and the adjacent ductal region in a fifth mammary gland at 5 weeks of age containing confetti+ tip MaSCs (GFP, upper panel) or confetti+ border MaSCs (RFP, lower panel). b, Quantification of clone size in ducts adjacent to TEBs containing either confetti+ tip MaSCs (tip, n = 7 TEBs from three mice) or confetti+ border MaSCs (border, n = 14 TEBs from three mice). P = 0.0002 (Welch’s t-test). c, Quantification of confetti clone size in the ductal region adjacent to TEBs related to the number of confetti+ border MaSCs (left) or the number of confetti+ tip MaSCs (right). *P < 0.05, **P < 0.01, ***P < 0.001 (Mann–Whitney test). d, Representative image showing EdU-labelling in a TEB and adjacent ductal region after a 3 day EdU pulse-chase. e, Quantification of EdU-labelling intensity in the tip and border region of TEBs. P = 0.03 (two-tailed t-test). Data are mean ± s.e.m. Scale bars (a, d), 100 μm.
Long-term equipotency due to MaSC mixing
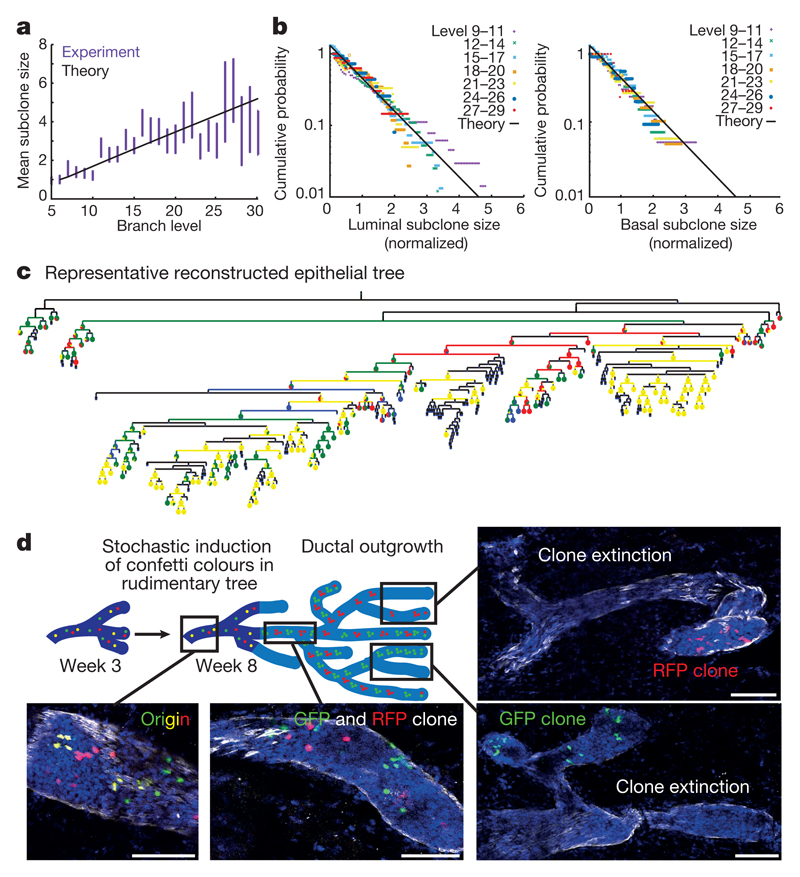
To determine whether the short-term bias of border cells to contribute to ductal expansion reflects long-term differences in MaSC potential, we analysed the evolution of subclone sizes (defined as the density of lineage-labelled cells in a given branch) as a function of the level index (which serves as proxy for time) (Fig. 4a). If fate bias persists in the long term, only a few clones would be expected to grow large and the subclone size distribution would change over time. To our surprise, the distribution of subclone sizes, when rescaled to the average, was equivalent at all branch levels and consistently well fit by an exponential (Fig. 4b and Extended Data Fig. 2g). Such ‘scaling’ behaviour is a hallmark of neutral dynamics and shows that, in the long term, MaSCs function as an equipotent pool (Supplementary Information).
Figure 4. Pubertal mammary gland development is driven by equipotent pools of MaSCs.
a, Normalized mean subclone size as a function of branch level. Subclone sizes were normalized by their initial value (at segment level 6). The black line represents the outcome of the theoretical model in which cells completely mix upon bifurcation (Supplementary Information). n = 606 subclones from four mice, data are mean ± s.e.m. b, Clone size distributions for luminal (left) and basal (right) clones at successive branch levels, in log scale, each rescaled by the average clone size. The data displays scaling, collapsing onto an exponential dependence (black line) as predicted for an equipotent population. c, Whole-gland reconstruction of the fourth mammary gland depicted in Extended Data Fig. 9, with the fraction of confetti colours present in branches represented as pie charts for each level. d, Representative images of ducts and TEBs from different areas of the fourth mammary gland depicted in Extended Data Fig. 9. RFP+ cells in red, GFP+ cells in green and DAPI in blue. Scale bars, 100 μm.
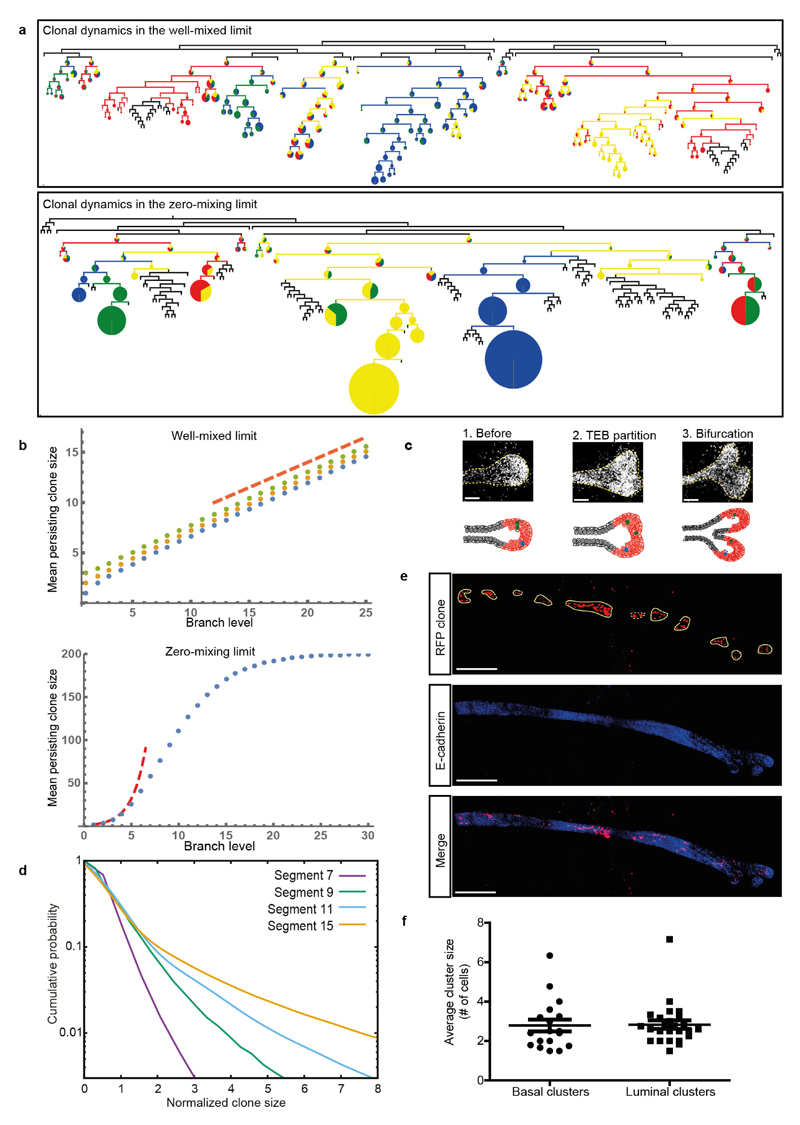
To understand how the functional short-term heterogeneity of MaSCs can resolve into homogenous long-term behaviour, we used a modelling approach to predict the dynamics of MaSC clones during TEB bifurcation. Our analysis showed that, during the repetitive process of TEB bifurcation and ductal elongation, MaSCs are randomly segregated, leading to a drift in subclone size within TEBs until subclones become either lost or ‘fixed’ (Fig. 4c and Extended Data Fig. 8a). To challenge the model, we tested whether it could predict the fate of multiple differentially coloured MaSCs following serial rounds of branching. In 3-week-old mice, we induced the expression of confetti colours at a slightly higher density (1.5 mg tamoxifen per 25 g body weight), which still does not influence branching morphogenesis (Extended Data Fig. 3); this resulted in mosaic differential colour-labelling of two or three independent MaSCs per TEB. Consistent with the model outlined, we found that ducts formed soon after labelling with confetti exhibited a mixture of different colours, whereas ducts produced late in development became either single-coloured or devoid of any confetti+ cells (Fig. 4d and Extended Data Figs 8a, 9). Moreover, the average number of labelled cells per duct in both basal and luminal clones increased linearly as a function of branch level, as predicted by a ‘well-mixed’ model, in which MaSCs are randomly segregated during bifurcation, independent of their relative position within the TEB (Fig. 4a, Extended Data Fig. 8b–d and Supplementary Information). Crucially, the labelled cell fraction remained approximately constant over time (that is, the branch level) post-induction (Extended Data Fig. 2c), confirming quantitatively the representativeness of labelling throughout pubertal growth. These features were also observed in the tracings from weeks 3–5 and 5–8 (Extended Data Fig. 2e, f). Finally, we imaged TEB extension and confirmed that cells do indeed mix and exchange position in TEBs during the growth phase (Fig. 2d and Supplementary Video). Together, these results explain how heterogeneous populations of lineage-restricted basal and luminal MaSCs can function as long-term homogeneous equipotent pools.
Finally, in line with previous observations15, we noticed that the offspring of labelled MaSCs do not form a continuous stream, but exhibit a clustered pattern (Extended Data Fig. 8e), and that the sizes of the clusters from basal and luminal lineages were the same (Extended Data Fig. 8f). Together with the observation that the ratio of basal to luminal MaSCs reflects the ratio of basal to luminal cells deposited in the duct (Fig. 2e and Extended Data Fig. 2h), this suggests that individual luminal and basal MaSCs have the same potential to produce daughter cells with limited proliferative capacity, resulting in cluster formation (Extended Data Fig. 8f).
Discussion
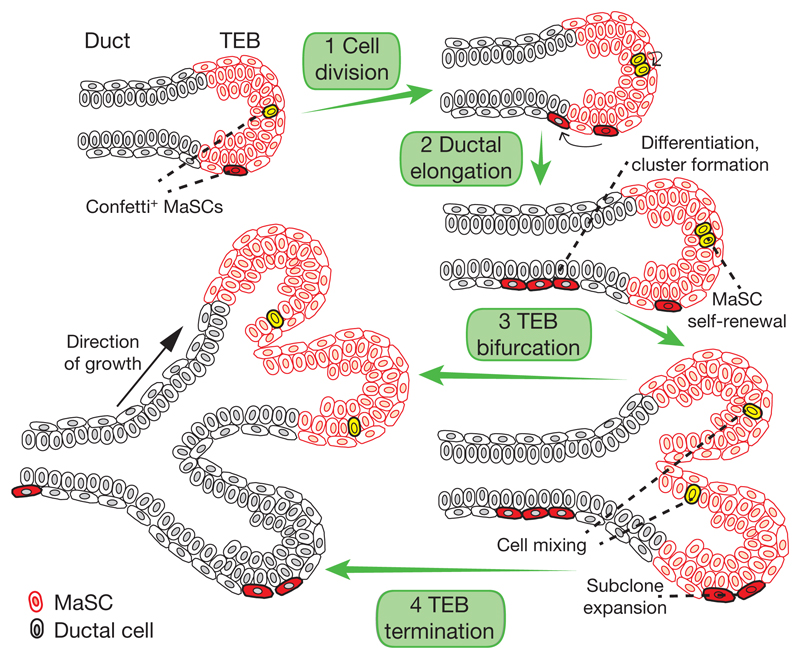
On the basis of our findings, we propose a model of mammary morphogenesis in which lineage-restricted pools of MaSCs remain at the travelling TEBs, leaving behind daughter cells (Fig. 5). Although only MaSCs positioned at the border of the TEB contribute transiently to ductal expansion, cell rearrangements during TEB bifurcation allow positional biases to be reassigned, resulting in the long-term equipotency of MaSC pools. Whether transcriptional heterogeneity is a manifestation of evolving positional biases or a signature of discrete MaSC subpopulations in the luminal and basal compartments remains an open question. This study is notable as it emphasizes that the behaviour and even the identity of stem cells cannot be linked directly to a single molecular profile or specific markers, but must be defined functionally.
Figure 5. Model of pubertal mammary ductal growth dynamics.
Cartoon depicting the proposed model of pubertal mammary ductal outgrowth. (1) Highly proliferative MaSCs are located in the TEB. (2) Progeny of border MaSCs are left behind as the TEB is pushed forward owing to proliferation. Early ductal cells lose self-renewal potential and undergo a limited number of cell divisions before exiting the cycle (forming a cluster). (3) During TEB bifurcation, MaSCs become randomly mixed, expanded and segregated between daughter TEBs, leading to subclonal enrichment and extinction. (4) Following TEB bifurcation, a fraction of TEBs terminate, while the remainder stay in the cycle, undergoing further rounds of branching and elongation.
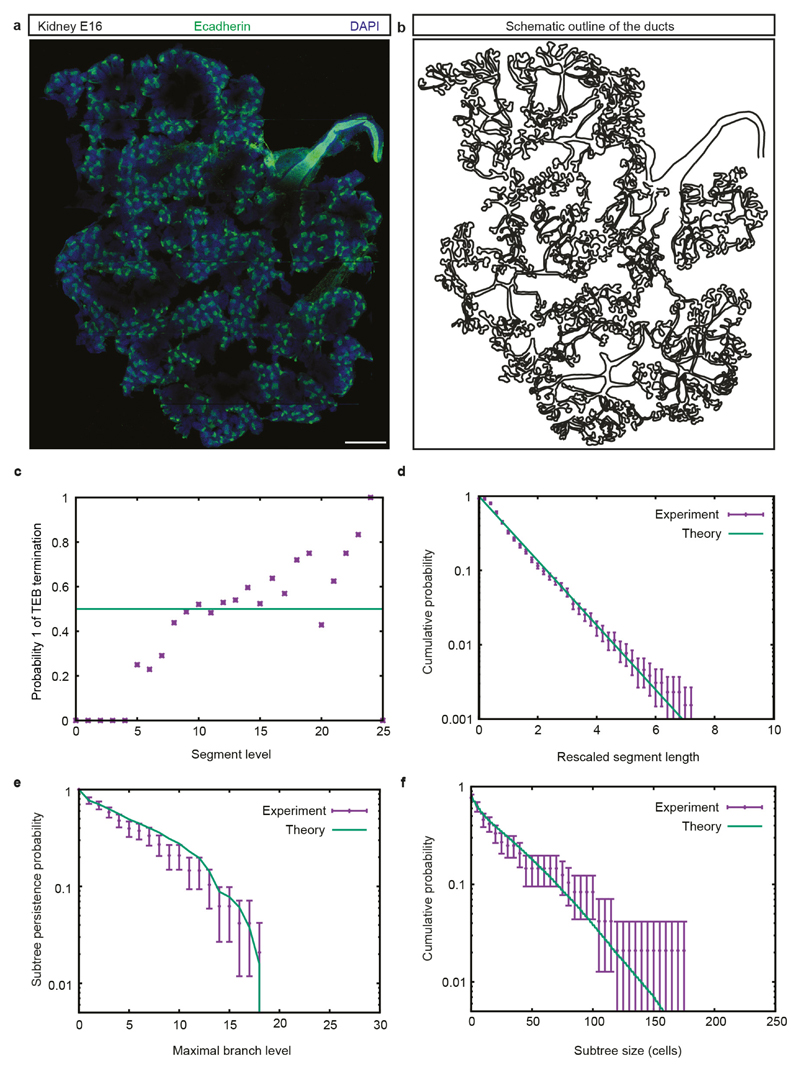
At the organ scale, our studies show that MaSCs act cooperatively to regulate their proliferative activity within individual TEBs, with TEB branching and TEB termination occurring stochastically with nearly equal probability, leading to network heterogeneity. Although the mechanisms that regulate balance remain undefined, other ductal tissues may conform to the same growth characteristic. Analysis of the embryonic-day-16 murine kidney shows that its complex network topology can be explained by the same model paradigm (Extended Data Fig. 10), suggesting that the underlying mechanism of branching morphogenesis may be conserved.
Methods
Mice
All mice were females from a mixed background, housed under standard laboratory conditions, and received food and water ad libitum. All experiments were performed in accordance with the guidelines of the Animal Welfare Committee of the Royal Netherlands Academy of Arts and Sciences, The Netherlands. R26-Confetti;R26-CreERT2, R26-TdTomato;R26-CreERT2, and R26-mTmG;R26-CreERT2 mice were injected intraperitoneally with tamoxifen (Sigma Aldrich), diluted in sunflower oil, to activate Cre recombinase at 3 weeks of age. To achieve clonal density labelling (< 1 MaSC per duct), R26-Confetti mice were injected with 0.2 mg tamoxifen per 25 g body weight. To label multiple MaSCs per TEB, R26-Confetti mice were injected with 1.5 mg/25 g at 3 weeks. The clonal dose for R26-mTmG and R26-TdTomato reporter mice was 0.2 mg tamoxifen per 25 g body weight and 0.05 mg/25 g tamoxifen, respectively. Lineage-traced mice were euthanized at mid-puberty (5 weeks of age) or at the end of puberty (8 weeks of age) and mammary glands were collected. Experiments were not randomized, sample size was not determined a priori, and investigators were not blinded to experimental conditions except where indicated.
Whole-mount imaging of mammary glands
Imaging of whole-mount mammary glands was performed using a Leica TCS SP5 confocal microscope, equipped with a 405 nm laser, an argon laser, a DPSS 561 nm laser and a HeNe 633 nm laser. Different fluorophores were excited as follows: DAPI at 405 nm, CFP at 458 nm, GFP at 488 nm, YFP at 514 nm, RFP at 561 nm and Alexa-647 at 633 nm. DAPI was collected at 440–470 nm, CFP at 470–485 nm, GFP at 495–510 nm, YFP at 540–570 nm, RFP at 610–640 nm and Alexa-647 at 650–700 nm. All images were acquired with a 20× (HCX IRAPO N.A. 0.70 WD 0.5 mm) dry objective using a Z-step size of 5 μm (total Z-stack around 200 μm). All pictures were processed using ImageJ software (https://imagej.nih.gov/ij/).
Quantitative data analysis
Quantitative analysis of the whole-gland reconstructions induced with 0.2 mg tamoxifen per 25 g body weight was performed on 36 glands from nine mice at 8 weeks of age. We counted 11 luminal and 8 basal clones in subtrees starting from level 6. Quantitative analysis of the whole-gland reconstructions induced with 1.5 mg tamoxifen per 25 g body weight was performed for 10 glands from five mice at 8 weeks of age, 5 glands from three mice at 5 weeks of age, and 3 glands from two mice at 8 weeks of age (traced from 5 weeks of age). Clonal analysis and modelling were based on 606 subclones (157 basal subclones and 449 luminal subclones) from four glands from mice at 8 weeks of age. Data were collected at random and all glands induced at a clonal level were included. Subclones were defined as the density of epithelial cells of the same type (basal or luminal) and confetti colour in a given branch of a given level. Although our theoretical description models the distribution of the number of MaSCs in a TEB of level l, as we cannot access this quantity directly experimentally, we use as a proxy the density of labelled cells of a given type and confetti colour in the corresponding branch of level l (that is, the branch that was formed by the TEB considered in the model). Taking the density instead of the absolute number of labelled cells allowed us to correct for the stochastic variation of branch length that we observed (Extended Data Fig. 1e).
Whole-mount immunofluorescence staining of mammary glands
The fourth and fifth mammary glands were dissected and incubated in a mixture of collagenase I (1 mg/ml, Roche Diagnostics) and hyaluronidase (50μg/ml, Sigma Aldrich) at 37°C for optical clearance, fixed in periodate–lysine–paraformaldehyde (PLP) buffer (1% paraformaldehyde (PFA; Electron Microscopy Science), 0.01M sodium periodate, 0.075 M l-lysine and 0.0375 M P-buffer (0.081 M Na2HPO4 and 0.019M NaH2PO4; pH 7.4) for 2 h at room temperature, and incubated for 2 h in blocking buffer containing 1% bovine serum albumin (Roche Diagnostics), 5% normal goat serum (Monosan) and 0.8% Triton X-100 (Sigma-Aldrich) in PBS. Primary antibodies were diluted in blocking buffer and incubated overnight at room temperature. Secondary antibodies diluted in blocking buffer were incubated for at least 4 h. Nuclei were stained with DAPI (0.1μg/ml; Sigma-Aldrich) in PBS. Glands were washed with PBS and mounted on a microscopy slide with Vectashield hard set (H-1400, Vector Laboratories). Primary antibodies: anti-K14 (rabbit, Covance, PRB155P, 1:700) or anti-E-cadherin (rat, eBioscience, 14-3249-82, 1:700). Secondary antibodies: goat anti-rabbit or goat anti-rat, both conjugated to Alexa-647 (Life Technologies, A21245 and A21247 respectively, 1:400). For 5-ethynyl-2-deoxyuridine (EdU) cell-proliferation staining of whole-mount mammary glands, a click-it stain (Click-iT EdU, Invitrogen) was performed according to the manufacturer’s instructions before staining with primary antibodies as described above.
Whole-mount immunofluorescence staining of embryonic kidney
Kidneys were dissected from embryos at embryonic day 16, fixed in PLP buffer overnight at 4 °C, and incubated for 4 h in blocking buffer containing 1% bovine serum albumin (Roche Diagnostics), 5% normal goat serum (Monosan) and 0.8% Triton X-100 (Sigma-Aldrich) in PBS. Primary antibodies were diluted in blocking buffer and incubated overnight at room temperature. Secondary antibodies diluted in blocking buffer were incubated for at least 6 h. Nuclei were stained with DAPI (0.1 μg/ml; Sigma-Aldrich) in PBS.
EdU incorporation experiments
3.5-, 5- or 8-week-old mice (n = 3 mice for each age) were injected intraperitoneally with 0.5 mg EdU (Invitrogen) diluted in PBS. For the EdU pulse-chase experiments, EdU (0.5 mg) was injected intraperitoneally in 4-week-old mice (n = 3). Mice were euthanized 4 or 72 h after EdU injection and the fourth and fifth mammary glands were collected and processed as whole-mount glands. For analysis, 3D tile-scan images of the whole-mount glands were taken and the number of EdU+ TEBs was scored. For the quantification of the fraction of EdU+ cells, 10 EdU+ TEBs per time point were selected in a blinded manner and the number of EdU+ cells was counted manually for each selected TEB. For the pulse-chase experiment, 3 EdU+ TEBs per mouse were selected in a blinded manner and the intensity of 10 randomly picked EdU+ cells was measured for both the tip and the border area of the selected TEB and a two-tailed t-test was performed. Normal distribution was confirmed using a d’Agostino and Pearson omnibus normality test. The variance between the groups was tested with an F-test and was found to be not significantly different.
Analysis of whole-mount imaged mammary glands and embryonic kidney
Three-dimensional tile-scan images of whole-mount mammary glands and embryonic kidneys were used to manually reconstruct the ductal network by outlining the ducts. Labelled confetti cells were annotated in the schematic outline of the mammary tree, including information on the confetti colour for the mammary glands (GFP, green; YFP, yellow; RPF, red; and CFP, cyan). Using custom-made. NET software (available upon request from J.v.R.), the length and width of all the ducts, the coordinates of the branch points, and the position of the labelled cells in ducts and in TEBs were scored in these schematic outline images, which was used as input for a schematic representation of the lineage tree. Custom-made Python software (available upon request from E.H.) and the ETE2 python toolkit were used for the conversion and visualization of the schematic mammary gland lineage tree, including linkage between branches, their respective length and number of cells of each confetti colour. To depict the topology of the resulting tree, the Newick format was used to represent hierarchical structures using nested parentheses to encode information about the linkage between branches, their respective length and number of cells of each confetti colour. The origin of the gland was always located at the top of the reconstruction.
Intravital imaging of the mammary glands
R26-CreERT2;R26-mTmG mice were intraperitoneally injected with 0.2 mg tamoxifen per 25 g body weight diluted in sunflower oil (Sigma) at 3 weeks of age. At 5 weeks of age, a mammary window was inserted near the fourth and fifth mammary glands (for details, see ref. 31). Mice were anaesthetized using isoflurane (1.5% isoflurane/medical air mixture) and placed in a facemask with a custom designed imaging box. Mice were intraperitoneally injected with AZD-7762 (0.5 mg in PBS, Sigma) every 5 h during the time-lapse imaging. Imaging was performed on an inverted Leica SP8 multiphoton microscope with a chameleon Vision-S (Coherent Inc.), equipped with four HyD detectors: HyD1 (< 455 nm), HyD2 (455–490 nm), HyD3 (500–550 nm) and HyD4 (560–650 nm). Different wavelengths between 700 nm and 1,150 nm were used for excitation; collagen (second harmonic generation) was excited with a wavelength of 860 nm and detected in HyD1. GFP and Tomato were excited with a wavelength of 960 nm and detected in HyD3 and HyD4. TEBs and ducts were imaged every 20–30 min using a Z-step size of 3 μm over a minimum period of 8 h. All images were in 12 bit and acquired with a 25× (HCX IRAPO N.A. 0.95 WD 2.5 mm) water objective.
FACS sorting
Single TEBs and ducts were isolated from 5-week-old MMTV-Cre;R26-loxP-stop-loxP-YFP mice. YFP expression was used to determine the localization and structure of the mammary gland. Single TEBs and pieces of ducts were micro-dissected from the fourth and fifth mammary glands. Single TEBs and ducts were digested in DMEM/F12 (GIBCO, Invitrogen Life Technologies) supplemented with hyaluronidase (300 μg/ml, Sigma Aldrich), and collagenase I (2 mg/ml, Roche Diagnostics) at 37 °C, followed by centrifugation at 550g for 10 min. The fatty layer on top and the aqueous layer in the middle were aspirated, and the remaining pellet was dissolved in 5 mM EDTA/PBS with 5% fetal bovine serum (Sigma) and kept on ice for 10 min before labelling with the following antibodies: anti-mouse CD45-Pacific blue (clone 30-F11, Biolegend), anti-mouse CD31-Pacific blue (clone 390, Biolegend), and rat anti-mouse CD140a-Pacific blue (Clone APA5, BD Bioscience). Cells were incubated for 30 min on ice in the dark, washed once in 5 mM EDTA/PBS with 5% fetal bovine serum (Sigma), and centrifuged at 250g for 5 min. Pellet was dissolved in 5 mM EDTA/PBS with 7-AAD, and sorted on a FACS AriaII Special Ordered Reseach Product (BD Biosciences). A broad FSC SSC gate was followed by a gate excluding doublets. Next, 7-AAD negative cells were gated, and from this population Lin− (CD45−, CD31−, CD140a−) and YFP+ cells were sorted into 384-well plates containing 5 μl of mineral oil that contained a 200-nl droplet of primers, dNTPs and synthetic mRNA molecules (ERCC).
Single-cell mRNA sequencing
Single-cell mRNA sequencing was performed as described previously32. In brief, cells were sorted into 5 μl of mineral oil containing a 200-nl droplet of primers, dNTPs and synthetic mRNA molecules (ERCC). Cells were fused with this droplet by centrifugation and lysed at 65 °C, followed by room temperature and second-strand synthesis aided by a Nanodrop II liquid handling platform. The resulting cDNA was processed following the CEL-Seq2 protocol33. Libraries were sequenced on an Illumina NextSeq with 75-bp paired-end reads. The 5′ mate was used to identify cells and libraries while the 3′ mate was aligned to the mm10 RefSeq mouse transcriptome using BWA34. Analysis was performed using StemID (for details of the methodology, see ref. 26). Endothelial cells, erythrocytes and lymphocytes were filtered from the data based on expression of Cd36 (5 unique transcripts), Beta-s (1,000 unique transcripts) and Cd74 (2 unique transcripts)/Cd52 (1 unique transcript), respectively (27 cells in total). The remaining cells were normalized by down sampling to 3,000 transcripts, after which StemID26 was used for clustering and cell type annotation. Cells with fewer than 3,000 unique transcripts were discarded. In total, 91 cells were included, of which we could assign 36 cells to the luminal lineage (cluster 1 contained 9 cells, cluster 2 contained 17 cells, cluster 3 contained 2 cells and cluster 5 contained 8 cells), 51 cells to the basal lineage (cluster 5 contained 2 cells, cluster 6 contained 14 cells, cluster 7 contained 10 cells, cluster 8 contained 8 cells and cluster 9 contained 17 cells), and 4 cells to a non-epithelial origin (cluster 4). After identifying luminal and basal cell clusters, three cells that were erroneously annotated as basal cells belonging to cluster 8 were manually annotated to belong to luminal cluster 2, based on luminal and basal markers such as K8/K18 and K5/Acta2, respectively. Cluster 5 expressed higher levels of the pre-ribosomal 45S RNA, which is often found in cells of low quality. We therefore chose to omit cluster 5 from further analysis. Differential gene expression between clusters was based on a previous method35 and performed as described previously32. All data analysis with StemID and custom scripts was performed with Rstudio, version 0.99.491.
Extended Data
Extended Data Figure 1. Pubertal mammary gland development is driven by elongation and bifurcation of proliferative TEBs.
a, Confocal image of whole-mount mammary glands at the onset of puberty (3.5 weeks of age) stained for DAPI (blue) and EdU (magenta, 4-h chase). Ducts are outlined in yellow. b, Magnified image of part of the fifth mammary gland outlined with a red box in a. Confocal image shows a single Z-plane of a proliferative TEB in the fifth gland at 3.5 weeks of age. c, Left, magnified image of the fifth mammary gland outlined with a yellow box in a. The top panel shows the maximum projection of the fifth gland at 3.5 weeks of age; the bottom panel shows a magnification of a representative TEB (single Z-plane, outlined with a white box). Middle, maximum projection of a fifth mammary gland at 5 weeks of age. The bottom panel shows a magnification of a representative TEB (outlined with a white box). Right, maximum projection of the fifth mammary gland at 8 weeks of age. The bottom panel shows a magnified image of a representative TEB (single Z-plane, outlined with a white box). EdU+ cells shown in red, nuclei are stained with DAPI (in blue), yellow outlines mark the ducts. d, Schematic representation of the methods used to count the branch levels in the mammary gland. In pubertal developing mammary glands, younger ducts (light grey) that were formed more recently have undergone more bifurcation events than older ducts (dark grey) that were formed earlier. e, Cumulative distribution of branch length at 5 weeks and 8 weeks, for branches formed after the beginning of puberty (level > 6) (n = 10 glands from 10 different mice). f, Bar graph showing the fraction of EdU+ cells in proliferative end buds during the course of pubertal development (three mice were used for each time point; we quantified n = 12 TEBs for the 3.5-week time point, n = 10 TEBs for the 5-week time point, and n = 10 TEBs for the 8-week time point). g, The fraction of EdU+ TEBs were measured at 3.5, 5, and 8 weeks (three mice were used for each time point; n = 12 glands for the 3.5-week time point, n = 8 glands for the 5-week time point, and n = 8 glands for the 8-week time point). The graph shows the fraction of EdU+ TEB plotted against the highest branch level. The black line represents the prediction from the stochastic model of equipotent TEBs described in the main text. h, Probability q of a TEB to terminally differentiate, shown as a function of branch level and read from the whole-gland reconstructions (n = 10 glands from 5 different mice, same data as Fig. 1e), overlaid with an linear piecewise fit (dashed green lines) which we use as an input to predict the subtree heterogeneity in Fig. 1f. Dotted lines indicate a constant value of 0.5 (horizontal line), indicative of balance between TEB bifurcation and termination and the branch level at the start of puberty (vertical line). i, Normalized average branch width as a function of branch level. Dotted lines indicate a constant value of 1 (horizontal line) and the branch level at the start of puberty (vertical line) (n = 10 glands from 5 different mice). j, Normalized average branch length as a function of branch level. Dotted lines indicate a constant value of 1 (horizontal line), and the branch level at the start of puberty (vertical line) (n = 10 glands from 5 different mice). k, Fate correlation between related TEBs, as a function of branch level. Correlation between sibling TEBs is in purple, whereas correlation between first-cousin TEBs is in green. A value of 1 indicates that the fate of two related TEBs is perfectly correlated, whereas a value of − 1 indicates perfect anti-correlation. The dotted line indicates 0 (that is, no correlation) (n = 10 glands from 5 different mice). For all graphs in this figure, data are mean ± s.e.m. and data from the fourth and fifth mammary gland were combined. Scale bars, 5 mm (a); 50 μm (b); 300 μm (c).
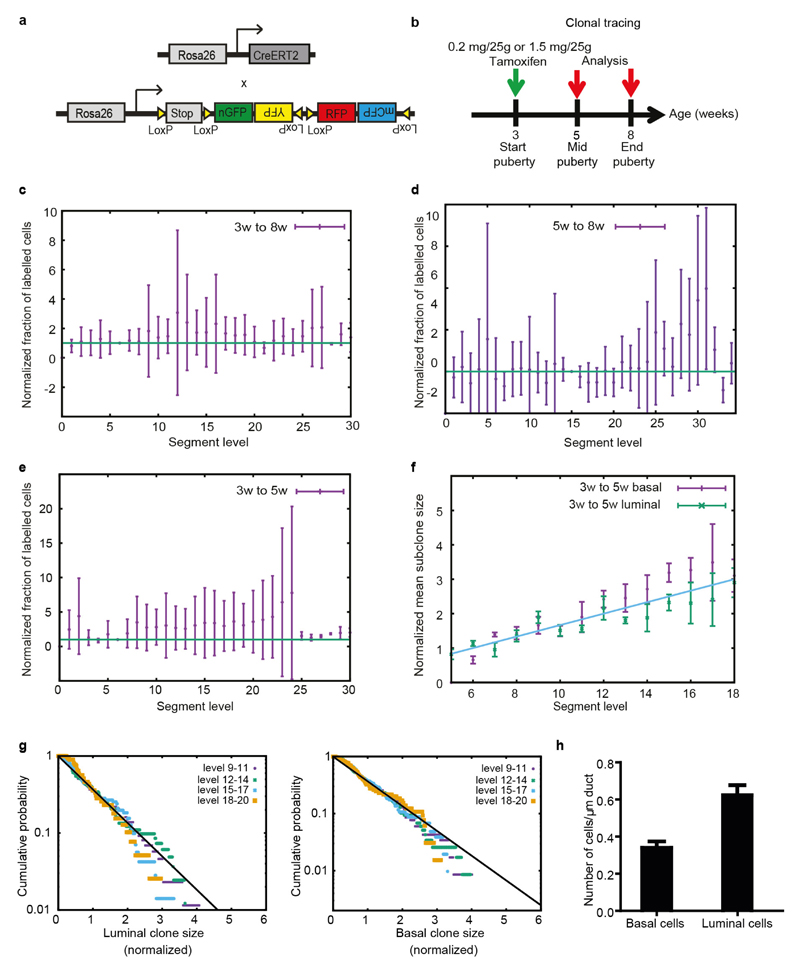
Extended Data Figure 2. Unbiased lineage-tracing strategy during pubertal development.
a, Cartoon depicting the gene system used for the lineage-tracing strategy. b, Timeline of the lineage-tracing strategy. c, Labelled cell fraction (product of clonal persistence and the surviving mean subclone size) as a function of segment level, for the 3–8 weeks tracing. The labelled cell fraction hovers around its initial value (reference taken for segment 6), indicative of a representative labelling. This also signifies that the persistence decays inversely to the linear increase in clone size, as expected from the model of long-term equipotent MaSCs. d, Labelled cell fraction as a function of segment level, for the 5–8 weeks trace. e, Labelled cell fraction as a function of segment level, for the 3–5 weeks trace. In both d and e, the labelled cell fraction hovers around its initial value, confirming the results of the 3–8 weeks of age trace. f, Normalized mean subclone size (basal in purple and luminal in green) as a function of branch level for the 3–5 weeks trace, showing a linear increase as branching morphogenesis proceeds due to cell segregation upon bifurcation. Subclone size is normalized by the area of the segment they are located in to correct for the segment length variability. Subclone size was also normalized to its initial value (at segment level 6), and display a similar trend to the 3–8 weeks tracing. g, Clone size distributions for luminal (left) and basal (right) clones at 5 weeks of age (lineage tracing from 3–5 weeks of age), at successive branch levels, plotted logarithmically. The clone size was rescaled by the average clone size at each time point. In each case, the data display scaling, and collapse on a single exponential (black line), as expected for an equipotent cell population. h, Quantification of the number of basal and luminal cells per micrometre in the mammary ducts of the adult mouse mammary gland (n = 17 randomly picked ducts from three different mice). For all graphs in this figure, data are mean ± s.e.m., and data from the fourth and fifth mammary glands were combined.
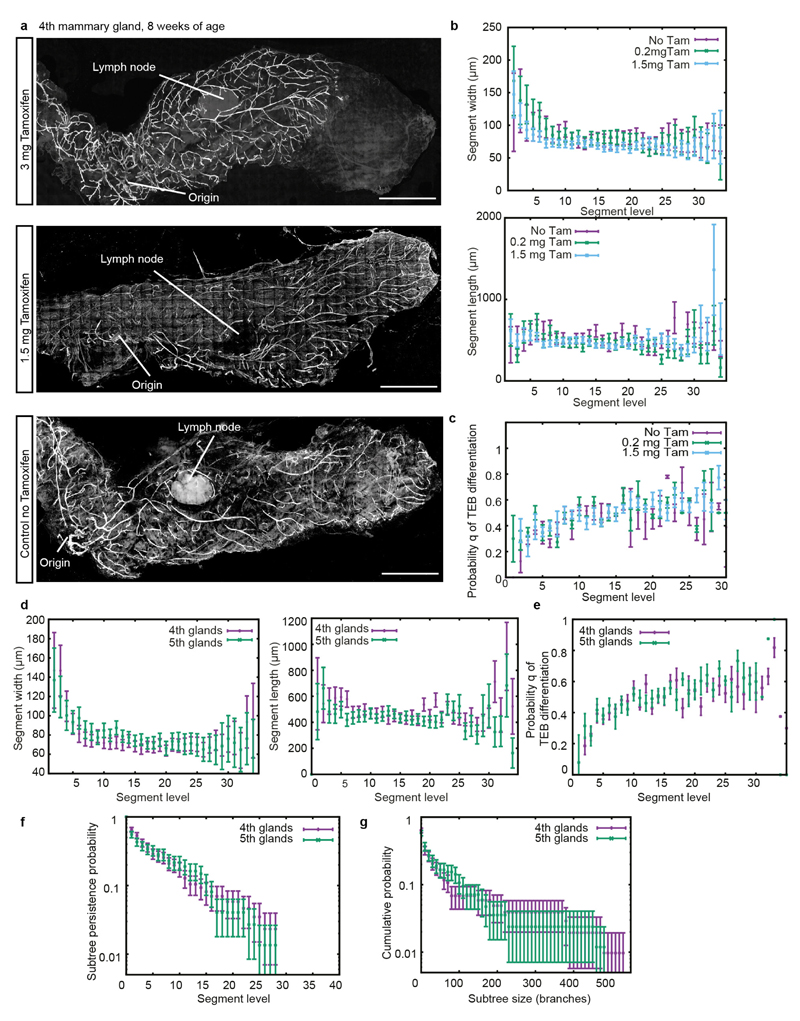
Extended Data Figure 3. Comparisons of branch patterns at different doses of tamoxifen and of fourth and fifth mammary glands.
a, Confocal images of whole-mount fourth mammary glands at 8 weeks of age, after injection of, from top to bottom, 3 mg tamoxifen per 25 g body weight, 1.5 mg tamoxifen per 25 g body weight or no tamoxifen, respectively, at the onset of puberty (3 weeks of age). Injection of 3 mg tamoxifen per 25 g body weight clearly interferes with branching morphogenesis, as the mammary gland did not fully invade the fat pad at the end of puberty. The mammary gland treated with 1.5 mg tamoxifen per 25 g body weight does not show any delay in mammary gland development, and shows the same branching pattern as the control gland. b, Average branch width and length as a function of branch level. No differences were observed in branch length or branch width for the different concentrations of tamoxifen. c, Probability q for a TEB to terminally differentiate as a function of branch level, read from the whole-gland reconstructions. In b and c, we analysed n = 1,480 segments from two glands (no tamoxifen), n = 1,229 segments from two glands (0.2 mg tamoxifen per 25 g body weight), and n = 3,347 segments from six glands (1.5 mg tamoxifen per 25 g body weight). No differences were observed between tamoxifen-induced glands and control glands. For graphs b and c, data from the fourth and fifth mammary glands were combined. d, Average branch widths and lengths as a function of branch level. e, Probabilities q of a TEB terminally differentiating, shown as a function of branch level and read from the whole-gland reconstructions. f, Subtree persistence, defined as the distribution of subtrees (starting at level 6) having a given maximal branch level i. g, Cumulative subtree size distributions, where size is defined as the total number of branches in a given subtree (starting at level 6). In d–g, we considered fourth glands (n = 5) and fifth glands (n = 5), and plot comparisons respectively in purple and in green. Data are mean ± s.e.m. (b–e) or s.d. (f, g). Scale bars, 5 mm (a).
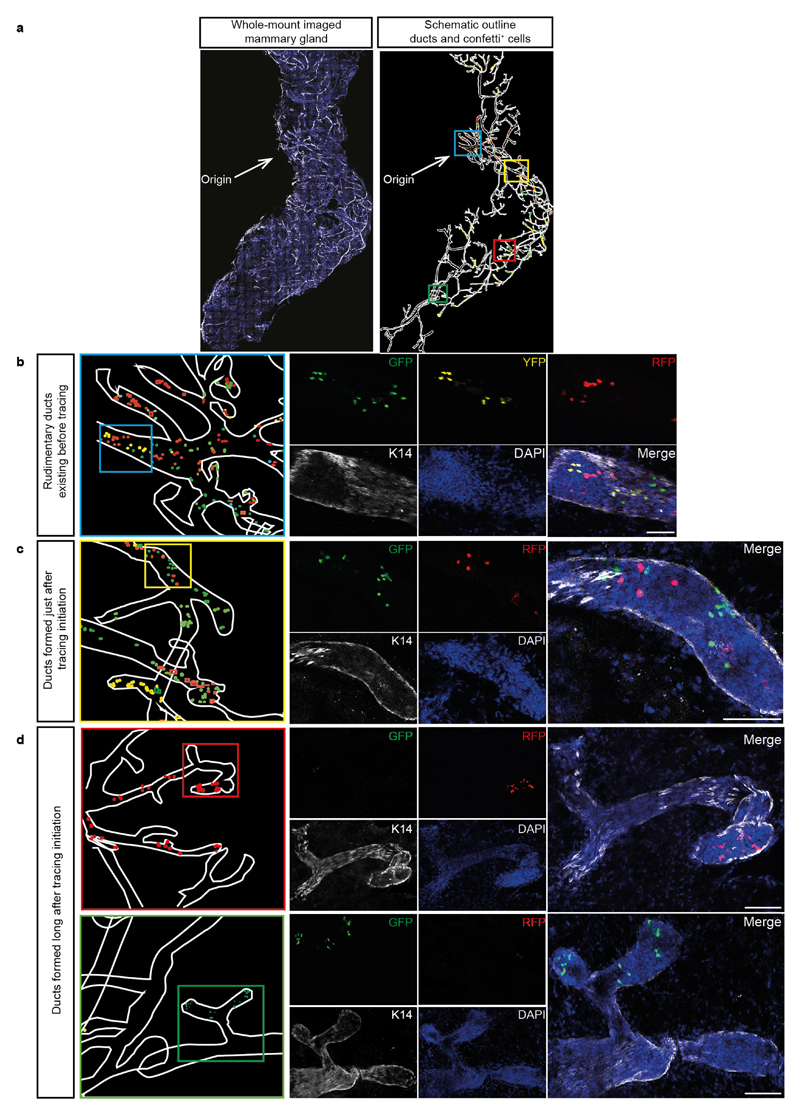
Extended Data Figure 4. Confetti+ mammary glands reveal the contribution of MaSCs during pubertal development.
a, Confocal image of a whole-mount confetti+ fourth mammary gland at 5 weeks of age, traced from 3 weeks of age. The ducts were manually reconstructed by outlining the ducts based on the K14 staining (white) and all individual confetti-labelled cells were outlined with their respective confetti colour (blue symbols: CFP+ cells; green symbols: GFP+ cells; yellow symbols: YFP+ cells; red symbols: RPF+ cells). b, Image shows a duct in the rudimentary gland containing single confetti-labelled cells (outlined with the red box in a). c, d, Confocal images showing ducts that were formed after the induction of confetti-tracing containing clonal outgrowths. Note that only one confetti colour is present in the ducts close to the border of the fat pad. Scale bars, 100 μm. e, f, n = 606 subclones analysed in four glands from two mice (same data as Fig. 4 a, b). e, Distribution of intermittency length (purple dots), defined as the number of consecutive unlabelled branches existing between branches labelled in the same colour and cell type. The black line is an exponential fit. Data are mean ± s.e.m. f, Probability of a clone being lost from the subsequent subtree, expressed as a function of its last segment level. Data are mean ± s.e.m. Scale bars, 5 mm (a), 100 μm (b–d).
Extended Data Figure 5. MaSCs are localized in the TEBs and contribute during oestrous-driven proliferation and alveoli formation during pregnancy.
a, Cartoon depicting the gene system used for the lineage-tracing strategy and timeline of the lineage-tracing strategy. b, Confocal images of a duct and a lobuloalveolar structure in the fourth mammary gland containing lineage-traced cells after 18 months of tracing contributing to ductal turnover and the formation of lobuloalveolar structures driven by the oestrous cycle. c, Cartoon depicting the gene system and timeline used for the lineage-tracing strategy. d, Maximum projection of a part of a whole-mount fourth mammary gland after 4 days of lactation, showing the contribution of YFP+ confetti cells to alveoli formation. e, Whole-mount image of a fifth mammary gland at 5.5 weeks of age, traced from 3 weeks of age. Ducts are stained for K14 (in red). f, Maximum projection of a part of the fifth mammary gland depicted in e showing a luminal GFP clone contributing to the subtree depicted here. g, h, Maximum projection of TEBs and their adjacent ducts outlined by the yellow and green boxes in f. The most distal GFP cells of the clone are situated in the TEBs and are actively dividing, as is indicated by the most recent progeny located in the adjacent ducts. The localization of the most distal cells of a clone was determined as shown in Fig. 2e. Scale bars, 100 μm (b, d, g, h); 5 mm (e); 1 mm (f).
Extended Data Figure 6. Clonal labelling enables quantification of the number of functional MaSCs based on labelling density.
a, Cartoon depicting the method used to determine the number of MaSCs. Clonal labelling at the onset of puberty results in the confetti labelling of 1 MaSC out of N MaSCs in a TEB (red cell). Clonal analysis in the resulting subtree at the end of puberty enables us to determine the contribution of one labelled MaSC to the entire subtree that is formed after the induction of confetti tracing. The labelled fraction is calculated by dividing the clone size (red cells) by the total number of cells in the subtree (1/N). By taking the inverse, the number N of functional MaSCs can be calculated. b, Representative images of a part of a whole-mount fourth mammary gland, stained for K14 (basal marker) used to determine the identity of the labelled clones. Magnified images show a single Z-plane with basal cells (red outline), which overlap with the staining, or luminal cells (yellow outline), which do not overlap with the basal staining. Scale bars, 100 μm. c, Maximum projection of part of a whole-mount fifth mammary gland, stained for E-cadherin (luminal marker) used to determine the identity of the labelled clones. Magnified images show a single Z-plane with basal cells (yellow outline), which do not overlap with the staining, or luminal cells (red outline), which do overlap with the luminal staining. Scale bars, 1 mm (left) and 100 μm (right). d, Quantification of number of basal and luminal cells in the TEB (n = 10 TEBs, scored over three mice). Data are mean ± s.e.m. e, Representative images of TEBs at 5 weeks of age, showing a single Z-plane of the TEB stained for DAPI and K14 or E-cadherin to determine the number of luminal and basal cells per TEB. Z-stacks of complete TEBs (Z-step size, 5 μm) were used to count the total number of basal cells per TEB. Scale bars, 100 μm.
Extended Data Figure 7. StemID identifies basal and luminal cell clusters in a mixture of mammary epithelial cells.
a, Heat map of cell-to-cell transcriptome distances measured by 1 − the Pearson’s correlation coefficient. Basal and luminal cell clusters identified by StemID are colour coded along the axes. b, Cumulative transcript counts (colour legend) of cell-cycle genes expressed during G1 phase, S phase and M phase are indicated in the t-SNE maps. None of the cell cycle gene groups show a clear correlation with any of the clusters. c, Transcript counts (colour legend) of basal cell markers Acta2, Krt5 and Krt14 are indicated in the t-SNE maps. Expression of these genes is restricted to clusters 6, 7, 8, and 9. d, Transcript counts (colour legend) of luminal cell markers Krt8, Krt18 and Krt19 are indicated in the t-SNE maps. Expression of these genes is restricted to clusters 1, 2, 3, and 5. e, Transcript counts (colour legend) of previously reported MaSC markers Axin2 and Lgr5 are indicated in the t-SNE maps. The top graph shows that expression of Axin2 is assigned to the basal cells (both ductal and TEB cells), but is not restricted to one identified StemID cluster. The bottom graph shows that expression of Lgr5 is assigned to both luminal and basal cell clusters and is not restricted to one identified StemID cluster. Note that the transcript counts for both genes are very low. f, g, Heat map of differentially expressed genes comparing luminal cell cluster 1 with luminal cell clusters 2 and 3 (f) and comparing basal cell clusters 7 and 8 with basal cell clusters 6 and 9 (g). Rows are genes and columns are cells ordered based on cluster number. Genes are grouped on the basis of hierarchical clustering and the log10 expression of transcript counts is plotted.
Extended Data Figure 8. Successive rounds of bifurcation lead to monoclonal conversion as pubertal development proceeds, at a speed dictated by the rate of MaSC mixing in TEBs.
a, Simulated lineage tree in two opposite limits. Top, well-mixed limit, in which cells are randomly segregated upon bifurcation, showing slow linear conversion towards monoclonality. Bottom, a zero-mixing limit, in which the position of cells during two successive bifurcations remains unchanged, showing a fast exponential conversion towards monoclonality. Branches without any labelled cells are represented as black lines. Branches containing confetti-labelled cells are represented as lines of the dominant colour, with branching points showing a pie chart representing the proportion of each colour present in the branch. The size of the pie chart represents the size of the confetti clone to the total duct. b, Mean persisting confetti-clone size as a function of branch level, in the same two opposite limits, assuming a total MaSC number of n = 200. Numerical integration in the well mixed limit (top) for three initial conditions for the initial number of cells labelled (n = 1 in blue, n = 2 in yellow, n = 3 in green). The red dashed line indicates the predicted linear slope. Numerical integration in the zero-mixing limit (bottom, n = 1 in blue). The red dashed line indicates the predicted exponential increase for small clone sizes. c, Top image shows confocal images of TEBs during the bifurcation process. Bottom image shows a schematic representation of the branching process as predicted by the model in the well mixed limit. d, Evolution of the cumulative rescaled subclone size distribution at different segment numbers (7, 9, 11 and 15 in purple, green, blue and orange, respectively) for a two-compartment model of TEB, consisting of a 10% population of MaSCs that are tilted towards renewal and 90% population of progenitors tilted towards loss. Contrary to the equipotent one-population model and our data in Fig. 4, the two-compartment model does not display scaling, with MaSCs forming a long tail in the distribution. e, Representative confocal images of a confetti+ mammary epithelial duct of a fourth mammary gland at 8 weeks of age. Clones of RFP+ cells (red) are outlined and blue represents E-cadherin. TEBs are located at the right side of the image. f, Quantification of the average cluster size for basal and luminal cell lineages at 8 weeks of age. P = 0.46 (Mann–Whitney test). Scale bars, 100 μm (c); 300 μm (e).
Extended Data Figure 9. Successive rounds of bifurcation lead to clonal extinction and enrichment.
a, Confocal image of a whole-mount-imaged fourth mammary gland stained for K14 (white) and DAPI (blue). The ductal network was manually reconstructed by outlining the ducts based on the K14 staining (white) and all individual confetti-labelled cells were outlined with their respective confetti colour (blue symbols, CFP+ cells; green symbols, GFP+ cells; yellow symbols, YFP+ cells; red symbols, RPF+ cells). This information was used as input for a schematic representation of the lineage tree in Fig. 4c. b–d, Confocal images showing a zoom of the location of the coloured boxes indicated in a, showing a conversion of these luminal clones towards monoclonality over successive bifurcation rounds, including both extinction and enrichment of clones. A merge of these images is also shown in Fig. 4d. Scale bars, 5 mm (a); 100 μm (b–d).
Extended Data Figure 10. Theory of equipotent TEBs making near-balanced stochastic fate choices between branching and termination explains quantitatively kidney branching morphogenesis.
a, Maximum projection of a whole-mount image of a murine kidney at embryonic day (E)16. Ducts are stained for E-cadherin (green) and nuclei (blue). Scale bar, 1 mm. b, Outline from our quantitative reconstruction. c, Probability q of a bud terminally differentiating, expressed as a function of branch level and read from the whole-mount reconstruction. Green line represents a constant value of 0.5, indicative of balance between TEB bifurcation and termination. d, Distribution of branch lengths (level >6), which collapses onto an exponential distribution. This is indicative of branching occurring stochastically at any time with equal constant probability. e, f, Inter-subtree heterogeneity (level >6, data in purple) can be predicted quantitatively by a model of equipotent buds making stochastic decisions. Subtree persistence (e) is defined as the distribution of subtrees having a given maximal branch level i. Subtree size distribution (f) is defined as the total number of branches in a given subtree. The theoretical curve (green line) explains the subtree heterogeneity on both measurements well. n = 48 subtrees were analysed from one embryo (c–f). Data are mean ± s.e.m. (d) or mean ± s.d. (e, f).
Supplementary Material
Supplementary Information is available in the online version of the paper.
Acknowledgements
The authors would like to thank members of the van Rheenen group for critically reading this manuscript, and Anko de Graaff of the Hubrecht Imaging Centre and the Hubrecht Institute animal caretakers for technical support. This work was supported by the European Research Council (consolidator grant 648804 to J.v.R.), the Worldwide Cancer Research (grant 13-0297 to J.v.R), and the Wellcome Trust (grant 098357/Z/12/Z to B.D.S. and 110326/Z/15/Z to E.H.). E.H. is funded by a Junior Research Fellowship from Trinity College, Cambridge, and a Sir Henry Wellcome Fellowship from the Wellcome Trust and acknowledges the Bettencourt-Schueller Young Researcher Prize for support. C.L.G.J.S. is funded by a Boehringer Ingelheim Fonds PhD Fellowship.
Footnotes
Data availability. The sequencing data discussed in this publication have been deposited in the Gene Expression Omnibus, and are accessible through GEO Series accession number GSE85875. Source data are available for Figs 1c–f, 2f, 3b, c, e, 4a–c and Extended Data Figs 1e–k, 2c, e–h, 3b–g, 4e, f, 6d, 8f. All other data are available from the author upon reasonable request.
Code availability. Custom-made. NET software to score the length and width of all the ducts, the coordinates of the branch points and the position of the labelled cells in ducts and in TEBs used as input for a schematic representation of the lineage tree is available upon request from J.v.R. Custom-made Python software and the ETE2 Python toolkit used for the conversion and visualization of the schematic mammary gland lineage tree are available upon request from E.H.
Author Contributions J.v.R., B.D.S., C.L.G.J.S., and E.H. conceived the study and designed the experiments. C.L.G.J.S., with assistance from A.Z., and N.S.M.L., performed the experiments and analyses. E.H. performed all theoretical work. M.J.M. performed single-cell mRNA sequencing and analysis. C.L.G.J.S., E.H. and M.J.M. made the figures. A.v.O., J.v.R. and B.D.S. supervized the study. All authors discussed results and participated in preparation of the manuscript.
Author Information Reprints and permissions information is available at www.nature.com/reprints. Readers are welcome to comment on the online version of the paper.
The authors declare no competing financial interests.
Reviewer Information Nature thanks M. Bentires-Alj, A. Klein and the other anonymous reviewer(s) for their contribution to the peer review of this work.
References
- 1.Williams JM, Daniel CW. Mammary ductal elongation: differentiation of myoepithelium and basal lamina during branching morphogenesis. Dev Biol. 1983;97:274–290. doi: 10.1016/0012-1606(83)90086-6. [DOI] [PubMed] [Google Scholar]
- 2.Silberstein GB, Daniel CW. Glycosaminoglycans in the basal lamina and extracellular matrix of serially aged mouse mammary ducts. Mech Ageing Dev. 1984;24:151–162. doi: 10.1016/0047-6374(84)90067-8. [DOI] [PubMed] [Google Scholar]
- 3.Giraddi RR, et al. Stem and progenitor cell division kinetics during postnatal mouse mammary gland development. Nat Commun. 2015;6 doi: 10.1038/ncomms9487. 8487. [DOI] [PMC free article] [PubMed] [Google Scholar]
- 4.Visvader JE, Stingl J. Mammary stem cells and the differentiation hierarchy: current status and perspectives. Genes Dev. 2014;28:1143–1158. doi: 10.1101/gad.242511.114. [DOI] [PMC free article] [PubMed] [Google Scholar]
- 5.Inman JL, Robertson C, Mott JD, Bissell MJ. Mammary gland development: cell fate specification, stem cells and the microenvironment. Development. 2015;142:1028–1042. doi: 10.1242/dev.087643. [DOI] [PubMed] [Google Scholar]
- 6.Stingl J, et al. Purification and unique properties of mammary epithelial stem cells. Nature. 2006;439:993–997. doi: 10.1038/nature04496. [DOI] [PubMed] [Google Scholar]
- 7.Shackleton M, et al. Generation of a functional mammary gland from a single stem cell. Nature. 2006;439:84–88. doi: 10.1038/nature04372. [DOI] [PubMed] [Google Scholar]
- 8.dos Santos CO, et al. Molecular hierarchy of mammary differentiation yields refined markers of mammary stem cells. Proc Natl Acad Sci USA. 2013;110:7123–7130. doi: 10.1073/pnas.1303919110. [DOI] [PMC free article] [PubMed] [Google Scholar]
- 9.Van Keymeulen A, et al. Distinct stem cells contribute to mammary gland development and maintenance. Nature. 2011;479:189–193. doi: 10.1038/nature10573. [DOI] [PubMed] [Google Scholar]
- 10.Rios AC, Fu NY, Lindeman GJ, Visvader JE. In situ identification of bipotent stem cells in the mammary gland. Nature. 2014;506:322–327. doi: 10.1038/nature12948. [DOI] [PubMed] [Google Scholar]
- 11.Prater MD, et al. Mammary stem cells have myoepithelial cell properties. Nat Cell Biol. 2014;16:942–950. doi: 10.1038/ncb3025. [DOI] [PMC free article] [PubMed] [Google Scholar]
- 12.Bai L, Rohrschneider LR. s-SHIP promoter expression marks activated stem cells in developing mouse mammary tissue. Genes Dev. 2010;24:1882–1892. doi: 10.1101/gad.1932810. [DOI] [PMC free article] [PubMed] [Google Scholar]
- 13.Plaks V, et al. Lgr5-expressing cells are sufficient and necessary for postnatal mammary gland organogenesis. Cell Reports. 2013;3:70–78. doi: 10.1016/j.celrep.2012.12.017. [DOI] [PMC free article] [PubMed] [Google Scholar]
- 14.de Visser KE, et al. Developmental stage-specific contribution of LGR5+ cells to basal and luminal epithelial lineages in the postnatal mammary gland. J Pathol. 2012;228:300–309. doi: 10.1002/path.4096. [DOI] [PubMed] [Google Scholar]
- 15.van Amerongen R, Bowman AN, Nusse R. Developmental stage and time dictate the fate of Wnt/β-catenin-responsive stem cells in the mammary gland. Cell Stem Cell. 2012;11:387–400. doi: 10.1016/j.stem.2012.05.023. [DOI] [PubMed] [Google Scholar]
- 16.Wang D, et al. Identification of multipotent mammary stem cells by protein C receptor expression. Nature. 2015;517:81–84. doi: 10.1038/nature13851. [DOI] [PubMed] [Google Scholar]
- 17.Zeng YA, Nusse R. Wnt proteins are self-renewal factors for mammary stem cells and promote their long-term expansion in culture. Cell Stem Cell. 2010;6:568–577. doi: 10.1016/j.stem.2010.03.020. [DOI] [PMC free article] [PubMed] [Google Scholar]
- 18.Badders NM, et al. The Wnt receptor, Lrp5, is expressed by mouse mammary stem cells and is required to maintain the basal lineage. PLoS One. 2009;4:e6594. doi: 10.1371/journal.pone.0006594. [DOI] [PMC free article] [PubMed] [Google Scholar]
- 19.Metzger RJ, Klein OD, Martin GR, Krasnow MA. The branching programme of mouse lung development. Nature. 2008;453:745–750. doi: 10.1038/nature07005. [DOI] [PMC free article] [PubMed] [Google Scholar]
- 20.Sternlicht MD, Kouros-Mehr H, Lu P, Werb Z. Hormonal and local control of mammary branching morphogenesis. Differentiation. 2006;74:365–381. doi: 10.1111/j.1432-0436.2006.00105.x. [DOI] [PMC free article] [PubMed] [Google Scholar]
- 21.Nelson CM, Vanduijn MM, Inman JL, Fletcher DA, Bissell MJ. Tissue geometry determines sites of mammary branching morphogenesis in organotypic cultures. Science. 2006;314:298–300. doi: 10.1126/science.1131000. [DOI] [PMC free article] [PubMed] [Google Scholar]
- 22.Lu P, Werb Z. Patterning mechanisms of branched organs. Science. 2008;322:1506–1509. doi: 10.1126/science.1162783. [DOI] [PMC free article] [PubMed] [Google Scholar]
- 23.Plaks V, et al. Adaptive immune regulation of mammary postnatal organogenesis. Dev Cell. 2015;34:493–504. doi: 10.1016/j.devcel.2015.07.015. [DOI] [PMC free article] [PubMed] [Google Scholar]
- 24.Zomer A, et al. Intravital imaging of cancer stem cell plasticity in mammary tumors. Stem Cells. 2013;31:602–606. doi: 10.1002/stem.1296. [DOI] [PMC free article] [PubMed] [Google Scholar]
- 25.Shehata M, van Amerongen R, Zeeman AL, Giraddi RR, Stingl J. The influence of tamoxifen on normal mouse mammary gland homeostasis. Breast Cancer Res. 2014;16:411. doi: 10.1186/s13058-014-0411-0. [DOI] [PMC free article] [PubMed] [Google Scholar]
- 26.Grün D, et al. De novo prediction of stem cell identity using single-cell transcriptome data. Cell Stem Cell. 2016;19:266–277. doi: 10.1016/j.stem.2016.05.010. [DOI] [PMC free article] [PubMed] [Google Scholar]
- 27.Kouros-Mehr H, Werb Z. Candidate regulators of mammary branching morphogenesis identified by genome-wide transcript analysis. Dev Dyn. 2006;235:3404–3412. doi: 10.1002/dvdy.20978. [DOI] [PMC free article] [PubMed] [Google Scholar]
- 28.Gjorevski N, Nelson CM. Integrated morphodynamic signalling of the mammary gland. Nat Rev Mol Cell Biol. 2011;12:581–593. doi: 10.1038/nrm3168. [DOI] [PubMed] [Google Scholar]
- 29.Ritsma L, et al. Intestinal crypt homeostasis revealed at single-stem-cell level by in vivo live imaging. Nature. 2014;507:362–365. doi: 10.1038/nature12972. [DOI] [PMC free article] [PubMed] [Google Scholar]
- 30.Lopez-Garcia C, Klein AM, Simons BD, Winton DJ. Intestinal stem cell replacement follows a pattern of neutral drift. Science. 2010;330:822–825. doi: 10.1126/science.1196236. [DOI] [PubMed] [Google Scholar]
- 31.Alieva M, Ritsma L, Giedt RJ, Weissleder R, Van Rheenen J. Imaging windows for long-term intravital imaging. Intravital. 2014;3:e29917. doi: 10.4161/intv.29917. [DOI] [PMC free article] [PubMed] [Google Scholar]
- 32.Muraro MJ, et al. A single-cell transcriptome atlas of the human pancreas. Cell Syst. 2016;3:385–394.e3. doi: 10.1016/j.cels.2016.09.002. [DOI] [PMC free article] [PubMed] [Google Scholar]
- 33.Hashimshony T, et al. CEL-Seq2: sensitive highly-multiplexed single-cell RNA-Seq. Genome Biol. 2016;17:77. doi: 10.1186/s13059-016-0938-8. [DOI] [PMC free article] [PubMed] [Google Scholar]
- 34.Li H, Durbin R. Fast and accurate short read alignment with Burrows–Wheeler transform. Bioinformatics. 2009;25:1754–1760. doi: 10.1093/bioinformatics/btp324. [DOI] [PMC free article] [PubMed] [Google Scholar]
- 35.Anders S, Huber W. Differential expression analysis for sequence count data. Genome Biol. 2010;11:R106. doi: 10.1186/gb-2010-11-10-r106. [DOI] [PMC free article] [PubMed] [Google Scholar]
Associated Data
This section collects any data citations, data availability statements, or supplementary materials included in this article.


