Abstract
The aim of this study is to evaluate the benefit of long axial field-of-view (AFOV) PET scanners on region of interest (ROI) quantification. We simulated a series of PET scanners with an AFOV ranging from 22 cm to 220 cm. A theoretical framework was used to predict the contrast recovery coefficient (CRC) and the variance of ROI quantification in penalized maximum likelihood (ML) image reconstruction, in which the resolution and noise tradeoff was controlled by a regularization parameter with a quadratic penalty function. The characterization was based on the converged penalized ML reconstruction with an accurate system model. We examined quantification of a 2-mm ROI and 10-mm ROI in a clinically relevant scan range of 110 cm. Multiple bed positions with 50% overlap were used for scanners with shorter AFOV to provide a relatively uniform sensitivity across the 110 cm axial range. A uniform water cylinder of 20 cm in diameter and 230 cm in length was chosen to model the attenuation and background activity. We computed the variance reduction factor at fixed resolution. Effects of different detector capabilities, including TOF (time-of-flight) resolution (320 ps, 500 ps, and non-TOF) and DOI (depth-of-interaction) resolution (4 mm, 10 mm, and no DOI), were evaluated. The results show that at a normal activity level (370 MBq), the 220-cm AFOV scanner offers a ~ 17-fold variance reduction for the 2-mm ROI and ~26-fold variance reduction for the 10-mm ROI (both measured at CRC=0.5) over the 22-cm AFOV scanner when both using detectors with 500 ps TOF resolution no DOI capability. The variance reduction factors of trues-only are higher than those of including scatters and randoms. Combining 320 ps TOF and 4-mm DOI, the 220-cm long scanner offers a ~45-fold variance reduction over the 22-cm long reference scanner (500 ps TOF, no DOI) for imaging 2-mm and 10-mm ROIs. The variance reduction factors are higher at a lower activity level due to lower random fraction. In conclusion, our study demonstrates that a long AFOV scanner can greatly improve the quantitative accuracy of PET imaging compared to current state-of-the-art clinical PET scanners.
Keywords: positron emission tomography, long axial field of view, ROI quantification
1. Introduction
Positron emission tomography (PET) is a major imaging modality for high-sensitivity molecular imaging to visualize and track biochemical process of interest using radiotracers (Cherry 2004). It has been widely used for clinical diagnosis (e.g. oncology, neurology and cardiology), biomedical research, and translational medicine. However, the image quality of PET is mainly limited by the number of coincidence photon pairs that are recorded in each PET scan due to low sensitivity and concerns regarding radiation dose. To overcome the limitation of current PET scanners and explore new applications of PET, we are building a 2-meter long PET scanner, called the EXPLORER (http://explorer.ucdavis.edu) that will dramatically improve the photon detection efficiency for long axial FOV (AFOV) scans (Badawi et al 2013, Cherry et al 2017, Badawi et al 2018, Zhang et al 2018b). In addition to the improved sensitivity, it can cover the entire human body and will provide total-body high temporal resolution dynamic PET scans for the first time (Zhang et al 2014a). The EXPLORER project has stimulated growing interest in developing long AFOV PET scanners, with several alternative versions of the EXPLORER under development (Karp et al 2017, Viswanath et al 2017). To date we have built a small-scale version of the EXPLORER scanner (called mini-EXPLORER) using Siemens Biograph mCT PET detector modules (Berg et al 2018a, Berg et al 2018b). It has a ring diameter of 44 cm and an AFOV of 45 cm and can perform extended AFOV PET imaging of non-human primates and medium-size animals. High-quality images have been obtained for low-dose high-temporal-resolution dynamic imaging (Zhang et al 2017b). A second device (mini-EXPLORER-II) with broadly similar geometry but smaller crystals and better timing resolution has also been developed by United Imaging Healthcare (UIH) (Lv et al 2017).
Simulation studies have been performed to examine the benefit of extended axial FOV for PET imaging. Most of these studies were based on the noise equivalent count rate (NECR) (MacDonald et al 2017, Poon et al 2012, Isnaini et al 2014). In particular, Poon et al (Poon 2013, Badawi et al 2013) have shown that a 2-meter long scanner provides a factor of 40-fold gain in TOF-weighted NECR (Conti 2006) compared to a Siemens mCT PET using simulation models of the mCT scanner (Poon 2015). However, NECR (including TOF-weighted NECR) is only a function of count rates for true, scattered and random events. It does not take into account the spatial resolution of the detectors and hence may not truly reflect image quality. Surti et al (Surti et al 2013, Surti et al 2015) evaluated image quality in terms of lesion detectability, but only for simulated scanners with an AFOV up to 75 cm.
In this work, we evaluate the benefit of long AFOV scanners for region of interest (ROI) quantification with modeling of geometric sensitivity, detector resolution, and TOF resolution. We focus on a clinically relevant scan range of 110 cm for oncologic PET. We study a series of PET scanners with AFOV ranging from 22 cm to 220 cm. Contrast recovery coefficient (CRC) and variance of ROI quantification are analyzed using theoretical formulae that have been developed and validated for converged penalized maximum likelihood image reconstruction on typical whole-body scanner geometries (Qi and Leahy 1999, Qi and Leahy 2000, Qi and Huesman 2006). Benefits of using detectors with better time-of-flight (TOF) resolution and depth-of-interaction (DOI) capability have also been examined to provide guidance for the future development of long AFOV scanners. The performance gain as a function of injected activity level has also been studied.
2. Materials and Methods
2.1. Scanner configurations
We examine a series of PET scanners with a range of AFOVs (Zhang et al 2017c). The simulated configurations are broadly based on the detector modules of a Siemens Biograph mCT PET scanner (Jakoby et al 2011). The ring diameter of the scanners is fixed at 83.5 cm. Each detector ring is formed by 48 detector blocks (48B). Each detector block consists of a 13×13 array of 4.0×4.0×20 mm3 lutetium-yttrium oxyorthosilicate (LYSO) scintillator crystals and has dimensions of 52 mm×52 mm. The energy resolution is set at 11.7% and energy window is 435-650 (keV). We did not model detector dead-time or pulse pile-up effects. Each PET scanner is made of multiple detector rings with a 4-mm axial air gap between adjacent detector rings. In total we simulated 4 designs with 4, 8, 20, and 40 block detector rings, which we refer to as 4R, 8R, 20R, and 40R in the following discussion. Table 1 shows the axial FOV of the simulated designs together with their respective solid angle coverage for a point at the center of the FOV.
Table 1:
Four scanner designs and their solid angle coverage of a point source at the center.
| Design | AFOV (cm) | Ω/4π | ratio over 4R |
|---|---|---|---|
| 4R | 22.0 | 0.255 | 1.00 |
| 8R | 44.4 | 0.469 | 1.84 |
| 20R | 111.6 | 0.801 | 3.14 |
| 40R | 223.6 | 0.937 | 3.68 |
2.2. ROI quantification
We use the theoretical formulae derived for converged penalized maximum likelihood (PML) image reconstruction to compute the CRC and variance of ROI quantification. These formulae have been verified extensively against Monte Carlo reconstructions (Qi and Leahy 1999, Qi and Leahy 2000, Qi and Huesman 2006). While previous validations were performed for typical whole-body PET geometries, we expect that the accuracy of the formulae holds for the central 110-cm axial range inside the 40R scanner, where the resolution and variance are relatively uniform (see figure 3(b)). Applying these formulae to regions near the axial ends of the 40R scanner may require further validation.
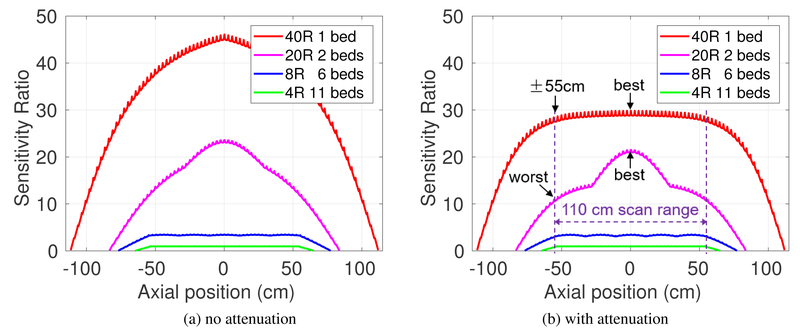
Figure 3:
Sensitivity ratio along axial axis (absolute values were scaled to that of 4R): (a) source in air (without attenuation), and (b) source in cylinder phantom. The relative flat sensitivity in 40R is due to the attenuation effect through the long water cylinder.
For completeness, we briefly describe the formulae and refer readers to the references for more details. We focus on the penalized likelihood image reconstruction that estimates the unknown PET tracer distribution x from the measured data y by
| 1 |
where L(y∣x) is the log Poisson likelihood function, β is a regularization parameter, and R is the second-order derivative of the penalty function. The expectation of the PET data ȳ are given by
| 2 |
where P is the system matrix that models the probability of detecting an event originated from each image voxel in each line of response (LOR), and are the expectations of scatters and randoms, respectively.
Let fI be the indicator function of an ROI. The mean activity inside the ROI can be calculated by
| 3 |
where ∣fI∣ denotes the number of voxels in the ROI. The performance of the ROI quantification can be measured by the bias and variance of A. When the background activity is known (or can be estimated accurately), the bias of the ROI is directly related to the contrast recovery coefficient (CRC) that is defined as
| 4 |
where Atrue is the true activity inside the ROI and B is the background activity. Using the formulae derived previously (Qi and Huesman 2006), the CRC and variance of an ROI can be approximated by
| 5 |
| 6 |
where F is the Fisher information matrix (FIM) that is given by
| 7 |
Direct inversion of the Fisher information matrix is difficult because of its large size. Fortunately, for a small ROI, the above equations can be evaluated by using the locally shift-invariant approximation and fast Fourier transform (Qi and Leahy 2000). The formulae become
| 8 |
| 9 |
where λ and μ are the Fourier transform of the images formed by the column vectors of F and R corresponding to the ROI location, respectively, and γ is the Fourier transform of image of fI. N is the number of voxels in each image. Equations (5) and (6) were used to compute the CRC vs. variance tradeoff of ROIs located along the central axis of each scanner. CRC and variance curves were calculated by varying the regularization parameter β of the PML reconstruction and the variance reduction factors of long AFOV scanners over the 22-cm 4R scanner were computed at fixed CRC values.
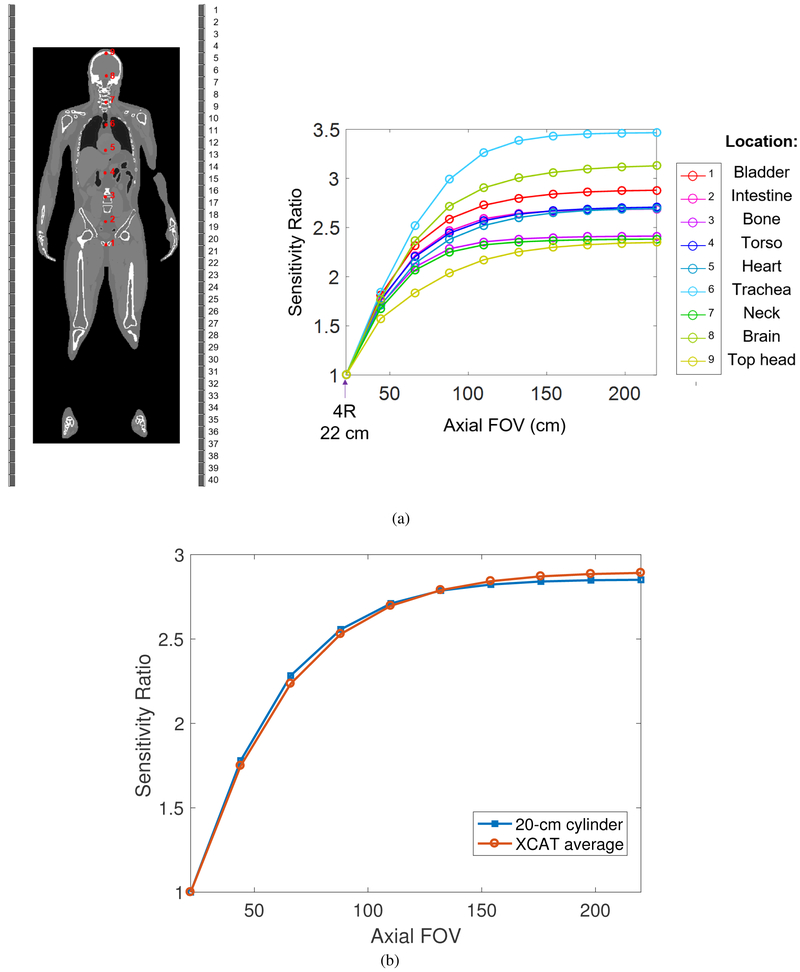
To compute one column of the FIM, , where eI is a unit vector with one at the center of the ROI and zero elsewhere, we need three operations: (i) calculation of the forward projection of a point source at the center of the ROI, PeI, (ii) calculation of the forward projection of the background, ȳ, and (iii) backprojection of the ratio between PeI and ȳ. SimSET (Harrison et al 2006) was used to estimate the point source projection by tracking annihilation photons emitted from the point source for all scanner configurations. The forward projection of the uniform background and backprojection operation were performed using a pre-computed system matrix. The system matrix P was computed using a multi-ray-tracing projector that divides each detector crystal into 4×4×20 sub-elements and traces all the possible lines connecting the elements of two detectors after weighting by the crystal attenuation (Zhou and Qi 2011). It models the spatially variant point spread function (PSF) and LOR-dependent detection response. We used an image dimension of 135 × 135 × 1119 with 2×2×2 mm3 voxels to cover a FOV of 27 cm transaxially and 223.8 cm axially. To model the background, we first simulated a point source at various locations inside an XCAT 2.0 phantom (Segars et al 2010) and plotted the central sensitivity ratio over the 4R reference scanner as a function of axial FOV in figure 1(a). Clearly the sensitivity curve varies substantially from location to location due to attenuation effect. To simplify the comparison, we used a uniform water cylinder to model the attenuation and background activity, and fitted the diameter of the cylinder to match the average sensitivity curve of the XCAT phantom. Figure 1(b) shows that the fitted water cylinder (20 cm diameter and 220 cm long) provides a sensitivity curve that matches very well to the average of the XCAT phantom for scanners with an AFOV from 22 cm to 220 cm.
Figure 1:
(a) Sensitivity ratio of nine ROIs (red dots) in the XCAT phantom as a function of axial FOV. (b) Sensitivity ratio of XCAT simulation (averaged over the nine ROIs) and water cylinder phantom (D=20 cm) as a function of axial FOV. The reference scanner is the 22-cm long 4R scanner.
2.3. Evaluation studies
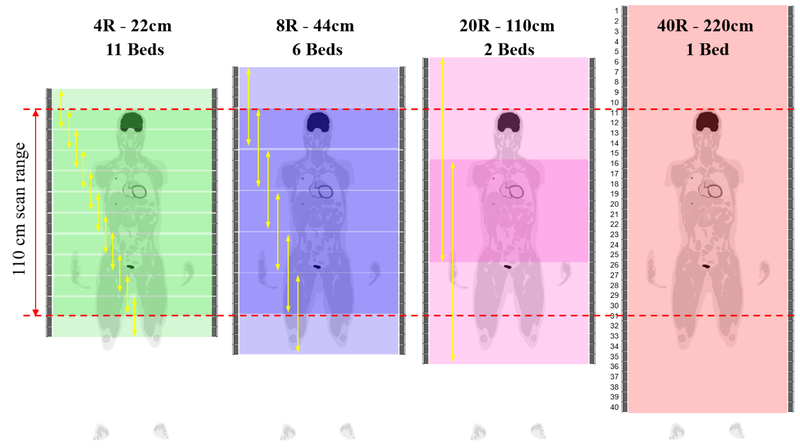
We focus on the clinical whole-body oncology imaging scenario to image an extended axial scan range of 110 cm. This corresponds to an “vertex to thighs” FDG scan protocol frequently used in cancer imaging. Quantification performance for single-bed imaging scenario can be found in our previous work (Zhang et al 2017c). In the experiments, we did not restrict the maximum acceptance ring difference and all detected events from each scanner were used. For scanners with a shorter axial FOV, multiple bed positions with 50% axial overlap were used. Specifically, the number of bed positions were 11 for 4R, 6 for 8R, 2 for 20R, and 1 for 40R. We did not include the 20R single-bed scan, because its sensitivity drops to zero at the edge of the 110-cm scan range. Figure 2 illustrates the scan protocols of the extended 110-cm scan range imaging. The total scan time was kept the same. In all imaging scenarios, we evaluated the CRC versus variance curve for quantifying a 2-mm ROI (one cubic voxel) and 10-mm ROI (5×5×5 cubic voxels) at the radial center, but different axial positions. Because the relative performance between scanners is independent of the ROI contrast according to the theoretical equations, we set the activity ratio between each ROI and the background to 2:1 in all comparisons. Two TOF resolutions (500 ps and 320 ps) and two DOI resolutions (10 mm and 4 mm) were simulated and compared with the non-TOF and no DOI scanners. The 500 ps TOF was commonly available in commercial PET scanners (Jakoby et al 2011) and 320 ps TOF has also been reported in recent published work (Peng et al 2015, Miller et al 2015, Zhang et al 2018a). The choice of DOI resolutions also covered the range that had been reported in the literature (Du et al 2018, Zhang et al 2013a, Zhang et al 2013b). Two different activity levels, 20 MBq and 370 MBq, were investigated to represent a low dose and a regular clinical dose studies, respectively.
Figure 2:
Comparison studies of extended 110 cm scan range imaging using 4, 8, 20, 40 block rings (4R, 8R, 20R, 40R). Multiple-bed scan protocol (50% overlap) were used for shorter scanners.
2.4. Scatters and randoms estimation
We used SimSET software package to estimate the scatter mean. Because of the relatively smooth nature of the scatter sinogram, we grouped the detected scatter events in detector block pairs, used a coarse TOF bin (225 ps), and then interpolated between adjacent LORs (and TOF bins) to calculate the mean for each event (Zhang et al 2014b, Zhang et al 2017a).
We use a Poisson random variable with the mean to simulate the randoms rate in each LOR, where Si and Sj are the singles rates of crystals i and j, respectively, and is a ring-difference dependent variable coincidence timing window (CTW) which we used to reduce the number of random events in nonTOF data along the oblique LORs. To calculate the CTW for an event with ring difference L, we use the formula , where D is the diameter of transaxial FOV (e.g. 60 cm), and c is the speed of light in a vacuum. The resulting CTWs for the events with ring difference of 4R, 8R, 20R, and 40R are 4.26, 4.96, 8.35, and 15.20 ns, respectively. The CTW for the 4R scanner is similar to the value used in the Siemens mCT scanner (Jakoby et al 2011). For TOF data, the formula of random mean in each timing bin is with as the timing bin size which is 25 ps in our simulated study. Note that this singles rate based formula assumes taking all possible coincidence pairs in case of multiple (>2) hits within a CTW.
To estimate the singles rates, we ran a SimSET simulation in ‘SPECT’ mode and then doubled the event rates to get the singles rates for PET. The 176Lu source in L(Y)SO cannot be simulated directly using SimSET. Instead we used a measured singles rate of 105 cps/cc (within the energy window of 435 to 650 keV) based on Siemens mCT block detectors (Berg et al 2016). Therefore, the singles rate from L(Y)SO background is about 33.6 cps per crystal (volume of 0.32 cm3), which was added to the singles rates from the emission object.
3. Results
3.1. Axial sensitivity
Figure 3 shows the comparison of sensitivity along the axial axis provided by different scanners for imaging an extended axial scan range of 110 cm without and with object attenuation. All the curves are normalized to the maximum sensitivity of the 4-ring scanner (4R). Figure 3(b) shows the relatively uniform sensitivity across the 110-cm axial FOV for 40R, and is due to the attenuation effect through the long cylinder phantom. Overall, the 40R geometry offers ~30-fold higher sensitivity over the 4R scanner for the 110 cm scan range, and ~10 and 1.4~2.8-fold higher sensitivity over the 8R and 20R scanners, respectively. Note that the axial sensitivity profiles of 20R and 40R scanners do not follow a triangular shape for a single bed position even without consideration of object attenuation (see (Zhang et al 2017c)) because the solid angle is not a linear function of the axial length. As a result, there are noticeable variations in the 20R sensitivity profile with 50% bed overlap. While a 30% bed overlap would improve the axial uniformity of the 20R scanner, this would reduce the overall sensitivity within the 110-cm scan range and hence the overall performance of the 20R scanner. For a comprehensive comparison, we evaluated the quantification performance for an ROI located at both the maximum (best) and minimum (worst) sensitivity locations inside the 110-cm axial scan range for each scanner.
3.2. ROI quantification
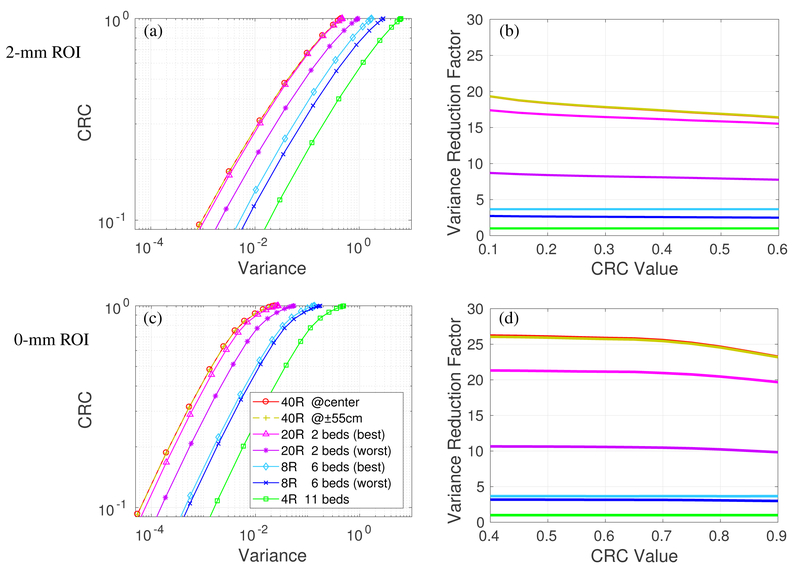
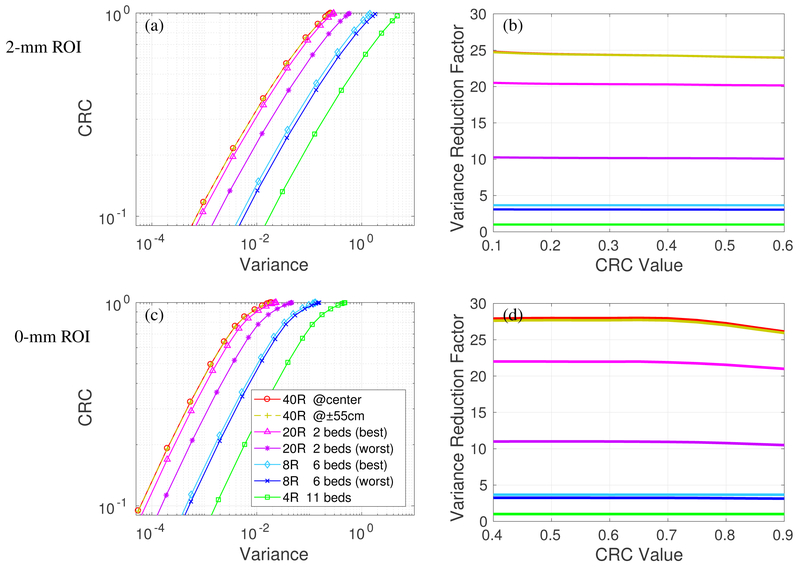
We first consider detectors with 500 ps TOF and no DOI. Figure 4(a) shows the CRC vs. variance of the 4 scanners for imaging the 2-mm ROI in the cylinder with 370 MBq total activity. Each curve was obtained by varying the regularization parameter β and represents the performance of the PML reconstruction at convergence. All prompt events (trues + scatters + randoms) were included for analysis. We can see almost overlapping curves for the 40R at center and 55-cm axial offset, indicating that the 2-meter long scanner can provide very uniform image quality over the central 110-cm axial scan range. The performance of the 20R is worse than that of the 40R scanner. The best and worse CRC vs. variance curves of the 20R with 2 beds have a large gap, due to the sensitivity variation shown in figure 3(b). While the gap can be reduced by using a 30% bed overlap, the average performance would also be reduced due to the reduction in the overall sensitivity in the 110-cm scan range.
Figure 4:
Quantification performance of the four scanners with 500 ps TOF and no DOI detectors. All prompt events (true+scatters+randoms) are considered. CRC vs. variance curves of a 2-mm ROI (a) and 10-mm ROI (c); Variance reduction factor for different scanners over the 4R reference scanner for 2-mm ROI (b) and 10-mm ROI (d).
For an easier comparison, figure 4(b) plots the variance reduction factor of different scanners over the 4R scanner. We can see that the 40R has a ~ 19-fold gain over the 4R for the 2-mm ROI at CRC level of 0.1 and this gain reduces to ~ 16 at a CRC level of 0.6. The decrease is due to the fact that LORs with larger ring difference suffer more crystal penetration effect and have worse axial resolution than LORs with less ring difference. As a result, they are less useful for high resolution (2-mm ROI with high CRC) imaging.
Figure 4(c) shows the CRC vs. variance curves of the 4 scanners for imaging the 10-mm ROI, and Figure 4(d) shows the variance reduction factor curves. We can see that for imaging the 10-mm ROI across an extended axial FOV, the 40R has a ~26-fold gain over the 4R, ~8-fold gain over the 8R, and 1.2~2.4-fold gain over the 20R. The variance reduction gain is higher for the larger 10-mm ROI than that for the 2-mm ROI due to less impact from the axial parallax error of oblique LORs.
3.3. Effect of DOI
Figure 5 shows the CRC vs. variance curves and the variance reduction factor curves for the scanners using detectors with 500 ps TOF and 4-mm DOI. Adding DOI information does not change the performance of 8R and 4R scanners because the ROIs are at the radial center. However, the performance of 20R and 40R scanners is substantially improved by using DOI detectors, especially for the 2-mm ROI. The variance reduction factors of the 40R scanner increased from 17 (no DOI) to 24 (4-mm DOI) for imaging the 2-mm ROI (CRC=0.5) and the difference between 40R and 20R also becomes larger. We can see that even though the ROI is located at the radial center, DOI can still improve the ROI quantification by reducing axial parallax error.
Figure 5:
Quantification performance of the four scanners with 500 ps TOF and 4-mm DOI detectors. All prompt events (true+scatters+randoms) are considered. CRC vs. variance curves of 2-mm ROI (a) and 10-mm ROI (c); Variance reduction factor of different scanners over the 4R reference scanner for 2-mm ROI (b) and 10-mm ROI (d).
Since the variance reduction factor remains relatively stable over a wide range of CRC values, we will show only the variance reduction factor at CRC=0.5 hereinafter. We also used the average of the best and worse cases of each scanner for easy comparison.
3.4. Effect of scatters and randoms
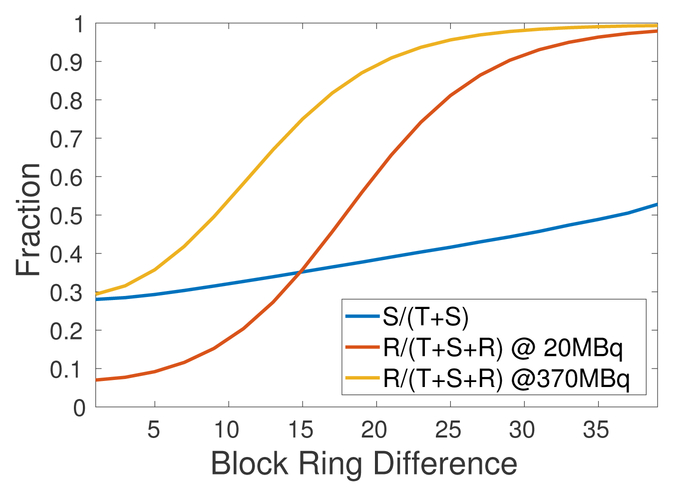
Figure 6 shows the scatter fraction (SF=S/(T+S)) and random fraction (RF=R/(T+S+R)) as a function of block ring difference. The random fraction was examined at two activity levels (20 MBq and 370 MBq). As described in Section 2.4, random event rate was calculated using the ring-difference dependent CTW. We see that both scatter faction and random fraction increase as the block ring difference increases and LORs with block ring difference greater than 20 mostly contain random events, even at low activity level (20 MBq) due to 176Lu background radiation.
Figure 6:
Scatter fraction (SF=S/(T+S)) and random fraction (RF=R/(T+S+R)) as a function of block ring difference. Random fraction was examined at two activity levels (20 MBq and 370 MBq).
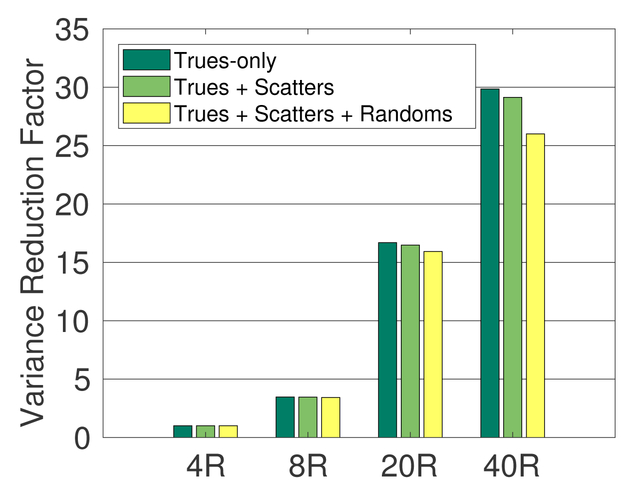
To evaluate the effect of the scatters and randoms, we computed the CRC and variance using events of trues-only, trues + scatters, trues + scatters + randoms, separately. Figure 7 shows the variance reduction factors for the 10-mm ROI using the 500 ps TOF scanners without DOI. The total activity was 370 MBq and the 4R scanner was used as the reference. Clearly the variance reduction factors of trues-only are higher than those of including scatters and randoms. The performance gain of long AFOV scanners reduces slightly when scatters and randoms are included due to higher scatter and random fractions in more oblique LORs as shown in figure 6.
Figure 7:
Variance reduction factor (CRC=0.5) of 8R, 20R, 40R scan over the 4R scan for trues-only, trues + scatters, and trues + scatters + randoms, respectively, for 10-mm ROI. All scanners are with 500 ps TOF and no DOI.
3.5. Effects of TOF and DOI
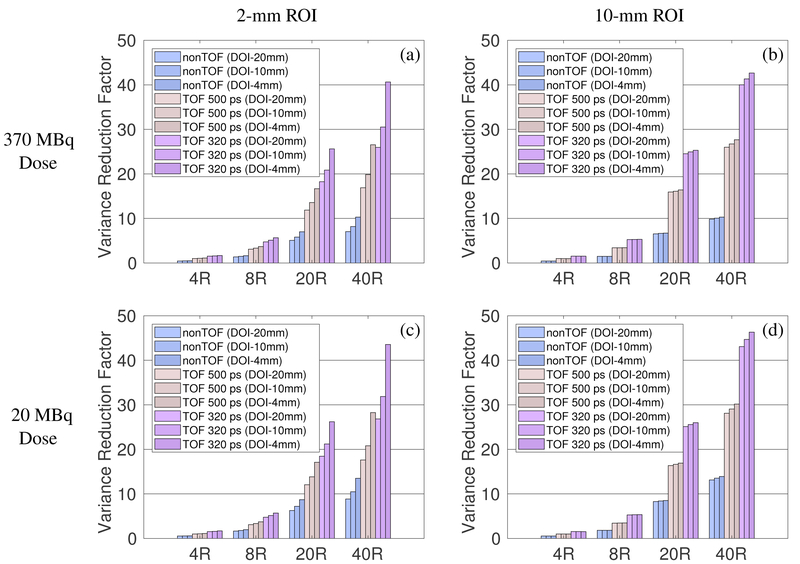
Using the 4R scanner with 500 ps TOF and no DOI (similar to Siemens mCT scanner) as the reference, we evaluated the performance gain of long AFOV scanners with different TOF and DOI resolutions, for all prompt events. Figure 8 plots the variance reduction factors for imaging a 2-mm ROI and 10-mm ROI over the 110-cm axial scan range using different scanners. The effect of TOF is more substantial than that of DOI, especially for larger ROIs. Furthermore, TOF improvement is nearly independent of ROI size and the length of the scanner: 320 ps TOF achieves ~3-fold variance reduction ratio over nonTOF, and ~ 1.6-fold over 500 ps TOF. In comparison, better DOI resolution produces higher gain for longer scanners than for shorter scanners. This is due to the reduction of the axial parallax error for oblique LORs with DOI. Combining 320 ps TOF and 4 mm DOI, the 220-cm long scanner offers a ~44-fold variance reduction over the 22-cm reference scanner (500 ps TOF, no DOI) for imaging a 2-mm ROI and ~47-fold variance reduction for imaging a 10-mm ROI.
Figure 8:
Variance reduction factor for imaging a 2-mm ROI (left) and 10-mm ROI (right) across the 110-cm axial scan range using different scanners over the 4R 500 ps non-DOI reference scanner. Top row: 370 MBq total activity. Bottom row: 20 MBq total activity.
3.6. Effect of activity level
In addition to the normal activity level of 370 MBq, we also simulated low-dose imaging with 20 MBq total activity. The results are shown in Figure 8 for comparison. We can see that the performance gains of long AFOV scanners over the 22-cm long scanner are slightly higher at the low activity (20 MBq) than at the normal activity (370 MBq) level because the random fractions are lower at the low activity level. However, due to the intrinsic background radiation of 176Lu in the L(Y)SO crystal, the effect of randoms cannot be completely eliminated by further reducing the injected activity.
4. Discussion
In this paper, we used theoretical analysis to evaluate the PET quantification performance gain of long AFOV scanners for a clinically relevant scan range. For a specific TOF and DOI resolution, the 220-cm long scanner offers a 17~28-fold variance reduction for imaging an extended 110-cm axial scan range over the 22-cm scanner. The 220-cm long scanner also offers a 1.2~2.4-fold improvement over a 110-cm long scanner (2 beds). These theoretical results are congruent with our previous Monte Carlo simulation studies comparing the EXPLORER scanner with a 4-ring scanner, where we obtained a variance reduction factor of ~4.2 for static torso imaging and ~47 for total-body imaging (Zhang et al 2017a). The larger gain in the referenced study is because a longer scan range of 2-m was examined in the comparison.
There are some limitations in this study. Firstly, we only investigate the ROI along the central axial axis of the FOV. This setup is sufficient for the evaluation of relative performance between long AFOV scanners and short AFOV scanners. While the radially centered ROIs do not suffer parallax error in the transaxial plane, we can still observe the benefit of DOI in long AFOV scanners. However, the importance of DOI is underestimated for this reason. To completely understand the importance of DOI, radially off-centered ROIs should also be considered. Secondly, dead-time and pulse pile-up effect were not modeled and we assumed the prompts and singles rates are linearly related to the total activity, excluding the intrinsic LSO background radiation. This assumption is valid for the simulated activity level (~3.7 kBq/cc) according to published data for mCT scanners (Jakoby et al 2011, Poon et al 2012). Although this may not hold for higher activity levels, we expect these detector level effects are independent of the AFOV of a scanner and hence do not affect the performance gain of long AFOV scanners. Thirdly, we used a 20-cm diameter uniform cylinder as the background to match the average sensitivity gain of the XCAT phantom. However, the sensitivity gain, as well as scatters and randoms, will be dependent on surrounding tissues and organs in a real patient. Therefore, the variance reduction factor obtained in this paper should be treated as a rough estimate of the average performance gain and the exact the variance reduction factor in a real scan will depends on a number of factors, including spatial location, activity distribution, and attenuation of surrounding tissue. Lastly, equations (5)–(9) are for fully converged penalized ML reconstruction with an accurate system model. In practice, reconstruction algorithms may be terminated before convergence due to various reasons. The effects of early termination and modeling error are not examined in this study.
5. Conclusion
In this work, we have theoretically evaluated the benefit on ROI quantification for long axial FOV scanners. The comparison results show that the 220-cm scanner with 320-ps TOF and 4-mm DOI offers up to a factor of ~45-fold variance reduction for imaging the 2-mm and 10-mm ROI within an extended 110-cm axial scan range over an existing 22-cm long scanner with 500-ps TOF and no DOI. The TOF gain is nearly independent on the scanner axial length and ROI size, while the DOI capability mostly benefits small ROIs. Our future work will include further validation using experimental data.
Acknowledgments
This work was funded by the National Institutes of Health under grant number R01-CA170874, R01-CA206187 (co-funded by the NCI, NIBIB and the Office of the Director), R01-EB000194 and a UC Davis Research Investment in Science and Engineering Program (RISE) award. We would like to thank Drs. Jian Zhou and Kuang Gong for the system matrix builder and forward/back projectors used in this study.
References
- Badawi RD, Poon JK, Surti S, Zhang X, Karp JS, Moses WW, Qi J, Graham M, Mankoff D, Wahl RL, Jagust W, Budinger TF, Jones T, Cherry SR 2013. EXPLORER - an ultrasensitive total-body PET scanner: application feasibility simulations World Molecular Imaging Congress. LBAP125 [Google Scholar]
- Badawi RD, Liu W, Berg E, Lv Y, Xu T, An S, Dong Y, Zhang X, Judenhofer MS, Qi J, Jones T, Tarantal AF, Bao J, Li H and Cherry SR 2018. Progress on the EXPLORER project: towards a total body PET scanner for human imaging J. Nucl. Med 59 (suppl) [Google Scholar]
- Berg E, Zhang X, Bec J, Judenhofer MS, Peng Q, Kapusta M, Schmand M, Casey M, Qi J, Badawi RD, and Cherry SR 2016. Evaluation of a long axial field-of-view PET scanner for non-human primates IEEE Nucl. Sci. Symp. Conf. Rec MO6-4 [DOI] [PMC free article] [PubMed] [Google Scholar]
- Berg E, Zhang X, Bec J, Judenhofer MS, Patel B, Peng Q, Kapusta M, Schmand M, Casey M, Tarantal AF, Qi J, Badawi RD, and Cherry SR 2018. Development and evaluation of mini-EXPLORER: a long axial field-of-view PET scanner for non-human primate imaging J. Nucl. Med doi: 10.2967/jnumed.117.200519 [DOI] [PMC free article] [PubMed] [Google Scholar]
- Berg E, Zhang X, Gill H, Tarantal AF, Williams S, and Cherry SR 2018. Imaging and quantification of 89Zr-labeled antibodies up to 30 days post-injection in rhesus monkeys using the mini-EXPLORER PET scanner J. Nucl. Med. 59 (suppl) [Google Scholar]
- Cherry SR 2004. In vivo molecular and genomic imaging: new challenges for imaging physics Phys. Med. Biol 49 R13–R48 [DOI] [PubMed] [Google Scholar]
- Cherry SR, Badawi RD, Karp JS, Moses WW, Price P, and Jones T 2017. Total-body imaging: transforming the role of positron emission tomography Sci. Transl. Med 9 eaaf6169. [DOI] [PMC free article] [PubMed] [Google Scholar]
- Conti M 2006. Effect of randoms on signal-to-noise ratio in TOF PET IEEE Trans. Nucl. Sci. 53 1188–1193 [Google Scholar]
- Du J, Bai X, Gola A, Acerbi F, Ferri A, Piemonte C, Yang Y and Cherry SR 2018. Performance of a high-resolution depth-encoding PET detector module using linearly-graded SiPM arrays Phys. Med. Biol In press [DOI] [PMC free article] [PubMed] [Google Scholar]
- Harrison RL, Vannoy SD, Haynor DR, Gillispie SB, Kaplan MS, and Lewellen TK 2006. Design and implementation of a block detector simulation in SimSET IEEE Nucl. Sci. Symp. Conf. Rec. 5 3151–3153 [DOI] [PMC free article] [PubMed] [Google Scholar]
- Isnaini I, Obi T, Yoshida E, and Yamaya T 2014. Monte Carlo simulation of sensitivity and NECR of an entire-body PET scanner Radiol. Phys. Technol 7 203–210 [DOI] [PubMed] [Google Scholar]
- Jakoby BW, Bercier Y, Conti M, Casey ME, Bendriem B, and Townsend DW 2011. Physical and clinical performance of the mCT time-of-flight PET/CT scanner Phys. Med. Biol 56 2375–2389 [DOI] [PubMed] [Google Scholar]
- Karp JS, Geagan MJ, Muehllehner G, Werner ME, McDermott T, Schmall JP, Viswanath V, Perkins AE, and Tung C-H 2017. The PennPET Explorer scanner for total body applications IEEE Nucl. Sci. Symp. Conf. Rec M-09–1 [Google Scholar]
- Lv Y, Lv X, Liu W, Judenhofer MS, Cherry SR, and Badawi RD 2017. Mini-EXPLORER II - a prototype high-sensitivity PET/CT scanner for human brain and companion animal scanning IEEE Nucl. Sci. Symp. Conf. Rec DBIS-01–3 [DOI] [PMC free article] [PubMed] [Google Scholar]
- MacDonald LR, Harrison RL, Alessio AM, Hunter WCJ, Lewellen TK, Kinahan PE 2011. Effective count-rates for PET scanners with reduced and extended axial field of view. Phys. Med. Biol. 56 3629–3643 [DOI] [PMC free article] [PubMed] [Google Scholar]
- Miller M, Zhang J, Binzel K, Griesmer J, Laurence T, Narayanan M, Natarajamani D, Wang S and Knopp M 2015. Characterization of the Vereos Digital Photon Counting PET System J. Nucl. Med 56 (suppl 3) 434 [Google Scholar]
- Peng Q, Choong W-S, Vu C, Huber JS, Janecek M, Wilson D, Huesman RH, Qi J, Zhou J, Moses WW 2015. Performance of the Tachyon Time-of-Flight PET Camera IEEE Trans. Nucl. Sci. 62 111–119 [DOI] [PMC free article] [PubMed] [Google Scholar]
- Poon JK, Dahlbom ML, Moses WW, Balakrishnan K, Wang W, Cherry SR, and Badawi RD 2012. Optimal whole-body PET scanner configurations for different volumes of LSO scintillator: a simulation study Phys. Med. Biol 57 4077–4094 [DOI] [PMC free article] [PubMed] [Google Scholar]
- Poon JK 2013. The performance limits of long axial field of view PET scanners Ph.D. thesis, University of California, Davis [Google Scholar]
- Poon JK, Dahlbom ML, Casey ME, Qi J, Cherry SR, and Badawi RD 2015. Validation of the SimSET simulation package for modeling the Siemens Biograph mCT PET scanner Phys. Med. Biol 60 N35–N45 [DOI] [PubMed] [Google Scholar]
- Qi J and Leahy RM 1999. A theoretical study of the contrast recovery and variance of MAP reconstructions from PET data IEEE Trans. Med. Imaging 18 293–305 [DOI] [PubMed] [Google Scholar]
- Qi J and Leahy RM 2000. Resolution and noise properties of MAP reconstruction for fully 3D PET IEEE Trans. Med. Imaging 19 493–506 [DOI] [PubMed] [Google Scholar]
- Qi J and Huesman RH 2006. Theoretical study of penalized-likelihood image reconstruction for region of interest quantification IEEE Trans. Med. Imaging 25 640–648 [DOI] [PubMed] [Google Scholar]
- Segars WP, Sturgeon G, Mendonca S, Grimes J, Tsui BMW 2010. 4D XCAT phantom for multimodality imaging research Med. Phys 37 4902–4915 [DOI] [PMC free article] [PubMed] [Google Scholar]
- SimSET: Random Coincidence Simulation. http://depts.washington.edu/simset/html/simset_main.html.
- Surti S, Werner ME, and Karp JS 2013. Study of PET scanner designs using clinical metrics to optimize the scanner axial FOV and crystal thickness Phys. Med. Biol 58 3995–4012 [DOI] [PMC free article] [PubMed] [Google Scholar]
- Surti S, and Karp JS 2015. Impact of detector design on imaging performance of a long axial field-of-view, whole-body PET scanner Phys. Med. Biol 60 5343–5358 [DOI] [PMC free article] [PubMed] [Google Scholar]
- Viswanath V, Daube-Witherspoon ME, Schmall JP, Surti S, Werner ME, Muehllehner G, Geagan MJ, Perkins AE, and Karp JS 2017. Development of PET for total-body imaging Acta Phys. Pol. B 48 1555–1566 [Google Scholar]
- Zhang X, Stortz G, Sossi V, Thompson CJ, Retière F, Kozlowski P, Thiessen JD, and Goertzen AL 2013. Development and evaluation of a LOR-based image reconstruction with 3D system response modeling for a PET insert with dual-layer offset crystal design Phys. Med. Biol 58 8379–8399 [DOI] [PubMed] [Google Scholar]
- Zhang X, Thompson CJ, Thiessen JD, and Goertzen AL 2014b. Simulation studies of a phoswich PET detector design with a two-fold improvement in spatial sampling IEEE Nucl. Sci. Symp. Conf. 1–4 [Google Scholar]
- Zhang X, Zhou J, Wang G, Poon JK, Cherry SR, Badawi RD and Qi J 2014. Feasibility study of micro-dose total-body dynamic PET imaging using the EXPLORER scanner J. Nucl. Med 55 (Supplement 1):269 [Google Scholar]
- Zhang X, Zhou J,Badawi RD and Qi J 2014b. Fully 3D image reconstruction and quantitative correction for a total-body PET scanner IEEE Nucl. Sci. Symp. Conf. M20–6 [Google Scholar]
- Zhang X, Zhou J, Cherry SR, Badawi RD, and Qi J 2017. Quantitative image reconstruction for total-body PET imaging using the 2-meter long EXPLORER scanner. Phys. Med. Biol 62 2465–2485 [DOI] [PMC free article] [PubMed] [Google Scholar]
- Zhang X, Berg E, Bec J, Judenhofer MS, Kapusta M, Schmand M, Casey M, Badawi RD, Cherry SR, and Qi J 2017. First pre-clinical study of total-body dynamic PET imaging using the mini-EXPLORER scanner J. Nucl. Med 58 (suppl 1) 394 [Google Scholar]
- Zhang X, Badawi RD, Cherry SR, and Qi J 2017. Theoretical study of benefit of long axial field-of-view PET: impact on quantification performance The 14th International Meeting on Fully Three-Dimensional Image Reconstruction in Radiology and Nuclear Medicine 767–770 doi: 10.12059/Fully3D.2017-11-3104005 [DOI] [Google Scholar]
- Zhang X, Peng Q, Zhou J, Huber JS, Moses WW, and Qi J 2018. Lesion detection and quantification performance of the Tachyon-I time-of-flight PET scanner: phantom and human studies Phys. Med. Biol 63 065010 [DOI] [PMC free article] [PubMed] [Google Scholar]
- Zhang X, Badawi RD, Cherry SR, and Qi J 2018. Development and evaluation of penalized image reconstruction for the total-body EXPLORER J. Nucl. Med 59 (suppl) [Google Scholar]
- Zhou J, and Qi J 2011. Fast and efficient fully 3D PET image reconstruction using sparse system matrix factorization with GPU acceleration. Phys. Med. Biol 56 6739–6757 [DOI] [PMC free article] [PubMed] [Google Scholar]


