Abstract
Diabetic peripheral neuropathy is a common complication associated with diabetes mellitus with a pathogenesis that is incompletely understood. By regulating RNA silencing and post-transcriptional gene expression, microRNAs participate in various biological processes and human diseases. However, the relationship between microRNAs and the progress of diabetic peripheral neuropathy still lacks a thorough exploration. Here we used microarray microRNA and mRNA expression profiling to analyze the microRNAs and mRNAs which are aberrantly expressed in dorsal root ganglia from streptozotocin-induced diabetic rats. We found that 37 microRNAs and 1357 mRNAs were differentially expressed in comparison to non-diabetic samples. Bioinformatics analysis indicated that 399 gene ontology terms and 29 Kyoto Encyclopedia of Genes and Genomes pathways were significantly enriched in diabetic rats. Additionally, a microRNA-gene network evaluation identified rno-miR-330-5p, rno-miR-17-1-3p and rno-miR-346 as important players for network regulation. Finally, quantitative real-time polymerase chain reaction analysis was used to confirm the microarray results. In conclusion, this study provides a systematic perspective of microRNA and mRNA expression in dorsal root ganglia from diabetic rats, and suggests that dysregulated microRNAs and mRNAs may be important promotors of peripheral neuropathy. Our results may be the underlying framework of future studies regarding the effect of the aberrantly expressed genes on the pathophysiology of diabetic peripheral neuropathy.
Introduction
Diabetes mellitus (DM) is one of the most common chronic diseases around the world. Neuropathy, which is the most common chronic and debilitating complication of DM, affects approximately 50% patients with DM, usually causing pain, paresthesia, decreased mobility or even amputation [1]. The pathogenesis of diabetic peripheral neuropathy (DPN) is driven by a complex interplay of factors, such as microvascular damage and metabolic disorders. However, the exact pathophysiological processes and underlying molecular mechanisms still remain obscure [2, 3]. The streptozotocin (STZ)-induced diabetic rat is one of the most widely used diabetic animal models. Diabetic rats share numerous features identical to that of DPN patients, such as neurophysiological, functional and structural changes, and are considered a feasible animal model for studying DPN [4, 5].
MicroRNAs (miRNAs) are a cohort of small non-coding RNAs that contain approximately 22 nucleotides. They negatively regulate protein gene expression post-transcriptionally by binding to complementary sites within the 3’ untranslated region (UTR) of target mRNAs [6]. At least one conserved miRNA-binding site exist in over 60% human protein-coding genes. Taking plenty of non-conserved sites into consideration, it is believed that miRNAs control most protein-coding genes [7]. Therefore, by regulating their target genes, miRNAs are known to be associated with a wide range of human diseases, such as cancer, metabolic diseases and cardiovascular diseases [8]. Specifically, miRNAs play a crucial role in the development and progression of DM and its complications [9]. However, miRNA expression patterns and their pathological effects in DPN still lack systematic evaluation in the literature.
The dorsal root ganglion (DRG) is highly susceptible to diabetic conditions and its response to hyperglycemia leads to diabetic neuropathy [10]. There are numerous studies evaluating gene expression changes in DRGs and their roles in mediating diabetic neuropathy [11, 12], indicating the importance of DRGs in the development of DPN.
In the present study, the main objective was to identify differentially expressed miRNAs and mRNAs in diabetic DRGs, and their relationship with the pathophysiological processes of DPN. We collected DRG tissues from three pairs of STZ-induced diabetic rats and non-diabetic Sprague-Dawley (SD) rats, to conduct mRNA and miRNA expression profiling. Bioinformatics analyses, including Gene Ontology (GO) analysis, Kyoto Encyclopedia of Genes and Genomes (KEGG) pathway analysis, and miRNA-gene-network analysis, were performed to identify the significant functions and signaling pathways of the differentially expressed genes, as well as the key genes in the regulatory network.
Materials and methods
Animals
Twenty healthy male SD rats (180–220 g) were purchased from Experimental Animal Center, Tongji Medical College, Huazhong University of Science and Technology, Wuhan, China. The study was approved by the Animal Ethics Committee of Huazhong University of Science and Technology, and was carried out on the basis of the National Institute of Health Guidelines and Regulations. Rats were raised in separated cages where commercial rat feed and water were available ad libitum, and the room condition was kept at 23±1°C temperature, 40% humidity, and 12 hours day and night cycle as previously described [13]. The cage bedding was changed at least once a day according to the wetness of the cage bedding. The body weight was measured once a week, and the food and water intakes were measured every 2 weeks. Rats were allowed to adapt the surroundings for 1 week before the experiment was started.
Induction of diabetes mellitus
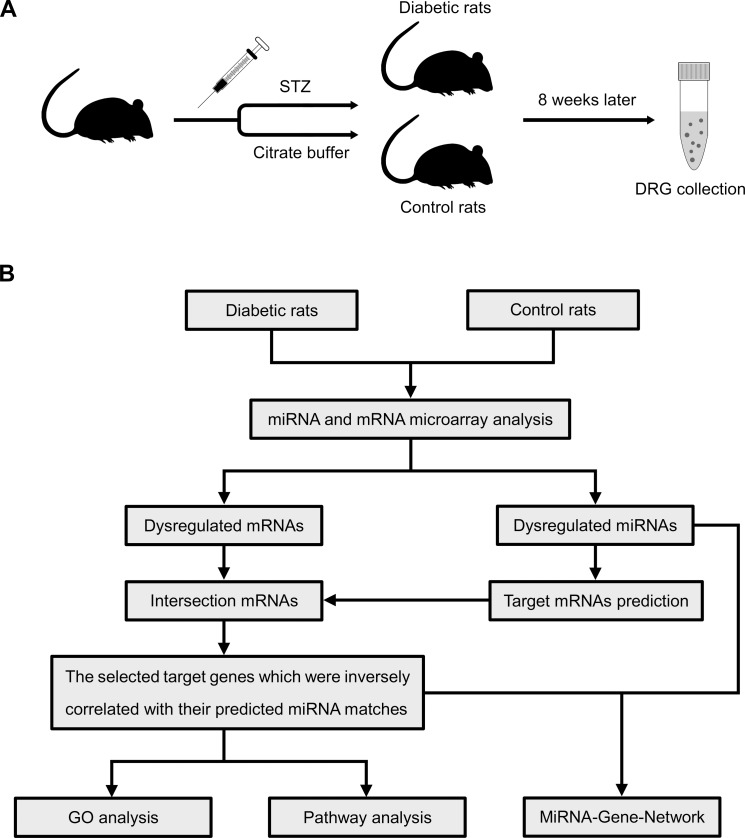
The SD rats were randomly divided into diabetic and control groups (n = 10 in each group) (Fig 1A). After a 12-hour fast, the diabetic group rats were induced by a single intraperitoneal injection of STZ (Sigma-Aldrich, St. Louis, MO, USA) at a dose of 65 mg/kg body weight, and STZ was dissolved in citrate buffer (0.1 M, pH 4.4 at 4°C) immediately before injection [13]. The control rats received an injection of an equal volume of vehicle (citrate buffer) alone. Seven days after STZ injection, nonfasting blood glucose levels were measured on tail vein blood to confirm diabetic status with a glucometer (ACCU-CHEK® Active, Roche, Mannheim, Germany). The diabetic group rats with glucose levels less than 16.7 mM were excluded from this study. Rats were kept for 8 weeks following STZ injection to allow for DPN development and the glucose levels were measured once every four weeks. During this period, the diabetic rats which had significant body weight loss (cachexia) would also be excluded from this study. All excluded rats would be sacrificed using sodium pentobarbital anesthesia.
Fig 1. Schematic of the procedure of diabetic induction and microarray-based expression analysis.
(A) Schematic overview of the procedure of diabetic rat induction and sample collections; (B) A flow chart of miRNA and mRNA microarray analysis applied in this study.
Assessment of diabetic peripheral neuropathy
Mechanical allodynia is one of the common used behavioral indicators of DPN [14], and was assessed by testing the withdrawal threshold of the hind paws using an Electronic Von Frey device (cat. no. 38450; Ugo Basile, Gemonio, Italy) [15]. Briefly, rats were placed individually in plexiglass boxes equipped with a wire mesh floor to acclimate to the testing environment for 10 min, or enough time to cease exploratory behavior. Next, the device with a metal tip was applied through the mesh spaces to approach the plantar surface of the hind paws. The positive responses to the mechanical stimulation included sudden withdrawal, shaking, and licking of the stimulated paw, voluntary movements associated with locomotion were excluded. Both hind paws of each rat were tested, and each hind paw was tested 5 times with a 1 min interstimulus interval. The withdrawal threshold of one rat was calculated by the average force applied to both hind paws. Measurements were taken 8 weeks after STZ induction.
RNA isolation
After the behavioral test was completed, the animals were killed by cervical dislocation and decapitation under sodium pentobarbital anesthesia. For each rat, bilateral L3-L6 DRGs were collected and pooled together as one single sample, which was immediately submerged in RNAlaterTM Stabilization Solution (Thermo Fisher Scientific, Vilnius, Lithuania). Each sample was stored at 4°C overnight, followed at -80°C until RNA extraction. Total RNA was extracted from DRG tissues using miRNeasy mini kit (Qiagen, Dusseldorf, Germany) in compliance with the manufacturer's protocol. RNA quality and concentration were determined by NanoDrop ND-1000 spectrophotometer (Thermo Fisher Scientific, Waltham, MA, USA), and RNA integrity was assessed by formaldehyde-agarose gel electrophoresis.
miRNA and mRNA microarray experiments
Three diabetic rats and three control rats were chosen randomly for microarray analysis. To identify the differentially expressed miRNAs and mRNAs in diabetic and control rat DRGs, the Affymetrix GeneChip miRNA 4.0 Array and Affymetrix GeneChip Rat Transcriptome Array 1.0 were employed, respectively. The miRNA and mRNA microarray experiments and bioinformatics analysis were conducted by Genminix Informatics Co. Ltd. in Shanghai, China. The original microarray data are available at NCBI Gene Expression Omnibus with GEO Series accession number GSE110234.
Strategy
As shown in Fig 1B, an approach with several steps was applied to analyze the dysregulated miRNA and mRNA in diabetic rats. Briefly, the random variance model (RVM) t-test was used to find out the differentially expressed miRNAs and mRNAs, which could raise degrees of freedom in small sample sizes [16], our filtering criteria were P-value<0.05 and fold-change>1.2. Then, we utilized the miRanda database to predict the potential target genes of the differentially expressed miRNAs. The intersection genes between differentially expressed mRNAs and predicted target genes were chosen. And then we collected those which were inversely correlated with their predicted miRNA matches, called the selected target genes. They were used for the following bioinformatics analyses.
Bioinformatics analyses
Several bioinformatics analyses were performed including GO analysis, pathway analysis and miRNA-gene-network analysis. GO analysis was used to analyze the main biological function of the selected target genes. The GO database (http://www.geneontology.org) is a useful tool to organize the selected target genes into hierarchical categories (GO terms), and uncover their molecular mechanisms and biological functions [17]. A two-sided Fisher's exact test was applied to identify the significance of GO terms with P-value<0.05. The enrichment score of the GO terms was calculated as previously described [18]. Similarly, according to KEGG database (http://www.genome.jp/kegg/), we identified the significant pathways of the selected target genes. A Fisher's exact test was also used with P-value<0.05.
Additionally we combined the differentially expressed miRNAs and the selected target genes, to build the miRNA-gene-network. The relationship between the differentially expressed miRNAs and the selected target genes were evaluated according to their differential expression values, and their predicted interactions based on the Sanger miRNA database (http://www.mirbase.org/). The degree of connectivity determines the number of mRNAs regulated by a designated miRNA or the number of miRNAs which regulate a given mRNA. The larger degree of connectivity that a given miRNA or mRNA has, the more important role it plays in the regulatory network [19].
Quantitative real-time PCR analysis
The experiment was conducted using CFX Connect Real-Time PCR detection system (Bio-Rad, USA) according to the manufacturer’s instructions on an accompanying software (CFX Manager Software). For miRNA, The M-MLV Reverse TranscriptaseiTaqTM (cat. no. M170A; Promega, USA) was used for reverse transcription; for mRNA, cDNA synthesis was conducted using the iScript cDNA Synthesis Kit (cat. no. 1708890; Bio-Rad, USA). The iTaqTM universal SYBR Green Supermix (cat. no. 1725124; Bio-Rad, USA) was used for quantitative detection. The miRNA and mRNA specific primers were chemically synthesized by Tianyi Huiyuan Bioscience and Technology Corporation (Beijing, China) and were listed in S1 Table. The relative expression of miRNA and mRNA were determined by U6 and GAPDH expression levels, respectively, and were calculated using the 2-ΔΔCT method. All reactions were conducted in triplicate.
Statistical analysis
The continuous variables were presented as mean±standard error (SE). To compare between two groups, the student’s t-test was used. A P-value<0.05 was considered statistically significant.
Results
Abnormalities in rats injected with STZ
One rat from diabetic group was excluded from this study because the glucose level did not meet our criterion, the rest were used in the present study. After 8 weeks following STZ injection, the nonfasting blood glucose levels, body weight and withdrawal threshold were measured to re-confirm the DPN rats were successfully induced. The nonfasting blood glucose levels of diabetic rats were greater (27.7±0.9 mM, n = 9, P<0.05) compared to control rats (5.8±0.2 mM; n = 10). The weight of diabetic rats was lower (241±11 g, n = 9, P<0.05) than that of control rats (497±8 g, n = 10). The withdrawal threshold of diabetic rats had decreased (13.8±0.6 g, n = 9, P<0.05) relative to that of control rats (26.4±0.2 g, n = 10), indicating mechanical allodynia. Besides, the diabetic rats also had polyphagia, polydipsia, and polyuria (based on the wet cage beddings).
The miRNA and mRNA expression profiles in DRG tissues of diabetic rats
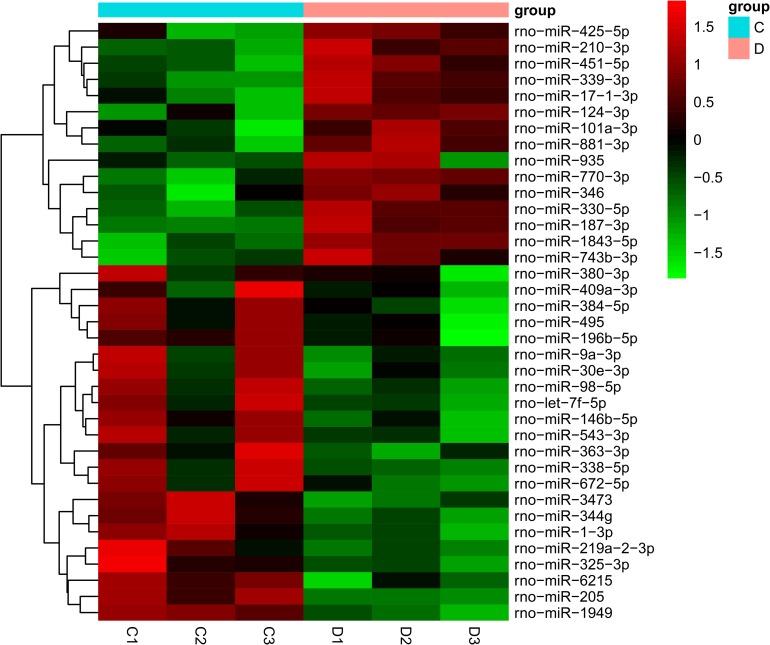
Through microarray-based miRNA expression analysis, 37 miRNAs were found to be significantly differentially expressed in the diabetic group (P<0.05). Specifically, 15 and 22 miRNAs were upregulated or downregulated, respectively (S2 Table). The expression levels of these 37 differentially expressed miRNAs are presented by the hierarchical cluster heat map in Fig 2. The mRNA microarray analysis indicated that the expression of 1357 mRNAs was markedly altered in diabetic rats (P<0.05). In particular, 616 mRNAs were upregulated and 741 mRNAs were downregulated (S3 Table).
Fig 2. The heat map of aberrantly expressed miRNAs in diabetic rats.
A total of 37 significantly deregulated miRNAs were shown in the heat map, with 15 genes up-regulated and 22 down-regulated (n = 3 for diabetic rats and n = 3 for control rats). Red signals and green signals represent upregulated expression and downregulated expression, respectively. C: control rats; D: diabetic rats.
miRNA target gene prediction and selection
By using the miRanda database, the target mRNAs of miRNAs were predicted. We found 10011 predicted target genes (S4 Table) from the 37 dysregulated miRNAs that we identified. The selected target genes, as described above, were obtained containing 277 target genes (S5 Table), and were used for following analyses.
GO and pathway analysis
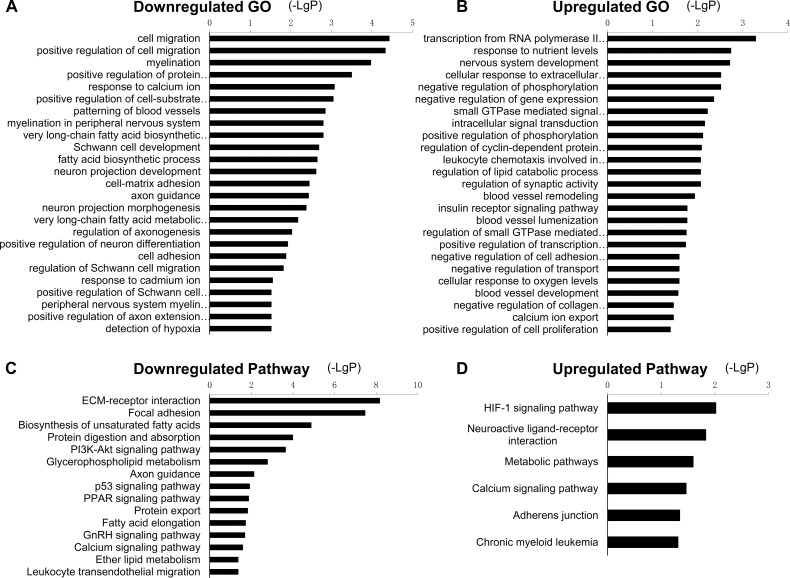
GO and pathway analysis were used to identify significant functions and signaling pathways involving the selected target genes. A total of 399 GO terms were enriched (P<0.05). Specifically, 142 GO terms were upregulated and 257 GO terms were downregulated. A part of down- and upregulated GO terms are shown in Fig 3A and 3B, and full details are shown in S6 Table. As shown in Fig 3A and 3B, three types of the significantly enriched GO terms attracted our special attention. First, the GO terms related to the abnormalities of myelin and axon; second, those involved in blood vessel changes; third, the GO terms associated with the changes of neurons and Schwann cells. These particular GO terms may be important in the development of DPN. According to KEGG pathway analysis, there were 23 downregulated and 6 upregulated enriched pathways (P<0.05) (S7 Table). A fraction of these pathways are presented in Fig 3C and 3D. The top downregulated pathways included the ECM-receptor interaction, focal adhesion, and biosynthesis of unsaturated fatty acids, while the top upregulated pathways included HIF-1 signaling pathway, neuroactive ligand-receptor interaction, and metabolic pathways.
Fig 3. Significant GO terms and pathways of the selected target genes.
(A) GO terms of downregulated target genes. (B) GO terms of upregulated target genes. (C) Pathways of downregulated target genes. (D) Pathways of upregulated target genes. The smaller the P-value, the larger the -LgP.
miRNA-gene-network analysis
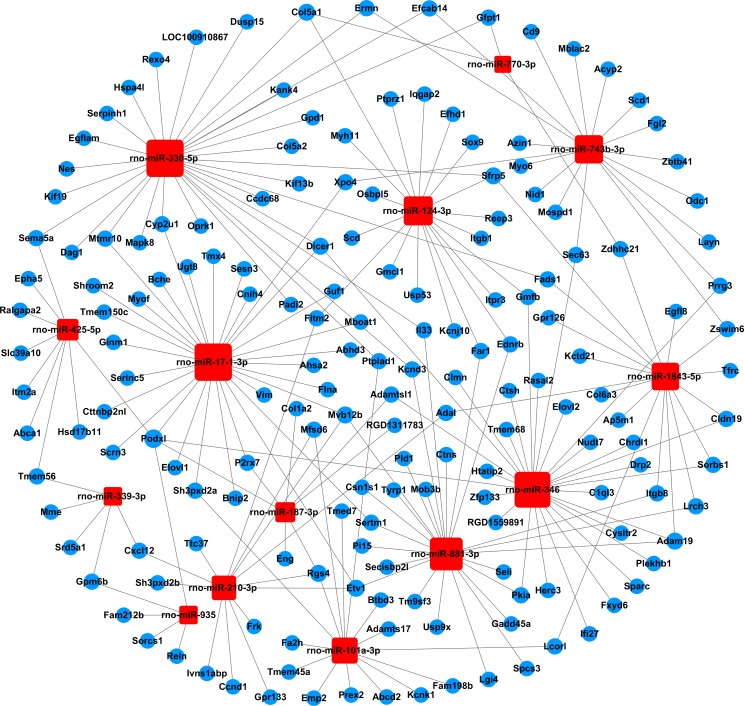
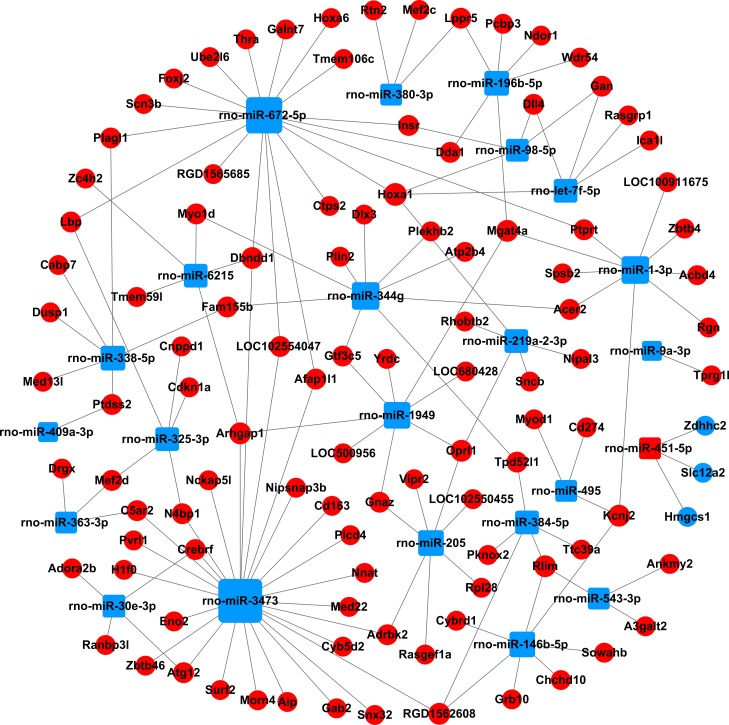
We built a miRNA-mRNA-network combining the differentially expressed miRNAs and the selected target genes, to identify the key miRNAs and mRNAs in the regulatory network (Figs 4 and 5, S8 Table). A total of 37 miRNAs and 277 mRNAs were included in the network. The degree of connectivity was used to discover the key miRNAs and mRNAs in the regulatory network. By analysis of the network, we found rno-miR-330-5p, rno-miR-17-1-3p and rno-miR-346 had a high degree of connectivity. Meanwhile, podocalyxin-like (Podxl, inhibiting cell-cell adhesion) and homeo box A1 (Hoxa1, sequence specific transcription factor) were the most common target mRNAs, and had the highest degrees of connectivity, 5 and 4, respectively.
Fig 4. The miRNA-gene-network based on the upregulated miRNAs and their target mRNAs.
Square nodes and circular nodes represent miRNAs and mRNAs, respectively. Red color and blue color indicate upregulation and downregulation, respectively. A larger size of a node indicates a higher degree of connectivity.
Fig 5. The miRNA-gene-network based on the downregulated miRNAs and their target mRNAs.
Square nodes and circular nodes represent miRNAs and mRNAs, respectively. Red color and blue color indicate upregulation and downregulation, respectively. A larger size of a node indicates a higher degree of connectivity.
qRT-PCR validation
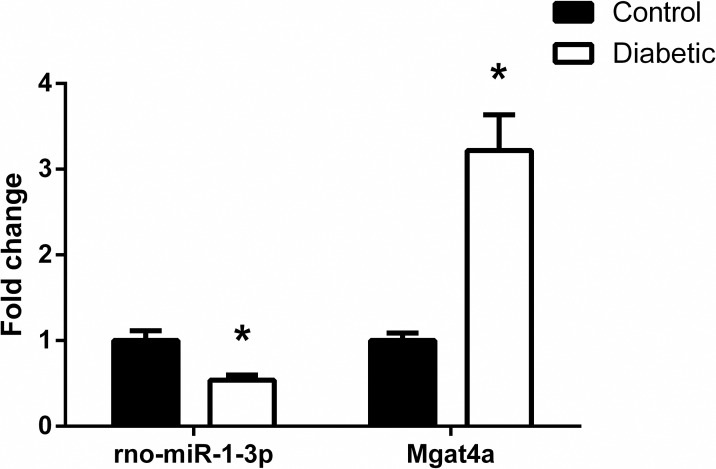
To test our microarray results, qRT-PCR analysis was performed to determine the expression of rno-miR-1-3p and one of its target gene Mgat4a. Compared with control rats, the expression of rno-miR-1-3p was downregulated and target gene Mgat4a was upregulated in diabetic animals (Fig 6), and the trend was in line with the microarray results.
Fig 6. qRT-PCR analysis to validate the microarray results.
Consistent with the microarray results, rno-miR-1-3p was downregulated and target gene Mgat4a was upregulated in diabetic group compared to control group. Results were presented as mean±SE of three independent experiments (*P<0.05). Samples used for qRT-PCR analysis were independent of microarray samples.
Discussion
In the present study, we identified the differentially expressed miRNAs and mRNAs, which may be involved in the development of DPN. Previous investigations were limited on the miRNA expression changes and their relationship with DPN. Cheng et al. have examined the mRNA and miRNA profile alterations in STZ-induced diabetic CD1 mouse model of neuropathy [20], Gong et al. have identified the altered miRNAs in the lumbar spinal dorsal horn from Balb/C mice with diabetic neuropathic pain [21], but both lacking systematic bioinformatics analyses. Here, we focused on the bioinformatics methods to analyze the potential role of aberrantly expressed mRNA and miRNAs in DRGs from STZ-induced diabetic SD rats, to improve our understanding on the relationship between miRNAs and DPN.
Our study applied microarray technology to analyze the differentially expressed genes. Actually, both the microarray technology and the RNA sequencing (RNA-seq) technology are widely used in gene expression research. Compared to microarray, RNA-seq has the advantage to discover novel transcripts, such as novel isoforms and promoters and allele-specific expression. However, the RNA-seq resulting datasets are larger and more complicated, and the interpretation can be challenging [22]. Considering most known lncRNAs had not been studied in DPN, we selected microarray technology to perform our study.
The required sample size for microarray analysis and the success rate of DPN induction were used to estimate the required sample size for our study. As a result, 20 SD rats (10 rats per group) were used. We successfully induced diabetic rats according to the high nonfasting blood glucose levels, polyphagia, polydipsia, polyuria and body weight loss. The minimum duration of diabetes of STZ-injected rats to induce neuropathy can be as early as 2–4 weeks [23]. Consistent with previous studies [24, 25], we chose 8 weeks as our diabetic duration. Also, the paw withdrawal thresholds were significantly reduced in diabetic rats. Taken together, we thoroughly demonstrate that the diabetic rats had developed DPN.
Through GO analysis, we detected 399 GO terms that were significantly enriched. Specifically, the downregulated GO terms including myelination (GO:0042552), myelination in peripheral nervous system (GO:0022011), axon guidance (GO:0007411), regulation of axonogenesis (GO:0050770) were enriched. Interestingly, numerous studies have reported the morphological abnormalities in the myelinated nerve fibers of STZ-induced diabetic rats, such as demyelination, myelin splitting, and axonal atrophy or swelling [26–28].
It is believed that the vascular changes, driven by complex metabolic changes, often lead to the endoneurial hypoxia and blood flow impairment. This could contribute to the pathogenesis of diabetic neuropathy [29]. In agreement with this, our analysis indicated that the upregulated GO terms response to blood vessel remodeling (GO:0001974), blood vessel lumenization (GO:0072554), blood vessel development (GO:0001568), and the downregulated GO terms response to patterning of blood vessels (GO:0001569) and detection of hypoxia (GO:0070483) were enriched.
Additionally, several GO terms related to neurons and Schwann cells were significantly decreased in diabetic rats, for instance, neuron projection development (GO:0031175), neuron projection morphogenesis (GO:0048812), positive regulation of neuron differentiation (GO:0045666), Schwann cell development (GO:0014044), regulation of Schwann cell migration (GO:1900147), and positive regulation of Schwann cell differentiation (GO:0014040). Previous studies have shown that the sensory neurons and Schwann cells in peripheral nervous system are vulnerable to metabolic changes, such as hyperglycemia, dyslipidemia, the oxidative and inflammatory stress. The cell injury caused by these multiple metabolic imbalances eventually leads to the development of diabetic neuropathy [30].
By using the KEGG database, we detected 29 enriched signaling pathways including the HIF-1 signaling pathway, metabolic pathways, calcium signaling pathway, PI3K-Akt signaling pathway, as well as p53 signaling pathway. Both hyperglycemia and hypoxia are two main phenomena of diabetes. Together with common metabolic pathway alterations this could result in complications such as diabetic neuropathy [31]. The master transcription factor hypoxia-inducible factor-1 alpha (HIF-1α) is an important regulator of the expression of multiple target genes, such as vascular endothelial growth factor (VEGF) and erythropoietin. HIF-1α protects tissues from ischemia and infarction, and abnormal response of HIF-1α may be responsible for the changes of diabetic nerve function [32]. Moreover, the tumor-suppressor protein and transcriptional activator p53, is also associated with diabetes and hypoxia, Jazayeri et al. reported that the diabetic ischemia-induced apoptosis is increased through a p53-mediated mechanism [33]. In addition, aberrant calcium (Ca2+) homeostasis and signaling in sensory neurons could potentially affect numerous aspects such as primary afferent conduction, neurotransmitter release, and signal transduction, leading to painful and degenerative diabetic neuropathy [34, 35]. The PI3K-Akt signaling pathway is a critical pathway to mediate the survival actions of trophic factors on neuronal cells [36]; hyperglycemia-induced neuronal loss increases through a reduction of PI3K-Akt signaling [37]. In summary, all the above-mentioned pathways may be associated with DPN.
In order to better explore the relationship between the differentially expressed miRNAs and target genes, we built the miRNA-gene-network and found rno-miR-330-5p, rno-miR-17-1-3p and rno-miR-346 to be highly connected, indicating that these miRNAs may play critical roles in the regulatory network. Previous studies have reported that miR-330-5p may be involved in the synaptic loss of hippocampal neuron during Alzheimer's disease pathogenesis [38]; miR-346 negatively regulates Smad3/4 expression by binding to its 3'-UTR, ameliorating the kidney function and histology in diabetic nephropathy [39]. In addition, rno-miR-1-3p, rno-miR-9a-3p, rno-miR-205, rno-miR-363-3p, rno-miR-495, and rno-miR-451-5p have been reported to be involved in diabetic complications. Increased expression of miR-1-3p may be related to long-term diabetes-induced muscle sarcopenia [40]; miR-9a-3p was linked to the impairment of the KATP channel function and contribute to diabetic vascular complications [41]; miR-205 belongs to oxidative stress related miRNAs, modulates oxidative and endoplasmic reticulum stresses, and may be important to regulate diabetic nephropathy [42]; also, miR-363-3p, miR-495 and miR-451-5p may be used as early biomarkers in patients or rats with diabetic nephropathy [43, 44]. To our knowledge, few studies have reported the relationship between these miRNAs and DPN. Regarding the target genes in the regulatory network, the downregulated gene Podxl was the most highly regulated gene. Larrucea et al. have reported that Podxl enhances cell adherence, cell migration and cellular interaction in an integrin-dependent manner [45]. Interestingly, previous research suggest that decreased expression and improper localization of the adhesion-related molecules in the myelin sheath of diabetic rats, might lead to the reduction of the motor nerve conduction velocity [46]. However, the linkage between Podxl and DPN is still unknown.
In conclusion, the present study successfully identified differentially expressed miRNAs and their target mRNAs in DRGs from STZ-induced diabetic rats. We identified 399 GO terms and 29 pathways, many of them were involved in DPN according to previous studies [26–37], indicating that these genes may be important in the development of DPN. However, it is worth noting that "guilt by association" is usually not the case in real biological systems [47] and we only predicted the functions of dysregulated genes using bioinformatics analyses. In addition, the differentially expressed genes identified in rat DRG tissues may not participate in the same processes in humans. Therefore, future studies should focus on validating the function and related molecular mechanisms of these genes on the pathophysiology of DPN, and their significance to human DPN.
Supporting information
(PDF)
Specific primers of rno-miR-1-3p and target gene Mgat4a for qPCR analysis.
(XLSX)
Information on the upregulated and downregulated miRNAs in diabetic rats.
(XLSX)
Information on the upregulated and downregulated mRNAs in diabetic rats.
(XLSX)
The list of predicted target mRNAs of 37 differentially expressed miRNAs using the miRanda database.
(XLSX)
The list of the selected target genes.
(XLSX)
Information on upregulated and downregulated GO terms.
(XLSX)
Information on upregulated and downregulated pathways.
(XLSX)
The relationships and properties of 37 miRNAs and 277 target mRNAs involved in the network.
(XLSX)
Data Availability
The original microarray data are available at NCBI Gene Expression Omnibus (GEO Series accession number, GSE110234).
Funding Statement
This work was supported by the National Key Research and Development Program of China (ZC, 2016YFC1101705; http://www.most.gov.cn/), the National Natural Science Foundation of China (ZC, 81772094, 81471270, 81271967, 30872627; http://www.nsfc.gov.cn/). The funders had no role in study design, data collection and analysis, decision to publish, or preparation of the manuscript.
References
- 1.Singh R, Kishore L, Kaur N. Diabetic peripheral neuropathy: current perspective and future directions. Pharmacol Res. 2014;80:21–35. 10.1016/j.phrs.2013.12.005 [DOI] [PubMed] [Google Scholar]
- 2.Tesfaye S, Selvarajah D. Advances in the epidemiology, pathogenesis and management of diabetic peripheral neuropathy. Diabetes Metab Res Rev. 2012;28 Suppl 1:8–14. [DOI] [PubMed] [Google Scholar]
- 3.Feldman EL, Nave KA, Jensen TS, Bennett DLH. New Horizons in Diabetic Neuropathy: Mechanisms, Bioenergetics, and Pain. Neuron. 2017;93(6):1296–313. 10.1016/j.neuron.2017.02.005 [DOI] [PMC free article] [PubMed] [Google Scholar]
- 4.Bianchi R, Cervellini I, Porretta-Serapiglia C, Oggioni N, Burkey B, Ghezzi P, et al. Beneficial Effects of PKF275-055, a Novel, Selective, Orally Bioavailable, Long-Acting Dipeptidyl Peptidase IV Inhibitor in Streptozotocin-Induced Diabetic Peripheral Neuropathy. J Pharmacol Exp Ther. 2012;340(1):64–72. 10.1124/jpet.111.181529 [DOI] [PubMed] [Google Scholar]
- 5.Islam MS. Animal Models of Diabetic Neuropathy: Progress Since 1960s. J Diabetes Res. 2013:149452 10.1155/2013/149452 [DOI] [PMC free article] [PubMed] [Google Scholar]
- 6.Bartel DP. MicroRNAs: Genomics, biogenesis, mechanism, and function. Cell. 2004;116(2):281–97. [DOI] [PubMed] [Google Scholar]
- 7.Ha M, Kim VN. Regulation of microRNA biogenesis. Nat Rev Mol Cell Bio. 2014;15(8):509–24. [DOI] [PubMed] [Google Scholar]
- 8.Hammond SM. An overview of microRNAs. Adv Drug Deliver Rev. 2015;87:3–14. [DOI] [PMC free article] [PubMed] [Google Scholar]
- 9.McClelland AD, Kantharidis P. microRNA in the development of diabetic complications. Clin Sci. 2014;126(1–2):95–110. [DOI] [PubMed] [Google Scholar]
- 10.Rahman MH, Jha MK, Kim JH, Nam Y, Lee MG, Go Y, et al. Pyruvate Dehydrogenase Kinase-mediated Glycolytic Metabolic Shift in the Dorsal Root Ganglion Drives Painful Diabetic Neuropathy. J Biol Chem. 2016;291(11):6011–25. 10.1074/jbc.M115.699215 [DOI] [PMC free article] [PubMed] [Google Scholar]
- 11.Wang L, Chopp M, Szalad A, Zhang Y, Wang X, Zhang RL, et al. The role of miR-146a in dorsal root ganglia neurons of experimental diabetic peripheral neuropathy. Neuroscience. 2014;259:155–63. 10.1016/j.neuroscience.2013.11.057 [DOI] [PMC free article] [PubMed] [Google Scholar]
- 12.Athie MCP, Vieira AS, Teixeira JM, Dos Santos GG, Dias EV, Tambeli CH, et al. Transcriptome analysis of dorsal root ganglia's diabetic neuropathy reveals mechanisms involved in pain and regeneration. Life Sci. 2018;205:54–62. 10.1016/j.lfs.2018.05.016 [DOI] [PubMed] [Google Scholar]
- 13.Hao GM, Liu YG, Wu Y, Xing W, Guo SZ, Wang Y, et al. The protective effect of the active components of ERPC on diabetic peripheral neuropathy in rats. J Ethnopharmacol. 2017;202:162–71. 10.1016/j.jep.2017.03.015 [DOI] [PubMed] [Google Scholar]
- 14.Kroin JS, Buvanendran A, Williams DK, Wagenaar B, Moric M, Tuman KJ, et al. Local anesthetic sciatic nerve block and nerve fiber damage in diabetic rats. Reg Anesth Pain Med. 2010;35(4):343–50. [DOI] [PubMed] [Google Scholar]
- 15.Cha M, Um SW, Kwon M, Nam TS, Lee BH. Repetitive motor cortex stimulation reinforces the pain modulation circuits of peripheral neuropathic pain. Sci Rep. 2017;7(1):7986 10.1038/s41598-017-08208-2 [DOI] [PMC free article] [PubMed] [Google Scholar]
- 16.Wright GW, Simon RM. A random variance model for detection of differential gene expression in small microarray experiments. Bioinformatics. 2003;19(18):2448–55. [DOI] [PubMed] [Google Scholar]
- 17.Ashburner M, Ball CA, Blake JA, Botstein D, Butler H, Cherry JM, et al. Gene ontology: tool for the unification of biology. The Gene Ontology Consortium. Nat Genet. 2000;25(1):25–9. 10.1038/75556 [DOI] [PMC free article] [PubMed] [Google Scholar]
- 18.Schlitt T, Palin K, Rung J, Dietmann S, Lappe M, Ukkonen E, et al. From gene networks to gene function. Genome research. 2003;13(12):2568–76. 10.1101/gr.1111403 [DOI] [PMC free article] [PubMed] [Google Scholar]
- 19.Joung JG, Hwang KB, Nam JW, Kim SJ, Zhang BT. Discovery of microRNA-mRNA modules via population-based probabilistic learning. Bioinformatics. 2007;23(9):1141–7. 10.1093/bioinformatics/btm045 [DOI] [PubMed] [Google Scholar]
- 20.Cheng C, Kobayashi M, Martinez JA, Ng H, Moser JJ, Wang X, et al. Evidence for Epigenetic Regulation of Gene Expression and Function in Chronic Experimental Diabetic Neuropathy. J Neuropathol Exp Neurol. 2015;74(8):804–17. 10.1097/NEN.0000000000000219 [DOI] [PubMed] [Google Scholar]
- 21.Gong Q, Lu Z, Huang Q, Ruan L, Chen J, Liang Y, et al. Altered microRNAs expression profiling in mice with diabetic neuropathic pain. Biochem Biophys Res Commun. 2015;456(2):615–20. 10.1016/j.bbrc.2014.12.004 [DOI] [PubMed] [Google Scholar]
- 22.Oshlack A, Robinson MD, Young MD. From RNA-seq reads to differential expression results. Genome Biol. 2010;11(12):220 10.1186/gb-2010-11-12-220 [DOI] [PMC free article] [PubMed] [Google Scholar]
- 23.Biessels GJ, Bril V, Calcutt NA, Cameron NE, Cotter MA, Dobrowsky R, et al. Phenotyping animal models of diabetic neuropathy: a consensus statement of the diabetic neuropathy study group of the EASD (Neurodiab). J Peripher Nerv Syst. 2014;19(2):77–87. 10.1111/jns5.12072 [DOI] [PMC free article] [PubMed] [Google Scholar]
- 24.Yousefzadeh N, Alipour MR, Soufi FG. Deregulation of NF-kappa B-miR-146a negative feedback loop may be involved in the pathogenesis of diabetic neuropathy. J Physiol Biochem. 2015;71(1):51–8. 10.1007/s13105-014-0378-4 [DOI] [PubMed] [Google Scholar]
- 25.Zochodne DW, Guo GF, Magnowski B, Bangash M. Regenerative failure of diabetic nerves bridging transection injuries. Diabetes-Metab Res. 2007;23(6):490–6. [DOI] [PubMed] [Google Scholar]
- 26.Shi X, Chen Y, Nadeem L, Xu G. Beneficial effect of TNF-alpha inhibition on diabetic peripheral neuropathy. J Neuroinflammation. 2013;10:69 10.1186/1742-2094-10-69 [DOI] [PMC free article] [PubMed] [Google Scholar]
- 27.Zangiabadi N, Asadi-Shekaari M, Sheibani V, Jafari M, Shabani M, Asadi AR, et al. Date Fruit Extract Is a Neuroprotective Agent in Diabetic Peripheral Neuropathy in Streptozotocin-Induced Diabetic Rats: A Multimodal Analysis. Oxidative Medicine and Cellular Longevity. 2011:976948. [DOI] [PMC free article] [PubMed] [Google Scholar]
- 28.Malysz T, Ilha J, Nascimento PS, De Angelis K, Schaan BD, Achaval M. Beneficial effects of treadmill training in experimental diabetic nerve regeneration. Clinics (Sao Paulo). 2010;65(12):1329–37. [DOI] [PMC free article] [PubMed] [Google Scholar]
- 29.Cameron NE, Eaton SE, Cotter MA, Tesfaye S. Vascular factors and metabolic interactions in the pathogenesis of diabetic neuropathy. Diabetologia. 2001;44(11):1973–88. 10.1007/s001250100001 [DOI] [PubMed] [Google Scholar]
- 30.Vincent AM, Callaghan BC, Smith AL, Feldman EL. Diabetic neuropathy: cellular mechanisms as therapeutic targets. Nature Reviews Neurology. 2011;7(10):573–83. 10.1038/nrneurol.2011.137 [DOI] [PubMed] [Google Scholar]
- 31.Ristoiu V, Shibasaki K, Uchida K, Zhou Y, Ton BH, Flonta ML, et al. Hypoxia-induced sensitization of transient receptor potential vanilloid 1 involves activation of hypoxia-inducible factor-1 alpha and PKC. Pain. 2011;152(4):936–45. 10.1016/j.pain.2011.02.024 [DOI] [PubMed] [Google Scholar]
- 32.Chavez JC, Almhanna K, Berti-Mattera LN. Transient expression of hypoxia-inducible factor-1 alpha and target genes in peripheral nerves from diabetic rats. Neurosci Lett. 2005;374(3):179–82. 10.1016/j.neulet.2004.10.050 [DOI] [PubMed] [Google Scholar]
- 33.Jazayeri L, Callaghan MJ, Grogan RH, Hamou CD, Thanik V, Ingraham CR, et al. Diabetes increases p53-mediated apoptosis following ischemia. Plast Reconstr Surg. 2008;121(4):1135–43. 10.1097/01.prs.0000302499.18738.c2 [DOI] [PubMed] [Google Scholar]
- 34.Fernyhough P, Calcutt NA. Abnormal calcium homeostasis in peripheral neuropathies. Cell Calcium. 2010;47(2):130–9. 10.1016/j.ceca.2009.11.008 [DOI] [PMC free article] [PubMed] [Google Scholar]
- 35.Hall KE, Liu J, Sima AA, Wiley JW. Impaired inhibitory G-protein function contributes to increased calcium currents in rats with diabetic neuropathy. J Neurophysiol. 2001;86(2):760–70. 10.1152/jn.2001.86.2.760 [DOI] [PubMed] [Google Scholar]
- 36.Brunet A, Datta SR, Greenberg ME. Transcription-dependent and -independent control of neuronal survival by the PI3K-Akt signaling pathway. Curr Opin Neurobiol. 2001;11(3):297–305. [DOI] [PubMed] [Google Scholar]
- 37.Anitha M, Gondha C, Sutliff R, Parsadanian A, Mwangi S, Sitaraman SV, et al. GDNF rescues hyperglycemia-induced diabetic enteric neuropathy through activation of the PI3K/Akt pathway. J Clin Invest. 2006;116(2):344–56. 10.1172/JCI26295 [DOI] [PMC free article] [PubMed] [Google Scholar]
- 38.Cai Y, Sun Z, Jia H, Luo H, Ye X, Wu Q, et al. Rpph1 Upregulates CDC42 Expression and Promotes Hippocampal Neuron Dendritic Spine Formation by Competing with miR-330-5p. Front Mol Neurosci. 2017;10:27 10.3389/fnmol.2017.00027 [DOI] [PMC free article] [PubMed] [Google Scholar]
- 39.Zhang Y, Xiao HQ, Wang Y, Yang ZS, Dai LJ, Xu YC. Differential expression and therapeutic efficacy of microRNA-346 in diabetic nephropathy mice. Exp Ther Med. 2015;10(1):106–12. 10.3892/etm.2015.2468 [DOI] [PMC free article] [PubMed] [Google Scholar]
- 40.Gerlinger-Romero F, Yonamine CY, Junior DC, Esteves JV, Machado UF. Dysregulation between TRIM63/FBXO32 expression and soleus muscle wasting in diabetic rats: potential role of miR-1-3p, -29a/b-3p, and -133a/b-3p. Mol Cell Biochem. 2017;427(1–2):187–99. 10.1007/s11010-016-2910-z [DOI] [PubMed] [Google Scholar]
- 41.Li SS, Wu Y, Jin X, Jiang C. The SUR2B subunit of rat vascular KATP channel is targeted by miR-9a-3p induced by prolonged exposure to methylglyoxal. Am J Physiol Cell Physiol. 2015;308(2):C139–45. 10.1152/ajpcell.00311.2014 [DOI] [PMC free article] [PubMed] [Google Scholar]
- 42.Hagiwara S, McClelland A, Kantharidis P. MicroRNA in diabetic nephropathy: renin angiotensin, aGE/RAGE, and oxidative stress pathway. J Diabetes Res. 2013;2013:173783 10.1155/2013/173783 [DOI] [PMC free article] [PubMed] [Google Scholar]
- 43.Argyropoulos C, Wang K, Bernardo J, Ellis D, Orchard T, Galas D, et al. Urinary MicroRNA Profiling Predicts the Development of Microalbuminuria in Patients with Type 1 Diabetes. J Clin Med. 2015;4(7):1498–517. 10.3390/jcm4071498 [DOI] [PMC free article] [PubMed] [Google Scholar]
- 44.Mohan A, Singh RS, Kumari M, Garg D, Upadhyay A, Ecelbarger CM, et al. Urinary Exosomal microRNA-451-5p Is a Potential Early Biomarker of Diabetic Nephropathy in Rats. PLoS One. 2016;11(4):e0154055 10.1371/journal.pone.0154055 [DOI] [PMC free article] [PubMed] [Google Scholar]
- 45.Larrucea S, Butta N, Arias-Salgado EG, Alonso-Martin S, Ayuso MS, Parrilla R. Expression of podocalyxin enhances the adherence, migration, and intercellular communication of cells. Exp Cell Res. 2008;314(10):2004–15. 10.1016/j.yexcr.2008.03.009 [DOI] [PubMed] [Google Scholar]
- 46.Kanazawa Y, Takahashi-Fujigasaki J, Ishizawa S, Takabayashi N, Ishibashi K, Matoba K, et al. The Rho-kinase inhibitor fasudil restores normal motor nerve conduction velocity in diabetic rats by assuring the proper localization of adhesion-related molecules in myelinating Schwann cells. Exp Neurol. 2013;247:438–46. 10.1016/j.expneurol.2013.01.012 [DOI] [PubMed] [Google Scholar]
- 47.Gillis J, Pavlidis P. "Guilt by association" is the exception rather than the rule in gene networks. Plos Comput Biol. 2012;8(3):e1002444 10.1371/journal.pcbi.1002444 [DOI] [PMC free article] [PubMed] [Google Scholar]
Associated Data
This section collects any data citations, data availability statements, or supplementary materials included in this article.
Supplementary Materials
(PDF)
Specific primers of rno-miR-1-3p and target gene Mgat4a for qPCR analysis.
(XLSX)
Information on the upregulated and downregulated miRNAs in diabetic rats.
(XLSX)
Information on the upregulated and downregulated mRNAs in diabetic rats.
(XLSX)
The list of predicted target mRNAs of 37 differentially expressed miRNAs using the miRanda database.
(XLSX)
The list of the selected target genes.
(XLSX)
Information on upregulated and downregulated GO terms.
(XLSX)
Information on upregulated and downregulated pathways.
(XLSX)
The relationships and properties of 37 miRNAs and 277 target mRNAs involved in the network.
(XLSX)
Data Availability Statement
The original microarray data are available at NCBI Gene Expression Omnibus (GEO Series accession number, GSE110234).


