

Abstract
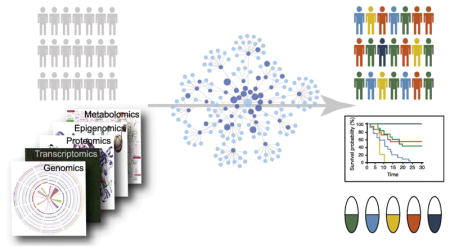
Precision cancer medicine promises to tailor clinical decisions to patients using genomic information. Indeed, successes of drugs targeting genetic alterations in tumors, such as imatinib that targets BCR-ABL in chronic myelogenous leukemia, have demonstrated the power of this approach. However biological systems are complex, and patients may differ not only by the specific genetic alterations in their tumor, but by more subtle interactions among such alterations. Systems biology and more specifically, network analysis, provides a framework for advancing precision medicine beyond clinical actionability of individual mutations. Here we discuss applications of network analysis to study tumor biology, early methods for N-of-1 tumor genome analysis and the path for such tools to the clinic.
Keywords: Cancer systems biology, precision cancer medicine, network analysis
Graphical Abstract
Introduction
Efforts to catalog the somatic mutations in thousands of tumor genomes have uncovered substantial genetic heterogeneity in cancer. Despite their phenotypic similarities (cancer cells display certain hallmark behaviors [1]), individual tumors rarely share the same mutations. This heterogeneity presents a significant challenge for finding any one treatment that will benefit all patients, necessitating precision approaches that tailor clinical management toward individual patients, or small groups with similar disease.
Studies of tumor genomes have determined that the majority of detected mutations are passengers that do not contribute to the oncogenic process [2–4]. The small number of causal driver mutations in a tumor present the optimal targets for therapy, as they are specific to tumor cells and interfering with their activity should impair tumor growth. Among some of the most successful targeted therapies to date are imatinib, that targets the BCR-ABL fusion, gefitinib, that binds and inhibits EGFR, and trastuzumab that inhibits HER2.
Although targeted therapies have the potential to generate large responses, response rates are often modest. For example, complete responses have been observed in advanced melanomas treated with immune checkpoint inhibitors, however across tumor types, response rates have yet to exceed ~40% of patients [5–7]. Various factors may contribute to which patients are sensitive to a therapy, including secondary mutations or subclonal heterogeneity. For some therapies, tumor-type specific differences in the underlying molecular networks appear to account for differences in response rate. Targeted inhibition of BRAF V600E is highly effective in melanoma but not in colorectal cancer where it was found that inhibition caused feedback activation of EGFR which maintained cell proliferation in the presence of the inhibitor [8]. Thus, the state of individual cancer genes alone may not be enough to inform response. Interactions between multiple alterations in the tumor may need to be taken into consideration.
Furthermore, many tumors do not have a driver mutation that clearly indicates a specific targeted therapy [2,9,10]. Because genes affected by driver mutations (cancer genes) tend to participate in common biological activities such as genome maintenance, cell differentiation or growth signaling [2,11–13], targeting the biological pathways rather than specific cancer genes or driver mutations may provide a strategy that will be effective for a larger number of patients [14,15]. Thus, improvement of precision therapy is likely to require approaches capable of modeling interactions between somatic alterations in tumors and capturing information about the underlying molecular state of the pathways driving tumorigenesis.
Systems biology provides a toolkit for modeling complex biological systems and their constituent interactions. Increasingly, techniques from systems biology such as network analysis are being applied to analyze genomic data in order to better understand disease [16]. Several tasks in precision cancer medicine stand to benefit from network-based approaches including identification of driver mutations, genes and pathways, patient stratification into groups with similar characteristics, identifying therapeutic opportunities and assessment of cancer risk. Here we review the applications of networks toward these tasks at the cohort and individual patient scale and consider future work needed to bring network analysis of tumor genomes to the clinic.
Network analysis across tumor cohorts
Networks have been employed in the study of tumor cohorts in order to gain insights into tumor biology, to identify putative biomarkers and relevant disease subtypes, and to find possible targets for therapy. In these scenarios, networks are often used to control heterogeneity and to increase statistical power through aggregation (Figure 1). The structures of the networks can be defined from known molecular interactions (e.g. protein-protein interactions), such that the network itself is a model of the biological system. This confers meaning to interactions within the network such that connected nodes are expected to be more functionally related than distant nodes and traversal of adjacent edges in the network can be loosely interpreted as biological information flow. Networks can also be used to integrate different data types, for example by defining the state of a node by combining different measurements (mutation, expression, copy number, methylation, etc.), or by mapping events in one data layer to another.
Figure 1.

Overview of network applications in cancer.
The predominant application of networks to tumor genomic data has been with the intent to define tumor biology by uncovering the driver pathways, genes and mutations that contribute to tumorigenesis (Figure 2, Table 1). This task is confounded by mutational heterogeneity; somatic alterations broadly affect a variety of genes, and driver mutations are difficult to distinguish from the more prevalent passengers. Alteration frequency alone is of limited value, leading to a number of methods that attempt to model positive selection of mutations across tumors at the single gene scale [3,17–20]. It is now well established that somatic alterations in tumors aggregate not at the gene level, but at the pathway level [1,2], supporting the use of networks to better identify patterns of selection indicating driver events.
Figure 2.

Schematic diagram of three concepts used for identification of cancer drivers. Nodes represent proteins while edges represent interactions between proteins. A) Identification of driver pathways, where the nodes within the shaded region belongs to the pathway. B) Identification of driver genes, where red nodes correspond to the proteins encoded by driver genes within the pathway (outlined). C) Identification of driver mutations targeting the driver genes. Sizes of the nodes represent mutation frequency. Pie charts on the nodes display the percentage of driver (red) and passenger (pink) mutations.
Table 1.
Network-based methods for identifying driver events in cancer across multiple scales (pathway, gene, miRNA, or mutation).
| Method | Application | Approach | URL | Reference |
|---|---|---|---|---|
| HotNet | Driver pathway identification | Diffusion | http://compbio.cs.brown.edu/projects/hotnet/ | [24] |
| HotNet2 | Driver pathway identification | Diffusion | http://compbio.cs.brown.edu/projects/hotnet2/ | [25] |
| ReMIC | Driver pathway identification | Diffusion | http://bioinformatics.tudelft.nl/users/sepideh-babaei | [26] |
| VarWalker | Driver pathway identification | Diffusion | https://bioinfo.uth.edu/VarWalker.html | [27] |
| NetBox | Driver pathway identification | Edge density | http://sanderlab.org/tools/netbox.html | [30] |
| nCOP | Driver pathway identification | Network-informed set coverage | https://github.com/Singh-Lab/nCOP | [32] |
| Sun et al. | Driver pathway identification | Prize collecting Steiner tree | - | [33] |
| Tuncbag et al. | Driver pathway identification | Prize collecting Steiner tree | - | [34] |
| TieDIE | Driver pathway identification | Diffusion | https://sysbiowiki.soe.ucsc.edu/tiedie | [35] |
| iMCMC | Driver pathway identification | Network fusion and optimization-based module finding | - | [36] |
| Miller et al. | Driver pathway identification | Mutual exclusivity | http://brl.bcm.tmc.edu/rme/index.rhtml | [37] |
| Dendrix | Driver pathway identification | Mutual exclusivity | http://compbio.cs.brown.edu/projects/dendrix/ | [38] |
| MDPFinder | Driver pathway identification | Mutual exclusivity | http://zhangroup.aporc.org/ShiHuaZhang | [40] |
| Multi-Dendrix | Driver pathway identification | Mutual exclusivity | http://compbio.cs.brown.edu/projects/multi-dendrix/ | [39] |
| Szczurek et al. | Driver pathway identification | Mutual exclusivity | - | [41] |
| MEMo | Driver pathway identification | Mutual exclusivity | http://sanderlab.org/tools/memo.html | [42] |
| Wu et al. | Driver gene identification | Shortest path algorithm | - | [46] |
| Conflux | Driver gene identification | Probabilistic graphical model | - | [48] |
| MUFFINN | Driver gene identification | Functional impact on network neighbors | http://www.inetbio.org/muffinn/ | [49] |
| NetSig | Driver gene identification | Functional impact on network neighbors | http://www.lagelab.org/resources | [50] |
| Luo et al. | Driver gene identification | Data integration; mutation and phenotype similarity | - | [52] |
| Liu et al. | Driver gene identification | Data integration; mutation and phenotype similarity | - | [53] |
| Lin et al. | Driver gene identification | Data integration; mutation and phenotype similarity | - | [45] |
| Cantini et al. | Driver gene identification | Data integration; multi-omics | https://github.com/lcan88/Gene4x | [54] |
| Yuan et al. | Driver gene identification | Data integration; multi-omics | - | [55] |
| CONEXIC | Driver gene identification | Drivers within CNV regions | http://www.c2b2.columbia.edu/danapeerlab/html/conexic.html | [57] |
| MAXDRIVER | Driver gene identification | Drivers within CNV regions | - | [58] |
| Porta-Pardo et al. | Driver gene identification | Ratio of observed to expected mutations in interface regions | https://github.com/eduardporta/e-Driver | [69] |
| Raimondi et al. | Driver gene identification | Ratio of observed to expected mutations in interface regions | - | [70] |
| Engin et al. | Driver gene identification | dN/dS ratio at interfaces Pair potentials of amino | - | [72] |
| Mechismo | Driver gene identification | acid substitutions at interfaces | mechismo.russelllab.org | [73] |
| Climente-González et al. | Driver gene identification | Network perturbation by alternative splicing | - | [76] |
| Buljan et al. | Driver gene identification | Network perturbation by alternative splicing | - | [77] |
| DrAS-Net | Driver gene identification | Alternative splicing perturbation by mutations | http://www.bio-bigdata.com/dras_net/index.jsp | [78] |
| Xu et al. | Driver miRNA identification | Data integration; regulatory interactions (miRNA-mRNA) | - | [79] |
| Li et al. | Driver miRNA identification | Data integration; regulatory interactions (miRNA-mRNA) | - | [80] |
| Le | Driver miRNA identification | Diffusion | - | [81] |
| Hamed et al. | Driver miRNA identification | Data integration; regulatory interactions (TF-gene and miRNA-mRNA) | - | [82] |
| Creixell et al. | Network-attacking mutation (NAM) identification | Data integration; post-translational modifications | http://lindinglab.science/ | [83] |
| DriverNet | Driver mutation identification | Effects on transcriptional networks | http://shahlab.ca/projects/drivernet/ | [88] |
| PARADIGM-SHIFT | Driver mutation identification | Local network effects | https://github.com/paradigmshift/paradigmshift.github.com | [89] |
Driver pathways
The term pathway is often used to describe a set of molecular interactions that collectively mediate a specific biological activity within a cell [21]. In the context of a molecular network, various biological pathways will be embedded as smaller highly connected subnetworks. Since cancer driving mutations are thought to target genes in a relatively small number of signaling and regulatory pathways [1,2,22,23], biological networks can provide a framework to study the convergence of mutations within connected subnetworks, such that identification of driver pathways can be formulated as a module detection problem (Figure 2). This is equivalent to a search for positive selection of mutations across groups of functionally related genes. Consequently, module detection approaches are able to implicate infrequently mutated driver genes that would be overlooked based on frequency-based approaches, but fall into frequently altered network neighborhoods [24–27].
Diffusion algorithms have become a popular strategy for identifying cancer network modules (Figure 3). The first application of network diffusion to identify disease-associated genes was described by Köhler et al. [28]. HotNet [24] adapted this method for driver pathways by developing a robust statistical framework for network propagation. HotNet uses mutations as a ‘heat source’ on the network, where heat is allowed to diffuse across network edges, spreading the influence of mutations across the network dependent on the topology. After diffusion, the network can be partitioned to identify ‘hot’ regions that are likely driver pathways enriched for the influence of mutations. The advantage of the diffusion approach is that it naturally penalizes highly connected regions of the network (heat has to be divided across large numbers of edges) where mutation influence will appear more concentrated at random. HotNet2 [25] proposed “insulated” heat diffusion (mathematically equivalent to PageRank [29]) to incorporate edge direction which allows the algorithm to capture a sense of effects being upstream or downstream of causal mutations, and a damping factor that can be tuned to emphasize local topology over distant network regions.
Figure 3.

Summary of several widely-used algorithmic approaches in the identification of driver pathways/subnetworks. A) An example network with nodes representing proteins and edges representing interactions between proteins. Nodes marked with an asterisk are mutated proteins. B) A heat diffusion process where each node is initially assigned a color based on the mutation score of the corresponding gene. Heat diffuses across the edges of the network where intensity of the node colors denotes the mutational influence on the protein. In the end, significantly mutated subnetworks (outlined) are reported. C) A prize-collecting Steiner tree approach where node size represents mutation score and edge width represents the confidence in the interaction (other concepts can be used for determining the node size and edge width). Algorithm reports the connected components with the most “prize” nodes and the least number of edges. D) A mutual exclusivity approach that identifies sets of genes that simultaneously maximize mutual exclusivity and coverage of patient samples.
Babaei et al. [26] argued that different cancer relevant-pathways may have different sizes, and thus it may be necessary to diffuse at different scales to detect different pathways. They developed ReMIC [26], which diffuses mutation scores on a hybrid interaction network across a range of parameters, and implicates genes that are significantly mutated at any network scale relative to a permuted gene-mutation pairs. Many of the genes identified by this approach were part of the same connected components within the network, and thus considered to participate in the same pathways. VarWalker [27] additionally prioritizes edges where both nodes are recurrently implicated across patients by collapsing patient-specific networks into a single consensus mutation subnetwork that can then be divided into subgraphs to identify pathways. Patient-specific significantly mutated genes are determined using generalized additive models and used as starting nodes for a patient-specific Random Walk with Restart (RWR) on a PPI network. Patient specific subnetworks are constructed from significant nodes and edges after comparing against a random model. This approach was able to detect both frequently and infrequently mutated cancer genes [27].
NetBox [30] also seeks to identify network modules enriched for altered genes in tumors, but rather than using diffusion, altered network modules are identified based on a higher density of interactions within groups than between groups via the edge betweenness algorithm [31]. NetBox was applied to analyze glioblastoma tumors using a custom interaction network that combines PPIs and signaling pathways (e.g. kinases and phosphorylation targets), using mutation and copy number data to implicate driver modules. In nCOP [32], the problem is framed as identifying small subnetworks in the larger PPI network that cover (e.g. have one or more mutations) in the largest number of patients.
Another class of methods use variants on the prize collecting Steiner tree algorithm to identify cancer-relevant subnetworks (Figure 3). This algorithm attempts to find connected components of a network that contain the most “prize” nodes with the minimal number of edges. The prizes in the case of cancer are genes with some evidence for association with the disease. For instance Sun et al. [33] used protein-protein interaction data and known MAPK and PI3K/Akt signaling members to reconstruct their network neighborhoods. In work by Tuncbag et al. [34], the prizes are taken to be genes that had phosphorylation changes in cancer cell lines with the goal of reconstructing glioblastoma signaling pathways. Steiner tree algorithms tend to return more parsimonious solutions as compared to diffusion algorithms, and are more sensitive to the underlying network topology, since they rely on shorter paths through a network, rather than all possible paths.
Several approaches seek to identify driver networks by combining information from genomic and transcriptomic perturbations. TieDIE [35] infers the structure of cancer associated gene networks by using mutated genes as source nodes on a custom directed PPI network and activated transcription factors as source nodes on a transcription factor-target network. Nodes implicated by these independent diffusion processes are integrated into a cancer subnetwork connecting the two node sets. TieDIE was applied to patients with luminal versus basal subtypes of breast cancer in order to identify subnetworks distinguishing these subtypes [35]. DNA damage repair alterations and downstream activated MYC were characteristic of basal tumors, whereas estrogen receptor and PIK3CA pathway signaling dominated the luminal tumors. iMCMC [36] is also designed based on the idea that variation in gene sequence and expression together might contribute to cancer. It constructs two weighted networks, one from mutations and CNV data, and the other from gene expression, where nodes represent a measure of the importance or effect size of a node, and edges represent a measure of similarity or functional relatedness. Then these two networks are combined and mutated core modules are detected via an optimization model followed by statistical tests.
Mutual exclusivity is a pathway level signature of selection, in that once a driver mutation has activated or inactivated a pathway, it is rare to observe additional driver mutations in that pathway in the same tumor. Finding cancer pathways can then be formulated as a problem of identifying sets of functionally related genes that demonstrate mutual exclusivity of somatic alteration, where biological networks can be used to approximate functionally related genes (Figure 3). In addition, driver pathways should ideally explain the maximum number of tumors. Several methods seek sets of genes with high exclusivity that cover a high proportion of tumor samples, de novo from somatic mutation data, without prior interaction or pathway information, including Miller et al. [37], Dendrix [38] and Multi-Dendrix [39]. While Miller et al. [37] identifies driver modules from gene networks constructed based on pairwise exclusivity scores, Dendrix [38] assigns a single weight score to a group of genes based on mutual exclusivity of the group and searches for the highest scoring group with a stochastic search method. MDPFinder [40] and Multi-Dendrix [39] use the same weight score. While MDPFinder evaluates the performance of different search techniques (an exact method and a stochastic method that allows for integration of expression data), Multi-Dendrix [39] focuses on identifying multiple mutated pathways based on the observation that simultaneous perturbation of several pathways can be required for cancer [1]. Szczurek et al. [41] developed a probabilistic, generative model to detect cancer pathways while accounting for error rates. In contrast to these approaches, MEMo [42] relies on prior interaction information to identify driver oncogenic network modules by analyzing maximal cliques that belong to the same pathway for patterns of mutual exclusivity across multiple patients. Other methods integrate mutual exclusivity with other information. iMCMC [36] uses mutual exclusivity to assign edge weights when building its somatic mutation/CNV network, thereby using it as a measure of functional similarity. In addition to being useful for driver pathway identification, mutual exclusivity can provide independent evidence to validate pathways predicted by alternative approaches [26].
Driver genes
While detection of driver network modules naturally implicates the constituent genes as cancer associated, several methods have been developed to implicate genes directly (Figure 2). Direct implication of genes may reduce false positive driver gene prediction in cases where not all genes in a network module have equal oncogenic potential. Although many gene level methods rely on patterns of mutation, networks have also been applied to implicate driver genes.
Many network-based disease gene prediction algorithms rely on the guilt-by-association concept, which is based on the observation that phenotypically similar genes tend to be co-located in biological networks [43,44]. There are different ways of measuring topological proximity of genes in a network [45]. Local approaches focus on genes that are either in direct physical interaction, or are located close to known disease genes. For example, Wu et al. [46] used the shortest path algorithm to predict gastric cancer related genes based on gene-gene interaction networks. However, the noisiness and incompleteness of the background network can limit the accuracy of predictions made based on local approaches. Global approaches define proximity based on the overall network topology, e.g. using algorithms such as random walk with restart (RWR) [28], kernel diffusion [28] or network propagation [47] or by transforming the network into a probabilistic graphical model [48]. These approaches may help overcome local incompleteness of the network as they use information beyond the local subnetwork in which a gene is located. On the other hand, MUFFINN [49], a pathway-centric method which identifies cancer genes based on mutational information of both individual genes and their neighbors in functional networks, reported that analysis of mutations in indirect neighbors via diffusion algorithms did not improve predictive performance compared to analysis of only direct neighbors. NetSig [50] also implicates novel cancer genes based on mutations affecting a gene’s direct network neighbors. These methods that combine mutational data with molecular network information can complement gene-based statistical tests [17,19,20,51] by uncovering drivers from the long-tail of infrequently mutated genes that have significantly mutated neighbors.
Employing only topological information while overlooking other functional information might limit driver gene detection methods. The integration of phenotype similarity information into biological networks has been shown to improve cancer driver gene prediction [45,52,53]. Incorporation of phenotype information can also help avoid implicating genes based on false positive interactions present in networks [52] or missing network edges [53]. As cancer is a heterogeneous disease and different classes of somatic perturbation (mutation, expression, methylation) can result in similar consequences for biological function, incorporation of multi-omics data into molecular networks can further improve cancer driver gene predictions [54,55].
Identifying genes functionally targeted by CNVs can be particularly difficult, since CNVs usually overlap many genes. Indeed, large CNVs may promote tumorigenesis through simultaneous effects on multiple genes that are positive or negative regulators of cell proliferation [56]. CONEXIC approaches this problem using the assumption that the expression of a driver gene should correlate with the expression of genes in its downstream module. CONEXIC [57] learns a network of modulator genes and associated gene expression modules from matched tumor CNV and expression data, then uses the model to identify small numbers of modulator genes within CNV regions that best explain variation in module gene expression. Matched CNV and gene expression data is not always available, and several methods have been developed to implicate driver genes within CNVs in the absence of transcriptional measurements. MAXDRIVER [58] relies on a hybrid network, combining a custom gene functional similarity network, gene-disease associations and a disease phenotype similarity network and then identifies driver genes within CNV regions based on maximal information flow between phenotype and genotype nodes in the hybrid network, where phenotypes are specific cancers.
Just as not all genes in a pathway have equal oncogenic potential, not all driver mutations within a cancer gene will alter function in the same way. Proteins often have multiple functions, and mutations can perturb specific functions while preserving others. Approaches have been developed to identify unexpected clustering of mutations in protein domains [59], in 3D structure [60,61], or in general [62,63]. Driver genes can then be implicated on the basis of mutation clustering that suggests a particular function is statistically perturbed in cancer.
Protein interactions with distinct partners can serve as a proxy for the different functional activities of a protein [64,65]. Integrating protein structure with protein interaction networks can allow reassignment of amino acids to specific interactions as interface residues, thereby mapping mutations to specific protein activities [66–68]. Several groups have developed scoring strategies that prioritize network edges enriched for somatic mutations in cancer under the assumption that recurrently perturbed interactions (edges) in tumors implicates the associated genes (nodes) as potential cancer drivers (Figure 4). Some methods evaluate the ratio of observed to expected mutations in interface regions, controlling for the size of the region relative to the size of the protein [69] or the size and the amino acid composition [70]. An alternative approach uses the non-synonymous to synonymous (dN/dS) ratio at interfaces, a signature of selective pressure that has been used to identify cancer genes [71], to evaluate whether interfaces are unexpectedly biased toward functional mutations [72]. Mechismo quantifies the consequences of amino acid substitutions at interfaces based on the expected pairing of specific residues across interfaces [73], enabling an assessment of the likely effect of the mutation based on the shift towards a more or less frequently observed amino acid pair. Some analyses additionally estimate the impact of the amino acid substitution on the stability of the protein complex [68,72,74] with methods that use force fields to evaluate binding affinity changes (e.g. FoldX [75]).
Figure 4.

A network-based approach for integration of protein-protein interaction networks with protein 3D structures and mutation data to identify cancer driver genes. Nodes represent proteins and edges represent interactions between proteins in the network. Unexpected mutational enrichment (red lollipops) on the interaction interface region of a protein (blue) implicates the encoding gene as potential cancer driver.
Alternative splicing can also play an important role in cancer by perturbing molecular interaction networks [76]. Differential inclusion of exons that form interaction interfaces in cancer can point to potential mechanisms of tumorigenesis. Climente-González et al. [76] demonstrated that protein domain families that are frequently mutated in tumors are also significantly perturbed by alternative splicing. Interestingly, the set of tissue-specific exons that form binding motifs was found to alter interactions in signaling networks known to be enriched in cancer genes, suggesting the potential for dysregulation of normal splicing differences to promote cancer [77]. Moreover, cancer mutations can also more broadly perturb splicing. DrAS-Net [78] uses a network-based strategy to study how somatic mutations impact the alternative splicing of neighboring genes in a functional interaction network. This study uncovered extensive effects of somatic mutations on alternative splicing in multiple tumor types.
Networks can be adapted to identify various types of cancer-associated elements. Hypothesizing that cancer-associated miRNAs would consistently dysregulate their target genes, Xu et al. [79] prioritized novel prostate cancer miRNAs from known miRNA-targets using a network of dysregulated miRNA target-pairs, based on joint analysis of miRNA and mRNA expression profiles. Li et al. [80] uncovered prognostic miRNA signatures in glioma malignant progression by de novo inferring the functional targets of miRNAs from an miRNA-mRNA regulatory network constructed from paired miRNA-mRNA expression profiles. Le [81] applied a variety of module finding approaches to a miRNA similarity network based on miRNA-target similarity, finding that these approaches worked well to identify known disease modules and implicating six new miRNAs in breast cancer pathogenesis. Novel miRNAs were also implicated in breast cancer by Hamed et al. who analyzed the proximity of somatic mutations to regulatory interactions between miRNAs and mRNAs as well as transcription factors and their target genes [82]. Creixell et al. analyzed mutations in the context of kinase signaling to identify altered patterns of post-translational modification that likely contribute to cancer [83]. In general, non-coding RNAs and post-translational modifications have received less attention than somatic alterations and DNA methylation changes affecting protein-coding genes, however there is ample evidence that they play an important role in tumorigenesis [84,85].
Driver mutations
While identifying driver pathways and genes can provide insight into tumor biology and identify new candidate therapeutic targets, the challenge of discriminating driver mutations from passengers persists. In a clinical setting, it is important to identify actionable mutations in cancer that indicate a particular treatment course. Even well-established cancer genes can carry passenger mutations (Figure 2), and the driver or passenger status of a mutation may determine whether response to a gene-targeted therapy is possible. While many methods exist to predict whether a mutation is a driver [86,87], networks provide a means by which multiple ‘omic’ data layers can be used as evidence of functional effect.
Transcriptional data can be used to discriminate drivers under the assumption that driver mutations impact the gene expression levels of the proteins they target, and hence their interacting partners and/or the proteins within the same pathway while passenger mutations should not display a strong effect [8,88]. DriverNet [88] uses this concept to prioritize mutations by their effect on transcriptional networks by relating the mutations to disrupted transcriptional patterns via a bipartite graph and assigns statistical significance to candidate predictions. With this approach, DriverNet identified multiple rare drivers in breast and ovarian cancer. ParadigmShift [89] predicts the functional effect of a mutation on the pathway neighborhood of the targeted gene by employing a belief-propagation algorithm to deduce mutation activity based on gene expression and copy number data upstream and downstream of particular mutations. It has been shown to be effective in predicting novel mutations in glioblastoma, ovarian and lung squamous cancers. These methods are complementary to frequency-based methods as they have been shown to be successful in detecting rare drivers.
Clinically-relevant patient stratification with networks
Understanding tumor biology is central to identifying novel drug targets and building a body of knowledge that can help with the interpretation of tumor genomes (Table 2). A directly relevant aspect of this is defining clinically informative cancer subtypes that can indicate relevant characteristics of a tumor, including long-term prognosis or likely drug sensitivities. Subtypes are well established in some tumors (e.g. molecular subtypes in breast cancer), but less obvious in others, and are often defined based on the presence or absence of specific molecular markers, or based on similar patterns of gene expression. Different approaches seem to work for different cancer types; gene expression can be used to stratify breast and ovarian cancer [90–94], however could not stratify tumors into clinically informative subtypes in some cancers [93,95].
Table 2.
Network-based methods for patient stratification and biomarker identification (prognostic, therapeutic, progression).
| Method | Application | Approach | URL | Reference |
|---|---|---|---|---|
| NBS | Patient stratification | Clustering patients based on network-smoothed mutation profiles | http://chianti.ucsd.edu/~mhofree/NBS/ | [97] |
| NetNorM | Patient stratification | NBS with mutation profile normalization instead of network smoothing | https://github.com/marineLM/NetNorM | [98] |
| He et al. | Patient stratification | NBS using cancer-type-specific co-expression networks | - | [100] |
| NCIS | Patient stratification | Network-informed co-clustering using expression data | http://bioen-compbio.bioen.illinois.edu/NCIS/* | [102] |
| NetBC | Patient stratification | Network-informed bi-clustering using expression data | http://mlda.swu.edu.cn/codes.php?name=NetBC* | [103] |
| PARADIGM | Patient stratification | Data integration; mutation and pathway-level activities | http://sbenz.github.io/Paradigm/ | [104] |
| SNF | Patient stratification | Data integration; multi-omic patient similarity networks | http://compbio.cs.toronto.edu/SNF/SNF/Software.html | [105] |
| ndmaSNF | Patient stratification | SNF framework with addition of somatic mutation data | - | [106] |
| Zhong et al. | Patient stratification | NBS using small panels of exome-level data | - | [99] |
| DrugComboRanker | Therapeutic biomarkers | Integrating disease signaling network data and transcriptomic expression data | Available upon request. | [109] |
| EPN | Therapeutic biomarkers | Integrating disease signaling network data and transcriptomic expression data | Available upon request. | [110] |
| Wu et al. | Therapeutic biomarkers | Data integration; protein interactions, protein-DNA interactions, and signaling pathways | - | [111] |
| Choi et al. | Therapeutic biomarkers | Network perturbation analysis | Available upon request. | [112] |
| Chen et al. | Therapeutic biomarkers | Pathway-pathway interaction network-based synergy evaluation | - | [113] |
| SimpleBool | Therapeutic biomarkers | Boolean network analysis on a knowledge-based network | https://github.com/SimpleBool/SimpleBool | [114] |
| Choi et al. | Therapeutic biomarkers | Boolean network modeling and attractor landscape analysis | Available upon request. | [115] |
| IMAHP | Therapeutic biomarkers | Protein co-regulation analysis to explore drug sensitivities | - | [116] |
| Lee et al. | Therapeutic biomarkers | Effect of time-staggered application of drugs on therapeutic response | - | [119] |
| Roumeliotis et al. | Variant Interpretation | Impact of genomic alterations on protein networks | - | [117] |
| Engin et al. | Variant Interpretation | Diffusion to evaluate downstream consequences of network perturbations | - | [118] |
| mCGfinder | Subtype biomarkers | Matrix decomposition to prioritize alterations concentrated in subsets of patients | https://github.com/USTC-HIlab/mCGfinder | [123] |
| Sun et al. | Subtype biomarkers | Weighted gene co-expression network analysis (WGCNA) | https://labs.genetics.ucla.edu/horvath/CoexpressionNetwork/Rpackages/WGCNA/ | [124] |
| CAERUS | Subtype biomarkers | Co-expression analysis of marker genes and network neighbors | http://www.oicr.on.ca/research/ouellette/caerus* | [125] |
| Net-Cox | Survival analysis | Network-informed Cox regression | http://compbio.cs.umn.edu/Net-Cox/ | [127] |
| DegreeCox | Survival analysis | Network-informed Cox regression | http://sels.tecnico.ulisboa.pt/gitlab/averissimo/degree-cox | [128] |
| Gade et al. | Survival analysis | Data integration; mRNA and miRNA expression profiles | https://static-content.springer.com/esm/art%3A10.1186%2F1471-2105-12-488/MediaObjects/12859_2011_5167_MOESM1_ESM.R | [121] |
| GIREN | Survival analysis | Data integration; gene measurements and interaction information | https://github.com/lzcyzm/GIREN | [129] |
| Huang et al. | Survival analysis | Pathway-based Cox regression | - | [130] |
| Eng et al. | Survival analysis | Pathway-based Cox regression | - | [131] |
| Zhang et al. | Survival analysis | Pathway-based Cox regression | http://www.ssg.uab.edu/bhglm/ | [132] |
| Yang et al. | Prognostic biomarkers | Time series analysis for dynamic network biomarkers indicating imminent state change | - | [133] |
| Chuang et al. | Prognositic biomarkers | Detection of subnetworks associated with metastatic breast cancer | - | [122] |
| Wu et al. | Prognostic biomarkers | Proximity to known cancer genes in interaction network | - | [46] |
| Yuan et al. | Prognostic biomarkers | Filtering a global interaction network against curated annotations | - | [135] |
| Zhou et al. | Prognostic biomarkers | Data integration; mRNA, miRNA and long non-coding RNA interactions | - | [136] |
Link listed in the original publication of the method is not valid.
Because tumor genomes are so heterogeneous, it’s rare that a single molecular event (e.g. HER2 upregulation in breast cancer) defines an entire subtype. Networks can be used to manage this heterogeneity to group samples with similar molecular profiles that might indicate tumor similarity even though different genes play synonymous roles [96]. Indeed, in some tumor types, molecular subtypes are naturally defined by the activity of a particular biological pathway (e.g. Wnt and SHH subtypes of medulloblastoma), but the pathway is activated by different mutations across patients.
Using mutation profiles to infer similar patient clusters requires that the data be processed to make it more amenable to statistical learning. Tumor mutation profiles are sparse and binary, with little overlap. Network-based stratification (NBS) [97] integrates molecular networks with mutation profiles to stratify tumors into clinically meaningful subtypes by clustering patients with mutations in similar network regions. This is done by first projecting the binary mutation profiles of each patient onto a gene interaction network, followed by the application of network propagation to spread the influence of mutations over the network. Then the ‘network-smoothed’ patient profiles, which are neither binary nor sparse, are clustered into subtypes using network regularized non-negative matrix factorization (NMF) combined with consensus clustering to ensure stability of the final clustering [97]. NetNorM normalizes patient mutation profiles based on gene network topology, adding or removing mutations for particular patients conditional on the distribution of mutations on the network [98] instead of network smoothing to overcome the sparse and binary nature of mutation data. NBS or similar approaches have successfully stratified cancer cohorts into subtypes that are related to clinical outcomes such as patient survival, response to therapy or tumor histology in ovarian, lung [97], colorectal, head and neck, kidney [99], endometrial [97,99,100] and prostate cancers [101].
In its original application, NBS used a fixed gene network for all cancer types. It has recently been suggested that interpatient heterogeneity could be better overcome by using cancer-type-specific networks. To this end, He et al. [100] employed expression data to create cancer-type-specific significant co-expression networks (SCNs) that were then used with somatic mutation data in an NBS approach. By focusing on the disease-specific network, it was possible to identify survival-associated subtypes in uterine corpus endometrial carcinoma (UCEC) cancer that were not detected by the original NBS method. There are also similar approaches [102,103] that integrate network architecture information with gene expression profiles (as opposed to somatic mutation data like in NBS) to assign weights to genes in a gene by patient matrix which is then clustered to stratify patients into groups and discover cancer subtypes. Smoothing expression across the network emphasizes groups of related genes with similar expression patterns across samples, thereby identifying more stable signals within the expression data.
Tumor stratification may be further improved by integrating multiple omic data layers. PARADIGM [104] integrates copy number variation, expression, and pathway-level data to infer patient-specific genetic activities. PARADIGM demonstrates that clustering patients based on their significant pathway perturbations divides them into clinically-relevant subgroups in glioblastoma multiforme (GBM) more successfully than using gene-level data (gene expression or copy number variation) in isolation. A method called SNF [105] constructs separate patient-by-patient similarity networks from DNA methylation, mRNA expression and miRNA expression, then fuses them into one network that represents the full spectrum of underlying data and can be used for cancer subtype discovery via spectral clustering. This approach not only avoids noise and bias from different data types but also takes advantage of the intersecting information of the overall molecular characteristics of the cohort. ndmaSNF [106] also takes advantage of the SNF framework, extending it by adding somatic mutation data to find cancer subtypes and demonstrating that these subtypes are characterized by distinct survival profiles. Overall, incorporating multi-omic data to a fused network is reported to enhance the power for discovering subtypes that correlate with survival or other clinical features in cancer.
Establishing the effectiveness of stratification using cost-effective gene panels is key to bring tumor stratification approaches into the clinic. In a recent study, Zhong et al. [99] demonstrated that small panels are effective in clustering tumors across 13 major cancer subtypes and even outperform full exome data for most cancer types. This is likely due to the enrichment of clinically important genes and cancer drivers in such panels compared to the full exome data which is dominated by passenger mutations [2]. Interestingly, the original NBS reported performance loss when silent or non-functional mutations were filtered [97], but the decrease in performance was not attributable to an effect on overall mutation burden.
Network analysis to identify therapeutic opportunities
Networks can be a useful tool in providing insights and guidance for designing cancer therapies, or even identifying possible synergistic drug combinations. Synergistic drug combinations are particularly attractive because they tend to be effective at lower doses, which can reduce toxicity and make it more difficult for tumors to develop resistance [107]. Li et al. [108] provided a report of recent tools and databases available for predicting synergistic drug combinations with ‘omics’ data. To predict drug responses or design drug combination, models have integrated disease signaling network data and transcriptomic expression data [109,110], protein interactions, protein-DNA interactions [111,112], and pathway-pathway interactions [113]. Using network modeling, researchers can view the interactions between drugs, cancer-related genes, therapeutic targets, and signaling pathways as a system, and thereby enhance the ability to suggest clinically applicable novel therapeutic approaches.
As an example, Lu et al. performed Boolean network analysis of epithelial cell transformation under normal and inflammatory conditions, implicating key regulatory modules in malignant transformation [114]. By perturbing specific nodes and running simulations on the network, they were able to predict effective drug combinations, validating that ceramide and PIK3CA/AKT/MTOR pathway inhibitors had synergistic anti-cancer effects in vitro. A similar analysis of TP53 signaling mapped perturbations of the TP53 pathway to a state space of proliferation, senescence or cell death, and predicted that nutlin-3, an MDM2 inhibitor, would have limited effectiveness in isolation, but would synergize with WIP1 inhibition to increase cell death [115].
Proteins involved in the same biological pathway or protein complex should also be transcriptionally co-regulated in order to maintain the necessary stoichiometry of constituent molecules. Deviations in co-regulation of proteins from a normal setting, evaluated using networks of gene or protein co-expression, has been shown to create exploitable drug sensitivities [116,117]. Somatic mutations were found to generate effects that were transmitted from the affected proteins to distant tightly co-regulated gene products via the PPI network [117], suggesting the necessity to look beyond the mutated genes themselves to understand oncogenic mechanism. Diffusion-based approaches have been adapted to evaluate possible downstream consequences of individual mutations [118], and could potentially be helpful for defining a search space for mutation-associated differential protein co-regulation.
Of note, Lee et al. reported that while simultaneous application of EGFR inhibitors and DNA-damaging chemotherapy did not result in synergy, time-staggered application significantly sensitized triple negative breast cancer cells to chemotherapy [119]. The authors chose EGFR signaling because of its known cross-talk with the DNA damage repair pathway. This suggests that dynamic network models could provide a strategy for systematically evaluating opportunities for drugs targeting one pathway to expose therapeutic vulnerabilities in another. This avenue remains largely unexplored however, because high-density time course measurements are required, and are difficult to obtain in an in vivo setting.
Networks as prognostic biomarkers
Another important aspect of clinical decision making is understanding prognosis. Some tumors may be slow to progress to malignancy and patients may be over-treated (as is common for ductal carcinoma in situ and prostate tumors), whereas others may be very aggressive and merit aggressive clinical intervention. Another important aspect of prognosis is monitoring for tumor progression post-treatment. Due to inter-tumor and inter-patient heterogeneity, individual somatic alterations or overexpressed proteins have limited value as biomarkers. One alternative is to use a panel of biomarkers; however, this comes with a risk of potential overfitting as there is a large number of possible combinations to explore [120]. Networks have been applied to optimize selection of relevant biomarkers [121], and have even been used directly as biomarkers themselves [122].
When clinically relevant tumor subtypes have been established, biomarkers are needed to confidently place patients within those subtypes. mCGfinder [123] uses a matrix decomposition framework over a gene interaction network to find genes where alterations are more concentrated in subsets of patients. This approach prioritizes recurrently altered genes that are biased toward subtypes and can thus be used to assign new patients, provided that a new patient has mutations in the relevant genes. Weighted gene co-expression network analysis (WGCNA) [124] provides a strategy to identify modules of co-expressed genes that distinguish groups of patients, and was able to implicate modules associated with tumor stage or grade in serous ovarian cancer. Stage and grade are markers of disease aggressiveness that are typically determined from histological analysis of tumor biopsies. CAERUS [125] was able to predict cancer-free versus recurrent disease status in both breast and ovarian cancers by analyzing the correlation of expression levels of selected marker genes and their network neighbors.
Survival time or time to recurrence post-treatment can serve as a proxy for aggressiveness of tumor subtype. Biomarkers associated with short versus long survival can be helpful in determining whether a patient’s disease should be monitored or treated aggressively. Mutations and gene expression levels can be assessed as prognostic biomarkers by analyzing their correlation with time to recurrence or death. Cox proportional hazards model [126] is a popular method performed for this task, but due to high dimensionality of mutation and expression data, it can suffer from overfitting. Use of networks has been suggested to overcome this issue by reducing dimensionality in a way that accounts for the relationship between genes. Network-based Cox regression models have been reported to improve accuracy of survival prediction in ovarian cancer (Net-Cox [127] and DegreeCox [128]). These methods incorporate a matrix representation of network information into the model such that the model is constrained to focus on genes that are particularly relevant. Net-Cox focuses on genes that are functionally related and co-expressed, whereas DegreeCox focuses on genes that are central in the network. Both methods have been shown to outperform Lasso and Ridge regression, approaches to dimensionality reduction that ignore the relationship between genes.
As it has been shown that non-redundant features are more effective in a machine learning setting, several approaches use networks to reduce redundancy in the space of features that are used for survival analysis. For example, under the assumption that miRNA-mRNA target pairs will have correlated expression, Gade et al. built a bipartite network of mRNA and miRNA target information in order to fuse miRNA and mRNA expression profiles and guide selection of non-redundant mRNA and miRNA features [121]. A method called GIREN uses an interaction network to group features, assuming that proximity in the network indicates functional redundancy [129].
Other methods have used measures of pathway activity as features for Cox regression instead of individual genes. For example, Huang et al. used pathway deregulation scores [130]; Eng et al. created a pathway-specific score by first using Lasso to select genes within pathways, and then combining the direction of gene activity into a patient-specific pathway index score [131]; and Zhang et al. first used Cox modeling to determine a prognostic score for each pathway based on the predictive value of their constituent genes, and then used the pathway prognostic scores as features for survival analysis [132].
Biomarkers of metastasis provide an alternative measure of progression that can be assessed from biopsy of the primary tumor and can be useful for identifying patients that may benefit from more aggressive therapeutic approaches. Chuang et al. analyzed gene expression on a PPI network to identify subnetworks differentially expressed between metastatic and non-metastatic breast tumors [122], enabling classification of tumors as metastatic based on gene expression profiles. These subnetwork biomarkers were more reproducible across cohorts than biomarkers based on individual genes. Because transitions in biological systems are often abrupt, time series analysis has been used to search for tipping-points or dynamic network biomarkers that indicate an imminent state change. Yang et al. applied this approach in the setting of hepatocellular carcinoma and implicated a subnetwork centered around CALM3 as a biomarker of pulmonary metastasis [133].
Because different mutated and differentially expressed genes characterize different tumor types and subtypes, different biomarkers of prognosis and progression are likely to be necessary for each disease. Wu et al. identified new prognostic genes for gastric cancer using proximity to known gastric cancer genes in a protein interaction network [46]. Tissue-specific networks may provide a strategy to better identify disease-specific biomarkers [134]. Yuan et al. [135] constructed a leukemia-specific protein-protein interaction network by filtering a global network against curated annotations in order to search for biomarkers for leukemia. Tissue-specific interaction networks for RNAs are less well-established. Zhou et al. [136] constructed a network from mRNA, miRNA and long non-coding RNA interactions from measurements derived from ovarian cancers and uncovered ten potential prognostic lncRNA biomarkers that classified patients into high- and low-risk subgroups with significantly different survival outcomes.
Patient-specific methods
In the clinical setting, decisions must be made about the treatment of individual patients. Even clinical trials are increasingly incorporating individual genomic information by placing patients into ‘baskets’ according to the genes in their tumor that harbor mutations [137]. However, a growing body of evidence suggests that patients with different mutations affecting the same gene can have very different responses to the same treatment [138]. For instance, different responses to HER2/HER3 inhibition by neratinib were recently reported for different mutations and tumor types [139]. Response to cetuximab, a drug used for treatment of colorectal cancer, also differs for specific mutations in the KRAS protein [140]. There are also examples of warfarin, carbamazepine and clopidogrel being shown to be ineffective in the presence of certain genetic perturbations [141,142]. This underscores the need for tools to accurately interpret patient-specific ‘omics data to advance precision cancer medicine (Table 3).
Table 3.
Network-based methods for N-of-1 tumor analyses to identify altered pathways or driver mutations.
| Method | Application | Approach | URL | Reference |
|---|---|---|---|---|
| Ingenuity Pathway Analysis | N-of-1 pathway analysis | Regulatory network inference and scoring from expression data using a curated causal network from the Ingenuity Knowledge Base | http://www.ingenuity.com | [148] |
| Pathifier | N-of-1 pathway analysis | Inferring pathway dysregulation scores for each tumor sample on the basis of expression data | www.weizmann.ac.il/pathifier/ | [149] |
| FAIME | N-of-1 transcriptomic analysis | Pathway and molecular functional profiles from gene expression | http://www.lussiergroup.org/publications/FAIME/ | [144] |
| N-of-1-pathway | N-of-1 transcriptomic analysis | Pathway and molecular functional profiles from gene expression (paired samples) | http://lussierlab.org/publications/N-of-1-pathways | [145] |
| MixEnrich | N-of-1 transcriptomic analysis | Detects bidirectionally responsive pathways using mixture models to group genes | http://lussiergroup.org/publications/MixEnrich | [147] |
| kMEn | N-of-1 transcriptomic analysis | Detects bidirectionally responsive pathways using K-means to group genes (paired samples) | http://www.lussierlab.org/publications/kMEn/ | [146] |
| N-OF-1-PATHWAYS-MD | N-of-1 transcriptomic analysis | Approximates the magnitude of dysregulation of pathways with biological or clinical significance (paired samples) | http://www.lussierlab.net/publications/N-of-1-pathways | [143] |
| OncoRep | N-of-1 transcriptomic analysis | Derives multiple layers of clinically relevant information from single sample RNA-Seq data | https://bitbucket.org/sulab/oncorep/ | [151] |
| Merid et al. | N-of-1 driver prediction | Co-occurrence of mutations and CNVs in a functional network | http://research.scilifelab.se/andrej_alexeyenko/downloads.html | [154] |
| DawnRank | N-of-1 driver prediction | Ranks mutated genes for overall impact on differential expression of downstream genes in the molecular interaction network | http://bioen-compbio.bioen.illinois.edu/DawnRank/* | [155] |
| OncoIMP ACT | N-of-1 driver prediction | Formulates the minimum set cover problem on a bipartite network linking mutated genes to downstream targets identified from network path analysis | https://sourceforge.net/projects/oncoimpact/ | [156] |
| SSN | N-of-1 driver prediction | Sample-specific networks based on expression differences relative to a panel of reference samples | http://sysbio.sibcb.ac.cn/cb/chenlab/software.htm | [157] |
| SCS | N-of-1 driver prediction | Formulates the minimum set cover problem on a bipartite patient-specific network linking mutated genes to downstream targets identified using control theory | http://sysbio.sibcb.ac.cn/cb/chenlab/software.htm | [158] |
Link listed in the original publication of the method is not valid.
Although affordable omics-based technologies have enabled great leaps in understanding of the mechanisms underlying the biology and clinical characteristics of cancer, few of these techniques work at the single-sample level. There is increasing interest in the development of bioinformatics tools that are able to interpret ‘omics data for individual subjects in disease related studies (e.g. personalome) [143]. In the setting of cancer, early methods have taken advantage of the availability of tumor ‘omics data to develop computational tools for single-patient tasks including identifying activated pathways, implicating personal driver mutations and predicting prognosis or drug sensitivities. Such N-of-1 methodologies could eventually inform patient assignments in clinical trials or support decision making in the clinic.
N-of-1 pathway identification
Studies that identify activated pathways from transcriptome profiles have thus far relied on the following three principles: (i) the statistical universe is a single patient; (ii) significance is derived from aggregating data on gene sets or biological modules from single or paired samples from the same patient; and (iii) pathway-level information is able to answer questions of clinical importance [143–147]. Transcriptome-based analyses can be formulated to allow interpretation [148,149] in terms of detection of deregulated gene sets related to mechanisms at various scales of biological organization (e.g. DNA repair, signaling, immune response). Using expression and pathway information, several N-of-1 studies have developed unidirectional pathway scores relying on a single [144,147] or paired samples from the same individual [145]. These scores are designed to find enrichment for extreme values within a pathway, for example by comparing the normalized sum of rank-weighted gene expression for genes in the pathway to all genes not in that pathway, after which pathways can be ranked by their scores [144]. Paired sample analysis takes advantage of having two or more samples from the same patient, either as a time-series, or as samples from a diseased versus non-diseased site, and then by using a statistical test (e.g. the Wilcoxon signed-rank test) to identify pathways that are overall up- or down-regulated between samples [145]. Variants have also been developed to detect pathway enrichment from bi-directional dysregulation which is ubiquitous in biological systems. N-of-1-pathways MixEnrich uses mixture modeling to cluster genes with normal versus aberrant (up- or down-regulated) expression, enabling detection of enrichment based on bi-directional effects [147]. kMEn also groups genes based on normal versus aberrant expression by clustering transcripts based on the absolute value of the log2 fold change between paired samples [146]. N-of-1 transcriptome-based methods have been applied to multiple cancer types, including head and neck cancer [144,147], lung adenocarcinoma [145], ovarian and breast cancer [146,149,150], and have been shown to distinguish tumor samples from matched normal and healthy control samples, and to correlate with survival.
For methods aimed at informing clinical decisions, an additional requirement is effective extraction and reporting of clinically relevant and actionable targets from complex data for single samples [151]. Schissler et al. refined the N-of-1-pathway framework wherein the Wilcoxon signed-rank test and Mahalanobis distance are combined to create a ‘clinical relevance metric’ (CRM) which provides information about the magnitude of deregulation of pathways with biological or clinical significance [143]. The clinical utility of the score was evaluated using bootstrapping, simulation and evaluation in biological replicates as well as by evaluating the ability of pathway scores to predict long term survival in breast cancer. OncoRep derives multiple layers of information from single sample RNA-seq data in the setting of breast cancer, including molecular subtype classification, altered genes and pathways, gene fusions and clinically actionable mutations [151]. The tool provides an HTML report of findings, as well as drug recommendations based on DrugBank [152] and PharmGkb [153].
N-of-1 driver prediction
Robust personalized driver prediction is required for discovering rare causal events in cancer that are often obscured by tumor heterogeneity and may provide important information for selecting effective therapies. Whereas Merid et al. developed a strategy to identify drivers based on co-occurrence of mutations and CNVs from individual tumors in a functional network in the absence of expression data [154], most driver prediction methods integrate mutation and expression. In general, most mutations in tumors are expected to be passengers with little impact on gene expression, therefore this problem can be framed as identifying the minimum set of mutations that explain the maximum variation in gene expression conditioned on connectivity in a network. DawnRank [155] and OncoIMPACT [156] predict personalized drivers based on the impact of mutated genes on the overall differential expression of downstream genes in the molecular interaction network. While DawnRank uses network propagation to rank genes that broadly influence gene expression while controlling for the effects of network topology, OncoIMPACT finds paths between mutated and differentially expressed, defining parameters related to the path length and degree of nodes along the path to constrain predictions. OncoIMPACT uses the resulting paths to construct a bipartite network connecting mutated genes with differentially expressed genes and applies the minimum set cover criteria to select drivers.
The previously described methods rely on a single global network for prioritizing driver genes; however, it is also possible to create patient-specific networks from transcriptional measurements. This is the approach taken by sample-specific networks (SSN) [157], which constructs networks that emphasize expression differences relative to a panel of reference samples. This approach was applied to the TCGA to characterize cancer at a network level and to identify individual-specific disease modules and driver genes without using mutation information. The Single-sample Controller Strategy (SCS) creates patient-specific networks by focusing on the regions of a molecular network most relevant to mutations and differentially expressed genes [158], where differential expression is determined from paired tumor-normal samples. Personalized drivers are again identified through mapping to a bipartite network, in this case by relying on control theory, and then by applying the minimum set cover. Early results from these analyses suggest that patient-specific networks may be more effective for identifying the drivers in individual tumors [158], and aggregating single-sample drivers across tumors could lead to new insights for some cancer types [157].
While some N-of-1 methods truly require only data from a single sample, others may rely on cohort analysis for parameter fitting [156], or require comparison against a control or reference population [149,157]. Although N-of-1 network analyses show promise for enabling single-patient inference, it is rare for tumors to undergo whole transcriptome and exome sequencing and even less frequent that matched tumor-normal transcriptomic and genomic data are available. Thus, there are currently practical limitations for the broad adoption of such approaches.
Road to the clinic
Mutations and copy number changes of individual genes have long been used as clinical biomarkers for the selection of therapies in patients with various forms of cancer. In most cases these genetic abnormalities are directly related to the targeted therapy in question, like BCR-ABL and imatinib, activating EGFR mutations and erlotinib, and HER2 amplification and trastuzumab. These relationships are not cryptic and are easy to demonstrate in pre-clinical studies, making it easier to develop them in clinical trials. Historically, genetic associations with response to these types of targeted agents have been robust, dramatic, and extremely meaningful clinically. This has made the adoption of molecularly targeted therapies and their associated genetic biomarkers routine in the area of oncology.
There have also been examples of more complex genomic information used to tailor therapy in cancer patients, although the road to clinical implementation of these approaches has been more challenging. For example, patterns of gene expression in patients with early stage, estrogen-receptor positive breast cancer can predict the likelihood of disease recurrence and the expected risk reduction from adjuvant chemotherapy. The prototypic clinical implementation of this approach was with the Oncotype DX test that examines the expression of 21 genes in a breast tumor sample [159]. This panel was reduced from a larger analysis of 250 candidate genes validated in three independent cohorts and can be performed on fresh-frozen paraffin embedded (FFPE) tissue [160]. The results of the test are given as a single score that estimates the risk of recurrence and can be roughly divided into a binary decision with only a small range of indeterminate values. Subsequent studies and years of clinical use have repeatedly supported the analytic validity and predictive value of this test which is now considered a standard of care [161–164]. Several similar approaches have since been implemented in breast and other cancers including colorectal and prostate.
There are three principle lessons that can be learned from the Oncotype DX example that apply to newer, and more complex, network-derived biomarkers. First, the experimentally generated model must be reduced to practice in a way that is economically feasible, reproducible, and analytically valid across a range of conditions (e.g., sample quantity, age, quality, fixation, etc.). Second, the result of the assay must be unambiguous and easy to interpret. A propensity score associated with a clinical outcome like the Oncotype DX RS score or a binary result like ‘positive’ or ‘negative’ are more interpretable than a list of likely cancer driver pathways untethered to a specific drug or therapy. Finally, the assay will require extensive validation in multiple cohorts and must outperform the existing standard of care. Even then, clinical adoption and inclusion in consensus treatment guidelines (often required for insurance reimbursement) can take time. Partnering with cooperative groups, study sponsors, and clinical tissue banks to examine already collected samples would greatly accelerate the validation process.
In some cases, genomic analysis could lead to a discovery which then enables the identification of a non-genetic biomarker that is easier to detect. Unsupervised gene expression analysis of diffuse large B-cell lymphomas (DLBCL), for example, found two highly reproducible gene profiles dubbed germinal B-cell like (GCB) and activated B-cell like (ABC) for their resemblance to normal germinal and activated B-cell signatures [165]. The distinction between ABC and GCB subtypes of DLBCL was clinically significant as these groups had very different outcomes after standard treatment. While the expression signature could be predicted by analyzing a small number of genes, it was noted that cell surface markers identifiable with immunohistochemistry could also distinguish these groups [166–168]. At the time, this assay was much more accessible and familiar to pathologists, enabling its rapid adoption in practice. This example reinforces the point that network analyses that identify vulnerabilities in cancer patients must be reduced to practice in a way that is accessible to both those doing the testing and those receiving the results. Being able to generate the requisite data with established methods will lower the barrier to clinical implementation.
The types of network and machine learning algorithms described here will enable more precise and individualized classification of many cancer types. For rarer tumor types, large scale validation studies of recommended therapies may not be possible. Instead, we will need to use approaches like CancerLinQ, developed by the American Society of Clinical Oncology, to register and follow outcomes of every patient evaluated with these tools and treated based on the predictions they make. This will enable the evaluation of competing approaches in a variety of clinical contexts, ultimately providing confidence about the value of these techniques.
Discussion & Conclusion
Networks have proved repeatedly to be a powerful tool for studying biological systems in health and disease. In this review, we examined algorithmic and analytic innovations in the application of network analysis to cancer, a setting uniquely characterized by an abundance of molecular data including multiple ‘omic data layers and paired disease-normal samples. In this setting, networks have been used to overcome inter-tumoral heterogeneity, facilitate data integration and capture interactions among genomic, epigenetic and transcriptomic alterations. Across samples, networks have helped implicate driver pathways, genes and mutations, identify cancer subtypes, stratify patients with similar disease and uncover novel biomarkers of prognosis and therapeutic response (Figure 5). Networks can also support single sample inference, helping to identify activated pathways and personal driver mutations. Across all of these settings, networks are an important departure point for systems biology; they provide a fundamental structure for moving beyond single gene explanations for disease phenomena. However, there are many practical considerations to be addressed before network methods can be translated for applications in precision medicine.
Figure 5.

Network of network-based methods used in cancer. Nodes represent the name of the methods and edges represent similarity in the utilized algorithmic approaches. The colors of nodes represent the application of the method. Similar applications are grouped together (dashed line) under four main categories: driver identification for pathways, genes (or miRNAs or alternative splicing) or mutations, patient stratification, network biomarkers (therapeutic biomarkers, variant interpretation, subtype biomarkers, survival analysis, prognostic biomarkers) and N-of-1 analysis including transcriptomic analysis and driver prediction.
Highlights.
Networks provide a platform for inference from ‘omic data
Many network-based methods have been developed around cancer ‘omic data analysis
Most tumor network analyses rely on cohorts, but some N-of-1 methods exist
Many challenges remain for applying network-based analysis in clinical settings
Acknowledgments
This work was supported by the National Institutes of Health (NIH) grant DP5-OD017937 to H.C., SDCSB Systems Biology training grant (GM085764 and CA209891) to K.O., National Library of Medicine training grant T15LM011271 to M.D., and CIFAR fellowship to H.C.
Footnotes
Publisher's Disclaimer: This is a PDF file of an unedited manuscript that has been accepted for publication. As a service to our customers we are providing this early version of the manuscript. The manuscript will undergo copyediting, typesetting, and review of the resulting proof before it is published in its final citable form. Please note that during the production process errors may be discovered which could affect the content, and all legal disclaimers that apply to the journal pertain.
References
- 1.Hanahan D, Weinberg RA. Hallmarks of cancer: the next generation. Cell. 2011;144:646–74. doi: 10.1016/j.cell.2011.02.013. [DOI] [PubMed] [Google Scholar]
- 2.Vogelstein B, Papadopoulos N, Velculescu VE, Zhou S, Diaz LA, Kinzler KW. Cancer Genome Landscapes. Science (80-) 2013;339:1546–1558. doi: 10.1126/science.1235122. [DOI] [PMC free article] [PubMed] [Google Scholar]
- 3.Carter H, Chen S, Isik L, Tyekucheva S, Velculescu VE, Kinzler KW, Vogelstein B, Karchin R. Cancer-specific high-throughput annotation of somatic mutations: computational prediction of driver missense mutations. Cancer Res. 2009;69:6660–7. doi: 10.1158/0008-5472.CAN-09-1133. [DOI] [PMC free article] [PubMed] [Google Scholar]
- 4.Pleasance ED, Cheetham RK, Stephens PJ, McBride DJ, Humphray SJ, Greenman CD, Varela I, Lin M-L, Ordóñez GR, Bignell GR, Ye K, Alipaz J, Bauer MJ, Beare D, Butler A, Carter RJ, Chen L, Cox AJ, Edkins S, Kokko-Gonzales PI, Gormley NA, Grocock RJ, Haudenschild CD, Hims MM, James T, Jia M, Kingsbury Z, Leroy C, Marshall J, Menzies A, Mudie LJ, Ning Z, Royce T, Schulz-Trieglaff OB, Spiridou A, Stebbings LA, Szajkowski L, Teague J, Williamson D, Chin L, Ross MT, Campbell PJ, Bentley DR, Futreal PA, Stratton MR. A comprehensive catalogue of somatic mutations from a human cancer genome. Nature. 2010;463:191–6. doi: 10.1038/nature08658. [DOI] [PMC free article] [PubMed] [Google Scholar]
- 5.Shields BD, Mahmoud F, Taylor EM, Byrum SD, Sengupta D, Koss B, Baldini G, Ransom S, Cline K, Mackintosh SG, Edmondson RD, Shalin S, Tackett AJ. Indicators of responsiveness to immune checkpoint inhibitors. Sci Rep. 2017;7:807. doi: 10.1038/s41598-017-01000-2. [DOI] [PMC free article] [PubMed] [Google Scholar]
- 6.Hermel DJ, Ott PA. Combining forces: the promise and peril of synergistic immune checkpoint blockade and targeted therapy in metastatic melanoma. Cancer Metastasis Rev. 2017;36:43–50. doi: 10.1007/s10555-017-9656-2. [DOI] [PubMed] [Google Scholar]
- 7.Pitt JM, Vétizou M, Daillère R, Roberti MP, Yamazaki T, Routy B, Lepage P, Boneca IG, Chamaillard M, Kroemer G, Zitvogel L. Resistance Mechanisms to Immune-Checkpoint Blockade in Cancer: Tumor-Intrinsic and -Extrinsic Factors. Immunity. 2016;44:1255–69. doi: 10.1016/j.immuni.2016.06.001. [DOI] [PubMed] [Google Scholar]
- 8.Prahallad A, Sun C, Huang S, Di Nicolantonio F, Salazar R, Zecchin D, Beijersbergen RL, Bardelli A, Bernards R. Unresponsiveness of colon cancer to BRAF(V600E) inhibition through feedback activation of EGFR. Nature. 2012;483:100–3. doi: 10.1038/nature10868. [DOI] [PubMed] [Google Scholar]
- 9.Sawyers CL. The cancer biomarker problem. Nature. 2008;452:548–52. doi: 10.1038/nature06913. [DOI] [PubMed] [Google Scholar]
- 10.Schilsky RL. Implementing personalized cancer care. Nat Rev Clin Oncol. 2014;11:432–8. doi: 10.1038/nrclinonc.2014.54. [DOI] [PubMed] [Google Scholar]
- 11.Wood LD, Parsons DW, Jones S, Lin J, Sjöblom T, Leary RJ, Shen D, Boca SM, Barber T, Ptak J, Silliman N, Szabo S, Dezso Z, Ustyanksky V, Nikolskaya T, Nikolsky Y, Karchin R, Wilson PA, Kaminker JS, Zhang Z, Croshaw R, Willis J, Dawson D, Shipitsin M, Willson JKV, Sukumar S, Polyak K, Park BH, Pethiyagoda CL, Pant PVK, Ballinger DG, Sparks AB, Hartigan J, Smith DR, Suh E, Papadopoulos N, Buckhaults P, Markowitz SD, Parmigiani G, Kinzler KW, Velculescu VE, Vogelstein B. The genomic landscapes of human breast and colorectal cancers. Science. 2007;318:1108–13. doi: 10.1126/science.1145720. [DOI] [PubMed] [Google Scholar]
- 12.Ali MA, Sjöblom T. Molecular pathways in tumor progression: from discovery to functional understanding. Mol Biosyst. 2009;5:902–8. doi: 10.1039/b903502h. [DOI] [PubMed] [Google Scholar]
- 13.Garraway LA, Lander ES. Lessons from the Cancer Genome. Cell. 2013;153:17–37. doi: 10.1016/j.cell.2013.03.002. [DOI] [PubMed] [Google Scholar]
- 14.Knudsen ES, Wang JYJ. Targeting the RB-pathway in cancer therapy. Clin Cancer Res. 2010;16:1094–9. doi: 10.1158/1078-0432.CCR-09-0787. [DOI] [PMC free article] [PubMed] [Google Scholar]
- 15.Spring L, Bardia A, Modi S. Targeting the cyclin D-cyclin-dependent kinase (CDK) 4/6-retinoblastoma pathway with selective CDK 4/6 inhibitors in hormone receptor-positive breast cancer: rationale, current status, and future directions. [accessed March 9, 2018];Discov Med. 2016 21:65–74. http://www.ncbi.nlm.nih.gov/pubmed/26896604. [PMC free article] [PubMed] [Google Scholar]
- 16.Barabási A-L, Gulbahce N, Loscalzo J. Network medicine: a network-based approach to human disease. Nat Rev Genet. 2011;12:56–68. doi: 10.1038/nrg2918. [DOI] [PMC free article] [PubMed] [Google Scholar]
- 17.Lawrence MS, Stojanov P, Polak P, Kryukov GV, Cibulskis K, Sivachenko A, Carter SL, Stewart C, Mermel CH, Roberts SA, Kiezun A, Hammerman PS, McKenna A, Drier Y, Zou L, Ramos AH, Pugh TJ, Stransky N, Helman E, Kim J, Sougnez C, Ambrogio L, Nickerson E, Shefler E, Cortés ML, Auclair D, Saksena G, Voet D, Noble M, DiCara D, Lin P, Lichtenstein L, Heiman DI, Fennell T, Imielinski M, Hernandez B, Hodis E, Baca S, Dulak AM, Lohr J, Landau D-A, Wu CJ, Melendez-Zajgla J, Hidalgo-Miranda A, Koren A, McCarroll SA, Mora J, Lee RS, Crompton B, Onofrio R, Parkin M, Winckler W, Ardlie K, Gabriel SB, Roberts CWM, Biegel JA, Stegmaier K, Bass AJ, Garraway LA, Meyerson M, Golub TR, Gordenin DA, Sunyaev S, Lander ES, Getz G. Mutational heterogeneity in cancer and the search for new cancer-associated genes. Nature. 2013;499:214–8. doi: 10.1038/nature12213. [DOI] [PMC free article] [PubMed] [Google Scholar]
- 18.Dees ND, Zhang Q, Kandoth C, Wendl MC, Schierding W, Koboldt DC, Mooney TB, Callaway MB, Dooling D, Mardis ER, Wilson RK, Ding L. MuSiC: identifying mutational significance in cancer genomes. Genome Res. 2012;22:1589–98. doi: 10.1101/gr.134635.111. [DOI] [PMC free article] [PubMed] [Google Scholar]
- 19.Tokheim CJ, Papadopoulos N, Kinzler KW, Vogelstein B, Karchin R. Evaluating the evaluation of cancer driver genes. Proc Natl Acad Sci. 2016;113:14330–14335. doi: 10.1073/pnas.1616440113. [DOI] [PMC free article] [PubMed] [Google Scholar]
- 20.Gonzalez-Perez A, Lopez-Bigas N. Functional impact bias reveals cancer drivers. Nucleic Acids Res. 2012;40:e169. doi: 10.1093/nar/gks743. [DOI] [PMC free article] [PubMed] [Google Scholar]
- 21.Cary MP, Bader GD, Sander C. Pathway information for systems biology. FEBS Lett. 2005;579:1815–1820. doi: 10.1016/J.FEBSLET.2005.02.005. [DOI] [PubMed] [Google Scholar]
- 22.Hahn WC, Weinberg RA. Modelling the molecular circuitry of cancer. Nat Rev Cancer. 2002;2:331–41. doi: 10.1038/nrc795. [DOI] [PubMed] [Google Scholar]
- 23.Vogelstein B, Kinzler KW. Cancer genes and the pathways they control. Nat Med. 2004;10:789–99. doi: 10.1038/nm1087. [DOI] [PubMed] [Google Scholar]
- 24.Vandin F, Upfal E, Raphael BJ. Algorithms for detecting significantly mutated pathways in cancer. J Comput Biol. 2011;18:507–22. doi: 10.1089/cmb.2010.0265. [DOI] [PubMed] [Google Scholar]
- 25.Leiserson MDM, Vandin F, Wu H-T, Dobson JR, Eldridge JV, Thomas JL, Papoutsaki A, Kim Y, Niu B, McLellan M, Lawrence MS, Gonzalez-Perez A, Tamborero D, Cheng Y, Ryslik GA, Lopez-Bigas N, Getz G, Ding L, Raphael BJ. Pan-cancer network analysis identifies combinations of rare somatic mutations across pathways and protein complexes. Nat Genet. 2015;47:106–14. doi: 10.1038/ng.3168. [DOI] [PMC free article] [PubMed] [Google Scholar]
- 26.Babaei S, Hulsman M, Reinders M, de Ridder J. Detecting recurrent gene mutation in interaction network context using multi-scale graph diffusion. BMC Bioinformatics. 2013;14:29. doi: 10.1186/1471-2105-14-29. [DOI] [PMC free article] [PubMed] [Google Scholar]
- 27.Jia P, Zhao Z. VarWalker: personalized mutation network analysis of putative cancer genes from next-generation sequencing data. PLoS Comput Biol. 2014;10:e1003460. doi: 10.1371/journal.pcbi.1003460. [DOI] [PMC free article] [PubMed] [Google Scholar]
- 28.Köhler S, Bauer S, Horn D, Robinson PN. Walking the interactome for prioritization of candidate disease genes. Am J Hum Genet. 2008;82:949–58. doi: 10.1016/j.ajhg.2008.02.013. [DOI] [PMC free article] [PubMed] [Google Scholar]
- 29.Brin S, Page L. The anatomy of a large-scale hypertextual Web search engine. Comput Networks ISDN Syst. 1998;30:107–117. doi: 10.1016/S0169-7552(98)00110-X. [DOI] [Google Scholar]
- 30.Cerami E, Demir E, Schultz N, Taylor BS, Sander C. Automated network analysis identifies core pathways in glioblastoma. PLoS One. 2010;5:e8918. doi: 10.1371/journal.pone.0008918. [DOI] [PMC free article] [PubMed] [Google Scholar]
- 31.Girvan M, Newman MEJ. Community structure in social and biological networks. Proc Natl Acad Sci U S A. 2002;99:7821–6. doi: 10.1073/pnas.122653799. [DOI] [PMC free article] [PubMed] [Google Scholar]
- 32.Hristov BH, Singh M. Network-Based Coverage of Mutational Profiles Reveals Cancer Genes. Cell Syst. 2017;5:221–229.e4. doi: 10.1016/j.cels.2017.09.003. [DOI] [PMC free article] [PubMed] [Google Scholar]
- 33.Sun Y, Ma C, Halgamuge S. The node-weighted Steiner tree approach to identify elements of cancer-related signaling pathways. BMC Bioinformatics. 2017;18:551. doi: 10.1186/s12859-017-1958-4. [DOI] [PMC free article] [PubMed] [Google Scholar]
- 34.Tuncbag N, Milani P, Pokorny JL, Johnson H, Sio TT, Dalin S, Iyekegbe DO, White FM, Sarkaria JN, Fraenkel E. Network Modeling Identifies Patient-specific Pathways in Glioblastoma. Sci Rep. 2016;6:28668. doi: 10.1038/srep28668. [DOI] [PMC free article] [PubMed] [Google Scholar]
- 35.Paull EO, Carlin DE, Niepel M, Sorger PK, Haussler D, Stuart JM. Discovering causal pathways linking genomic events to transcriptional states using Tied Diffusion Through Interacting Events (TieDIE) Bioinformatics. 2013;29:2757–64. doi: 10.1093/bioinformatics/btt471. [DOI] [PMC free article] [PubMed] [Google Scholar]
- 36.Zhang J, Zhang S, Wang Y, Zhang X-S. Identification of mutated core cancer modules by integrating somatic mutation, copy number variation, and gene expression data. BMC Syst Biol 7 Suppl. 2013;2:S4. doi: 10.1186/1752-0509-7-S2-S4. [DOI] [PMC free article] [PubMed] [Google Scholar]
- 37.Miller CA, Settle SH, Sulman EP, Aldape KD, Milosavljevic A. Discovering functional modules by identifying recurrent and mutually exclusive mutational patterns in tumors. BMC Med Genomics. 2011;4:34. doi: 10.1186/1755-8794-4-34. [DOI] [PMC free article] [PubMed] [Google Scholar]
- 38.Vandin F, Upfal E, Raphael BJ. De novo discovery of mutated driver pathways in cancer. Genome Res. 2012;22:375–85. doi: 10.1101/gr.120477.111. [DOI] [PMC free article] [PubMed] [Google Scholar]
- 39.Leiserson MDM, Blokh D, Sharan R, Raphael BJ. Simultaneous identification of multiple driver pathways in cancer. PLoS Comput Biol. 2013;9:e1003054. doi: 10.1371/journal.pcbi.1003054. [DOI] [PMC free article] [PubMed] [Google Scholar]
- 40.Zhao J, Zhang S, Wu L-Y, Zhang X-S. Efficient methods for identifying mutated driver pathways in cancer. Bioinformatics. 2012;28:2940–7. doi: 10.1093/bioinformatics/bts564. [DOI] [PubMed] [Google Scholar]
- 41.Szczurek E, Beerenwinkel N. Modeling mutual exclusivity of cancer mutations. PLoS Comput Biol. 2014;10:e1003503. doi: 10.1371/journal.pcbi.1003503. [DOI] [PMC free article] [PubMed] [Google Scholar]
- 42.Ciriello G, Cerami E, Sander C, Schultz N. Mutual exclusivity analysis identifies oncogenic network modules. Genome Res. 2012;22:398–406. doi: 10.1101/gr.125567.111. [DOI] [PMC free article] [PubMed] [Google Scholar]
- 43.Oti M, Brunner HG. The modular nature of genetic diseases. Clin Genet. 2007;71:1–11. doi: 10.1111/j.1399-0004.2006.00708.x. [DOI] [PubMed] [Google Scholar]
- 44.Oliver S. Guilt-by-association goes global. Nature. 2000;403:601–3. doi: 10.1038/35001165. [DOI] [PubMed] [Google Scholar]
- 45.Lin L, Yang T, Fang L, Yang J, Yang F, Zhao J. Gene gravity-like algorithm for disease gene prediction based on phenotype-specific network. BMC Syst Biol. 2017;11:121. doi: 10.1186/s12918-017-0519-9. [DOI] [PMC free article] [PubMed] [Google Scholar]
- 46.Wu X, Tang H, Guan A, Sun F, Wang H, Shu J. Finding gastric cancer related genes and clinical biomarkers for detection based on gene-gene interaction network. Math Biosci. 2016;276:1–7. doi: 10.1016/j.mbs.2015.12.001. [DOI] [PubMed] [Google Scholar]
- 47.Vanunu O, Magger O, Ruppin E, Shlomi T, Sharan R. Associating genes and protein complexes with disease via network propagation. PLoS Comput Biol. 2010;6:e1000641. doi: 10.1371/journal.pcbi.1000641. [DOI] [PMC free article] [PubMed] [Google Scholar]
- 48.Mezlini AM, Goldenberg A. Incorporating networks in a probabilistic graphical model to find drivers for complex human diseases. PLoS Comput Biol. 2017;13:e1005580. doi: 10.1371/journal.pcbi.1005580. [DOI] [PMC free article] [PubMed] [Google Scholar]
- 49.Cho A, Shim JE, Kim E, Supek F, Lehner B, Lee I. MUFFINN: cancer gene discovery via network analysis of somatic mutation data. Genome Biol. 2016;17:129. doi: 10.1186/s13059-016-0989-x. [DOI] [PMC free article] [PubMed] [Google Scholar]
- 50.Horn H, Lawrence MS, Chouinard CR, Shrestha Y, Hu JX, Worstell E, Shea E, Ilic N, Kim E, Kamburov A, Kashani A, Hahn WC, Campbell JD, Boehm JS, Getz G, Lage K. NetSig: network-based discovery from cancer genomes. Nat Methods. 2017;15:61–66. doi: 10.1038/nmeth.4514. [DOI] [PMC free article] [PubMed] [Google Scholar]
- 51.Mermel CH, Schumacher SE, Hill B, Meyerson ML, Beroukhim R, Getz G. GISTIC2.0 facilitates sensitive and confident localization of the targets of focal somatic copy-number alteration in human cancers. Genome Biol. 2011;12:R41. doi: 10.1186/gb-2011-12-4-r41. [DOI] [PMC free article] [PubMed] [Google Scholar]
- 52.Luo J, Liang S. Prioritization of potential candidate disease genes by topological similarity of protein-protein interaction network and phenotype data. J Biomed Inform. 2015;53:229–36. doi: 10.1016/j.jbi.2014.11.004. [DOI] [PubMed] [Google Scholar]
- 53.Liu B, Jin M, Zeng P. Prioritization of candidate disease genes by combining topological similarity and semantic similarity. J Biomed Inform. 2015;57:1–5. doi: 10.1016/j.jbi.2015.07.005. [DOI] [PubMed] [Google Scholar]
- 54.Cantini L, Medico E, Fortunato S, Caselle M. Detection of gene communities in multi-networks reveals cancer drivers. Sci Rep. 2015;5:17386. doi: 10.1038/srep17386. [DOI] [PMC free article] [PubMed] [Google Scholar]
- 55.Yuan F, Lu W. Prediction of potential drivers connecting different dysfunctional levels in lung adenocarcinoma via a protein-protein interaction network. Biochim Biophys Acta. 2017 doi: 10.1016/j.bbadis.2017.11.018. [DOI] [PubMed] [Google Scholar]
- 56.Davoli T, Xu AW, Mengwasser KE, Sack LM, Yoon JC, Park PJ, Elledge SJ. Cumulative haploinsufficiency and triplosensitivity drive aneuploidy patterns and shape the cancer genome. Cell. 2013;155:948–62. doi: 10.1016/j.cell.2013.10.011. [DOI] [PMC free article] [PubMed] [Google Scholar]
- 57.Akavia UD, Litvin O, Kim J, Sanchez-Garcia F, Kotliar D, Causton HC, Pochanard P, Mozes E, Garraway LA, Pe’er D. An integrated approach to uncover drivers of cancer. Cell. 2010;143:1005–17. doi: 10.1016/j.cell.2010.11.013. [DOI] [PMC free article] [PubMed] [Google Scholar]
- 58.Chen Y, Hao J, Jiang W, He T, Zhang X, Jiang T, Jiang R. Identifying potential cancer driver genes by genomic data integration. Sci Rep. 2013;3:3538. doi: 10.1038/srep03538. [DOI] [PMC free article] [PubMed] [Google Scholar]
- 59.Miller ML, Reznik E, Gauthier NP, Aksoy BA, Korkut A, Gao J, Ciriello G, Schultz N, Sander C. Pan-Cancer Analysis of Mutation Hotspots in Protein Domains. Cell Syst. 2015;1:197–209. doi: 10.1016/j.cels.2015.08.014. [DOI] [PMC free article] [PubMed] [Google Scholar]
- 60.Stehr H, Jang S-HJ, Duarte JM, Wierling C, Lehrach H, Lappe M, Lange BMH. The structural impact of cancer-associated missense mutations in oncogenes and tumor suppressors. Mol Cancer. 2011;10:54. doi: 10.1186/1476-4598-10-54. [DOI] [PMC free article] [PubMed] [Google Scholar]
- 61.Kamburov A, Lawrence MS, Polak P, Leshchiner I, Lage K, Golub TR, Lander ES, Getz G. Comprehensive assessment of cancer missense mutation clustering in protein structures. Proc Natl Acad Sci U S A. 2015;112:E5486–95. doi: 10.1073/pnas.1516373112. [DOI] [PMC free article] [PubMed] [Google Scholar]
- 62.Yue P, Forrest WF, Kaminker JS, Lohr S, Zhang Z, Cavet G. Inferring the functional effects of mutation through clusters of mutations in homologous proteins. Hum Mutat. 2010;31:264–71. doi: 10.1002/humu.21194. [DOI] [PubMed] [Google Scholar]
- 63.Tamborero D, Gonzalez-Perez A, Lopez-Bigas N. OncodriveCLUST: exploiting the positional clustering of somatic mutations to identify cancer genes. Bioinformatics. 2013;29:2238–44. doi: 10.1093/bioinformatics/btt395. [DOI] [PubMed] [Google Scholar]
- 64.Zhong Q, Simonis N, Li Q-R, Charloteaux B, Heuze F, Klitgord N, Tam S, Yu H, Venkatesan K, Mou D, Swearingen V, Yildirim MA, Yan H, Dricot A, Szeto D, Lin C, Hao T, Fan C, Milstein S, Dupuy D, Brasseur R, Hill DE, Cusick ME, Vidal M. Edgetic perturbation models of human inherited disorders. Mol Syst Biol. 2009;5:321. doi: 10.1038/msb.2009.80. [DOI] [PMC free article] [PubMed] [Google Scholar]
- 65.Yi S, Lin S, Li Y, Zhao W, Mills GB, Sahni N. Functional variomics and network perturbation: connecting genotype to phenotype in cancer. Nat Rev Genet. 2017;18:395–410. doi: 10.1038/nrg.2017.8. [DOI] [PMC free article] [PubMed] [Google Scholar]
- 66.Vázquez M, Valencia A, Pons T. Structure-PPi: a module for the annotation of cancer-related single-nucleotide variants at protein-protein interfaces. Bioinformatics. 2015;31:2397–9. doi: 10.1093/bioinformatics/btv142. [DOI] [PMC free article] [PubMed] [Google Scholar]
- 67.Mosca R, Tenorio-Laranga J, Olivella R, Alcalde V, Céol A, Soler-López M, Aloy P. dSysMap: exploring the edgetic role of disease mutations. Nat Methods. 2015;12:167–168. doi: 10.1038/nmeth.3289. [DOI] [PubMed] [Google Scholar]
- 68.Li M, Simonetti FL, Goncearenco A, Panchenko AR. MutaBind estimates and interprets the effects of sequence variants on protein–protein interactions. Nucleic Acids Res. 2016;44:W494–W501. doi: 10.1093/nar/gkw374. [DOI] [PMC free article] [PubMed] [Google Scholar]
- 69.Porta-Pardo E, Garcia-Alonso L, Hrabe T, Dopazo J, Godzik A. A Pan-Cancer Catalogue of Cancer Driver Protein Interaction Interfaces. PLoS Comput Biol. 2015;11:e1004518. doi: 10.1371/journal.pcbi.1004518. [DOI] [PMC free article] [PubMed] [Google Scholar]
- 70.Raimondi F, Singh G, Betts MJ, Apic G, Vukotic R, Andreone P, Stein L, Russell RB. Insights into cancer severity from biomolecular interaction mechanisms. Sci Rep. 2016;6:34490. doi: 10.1038/srep34490. [DOI] [PMC free article] [PubMed] [Google Scholar]
- 71.Greenman C, Stephens P, Smith R, Dalgliesh GL, Hunter C, Bignell G, Davies H, Teague J, Butler A, Stevens C, Edkins S, O’Meara S, Vastrik I, Schmidt EE, Avis T, Barthorpe S, Bhamra G, Buck G, Choudhury B, Clements J, Cole J, Dicks E, Forbes S, Gray K, Halliday K, Harrison R, Hills K, Hinton J, Jenkinson A, Jones D, Menzies A, Mironenko T, Perry J, Raine K, Richardson D, Shepherd R, Small A, Tofts C, Varian J, Webb T, West S, Widaa S, Yates A, Cahill DP, Louis DN, Goldstraw P, Nicholson AG, Brasseur F, Looijenga L, Weber BL, Chiew Y-E, deFazio A, Greaves MF, Green AR, Campbell P, Birney E, Easton DF, Chenevix-Trench G, Tan M-H, Khoo SK, Teh BT, Yuen ST, Leung SY, Wooster R, Futreal PA, Stratton MR. Patterns of somatic mutation in human cancer genomes. Nature. 2007;446:153–158. doi: 10.1038/nature05610. [DOI] [PMC free article] [PubMed] [Google Scholar]
- 72.Engin HB, Kreisberg JF, Carter H. Structure-Based Analysis Reveals Cancer Missense Mutations Target Protein Interaction Interfaces. PLoS One. 2016;11:e0152929. doi: 10.1371/journal.pone.0152929. [DOI] [PMC free article] [PubMed] [Google Scholar]
- 73.Betts MJ, Lu Q, Jiang Y, Drusko A, Wichmann O, Utz M, Valtierra-Gutiérrez IA, Schlesner M, Jaeger N, Jones DT, Pfister S, Lichter P, Eils R, Siebert R, Bork P, Apic G, Gavin A-C, Russell RB. Mechismo: predicting the mechanistic impact of mutations and modifications on molecular interactions. Nucleic Acids Res. 2015;43:e10. doi: 10.1093/nar/gku1094. [DOI] [PMC free article] [PubMed] [Google Scholar]
- 74.Dehouck Y, Kwasigroch JM, Rooman M, Gilis D. BeAtMuSiC: prediction of changes in protein–protein binding affinity on mutations. Nucleic Acids Res. 2013;41:W333–W339. doi: 10.1093/nar/gkt450. [DOI] [PMC free article] [PubMed] [Google Scholar]
- 75.Guerois R, Nielsen JE, Serrano L. Predicting changes in the stability of proteins and protein complexes: a study of more than 1000 mutations. J Mol Biol. 2002;320:369–87. doi: 10.1016/S0022-2836(02)00442-4. [DOI] [PubMed] [Google Scholar]
- 76.Climente-González H, Porta-Pardo E, Godzik A, Eyras E. The Functional Impact of Alternative Splicing in Cancer. Cell Rep. 2017;20:2215–2226. doi: 10.1016/j.celrep.2017.08.012. [DOI] [PubMed] [Google Scholar]
- 77.Buljan M, Chalancon G, Eustermann S, Wagner GP, Fuxreiter M, Bateman A, Babu MM. Tissue-Specific Splicing of Disordered Segments that Embed Binding Motifs Rewires Protein Interaction Networks. Mol Cell. 2012;46:871–883. doi: 10.1016/j.molcel.2012.05.039. [DOI] [PMC free article] [PubMed] [Google Scholar]
- 78.Li Y, Sahni N, Pancsa R, McGrail DJ, Xu J, Hua X, Coulombe-Huntington J, Ryan M, Tychhon B, Sudhakar D, Hu L, Tyers M, Jiang X, Lin S-Y, Babu MM, Yi S. Revealing the Determinants of Widespread Alternative Splicing Perturbation in Cancer. Cell Rep. 2017;21:798–812. doi: 10.1016/j.celrep.2017.09.071. [DOI] [PMC free article] [PubMed] [Google Scholar]
- 79.Xu J, Li C-X, Lv J-Y, Li Y-S, Xiao Y, Shao T-T, Huo X, Li X, Zou Y, Han Q-L, Li X, Wang L-H, Ren H. Prioritizing candidate disease miRNAs by topological features in the miRNA target-dysregulated network: case study of prostate cancer. Mol Cancer Ther. 2011;10:1857–66. doi: 10.1158/1535-7163.MCT-11-0055. [DOI] [PubMed] [Google Scholar]
- 80.Li Y, Xu J, Chen H, Bai J, Li S, Zhao Z, Shao T, Jiang T, Ren H, Kang C, Li X. Comprehensive analysis of the functional microRNA-mRNA regulatory network identifies miRNA signatures associated with glioma malignant progression. Nucleic Acids Res. 2013;41:e203. doi: 10.1093/nar/gkt1054. [DOI] [PMC free article] [PubMed] [Google Scholar]
- 81.Le D-H. Network-based ranking methods for prediction of novel disease associated microRNAs. Comput Biol Chem. 2015;58:139–48. doi: 10.1016/j.compbiolchem.2015.07.003. [DOI] [PubMed] [Google Scholar]
- 82.Hamed M, Spaniol C, Zapp A, Helms V. Integrative network-based approach identifies key genetic elements in breast invasive carcinoma. BMC Genomics. 2015;16(Suppl 5):S2. doi: 10.1186/1471-2164-16-S5-S2. [DOI] [PMC free article] [PubMed] [Google Scholar]
- 83.Creixell P, Schoof EM, Simpson CD, Longden J, Miller CJ, Lou HJ, Perryman L, Cox TR, Zivanovic N, Palmeri A, Wesolowska-Andersen A, Helmer-Citterich M, Ferkinghoff-Borg J, Itamochi H, Bodenmiller B, Erler JT, Turk BE, Linding R. Kinome-wide Decoding of Network-Attacking Mutations Rewiring Cancer Signaling. Cell. 2015;163:202–217. doi: 10.1016/j.cell.2015.08.056. [DOI] [PMC free article] [PubMed] [Google Scholar]
- 84.Joh RI, Palmieri CM, Hill IT, Motamedi M. Regulation of histone methylation by noncoding RNAs. Biochim Biophys Acta. 2014;1839:1385–94. doi: 10.1016/j.bbagrm.2014.06.006. [DOI] [PMC free article] [PubMed] [Google Scholar]
- 85.Cao J. The functional role of long non-coding RNAs and epigenetics. Biol Proced Online. 2014;16:11. doi: 10.1186/1480-9222-16-11. [DOI] [PMC free article] [PubMed] [Google Scholar]
- 86.Raphael BJ, Dobson JR, Oesper L, Vandin F. Identifying driver mutations in sequenced cancer genomes: computational approaches to enable precision medicine. Genome Med. 2014;6:5. doi: 10.1186/gm524. [DOI] [PMC free article] [PubMed] [Google Scholar]
- 87.Cheng F, Zhao J, Zhao Z. Advances in computational approaches for prioritizing driver mutations and significantly mutated genes in cancer genomes. Brief Bioinform. 2016;17:642–656. doi: 10.1093/bib/bbv068. [DOI] [PMC free article] [PubMed] [Google Scholar]
- 88.Bashashati A, Haffari G, Ding J, Ha G, Lui K, Rosner J, Huntsman DG, Caldas C, Aparicio SA, Shah SP. DriverNet: uncovering the impact of somatic driver mutations on transcriptional networks in cancer. Genome Biol. 2012;13:R124. doi: 10.1186/gb-2012-13-12-r124. [DOI] [PMC free article] [PubMed] [Google Scholar]
- 89.Ng S, Collisson EA, Sokolov A, Goldstein T, Gonzalez-Perez A, Lopez-Bigas N, Benz C, Haussler D, Stuart JM. PARADIGM-SHIFT predicts the function of mutations in multiple cancers using pathway impact analysis. Bioinformatics. 2012;28:i640–i646. doi: 10.1093/bioinformatics/bts402. [DOI] [PMC free article] [PubMed] [Google Scholar]
- 90.Tothill RW, Tinker AV, George J, Brown R, Fox SB, Lade S, Johnson DS, Trivett MK, Etemadmoghadam D, Locandro B, Traficante N, Fereday S, Hung JA, Chiew Y-E, Haviv I, Gertig D, DeFazio A, Bowtell DDL Australian Ovarian Cancer Study Group D. Novel molecular subtypes of serous and endometrioid ovarian cancer linked to clinical outcome. Clin Cancer Res. 2008;14:5198–208. doi: 10.1158/1078-0432.CCR-08-0196. [DOI] [PubMed] [Google Scholar]
- 91.Reis-Filho JS, Pusztai L. Gene expression profiling in breast cancer: classification, prognostication, prediction. Lancet (London, England) 2011;378:1812–23. doi: 10.1016/S0140-6736(11)61539-0. [DOI] [PubMed] [Google Scholar]
- 92.Konstantinopoulos PA, Spentzos D, Karlan BY, Taniguchi T, Fountzilas E, Francoeur N, Levine DA, Cannistra SA. Gene expression profile of BRCAness that correlates with responsiveness to chemotherapy and with outcome in patients with epithelial ovarian cancer. J Clin Oncol. 2010;28:3555–61. doi: 10.1200/JCO.2009.27.5719. [DOI] [PMC free article] [PubMed] [Google Scholar]
- 93.Cancer Genome Atlas Research Network TCGAR. Integrated genomic analyses of ovarian carcinoma. Nature. 2011;474:609–15. doi: 10.1038/nature10166. [DOI] [PMC free article] [PubMed] [Google Scholar]
- 94.Konstantinopoulos PA, Spentzos D, Cannistra SA. Gene-expression profiling in epithelial ovarian cancer. Nat Clin Pract Oncol. 2008;5:577–87. doi: 10.1038/ncponc1178. [DOI] [PubMed] [Google Scholar]
- 95.Cancer Genome Atlas Network TCGA. Comprehensive molecular characterization of human colon and rectal cancer. Nature. 2012;487:330–7. doi: 10.1038/nature11252. [DOI] [PMC free article] [PubMed] [Google Scholar]
- 96.Vandin F, Clay P, Upfal E, Raphael BJ. Discovery of mutated subnetworks associated with clinical data in cancer. [accessed March 8, 2018];Pac Symp Biocomput. 2012 :55–66. http://www.ncbi.nlm.nih.gov/pubmed/22174262. [PubMed]
- 97.Hofree M, Shen JP, Carter H, Gross A, Ideker T. Network-based stratification of tumor mutations. Nat Methods. 2013;10:1108–15. doi: 10.1038/nmeth.2651. [DOI] [PMC free article] [PubMed] [Google Scholar]
- 98.Le Morvan M, Zinovyev A, Vert J-P. NetNorM: Capturing cancer-relevant information in somatic exome mutation data with gene networks for cancer stratification and prognosis. PLoS Comput Biol. 2017;13:e1005573. doi: 10.1371/journal.pcbi.1005573. [DOI] [PMC free article] [PubMed] [Google Scholar]
- 99.Zhong X, Yang H, Zhao S, Shyr Y, Li B. Network-based stratification analysis of 13 major cancer types using mutations in panels of cancer genes. BMC Genomics. 2015;16:S7. doi: 10.1186/1471-2164-16-S7-S7. [DOI] [PMC free article] [PubMed] [Google Scholar]
- 100.He Z, Zhang J, Yuan X, Liu Z, Liu B, Tuo S, Liu Y. Network based stratification of major cancers by integrating somatic mutation and gene expression data. PLoS One. 2017;12:e0177662. doi: 10.1371/journal.pone.0177662. [DOI] [PMC free article] [PubMed] [Google Scholar]
- 101.Yang L, Wang S, Zhou M, Chen X, Jiang W, Zuo Y, Lv Y. Molecular classification of prostate adenocarcinoma by the integrated somatic mutation profiles and molecular network. Sci Rep. 2017;7:738. doi: 10.1038/s41598-017-00872-8. [DOI] [PMC free article] [PubMed] [Google Scholar]
- 102.Liu Y, Gu Q, Hou JP, Han J, Ma J. A network-assisted co-clustering algorithm to discover cancer subtypes based on gene expression. BMC Bioinformatics. 2014;15:37. doi: 10.1186/1471-2105-15-37. [DOI] [PMC free article] [PubMed] [Google Scholar]
- 103.Yu G, Yu X, Wang J. Network-aided Bi-Clustering for discovering cancer subtypes. Sci Rep. 2017;7:1046. doi: 10.1038/s41598-017-01064-0. [DOI] [PMC free article] [PubMed] [Google Scholar]
- 104.Vaske CJ, Benz SC, Sanborn JZ, Earl D, Szeto C, Zhu J, Haussler D, Stuart JM. Inference of patient-specific pathway activities from multi-dimensional cancer genomics data using PARADIGM. Bioinformatics. 2010;26:i237–45. doi: 10.1093/bioinformatics/btq182. [DOI] [PMC free article] [PubMed] [Google Scholar]
- 105.Wang B, Mezlini AM, Demir F, Fiume M, Tu Z, Brudno M, Haibe-Kains B, Goldenberg A. Similarity network fusion for aggregating data types on a genomic scale. Nat Methods. 2014;11:333–7. doi: 10.1038/nmeth.2810. [DOI] [PubMed] [Google Scholar]
- 106.Yang C, Ge S-G, Zheng C-H. ndmaSNF: cancer subtype discovery based on integrative framework assisted by network diffusion model. Oncotarget. 2017;8:89021–89032. doi: 10.18632/oncotarget.21643. [DOI] [PMC free article] [PubMed] [Google Scholar]
- 107.Chou T-C. Theoretical basis, experimental design, and computerized simulation of synergism and antagonism in drug combination studies. Pharmacol Rev. 2006;58:621–81. doi: 10.1124/pr.58.3.10. [DOI] [PubMed] [Google Scholar]
- 108.Li X, Qin G, Yang Q, Chen L, Xie L. Biomolecular Network-Based Synergistic Drug Combination Discovery. Biomed Res Int. 2016;2016:8518945. doi: 10.1155/2016/8518945. [DOI] [PMC free article] [PubMed] [Google Scholar]
- 109.Huang L, Li F, Sheng J, Xia X, Ma J, Zhan M, Wong STC. DrugComboRanker: drug combination discovery based on target network analysis. Bioinformatics. 2014;30:i228–36. doi: 10.1093/bioinformatics/btu278. [DOI] [PMC free article] [PubMed] [Google Scholar]
- 110.Jin G, Zhao H, Zhou X, Wong STC. An enhanced Petri-net model to predict synergistic effects of pairwise drug combinations from gene microarray data. Bioinformatics. 2011;27:i310–6. doi: 10.1093/bioinformatics/btr202. [DOI] [PMC free article] [PubMed] [Google Scholar]
- 111.Wu Z, Zhao X-M, Chen L. A systems biology approach to identify effective cocktail drugs. BMC Syst Biol. 2010;4(Suppl 2):S7. doi: 10.1186/1752-0509-4-S2-S7. [DOI] [PMC free article] [PubMed] [Google Scholar]
- 112.Choi M, Shi J, Zhu Y, Yang R, Cho K-H. Network dynamics-based cancer panel stratification for systemic prediction of anticancer drug response. Nat Commun. 2017;8:1940. doi: 10.1038/s41467-017-02160-5. [DOI] [PMC free article] [PubMed] [Google Scholar]
- 113.Chen D, Zhang H, Lu P, Liu X, Cao H. Synergy evaluation by a pathway-pathway interaction network: a new way to predict drug combination. Mol Biosyst. 2016;12:614–23. doi: 10.1039/c5mb00599j. [DOI] [PubMed] [Google Scholar]
- 114.Lu J, Zeng H, Liang Z, Chen L, Zhang L, Zhang H, Liu H, Jiang H, Shen B, Huang M, Geng M, Spiegel S, Luo C. Network modelling reveals the mechanism underlying colitis-associated colon cancer and identifies novel combinatorial anti-cancer targets. Sci Rep. 2015;5:14739. doi: 10.1038/srep14739. [DOI] [PMC free article] [PubMed] [Google Scholar]
- 115.Choi M, Shi J, Jung SH, Chen X, Cho K-H. Attractor landscape analysis reveals feedback loops in the p53 network that control the cellular response to DNA damage. Sci Signal. 2012;5:ra83. doi: 10.1126/scisignal.2003363. [DOI] [PubMed] [Google Scholar]
- 116.Lapek JD, Greninger P, Morris R, Amzallag A, Pruteanu-Malinici I, Benes CH, Haas W. Detection of dysregulated protein-association networks by high-throughput proteomics predicts cancer vulnerabilities. Nat Biotechnol. 2017;35:983–989. doi: 10.1038/nbt.3955. [DOI] [PMC free article] [PubMed] [Google Scholar]
- 117.Roumeliotis TI, Williams SP, Gonçalves E, Alsinet C, Del Castillo Velasco-Herrera M, Aben N, Ghavidel FZ, Michaut M, Schubert M, Price S, Wright JC, Yu L, Yang M, Dienstmann R, Guinney J, Beltrao P, Brazma A, Pardo M, Stegle O, Adams DJ, Wessels L, Saez-Rodriguez J, McDermott U, Choudhary JS. Genomic Determinants of Protein Abundance Variation in Colorectal Cancer Cells. Cell Rep. 2017;20:2201–2214. doi: 10.1016/j.celrep.2017.08.010. [DOI] [PMC free article] [PubMed] [Google Scholar]
- 118.Engin HB, Hofree M, Carter H. Identifying mutation specific cancer pathways using a structurally resolved protein interaction network. [accessed August 21, 2017];Pac Symp Biocomput. 2015 :84–95. http://www.ncbi.nlm.nih.gov/pubmed/25592571. [PMC free article] [PubMed]
- 119.Lee MJ, Ye AS, Gardino AK, Heijink AM, Sorger PK, MacBeath G, Yaffe MB. Sequential application of anticancer drugs enhances cell death by rewiring apoptotic signaling networks. Cell. 2012;149:780–94. doi: 10.1016/j.cell.2012.03.031. [DOI] [PMC free article] [PubMed] [Google Scholar]
- 120.Vargas AJ, Harris CC. Biomarker development in the precision medicine era: lung cancer as a case study. Nat Rev Cancer. 2016;16:525–37. doi: 10.1038/nrc.2016.56. [DOI] [PMC free article] [PubMed] [Google Scholar]
- 121.Gade S, Porzelius C, Fälth M, Brase JC, Wuttig D, Kuner R, Binder H, Sültmann H, Beissbarth T. Graph based fusion of miRNA and mRNA expression data improves clinical outcome prediction in prostate cancer. BMC Bioinformatics. 2011;12:488. doi: 10.1186/1471-2105-12-488. [DOI] [PMC free article] [PubMed] [Google Scholar]
- 122.Chuang H-Y, Lee E, Liu Y-T, Lee D, Ideker T. Network-based classification of breast cancer metastasis. Mol Syst Biol. 2007;3:140. doi: 10.1038/msb4100180. [DOI] [PMC free article] [PubMed] [Google Scholar]
- 123.Xi J, Li A, Wang M. A novel network regularized matrix decomposition method to detect mutated cancer genes in tumour samples with inter-patient heterogeneity. Sci Rep. 2017;7:2855. doi: 10.1038/s41598-017-03141-w. [DOI] [PMC free article] [PubMed] [Google Scholar]
- 124.Sun Q, Zhao H, Zhang C, Hu T, Wu J, Lin X, Luo D, Wang C, Meng L, Xi L, Li K, Hu J, Ma D, Zhu T. Gene co-expression network reveals shared modules predictive of stage and grade in serous ovarian cancers. Oncotarget. 2017;8:42983–42996. doi: 10.18632/oncotarget.17785. [DOI] [PMC free article] [PubMed] [Google Scholar]
- 125.Zhang KX, Ouellette BFF. CAERUS: predicting CAncER oUtcomeS using relationship between protein structural information, protein networks, gene expression data, and mutation data. PLoS Comput Biol. 2011;7:e1001114. doi: 10.1371/journal.pcbi.1001114. [DOI] [PMC free article] [PubMed] [Google Scholar]
- 126.Cox DR. Models and life-tables regression. J R Stat Soc Ser B. 1972;34:187–220. [Google Scholar]
- 127.Zhang W, Ota T, Shridhar V, Chien J, Wu B, Kuang R. Network-based survival analysis reveals subnetwork signatures for predicting outcomes of ovarian cancer treatment. PLoS Comput Biol. 2013;9:e1002975. doi: 10.1371/journal.pcbi.1002975. [DOI] [PMC free article] [PubMed] [Google Scholar]
- 128.Veríssimo A, Oliveira AL, Sagot M-F, Vinga S. DegreeCox - a network-based regularization method for survival analysis. BMC Bioinformatics. 2016;17:449. doi: 10.1186/s12859-016-1310-4. [DOI] [PMC free article] [PubMed] [Google Scholar]
- 129.Lin Zhang L, Hui Liu H, Yufei Huang Y, Xuesong Wang X, Yidong Chen Y, Jia Meng J. Cancer Progression Prediction Using Gene Interaction Regularized Elastic Net. IEEE/ACM Trans Comput Biol Bioinforma. 2017;14:145–154. doi: 10.1109/TCBB.2015.2511758. [DOI] [PMC free article] [PubMed] [Google Scholar]
- 130.Huang S, Yee C, Ching T, Yu H, Garmire LX. A novel model to combine clinical and pathway-based transcriptomic information for the prognosis prediction of breast cancer. PLoS Comput Biol. 2014;10:e1003851. doi: 10.1371/journal.pcbi.1003851. [DOI] [PMC free article] [PubMed] [Google Scholar]
- 131.Eng KH, Wang S, Bradley WH, Rader JS, Kendziorski C. Pathway index models for construction of patient-specific risk profiles. Stat Med. 2013;32:1524–35. doi: 10.1002/sim.5641. [DOI] [PMC free article] [PubMed] [Google Scholar]
- 132.Zhang X, Li Y, Akinyemiju T, Ojesina AI, Buckhaults P, Liu N, Xu B, Yi N. Pathway-Structured Predictive Model for Cancer Survival Prediction: A Two-Stage Approach. Genetics. 2017;205:89–100. doi: 10.1534/genetics.116.189191. [DOI] [PMC free article] [PubMed] [Google Scholar]
- 133.Yang B, Li M, Tang W, Liu W, Zhang S, Chen L, Xia J. Dynamic network biomarker indicates pulmonary metastasis at the tipping point of hepatocellular carcinoma. Nat Commun. 2018;9:678. doi: 10.1038/s41467-018-03024-2. [DOI] [PMC free article] [PubMed] [Google Scholar]
- 134.Chen H, Zhu Z, Zhu Y, Wang J, Mei Y, Cheng Y. Pathway mapping and development of disease-specific biomarkers: protein-based network biomarkers. J Cell Mol Med. 2015;19:297–314. doi: 10.1111/jcmm.12447. [DOI] [PMC free article] [PubMed] [Google Scholar]
- 135.Yuan X, Chen J, Lin Y, Li Y, Xu L, Chen L, Hua H, Shen B. Network Biomarkers Constructed from Gene Expression and Protein-Protein Interaction Data for Accurate Prediction of Leukemia. J Cancer. 2017;8:278–286. doi: 10.7150/jca.17302. [DOI] [PMC free article] [PubMed] [Google Scholar]
- 136.Zhou M, Wang X, Shi H, Cheng L, Wang Z, Zhao H, Yang L, Sun J. Characterization of long non-coding RNA-associated ceRNA network to reveal potential prognostic lncRNA biomarkers in human ovarian cancer. Oncotarget. 2016;7:12598–611. doi: 10.18632/oncotarget.7181. [DOI] [PMC free article] [PubMed] [Google Scholar]
- 137.Cescon D, Siu LL. Cancer Clinical Trials: The Rear-View Mirror and the Crystal Ball. Cell. 2017;168:575–578. doi: 10.1016/j.cell.2017.01.027. [DOI] [PubMed] [Google Scholar]
- 138.Mardis E. Many mutations in one clinical-trial basket. Nature. 2018;554:173–175. doi: 10.1038/d41586-018-01312-x. [DOI] [PubMed] [Google Scholar]
- 139.Hyman DM, Piha-Paul SA, Won H, Rodon J, Saura C, Shapiro GI, Juric D, Quinn DI, Moreno V, Doger B, Mayer IA, Boni V, Calvo E, Loi S, Lockhart AC, Erinjeri JP, Scaltriti M, Ulaner GA, Patel J, Tang J, Beer H, Selcuklu SD, Hanrahan AJ, Bouvier N, Melcer M, Murali R, Schram AM, Smyth LM, Jhaveri K, Li BT, Drilon A, Harding JJ, Iyer G, Taylor BS, Berger MF, Cutler RE, Xu F, Butturini A, Eli LD, Mann G, Farrell C, Lalani AS, Bryce RP, Arteaga CL, Meric-Bernstam F, Baselga J, Solit DB. HER kinase inhibition in patients with HER2- and HER3-mutant cancers. Nature. 2018;554:189–194. doi: 10.1038/nature25475. [DOI] [PMC free article] [PubMed] [Google Scholar]
- 140.Van Cutsem E, Köhne C-H, Hitre E, Zaluski J, Chang Chien C-R, Makhson A, D’Haens G, Pintér T, Lim R, Bodoky G, Roh JK, Folprecht G, Ruff P, Stroh C, Tejpar S, Schlichting M, Nippgen J, Rougier P. Cetuximab and chemotherapy as initial treatment for metastatic colorectal cancer. N Engl J Med. 2009;360:1408–17. doi: 10.1056/NEJMoa0805019. [DOI] [PubMed] [Google Scholar]
- 141.Flockhart DA, Skaar T, Berlin DS, Klein TE, Nguyen AT. Clinically available pharmacogenomics tests. Clin Pharmacol Ther. 2009;86:109–13. doi: 10.1038/clpt.2009.39. [DOI] [PMC free article] [PubMed] [Google Scholar]
- 142.Topol EJ. Pharmacy benefit managers, pharmacies, and pharmacogenomic testing: prescription for progress? Sci Transl Med. 2010;2:44cm22. doi: 10.1126/scitranslmed.3001067. [DOI] [PubMed] [Google Scholar]
- 143.Schissler AG, Gardeux V, Li Q, Achour I, Li H, Piegorsch WW, Lussier YA. Dynamic changes of RNA-sequencing expression for precision medicine: N-of-1-pathways Mahalanobis distance within pathways of single subjects predicts breast cancer survival. Bioinformatics. 2015;31:i293–302. doi: 10.1093/bioinformatics/btv253. [DOI] [PMC free article] [PubMed] [Google Scholar]
- 144.Yang X, Regan K, Huang Y, Zhang Q, Li J, Seiwert TY, Cohen EEW, Xing HR, Lussier YA. Single sample expression-anchored mechanisms predict survival in head and neck cancer. PLoS Comput Biol. 2012;8:e1002350. doi: 10.1371/journal.pcbi.1002350. [DOI] [PMC free article] [PubMed] [Google Scholar]
- 145.Gardeux V, Achour I, Li J, Maienschein-Cline M, Li H, Pesce L, Parinandi G, Bahroos N, Winn R, Foster I, Garcia JGN, Lussier YA. “N-of-1-pathways” unveils personal deregulated mechanisms from a single pair of RNA-Seq samples: towards precision medicine. J Am Med Inform Assoc. 2014;21:1015–25. doi: 10.1136/amiajnl-2013-002519. [DOI] [PMC free article] [PubMed] [Google Scholar]
- 146.Li Q, Schissler AG, Gardeux V, Berghout J, Achour I, Kenost C, Li H, Zhang HH, Lussier YA. kMEn: Analyzing noisy and bidirectional transcriptional pathway responses in single subjects. J Biomed Inform. 2017;66:32–41. doi: 10.1016/j.jbi.2016.12.009. [DOI] [PMC free article] [PubMed] [Google Scholar]
- 147.Li Q, Schissler AG, Gardeux V, Achour I, Kenost C, Berghout J, Li H, Zhang HH, Lussier YA. N-of-1-pathways MixEnrich: advancing precision medicine via single-subject analysis in discovering dynamic changes of transcriptomes. BMC Med Genomics. 2017;10:27. doi: 10.1186/s12920-017-0263-4. [DOI] [PMC free article] [PubMed] [Google Scholar]
- 148.Krämer A, Green J, Pollard J, Tugendreich S. Causal analysis approaches in Ingenuity Pathway Analysis. Bioinformatics. 2014;30:523–530. doi: 10.1093/bioinformatics/btt703. [DOI] [PMC free article] [PubMed] [Google Scholar]
- 149.Livshits A, Git A, Fuks G, Caldas C, Domany E. Pathway-based personalized analysis of breast cancer expression data. Mol Oncol. 2015;9:1471–1483. doi: 10.1016/j.molonc.2015.04.006. [DOI] [PMC free article] [PubMed] [Google Scholar]
- 150.Gardeux V, Arslan AD, Achour I, Ho T-T, Beck WT, Lussier YA. Concordance of deregulated mechanisms unveiled in underpowered experiments: PTBP1 knockdown case study. BMC Med Genomics. 2014;7(Suppl 1):S1. doi: 10.1186/1755-8794-7-S1-S1. [DOI] [PMC free article] [PubMed] [Google Scholar]
- 151.Meißner T, Fisch KM, Gioia L, Su AI. OncoRep: an n-of-1 reporting tool to support genome-guided treatment for breast cancer patients using RNA-sequencing. BMC Med Genomics. 2015;8:24. doi: 10.1186/s12920-015-0095-z. [DOI] [PMC free article] [PubMed] [Google Scholar]
- 152.Wishart DS, Knox C, Guo AC, Shrivastava S, Hassanali M, Stothard P, Chang Z, Woolsey J. DrugBank: a comprehensive resource for in silico drug discovery and exploration. Nucleic Acids Res. 2006;34:D668–72. doi: 10.1093/nar/gkj067. [DOI] [PMC free article] [PubMed] [Google Scholar]
- 153.Whirl-Carrillo M, McDonagh EM, Hebert JM, Gong L, Sangkuhl K, Thorn CF, Altman RB, Klein TE. Pharmacogenomics knowledge for personalized medicine. Clin Pharmacol Ther. 2012;92:414–7. doi: 10.1038/clpt.2012.96. [DOI] [PMC free article] [PubMed] [Google Scholar]
- 154.Merid SK, Goranskaya D, Alexeyenko A. Distinguishing between driver and passenger mutations in individual cancer genomes by network enrichment analysis. BMC Bioinformatics. 2014;15:308. doi: 10.1186/1471-2105-15-308. [DOI] [PMC free article] [PubMed] [Google Scholar]
- 155.Hou JP, Ma J. DawnRank: discovering personalized driver genes in cancer. Genome Med. 2014;6:56. doi: 10.1186/s13073-014-0056-8. [DOI] [PMC free article] [PubMed] [Google Scholar]
- 156.Bertrand D, Chng KR, Sherbaf FG, Kiesel A, Chia BKH, Sia YY, Huang SK, Hoon DSB, Liu ET, Hillmer A, Nagarajan N. Patient-specific driver gene prediction and risk assessment through integrated network analysis of cancer omics profiles. Nucleic Acids Res. 2015;43:e44. doi: 10.1093/nar/gku1393. [DOI] [PMC free article] [PubMed] [Google Scholar]
- 157.Liu X, Wang Y, Ji H, Aihara K, Chen L. Personalized characterization of diseases using sample-specific networks. Nucleic Acids Res. 2016;44:e164. doi: 10.1093/nar/gkw772. [DOI] [PMC free article] [PubMed] [Google Scholar]
- 158.Guo W-F, Zhang S-W, Liu L-L, Liu F, Shi Q-Q, Zhang L, Tang Y, Zeng T, Chen L. Discovering personalized driver mutation profiles of single samples in cancer by network control strategy. Bioinformatics. 2018 doi: 10.1093/bioinformatics/bty006. [DOI] [PubMed] [Google Scholar]
- 159.Cronin M, Pho M, Dutta D, Stephans JC, Shak S, Kiefer MC, Esteban JM, Baker JB. Measurement of gene expression in archival paraffin-embedded tissues: development and performance of a 92-gene reverse transcriptase-polymerase chain reaction assay. Am J Pathol. 2004;164:35–42. doi: 10.1016/S0002-9440(10)63093-3. [DOI] [PMC free article] [PubMed] [Google Scholar]
- 160.Paik S, Shak S, Tang G, Kim C, Baker J, Cronin M, Baehner FL, Walker MG, Watson D, Park T, Hiller W, Fisher ER, Wickerham DL, Bryant J, Wolmark N. A multigene assay to predict recurrence of tamoxifen-treated, node-negative breast cancer. N Engl J Med. 2004;351:2817–26. doi: 10.1056/NEJMoa041588. [DOI] [PubMed] [Google Scholar]
- 161.Cronin M, Sangli C, Liu M-L, Pho M, Dutta D, Nguyen A, Jeong J, Wu J, Langone KC, Watson D. Analytical validation of the Oncotype DX genomic diagnostic test for recurrence prognosis and therapeutic response prediction in node-negative, estrogen receptor-positive breast cancer. Clin Chem. 2007;53:1084–91. doi: 10.1373/clinchem.2006.076497. [DOI] [PubMed] [Google Scholar]
- 162.Albain KS, Barlow WE, Shak S, Hortobagyi GN, Livingston RB, Yeh I-T, Ravdin P, Bugarini R, Baehner FL, Davidson NE, Sledge GW, Winer EP, Hudis C, Ingle JN, Perez EA, Pritchard KI, Shepherd L, Gralow JR, Yoshizawa C, Allred DC, Osborne CK, Hayes DF. Breast Cancer Intergroup of North America, Prognostic and predictive value of the 21-gene recurrence score assay in postmenopausal women with node-positive, oestrogen-receptor-positive breast cancer on chemotherapy: a retrospective analysis of a randomised trial. Lancet Oncol. 2010;11:55–65. doi: 10.1016/S1470-2045(09)70314-6. [DOI] [PMC free article] [PubMed] [Google Scholar]
- 163.Dowsett M, Cuzick J, Wale C, Forbes J, Mallon EA, Salter J, Quinn E, Dunbier A, Baum M, Buzdar A, Howell A, Bugarini R, Baehner FL, Shak S. Prediction of risk of distant recurrence using the 21-gene recurrence score in node-negative and node-positive postmenopausal patients with breast cancer treated with anastrozole or tamoxifen: a TransATAC study. J Clin Oncol. 2010;28:1829–34. doi: 10.1200/JCO.2009.24.4798. [DOI] [PubMed] [Google Scholar]
- 164.Gradishar WJ, Anderson BO, Balassanian R, Blair SL, Burstein HJ, Cyr A, Elias AD, Farrar WB, Forero A, Giordano SH, Goetz MP, Goldstein LJ, Isakoff SJ, Lyons J, Marcom PK, Mayer IA, McCormick B, Moran MS, O’Regan RM, Patel SA, Pierce LJ, Reed EC, Salerno KE, Schwartzberg LS, Sitapati A, Smith KL, Lou Smith M, Soliman H, Somlo G, Telli M, Ward JH, Shead DA, Kumar R. NCCN Guidelines Insights: Breast Cancer, Version 1.2017. [accessed March 8, 2018];J Natl Compr Canc Netw. 2017 15:433–451. doi: 10.6004/jnccn.2017.0044. http://www.ncbi.nlm.nih.gov/pubmed/28404755. [DOI] [PubMed] [Google Scholar]
- 165.Alizadeh AA, Eisen MB, Davis RE, Ma C, Lossos IS, Rosenwald A, Boldrick JC, Sabet H, Tran T, Yu X, Powell JI, Yang L, Marti GE, Moore T, Hudson J, Lu L, Lewis DB, Tibshirani R, Sherlock G, Chan WC, Greiner TC, Weisenburger DD, Armitage JO, Warnke R, Levy R, Wilson W, Grever MR, Byrd JC, Botstein D, Brown PO, Staudt LM. Distinct types of diffuse large B-cell lymphoma identified by gene expression profiling. Nature. 2000;403:503–11. doi: 10.1038/35000501. [DOI] [PubMed] [Google Scholar]
- 166.Scott DW, Wright GW, Williams PM, Lih C-J, Walsh W, Jaffe ES, Rosenwald A, Campo E, Chan WC, Connors JM, Smeland EB, Mottok A, Braziel RM, Ott G, Delabie J, Tubbs RR, Cook JR, Weisenburger DD, Greiner TC, Glinsmann-Gibson BJ, Fu K, Staudt LM, Gascoyne RD, Rimsza LM. Determining cell-of-origin subtypes of diffuse large B-cell lymphoma using gene expression in formalin-fixed paraffin-embedded tissue. Blood. 2014;123:1214–7. doi: 10.1182/blood-2013-11-536433. [DOI] [PMC free article] [PubMed] [Google Scholar]
- 167.Meyer PN, Fu K, Greiner TC, Smith LM, Delabie J, Gascoyne RD, Ott G, Rosenwald A, Braziel RM, Campo E, Vose JM, Lenz G, Staudt LM, Chan WC, Weisenburger DD. Immunohistochemical methods for predicting cell of origin and survival in patients with diffuse large B-cell lymphoma treated with rituximab. J Clin Oncol. 2011;29:200–7. doi: 10.1200/JCO.2010.30.0368. [DOI] [PMC free article] [PubMed] [Google Scholar]
- 168.Choi WWL, Weisenburger DD, Greiner TC, Piris MA, Banham AH, Delabie J, Braziel RM, Geng H, Iqbal J, Lenz G, Vose JM, Hans CP, Fu K, Smith LM, Li M, Liu Z, Gascoyne RD, Rosenwald A, Ott G, Rimsza LM, Campo E, Jaffe ES, Jaye DL, Staudt LM, Chan WC. A new immunostain algorithm classifies diffuse large B-cell lymphoma into molecular subtypes with high accuracy. Clin Cancer Res. 2009;15:5494–502. doi: 10.1158/1078-0432.CCR-09-0113. [DOI] [PMC free article] [PubMed] [Google Scholar]