

Abstract
Clinical research and practice in the 21st century is poised to be transformed by analysis of computable electronic medical records and population-level genome-scale patient profiles. Genomic data captures genetic and environmental state, providing information about heterogeneity in disease and treatment outcome, but genomic-based clinical risk scores are limited. Achieving the goal of routine precision medicine that takes advantage of this rich genomics data will require computational methods that support heterogeneous data, have excellent predictive performance, and ideally, provide biologically-interpretable results. Traditional machine-learning approaches excel at performance, but often have limited interpretability. Patient similarity networks are an emerging paradigm for precision medicine, in which patients are clustered or classified based on their similarities in various features, including genomic profiles. This strategy is analogous to standard medical diagnosis, has excellent performance, is interpretable, and can preserve patient privacy. We review new methods based on patient similarity networks, including Similarity Network Fusion for patient clustering and netDx for patient classification. While these methods are already useful, much work is required to improve their scalability for contemporary genetic cohorts, optimize parameters, and incorporate a wide range of genomics and clinical data. The coming five years will provide an opportunity to assess the utility of network-based algorithms for precision medicine.
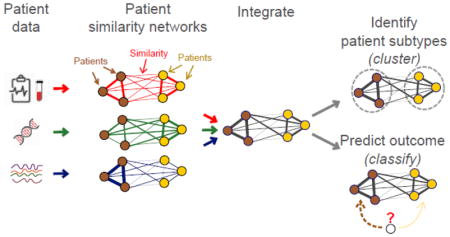
Graphical abstract
Introduction
Subdividing patients into subgroups homogeneous with respect to biology, disease progression and response to treatment enables “precision medicine”1. Although it is a new term, precision medicine is simply traditional medicine that considers more abundant and detailed patient data. It is the idea that an individual patient’s clinical outcome – disease risk, prognosis, and treatment response – is determined by their genetic, genomic, physiological and clinical profile, that corresponds with a known diagnosis. An early example is the use of improved phenotyping in 1971 to recognize that autism spectrum disorder was a different disease than schizophrenia2. Achieving the goal of “getting the right treatment to the right person” for a particular clinical outcome thus requires using all available relevant data to identify all possible diagnoses and their disease trajectories, so that appropriate therapy can be recommended.
There are many ways to predict risk for a particular disease (Table 1), though a tool commonly used to achieve this goal is a risk calculator: a mathematical model that converts measures of a set of risk factors into a quantitative estimate that guides clinical monitoring, diagnosis and treatment (Figure 1; Box 1). One of the best-validated risk calculators is the US-based Atherosclerotic Cardiovascular Disease (ASCVD) calculator, which calculates 10-year risk of developing heart disease or stroke for men and women of Caucasian white or African American ancestry aged between 40 and 79 years. Recommended by the American College of Cardiology, this predictor considers 13 pieces of information including a patient’s gender, age, blood lipid levels (3 numbers), blood pressure (2 numbers) and basic medical information (e.g. history of diabetes). When used with a clinical assessment, the predictor provides a basis for suggesting lifestyle modifications and initiating clinical interventions. It additionally serves as an objective indicator to both patient and clinician as to the risk of a cardiovascular disease event. The ASCVD is the result of five decades of model development, with its roots in the Framingham Heart Study of the 1950’s3,4. Despite extensive validation, the model continues to be a work in progress, being updated to accurately estimate risk for other ethnicities common in the US today5 and to populations in other countries (e.g. the UK6–8). Developing a risk model mature enough for clinical decision-making involves several stages, including rounds of internal and external validation and eventually, a clinical trial or the recommended use by a professional body (Fig 1B; e.g. for breast cancer9).
Table 1.
Methods used in clinical risk models
| Method | Advantages | Disadvantages | Applications |
|---|---|---|---|
| Similarity networks |
|
|
Gene function prediction34,65,77, protein function prediction79, cancer survival prediction, asthma case/control prediction, breast cancer subtype prediction58 |
| Linear/logistic regression |
|
|
Diabetes, Prostate cancer11,12 |
| Cox proportional hazards models |
|
|
Risk of developing cardiovascular disease or stroke; breast cancer risk10,13,14 |
| Polygenic risk score |
|
Limited to genetic data, limited by GWAS results | Coronary heart disease, schizophrenia. 23,38,39 |
| MultiBLUP (or realized relationship matrix) |
|
|
Celiac disease, yeast QTL analysis 41,42 |
| Support vector machines | Consistently well- performing |
|
Cancer survival prediction; Celiac disease genetic risk21,27,45 |
| Random forest |
|
|
Survival prediction in various cancer types; autism case/control prediction from CNVs27,38,39,104,105 |
| Deep learning |
|
|
Deep survival models (cancer survival)106 |
Figure 1. Contemporary risk calculators and their development process.

A. Examples of risk models in current clinical use (rows) and the patient data required for each (columns). See Box 1 for details.
B. Process for risk model development. The first model is developed by testing performance of a variety of models on subsets of the training data (internal validation). Following successful internal validation, model generalizability is then assessed by external validation on similar populations. Generalizability is also tested on similar populations with specific differences (e.g. geographic origin). This step would identify whether it is possible to develop a general model for multiple populations or whether subpopulation-specific models are needed. A well-validated model is recommended in professional clinical practice guidelines, but a clinician may choose to adopt a sufficiently validated model earlier in this process. This process is iterative and refinements continue to be made on decades-long models in clinical use.
Box 1. Online risk calculators and popular software for clinical prediction in the context of precision medicine.
Disease risk calculators in use
Cardiovascular disease risk (ASCVD):
Cardiovascular disease risk (Framingham Risk Score):
Neonatal sepsis risk: https://neonatalsepsiscalculator.kaiserpermanente.org/al
Melanoma risk: http://www.cancer.gov/melanomarisktool/
Diabetes risk: http://www.diabetes.org/are-you-at-risk/diabetes-risk-test/?loc=atrisk-slabnav
Clinical risk predictors that use genetic or genomic data
Non-Invasive Prenatal Testing: cell-free circulating DNA testing for trisomies:
BOADICEA: breast and ovarian cancer risk: http://ccge.medschl.cam.ac.uk/boadicea/
oncotypeIQ: gene expression-based tests for breast, lung, prostate, colon cancer:
Disease-specific genomic profiling initiatives
Alzheimer’s Disease: Alzheimer’s Disease Neuroimaging Initiative33
Autism: Autism Genetic Resource Exchange (https://research.agre.org), Simon’s Simplex Collection89, National Database for Autism Research (https://ndar.nih.gov)
Depression Treatment: Lundbeck (http://www.lundbeck.com/global/about-us/features/2017/flying-start-to-huge-depression-genetics-study); Canadian Biomarker Integration Network in Depression90
Cardiovascular risk: STARNET34
Cancers: The Cancer Genome Project (http://cancergenome.nih.gov)
Schizophrenia: PsychENCODE91
Software to compute clinical risk from genomic data
Polygenic risk score: PRSice http://prcise.info92
Patient similarity networks for multi-omic integration: Similarity Network Fusion57
General machine-learning software libraries: scikit-learn (python), caret (R), Weka, keras, tensorflow
Methodologically, risk models are developed using supervised learning algorithms (Box 2, “Key Concepts”). Patient data is encoded as “input features” (e.g. age, gender, genotypes at individual SNPs, metabolite quantities, gene expression levels). A learning or model-fitting algorithm is used to learn a function that accurately maps the features to a predicted outcome. To train the model, patient samples are partitioned into two groups: a training set and a test set. The training set provides examples to the model of what profiles look like for each of the possible outcomes and enables the model to learn predictive patterns. The independent test set is used to measure the classification performance of the model. Feature selection is used to identify the smallest set of the most predictive variables, which can help understand how the prediction is being made and can speed up prediction. A common concern in model-building is overfitting, when the model learns weights based on the particular bias in the training sample and does not generalize to the wider population. Cross-validation is used to estimate model generalizability; here, a portion of the training sample is held out from the learning process and is used to evaluate fitting error on the held out test set, and this is repeated many times. There are several measures for evaluating a model’s performance: these include the balance between the specificity and sensitivity of the model (area under the Receiver Operator Characteristic curve or AUROC; area under the Precision-Recall curve or AUPR); accuracy; F1 score; and Matthews correlation coefficient. Learning methods commonly used in risk models include logistic regression for categorical outcomes (e.g. risk stratification)10–12 and Cox proportional hazards models for censored data or event-based models (e.g. 10-year risk of developing a disease)10,13,14. Evaluating multiple methods to find the best one is an important part of model development because it is known that no method is best for all data sets. The ideal clinical risk model is accurate, generalizable, provides a prediction in a reasonable time frame for clinical decision-making and, we argue, interpretable so that it can be understood by a clinician.
Box 2. Concepts in patient risk modeling using machine learning.
Key predictive model concepts
Machine-learning: Algorithms that identify patterns in data by iterative exposure to data samples to either find subgroups within them (unsupervised learning, clustering, class discovery) or classify them (supervised learning). Examples of machine-learning algorithms include K-means clustering, regression, support vector machines, random forests and deep learning.
Supervised learning: A class of machine-learning algorithm that learns to classify samples or predict output from provided examples in a training set. Examples should represent all outcomes in roughly equal proportions.
Features: Inputs provided to the model for training. These could include individual measures (gene-level features in a gene expression matrix) or grouped measures (e.g. patient similarity network where genes were grouped by pathway).
Feature selection: Step of model development that assigns weights to features such that more predictive features have higher weights.
Train and test set: Model building has two phases: training the model, which identifies feature weights, and testing the model, where the model generalization is tested on independent data. Input samples are randomly partitioned into two groups; the set used to train the model is called the training set and that used to validate the model following the training is called the test set.
Overfitting: Overfitting is the phenomenon of a model learning patterns that are biased to the data it is trained on and that limits its generalizability to new data. A symptom of overfitting is a model that performs excellently on training data but poorly on new data. Overfitting is a common occurrence in machine learning, especially with high dimensional data, and model training must incorporate strategies such as cross-validation to reduce the overfitting risk.
Cross-validation: Repeatedly holding out a portion of the training data, training on the remaining data, and computing prediction error on the held-out set. Repeating 10 times is called “10-fold cross validation”. Performance over all runs is used to estimate the generalization of the model.
Performance measures: Metrics that evaluate how well a predictor works, such as the balance between true and false positive rate. Common measures are specificity, sensitivity, ROC curves, precision-recall curves, PPV, F1 and MCC.
Regularization: A constraint applied in model fitting problems with large number of features (e.g. 20,000 gene-level measures) to limit the number of features with nonzero weights. Reduces redundancy and improves interpretability.
Many risk models are in clinical use, such as for diabetes12 and prostate cancer11 (Box 1). Data mining of electronic health records from health care systems is spurring the development of newer models. A notable example is a calculator for neonatal sepsis risk, based on data from ~200,000 infants15. While genomics data is now widely available, most risk predictors that do consider genetic information only use it in a general form using family history. The problem with this is that people often do not inherit a risk factor from a parent. As information about a patient continues to grow exponentially due to advances in genomics, medical imaging and other measurement technologies, there is an opportunity to develop accurate predictive risk models for many more diseases and to develop these more quickly, but this requires the development of new analytic methodology that can keep pace with the scale and complexity of the data (Figure 2A).
Figure 2. Genomics in clinical risk models.

A. Vision of genomic analyses as part of a process for clinical decision-making. The outer ring tracks patient interactions with the healthcare system in a future genomic era of medicine. Clinical and genomic assessment generates patient data, whereupon physicians diagnose patients, prescribe therapy and counsel about prevention based on disease risk. Patients iterate this process with follow-up visits. The field of computational biology will catalyze precision medicine by developing tools that help generate patient classification, diagnosis and prognosis, and guide therapy and prevention.
B. Current and projected ‘omic cohorts for precision medicine. The x-axis shows the year of the publication or update; values at 2020 are projected by the authors based on public information. Y-axis shows the sample size on which the project was or is projected to run (powers of 10). 90,93–101 (IBD: https://ibdmdb.org/; https://victr.vanderbilt.edu/pub/biovu/). Unlabelled points are for: 1. http://www.lundbeck.com/global/about-us/features/2017/flying-start-to-huge-depression-genetics-study, 2. Blood lipids GWAS98; 3. Glioma95; 4. Type 2 diabetes microbiome: http://med.stanford.edu/ipop.html; 5. Breast cancer51 6 - Cholangiocarcoma102. MVP: Million Veterans Program.
Integrating genomics into clinical risk models
The predictive value of genomics is driving the generation of multi-omic data and the use of genomics in clinical diagnostics
The past two decades of genomics research has demonstrated the value of genomics data in understanding cellular processes in disease and witnessed the use of ‘omic data in clinical risk prediction models (Figure 2B). The first wave of predictive utility for genomics data was demonstrated at the genetic level by linkage studies and then genome-wide association studies16; this research has identified which diseases have a few big risk-effect variants (3X risk increase for each APOe4 allele in Alzheimer’s disease17,18; 6.7X risk increase for BRCA1/2 mutations in breast cancer; 6–17X for HLAII alleles in familial type 1 diabetes19) and which diseases have smaller, polygenic contributions (1.10–1.20 for schizophrenia20, coronary artery disease21, and bipolar disorder22,23). The use of exome sequencing technology quadrupled the rate of identification of rare disease-causing genes in two years24, which enables early diagnosis. The profiling of other ‘omics layers is providing a more complete picture of the relative contribution of different genomic layers to disease risk. Gene-expression based breast cancer risk prediction is a notable example of a genomics-based assay that is in routine clinical use14,25. In another example, an ‘omic profiling of ependymoma, a common childhood brain tumour, found no evidence of recurrent somatic mutations; instead, two disease subtypes with different clinical characteristics were distinguished by distinct mRNA expression levels and DNA methylation signatures in CpG islands26. More recently, data from The Cancer Genome Atlas project has been used to investigate the relative value of different genomic datatypes in predicting cancer survival for individual tumour types, with good success27.
With the utility of genomics clearly proven, data collection continues to increase (Figure 2B). Several consortia now exist for genomic profiling at population-scale. Public-sector initiatives in the US include the veteran-focused Million Veterans Program28 and the US National Institute of Health’s “All of Us” targeted to the general US population; both initiatives have the specific goal of accelerating precision medicine. The UK BioBank is a similar initiative supported by multiple government and not-for-profit agencies in the UK29. Private-sector projects include the AstraZeneca bid to sequence two million genomes to identify rare genetic variants that affect drug response30, and the repository of the direct-to-consumer genetic testing service, 23andMe Inc., which are now being used for focused GWAS31,32. Crowd-sourcing initiatives such as PatientsLikeMe (http://patientslikeme.come) and patient-led foundations, such as Dragon Masters (https://www.dragonmasterfoundation.org/) are another growing source of genetic and patient data. Initiatives are also going deeper, generating multiple genomics data types for particular diseases. The Cancer Genome Atlas (TCGA) profiled 33 tumour types on 11,000 patients with up to six different genomic data types profiled for a given tumour type (http://cancergenome.nih.gov/abouttcga), the Alzheimer’s Disease Neuroimaging Initiative (ADNI)33 collects genetics and brain imaging data, STARNET34 collects genetic and gene expression data for cardiovascular risk, and the Lundbeck study collects genetic data to study treatment response in major depression; see Box 1 for more information.
Continued investment in data collection is driving the technology, infrastructure, reduced costs and logistics necessary to achieve a future in which clinical decision-making routinely incorporates genomic data. Historically, improvements in the depth of patient data have led to a substantial improvement in patient care and new large-scale phenotype data are already leading to more precise care. For example, breast cancer is now treated by subtype (e.g. ER+, HER2+, triple negative) using targeted drugs that outperform the older one-size-fits-all therapies35.
Most genomic risk models are currently genetic, with limited use of other ‘omics data types
With its established model of heritability and increasing cost-effectiveness, genetic data is understandably the single most common genomic data source used in contemporary clinical prediction models (Figure 2B). Associated mutations can have a wide range of effect sizes and this influences the number of genetic variables included in a risk model. For instance, BRCA1/2 mutations predict an up to 80% lifetime risk of breast cancer, and clinical models use this and a variety of other information types to predict risk13. At the other end of the spectrum are highly polygenic disorders, where hundreds of common variants contribute small effects to disease risk; these include cardiovascular disease, schizophrenia and bipolar disorder22,23,34,36,37. A polygenic risk score is typically used to model these weak contributions, where an individual’s genetic risk is the sum of all the risk alleles carried by that individual, weighted by the significance of the corresponding allele in a GWAS study23,38–40. Another strategy is to extend this idea to include all genomic SNPs regardless of their marginal disease association, as an overall estimate of genetic contribution to the phenotype41–43. Unsurprisingly, the predictive value of genome-wide SNP data is greater in diseases with more polygenic architecture. Celiac disease, characterized by autoimmune reactivity to ingested gluten, has multiple interacting genetic contributors both within and outside the HLA region of the genome44. In this scenario, models that included half a million SNPs and considered inter-SNP correlations outperformed those that relied on a genetic risk score limited to significant SNPs from GWAS studies43,45,46. Increasing the number of SNPs has increased predictive power in celiac disease (e.g. from AUC of 0.82 with HLA-based GWAS hits to 0.90 when considering all SNPs in the genome43,45,46). Additional types of genomics data have also been successfully used. For example, multiple commercial diagnostic tests of breast cancer are available that use gene expression (Mammaprint, Oncotype DX, ProSigna) or protein expression by immunohistochemistry (MammoStrat, IHC4)14,25,47–53. The Oncotype DX test uses the expression of 21 genes to calculate the risk of recurrence and chemotherapy response in ER+, node-negative breast cancers48 and can identify a greater than fourfold difference in recurrence risk between low and high risk score groups9,14.
Clinical models must be interpretable
While excellent predictive power is ultimately the goal, model interpretability is valuable for multiple reasons. First, understanding the mechanism for how specific variables relate to outcome is useful to gain confidence in the generalizability of the method, especially with smaller data sets that cannot support high confidence statistical predictions using “black box” methods. Second, a transparent model can help us understand the causal molecules or processes underlying a clinical condition that can then be targeted for rational treatment design. Popular machine learning methods provide different levels of out-of-the-box interpretability. Support vector machines provide individual feature weights as output; interpretation of these weights, especially when decision boundaries are nonlinear, requires additional domain-specific method development (e.g. in neuroimaging54,55). Random forests are considered more interpretable than SVMs because they provide an explicit decision tree of successive choices used in classification. More recently, popular software libraries of machine-learning methods have been extended to expose the rules used by the algorithms to learn decision boundaries (sklearn in Python and inTrees in R). But in general, machine learning methods are typically non-trivial to interpret mechanistically.
Patient similarity networks as a framework for clinical prediction
The patient similarity network paradigm is a recently developed analytical framework that addresses a number of challenges in data analytics and is naturally interpretable.
The patient similarity network paradigm
In a patient similarity network, each node is an individual patient and an edge between two patients corresponds to pairwise similarity for a given feature. In this paradigm, each input patient data feature (e.g. age, sex, mutation status) is represented as a network of pairwise patient similarities (Figure 3). Each feature is represented as a different “view” of patient similarity that can be integrated with all the other views to identify patient subgroups or predict outcome. As a simple example of the concept, we can represent smoking frequency as a patient similarity network (Figure 3). Patients (nodes) who are frequent smokers would be tightly connected to each other and ‘never smokers’ would separately be tightly connected. This network is highly predictive of lung cancer status, as lung cancer cases would be enriched in the ‘smoker’ network region, while healthy controls would be enriched in the ‘never smoker’ region. If a new patient is a ‘never smoker’, they would be more similar to healthy controls and a classifier would predict them as such.
Figure 3. Patient similarity networks for hypothetical example of predicting lung cancer risk.

Nodes are patients and edge weights reflect datatype similarity. This example shows similarity from clinical (red), gene expression (green) and metabolomics (blue) data. Here, cases and controls form separate densely connected parts of the network based on clinical data (red; e.g. smoking frequency), and a similar clique in metabolomics data (blue). The predictor would therefore select clinical data and metabolomic data as predictive of case status.
Advantages of Patient Similarity Networks
The patient similarity network (PSN) framework enables classifiers that are accurate, generalizable, able to integrate heterogeneous data, and naturally handle missing information. This paradigm also provides excellent model interpretability and additionally, may be better suited to protect patient privacy than most established machine learning methods.
The PSN paradigm is novel; at the time of this writing, only two methods have used this framework for patient clustering56,57 and only one, netDx, for supervised classification58. When compared to other clustering and classification approaches, these methods can demonstrate superior performance (see details in the following sections). As a clustering algorithm, Similarity Network Fusion (SNF) has been used to identify clinically homogeneous patient subgroups in multiple cancers by integrating gene expression, miRNA and DNA methylation data. Using a different approach, PSNs were used to discover new subtypes of type 2 diabetes, each with distinctive genetic enrichments and clinical features56,57. Supervised applications have also been able to accurately predict patient survival given genomic data from various cancers.
PSNs naturally handle heterogeneous data, as any data type can be converted into a similarity network by defining a similarity measure. Once converted, all data is represented in the same manner, as a network that can be directly input into analysis methods. Missing data is also naturally handled, as a patient missing in one network may be in another and could still be used. Further, patient similarity measures, like Pearson correlation, are robust even if part of the input data vectors are missing.
Representing patients by similarity is conceptually intuitive because it can convert the data into network views where the decision boundary can be visually evident. As a clinical research tool, it is conceptually analogous to clinical diagnosis, which often involves a physician relating a patient to a mental database of similar patients they have seen. Feature engineering can help further improve interpretability. For instance, creating features at the level of biological pathways helps identify cellular processes that may be causal mechanisms for a given patient subgroup phenotype.
Algorithms that take patient similarity networks as input have the added advantage that the data have been transformed from the raw values and thus sensitive raw data need not be directly used. As the research community increasingly pools its patient cohorts to increase sample sizes for clinical discovery, protocols and technologies for maintaining patient privacy have been in parallel development (https://beacon-network.org, encryption59). Sharing PSNs enables clustering and classification applications without the need to share sensitive raw patient data.
Patient similarity networks for clustering
Clustering or class discovery is an important precursor to supervised learning algorithms. Class discovery can help identify patient labels or subtypes based on homogenous molecular signatures. A classifier could then be built for each of the subtypes, or multi-task learning could be used to build a single multi-way classifier60. Two PSN-based clustering methods have been reported to date. The first identified subgroups of type 2 diabetes patients using 73 clinical variables obtained from electronic medical records of ~11,000 patients56. Networks were generated using singular value decomposition and cosine similarity, the latter being a popular similarity metric in text mining applications. Using medical records and genotype data on the same individuals, the authors demonstrated that identified patient clusters were enriched for different comorbidities and biological pathways. In Similarity Network Fusion (SNF), a patient similarity network is generated from each input data type; for continuous-valued measures, similarity is based on Euclidean distance followed by exponential scaling57. The set of networks is then fused by iteratively boosting – or increasing – the weights of edges that are concordant among different layers, and dampening – or decreasing – the weights of those that are only present in some but not all layers. Spectral clustering is then applied to “cut” the final network into highly-interconnected clusters.
SNF performance was benchmarked against naïve integrative clustering – namely, data concatenation – and a method based on joint latent variable models. Patient subgroups were identified in five tumours by integrating mRNA expression, DNA methylation and miRNA expression57,61. SNF significantly outperformed the other approaches in identifying clinically-distinct clusters in all cases, and demonstrated consistent fast algorithm run times regardless of the number of genes included in the input data57. Since its development, SNF has been used in various applications, including subtyping medulloblastoma patients from DNA methylation and gene expression, and clustering pancreatic ductal adenocarcinoma tumours from RNA, DNA methylation and miRNA expression62,63.
netDx: Patient classification by similarity networks
We recently developed netDx, a supervised machine learning method for patient classification, based on the patient similarity network paradigm (submitted)58. The workflow starts with the definition of a classification problem, such as “predict patients that respond to a drug”. A cohort of patients containing positive and negative examples for the classification problem (i.e. cases and controls), and associated patient-level data is required as input. Each available data feature (e.g. patient age, gene expression profile) is converted into a patient similarity network. The resulting patient similarity networks are directly used as input for netDx. In the feature selection and training phase, netDx uses a machine learning algorithm to identify which input networks best characterize each patient category (e.g. cases vs. controls), and builds an optimal predictor from these features. Samples are partitioned into a training set, which is used to score input networks based on their discriminative power, and a test set, which is used to validate the predictor created on the training set. This step identifies a set of selected features (networks) per patient class, that best capture the similarity for that class. Standard cross-validation methods (e.g. 10-fold) are used to estimate generalization performance across different subsets of training and test samples. The final phase is predictor validation. A ‘blind test’ set, held out before the feature selection and training phase (i.e. not used in predictor training), is used to test the predictor. This process is repeated many times with different cohort splits to increase the strength of the generalization estimate and to optimize the feature selection. The optimized predictor (i.e. using selected networks) is used to score and rank each patient for each of the classes. The patient is then assigned to the class with the highest similarity score. netDx output includes a list of all networks and their prediction value, various predictor performance measures, and an overall patient similarity network integrating all feature-selected networks, which can be visualized and interpreted.
netDx relies on the GeneMANIA classifier originally developed for gene function prediction, which demonstrated excellent accuracy, generalization and ability to integrate heterogeneous data in this task. For example, GeneMANIA outperformed previous models in predicting mouse gene function by integrating gene expression, protein sequence data, protein interactions, phenotypes, conservation, and disease annotation64,65. netDx adapts the GeneMANIA algorithm to classify patients instead of genes. GeneMANIA scores each input network based on how well it can classify an input set of patients known to be in the same class (the query; e.g. all patients non-responsive to a medication). The ideal network for classification would perfectly connect all input patients to each other in a clique and would not connect to any other patients outside of the input list. This network would support perfect classification, since any artificially held out patient would perfectly connect only to other patients in the same class. GeneMANIA will weight such a network highly (i.e. 1.0). On the other hand, a network that does not connect any of the input patients to each other is not useful for classification. GeneMANIA will assign a low weight to such a network (i.e. 0.0). Almost all real networks are expected to be between these two extremes and get scored accordingly. Weighting is accomplished by representing the input networks as a single matrix of patient edges, and by applying ridge regression to this single matrix65. Once all input networks are weighted based on their informativeness for classification of input patients, a linear combination of networks is used to create a composite network. Label propagation is used to score all non-input patients based on similarity to the input patients. Label propagation uses the edge weights in the composite network, and assigns node discriminant values by solving a sparse linear system with a global minimum. In netDx, the process is repeated for each known patient class (e.g. cases and controls), and patients are assigned to the class that they are closest to.
Compared to other machine-learning methods used for classification, netDx demonstrates consistently excellent performance. Using a benchmark data set for predicting binary cancer survival in four tumours, netDx was compared to a panel of eight popular machine-learning methods, such as support vector machines and random forests. This prediction task required the integration of up to six data types including clinical data, mRNA expression, miRNA expression, DNA methylation, somatic copy number aberrations and proteomic profiles58. On average, netDx significantly outperforms other approaches for three of four tumours, and is at par for the fourth tumour; moreover, its top model outperforms all other models for two of the tumours. Therefore, as a machine-learning algorithm, the PSN-based netDx can perform as well as or better than standard machine-learning approaches.
In a feature not readily available in other machine-learning methods, netDx can also be used to provide mechanistic insight by grouping gene-level features into pathway-level features. When predicting breast cancer subtype from gene expression, netDx correctly feature selects pathways related to DNA damage repair and cell cycle progression. In contrast, when predicting case/control status in asthma, feature-selected themes reflect cellular processes involved in inflammation58. These different themes highlight netDx’s ability to identify cellular processes that reflect the particular biology of the condition under study. Grouping variables at the pathway level provides two major advantages. Feature selected pathways provide mechanistic insight into differences between classified patient groups. Second, pathways help address sparse data. For instance, somatic mutations may not provide enough information to compute patient similarity (e.g. patients may not have mutations in common). Merging these into pathways increases the chances that patients will have mutated pathways in common and thus can be related in terms of similarity.
Case study: Predicting tumour subtype in ependymoma with netDx
To illustrate the use of patient similarity network based classification, we use netDx to classify patients as belonging to one of two ependymoma subtypes. Ependymoma is the third most common type of pediatric brain tumour, with nearly half the cases being incurable. Witt et al. identified two types of tumours originating in the posterior fossa of the brain (Group A and Group B), each subtype showing different demographic, clinical, and molecular profiles. We obtained normalized microarray gene expression data from Witt et al.66 (total of 96 samples; 53 of Group A and 43 of Group B), and used regression to correct for batch effects. We first ran netDx with a single input network based on all genes, using pairwise Pearson correlation as a similarity metric. Lasso regression was used within the cross-validation loop to prefilter genes. Cross validation (10 train/test splits x 10-fold CV) was used to calculate predictor performance. This predictor achieved an AUROC of 0.90 (SEM=0.02), AUPR of 0.82 (SEM=0.02) and accuracy of 81% (SEM=0.02).
While the single-network design is simple and a good first-pass to estimate the signal in a given datatype, it does not provide mechanistic insight into what the predictor has learnt. We therefore implemented a pathway-based design, where all genes were grouped into 2,118 networks, one per pathway. Cross-validation and similarity were computed as before. Pathway definitions were aggregated from HumanCyc67 IOB’s NetPath68, Reactome69,70, NCI Curated Pathways71, mSigDB72, and Panther73 (http://download.baderlab.org/EM_Genesets/February_01_2018/Human/symbol/Human_AllPathways_February_01_2018_symbol.gmt)74. The overall score for a feature was defined as the highest score it consistently obtained in >=70% of the trials. This resulted in comparable class separation than that with the single network, with an average AUROC of 0.92 (SEM=0.02), AUPR of 0.84 (SEM=0.02) and accuracy of 80% (SEM=3%). Top-scoring pathways predictive of Group A tumours were related to processes involved in interactions of the cell membrane with the extra-cellular matrix (Figure 4). These include terms related to the basement membrane, integrins, laminins and chondroitin sulfate proteoglycans (Figure 4B). These themes are consistent with those identified in the original paper describing the two tumour subtypes66. Figure 4C shows the integrated patient similarity network that results from combining the top-scoring networks and shows the clear separation between the two clusters. This example illustrates the utility of netDx as a classification tool and as a tool for generating mechanistic hypotheses for precision medicine.
Figure 4. Predicting ependymoma subtype with netDx.

A. ROC curve showing performance over 10 train/test splits (grey) and the average (blue).
B. Pathway-level scores for Group A tumours. Nodes show pathway-level features that scored 10/10 in >= 7 out of 10 trials; edges connect pathways with shared genes. AutoAnnotate was used to cluster pathways.74,103
C. Integrated patient similarity network following feature selection. Nodes show the two types of tumours. Edges show patient similarity for pathways scoring 10/10 in all splits for either class. For visualization, the top 90% edges were included; edge-weighted spring-embedded layout was used to lay out the network in Cytoscape.
The road ahead: Challenges and outlook for patient similarity network analytics in precision medicine
Network-based approaches have only recently started being applied for precision medicine and many challenges must be solved for them to reach their full potential. First, analytical methods must be improved to: 1) handle large data sizes (e.g. thousands of genomes); 2) identify the most relevant features for prediction, including non-linear interactions between features; 3) automate ways to generally improve signal-to-noise ratio; 4) automate ways to characterize patient heterogeneity, like disease subtypes26,51,66,75; 5) make the best use of complementary genomics layers which may have complex relationships (e.g. gene expression is modulated by genetic variants in a tissue-specific manner76); 6) improve performance by tuning parameters and hyperparameters (similar to the way in which Google’s AutoML aims to solve this for particular problem domains - https://cloud.google.com/automl/). Scalability for patient networks can be improved by keeping only the strongest similarities by sparsification or by applying dimensionality reduction, as performed by the Mashup algorithm77. Deep learning is also promising78, as recently demonstrated by the deep network fusion method79; this method performs classifications with neural networks, by using similarity networks as input. Both of these methods could be used in netDx.
Another major challenge is to improve the use of prior knowledge. For example, for sparse genetic data, such as somatic mutations of CNVs, “smoothing” mutations over a network of known gene-gene interactions has improved patient clustering80. Given that 43% of disease-associated genetic variants are located in intergenic regions (88% lie in noncoding regions, which includes introns)81, incorporating non-coding and epigenetic information about gene regulation is important for a model seeking to explain clinical outcome. Pan-tissue atlases, such as the Roadmap Epigenomic Consortium and GTEx, as well as tissue-specific atlases such as the PsychENCODE project, are increasingly available to support this extension. New information about chromatin structure is also being mapped, such as topological associated domains (or TADs), characterized by high within-region chromatin looping, relative to interactions outside the region82,83, and enhancer-promoter loops that activate transcription. Given this information, genetic variants could be limited to those known or predicted to affect gene function84,85, such as via modulating gene expression. Use of this knowledge will increase the number of patients to whom a predictor is applicable, because some patients only have mutations in non-coding regions.
Perspective: Towards the future clinical visit
Based on these ideas, it is exciting to envision a doctor’s clinic of the future, similar to the one described by Friend and Ideker86, that uses network-based approaches for clinical decision-making (Figure 5). Such a system would initially be used by researchers to identify and validate successful predictors. A clinical researcher would identify patients to include in model training, and select which types of clinical and genomic data to include. Model training would run on centralized high performance computing systems, and results could then be interactively visualized in a web-based interface using Cytoscape.js87, similar to the gene function prediction tool at http://genemania.org. Following completion of a research study, similarity networks could be uploaded to a repository such as NDEx88 for sharing with the research community. Eventually, as the technology matures and as classifiers are validated, it would evolve to be useful to practicing physicians for use with their patients. This would require the development of additional reporting tools tailored for use in clinical decision-making. These would include a summary report card of overall confidence in the predictor as well as classification accuracy for a given patient, graphical summaries of relevant features used, and alerts about specific patient details that would affect result interpretation (e.g. ethnicity, lifestyle, genetic variants). It would also include links to relevant medical literature associating specific features with the disorder, to provide the clinician with information on prior knowledge to aid in decision-making. It would also provide the history of success rate for specific treatment choices for this condition in the health system, which would improve with data collection over time.
Figure 5. Vision for a network-based classification tool for precision medicine.

A. User interface for a network-based patient classifier software tool, such as netDx, in the near future. Such a system could be integrated with a research hospital Electronic Medical Record system and in-house genomics database. A clinical researcher could use this to build a predictor by selecting data of interest and predictor options.
B. User interface for visualizing predictor results, represented as multiple tabs. Here, the active tab shows a hypothetical integrated patient similarity network. The user has interactively highlighted a single patient for detailed study (red node) as shown in the right panel.
Algorithms like SNF and netDx advance several ideas to achieve this goal. They permit the integration of several genomic layers of patient data for patient subtyping or classification to directly answer specific clinical questions. From genomic data, netDx also can identify biological pathways whose alteration is predictive of patient outcome. This variation provides insight into mechanistic differences in patient subgroups that could be useful for rational treatment design. The integrated patient similarity network enables individual patients to be examined in the context of patients with clinically similar profiles (“neighbours”). This context enables the clinical researcher to identify the features the selected patient either conforms with, or deviates from, relative to the typical group profile. For instance, a patient classified as a treatment responder, but whose metabolic similarity is an outlier relative to other responders, may need to be more closely monitored for non-response, as compared to another patient whose profile is typical for a responder. Such network exploration would identify the pathophysiology unique to the patient, thereby enabling tailoring of their personal treatment plan.
Conclusion
Network-based approaches have the conceptual and technical features necessary to enable precision medicine that is grounded in biologically-informative, interpretable models. We predict that this paradigm will become increasingly useful in the next five years as it is used for subtype identification, prediction of clinical outcome, and the identification of biomarkers and targetable therapies in disease-related multi-omic studies.
Highlights.
Future clinics will combine clinical and genomic data with cellular models for precision medicine.
Statistical risk calculators using genomics need to be interpretable due to small sample sizes.
Patient similarity networks (PSN) are a new model to integrate data to cluster/classify patients.
PSN are accurate, intuitive, preserve patient privacy and supply mechanistic insight.
Acknowledgments
This work was supported by NRNB (U.S. National Institutes of Health, National Center for Research Resources grant number P41 GM103504). We thank Ruth Isserlin for providing prepared data for the ependymoma classification example.
Footnotes
Publisher's Disclaimer: This is a PDF file of an unedited manuscript that has been accepted for publication. As a service to our customers we are providing this early version of the manuscript. The manuscript will undergo copyediting, typesetting, and review of the resulting proof before it is published in its final citable form. Please note that during the production process errors may be discovered which could affect the content, and all legal disclaimers that apply to the journal pertain.
References
- 1.Katsnelson A. Momentum grows to make 'personalized' medicine more 'precise'. Nat Med. 2013;19:249. doi: 10.1038/nm0313-249. [DOI] [PubMed] [Google Scholar]
- 2.Meyer U, Feldon J, Dammann O. Schizophrenia and autism: both shared and disorder-specific pathogenesis via perinatal inflammation? Pediatr Res. 2011;69:26r–33r. doi: 10.1203/PDR.0b013e318212c196. [DOI] [PMC free article] [PubMed] [Google Scholar]
- 3.Truett J, Cornfield J, Kannel W. A multivariate analysis of the risk of coronary heart disease in Framingham. J Chronic Dis. 1967;20:511–24. doi: 10.1016/0021-9681(67)90082-3. [DOI] [PubMed] [Google Scholar]
- 4.Dawber TR, Meadors GF, Moore FE., Jr Epidemiological approaches to heart disease: the Framingham Study. Am J Public Health Nations Health. 1951;41:279–81. doi: 10.2105/ajph.41.3.279. [DOI] [PMC free article] [PubMed] [Google Scholar]
- 5.Rana JS, et al. Accuracy of the Atherosclerotic Cardiovascular Risk Equation in a Large Contemporary, Multiethnic Population. J Am Coll Cardiol. 2016;67:2118–2130. doi: 10.1016/j.jacc.2016.02.055. [DOI] [PMC free article] [PubMed] [Google Scholar]
- 6.Hippisley-Cox J, et al. Predicting cardiovascular risk in England and Wales: prospective derivation and validation of QRISK2. Bmj. 2008;336:1475–82. doi: 10.1136/bmj.39609.449676.25. [DOI] [PMC free article] [PubMed] [Google Scholar]
- 7.Hippisley-Cox J, et al. Derivation and validation of QRISK, a new cardiovascular disease risk score for the United Kingdom: prospective open cohort study. Bmj. 2007;335:136. doi: 10.1136/bmj.39261.471806.55. [DOI] [PMC free article] [PubMed] [Google Scholar]
- 8.Brindle P, et al. Primary prevention of cardiovascular disease: a web-based risk score for seven British black and minority ethnic groups. Heart. 2006;92:1595–602. doi: 10.1136/hrt.2006.092346. [DOI] [PMC free article] [PubMed] [Google Scholar]
- 9.Gradishar WJ, et al. NCCN Guidelines Insights: Breast Cancer, Version 1.2017. J Natl Compr Canc Netw. 2017;15:433–451. doi: 10.6004/jnccn.2017.0044. [DOI] [PubMed] [Google Scholar]
- 10.Zhang Z, Gillespie C, Bowman B, Yang Q. Prediction of atherosclerotic cardiovascular disease mortality in a nationally representative cohort using a set of risk factors from pooled cohort risk equations. PLoS One. 2017;12:e0175822. doi: 10.1371/journal.pone.0175822. [DOI] [PMC free article] [PubMed] [Google Scholar]
- 11.Zhang L, Loblaw A, Klotz L. Modeling prostate specific antigen kinetics in patients on active surveillance. J Urol. 2006;176:1392–7. doi: 10.1016/j.juro.2006.06.103. discussion 1397–8. [DOI] [PubMed] [Google Scholar]
- 12.Schmidt MI, et al. Identifying individuals at high risk for diabetes: The Atherosclerosis Risk in Communities study. Diabetes Care. 2005;28:2013–8. doi: 10.2337/diacare.28.8.2013. [DOI] [PubMed] [Google Scholar]
- 13.Lee AJ, et al. BOADICEA breast cancer risk prediction model: updates to cancer incidences, tumour pathology and web interface. Br J Cancer. 2014;110:535–45. doi: 10.1038/bjc.2013.730. [DOI] [PMC free article] [PubMed] [Google Scholar]
- 14.Tang G, et al. Comparison of the prognostic and predictive utilities of the 21-gene Recurrence Score assay and Adjuvant! for women with node-negative, ER-positive breast cancer: results from NSABP B-14 and NSABP B-20. Breast Cancer Res Treat. 2011;127:133–42. doi: 10.1007/s10549-010-1331-z. [DOI] [PMC free article] [PubMed] [Google Scholar]
- 15.Kuzniewicz MW, et al. A Quantitative, Risk-Based Approach to the Management of Neonatal Early-Onset Sepsis. JAMA Pediatr. 2017;171:365–371. doi: 10.1001/jamapediatrics.2016.4678. [DOI] [PubMed] [Google Scholar]
- 16.MacArthur J, et al. The new NHGRI-EBI Catalog of published genome-wide association studies (GWAS Catalog) Nucleic Acids Res. 2017;45:D896–d901. doi: 10.1093/nar/gkw1133. [DOI] [PMC free article] [PubMed] [Google Scholar]
- 17.Corder EH, et al. Gene dose of apolipoprotein E type 4 allele and the risk of Alzheimer's disease in late onset families. Science. 1993;261:921–3. doi: 10.1126/science.8346443. [DOI] [PubMed] [Google Scholar]
- 18.Verghese PB, Castellano JM, Holtzman DM. Apolipoprotein E in Alzheimer's disease and other neurological disorders. Lancet Neurol. 2011;10:241–52. doi: 10.1016/S1474-4422(10)70325-2. [DOI] [PMC free article] [PubMed] [Google Scholar]
- 19.Noble JA, Valdes AM. Genetics of the HLA region in the prediction of type 1 diabetes. Curr Diab Rep. 2011;11:533–42. doi: 10.1007/s11892-011-0223-x. [DOI] [PMC free article] [PubMed] [Google Scholar]
- 20.Harrison PJ. Recent genetic findings in schizophrenia and their therapeutic relevance. J Psychopharmacol. 2015;29:85–96. doi: 10.1177/0269881114553647. [DOI] [PMC free article] [PubMed] [Google Scholar]
- 21.Deloukas P, et al. Large-scale association analysis identifies new risk loci for coronary artery disease. Nat Genet. 2013;45:25–33. doi: 10.1038/ng.2480. [DOI] [PMC free article] [PubMed] [Google Scholar]
- 22.Ikeda M, et al. A genome-wide association study identifies two novel susceptibility loci and trans population polygenicity associated with bipolar disorder. Mol Psychiatry. 2018;23:639–647. doi: 10.1038/mp.2016.259. [DOI] [PMC free article] [PubMed] [Google Scholar]
- 23.Purcell SM, et al. Common polygenic variation contributes to risk of schizophrenia and bipolar disorder. Nature. 2009;460:748–52. doi: 10.1038/nature08185. [DOI] [PMC free article] [PubMed] [Google Scholar]
- 24.Boycott KM, Vanstone MR, Bulman DE, MacKenzie AE. Rare-disease genetics in the era of next-generation sequencing: discovery to translation. Nat Rev Genet. 2013;14:681–91. doi: 10.1038/nrg3555. [DOI] [PubMed] [Google Scholar]
- 25.Wallden B, et al. Development and verification of the PAM50-based Prosigna breast cancer gene signature assay. BMC Med Genomics. 2015;8:54. doi: 10.1186/s12920-015-0129-6. [DOI] [PMC free article] [PubMed] [Google Scholar]
- 26.Mack SC, et al. Epigenomic alterations define lethal CIMP-positive ependymomas of infancy. Nature. 2014;506:445–50. doi: 10.1038/nature13108. [DOI] [PMC free article] [PubMed] [Google Scholar]
- 27.Yuan Y, et al. Assessing the clinical utility of cancer genomic and proteomic data across tumor types. Nat Biotechnol. 2014;32:644–52. doi: 10.1038/nbt.2940. [DOI] [PMC free article] [PubMed] [Google Scholar]
- 28.Gaziano JM, et al. Million Veteran Program: A mega-biobank to study genetic influences on health and disease. J Clin Epidemiol. 2016;70:214–23. doi: 10.1016/j.jclinepi.2015.09.016. [DOI] [PubMed] [Google Scholar]
- 29.Sudlow C, et al. UK biobank: an open access resource for identifying the causes of a wide range of complex diseases of middle and old age. PLoS Med. 2015;12:e1001779. doi: 10.1371/journal.pmed.1001779. [DOI] [PMC free article] [PubMed] [Google Scholar]
- 30.Ledford H. AstraZeneca launches project to sequence 2 million genomes. Nature. 2016;532:427. doi: 10.1038/nature.2016.19797. [DOI] [PubMed] [Google Scholar]
- 31.Hu Y, et al. GWAS of 89,283 individuals identifies genetic variants associated with self-reporting of being a morning person. Nat Commun. 2016;7:10448. doi: 10.1038/ncomms10448. [DOI] [PMC free article] [PubMed] [Google Scholar]
- 32.Sanchez-Roige S, et al. Genome-wide association study of delay discounting in 23,217 adult research participants of European ancestry. Nat Neurosci. 2018;21:16–18. doi: 10.1038/s41593-017-0032-x. [DOI] [PMC free article] [PubMed] [Google Scholar]
- 33.Mueller SG, et al. Ways toward an early diagnosis in Alzheimer's disease: the Alzheimer's Disease Neuroimaging Initiative (ADNI) Alzheimers Dement. 2005;1:55–66. doi: 10.1016/j.jalz.2005.06.003. [DOI] [PMC free article] [PubMed] [Google Scholar]
- 34.Franzen O, et al. Cardiometabolic risk loci share downstream cis- and trans-gene regulation across tissues and diseases. Science. 2016;353:827–30. doi: 10.1126/science.aad6970. [DOI] [PMC free article] [PubMed] [Google Scholar]
- 35.den Hollander P, Savage MI, Brown PH. Targeted therapy for breast cancer prevention. Front Oncol. 2013;3:250. doi: 10.3389/fonc.2013.00250. [DOI] [PMC free article] [PubMed] [Google Scholar]
- 36.Ripatti S, et al. A multilocus genetic risk score for coronary heart disease: case-control and prospective cohort analyses. Lancet. 2010;376:1393–400. doi: 10.1016/S0140-6736(10)61267-6. [DOI] [PMC free article] [PubMed] [Google Scholar]
- 37.Biological insights from 108 schizophrenia-associated genetic loci. Nature. 2014;511:421–7. doi: 10.1038/nature13595. [DOI] [PMC free article] [PubMed] [Google Scholar]
- 38.Andersen AM, et al. Polygenic Scores for Major Depressive Disorder and Risk of Alcohol Dependence. JAMA Psychiatry. 2017;74:1153–1160. doi: 10.1001/jamapsychiatry.2017.2269. [DOI] [PMC free article] [PubMed] [Google Scholar]
- 39.Escott-Price V, Shoai M, Pither R, Williams J, Hardy J. Polygenic score prediction captures nearly all common genetic risk for Alzheimer's disease. Neurobiol Aging. 2017;49:214.e7–214.e11. doi: 10.1016/j.neurobiolaging.2016.07.018. [DOI] [PubMed] [Google Scholar]
- 40.Power RA, et al. Polygenic risk scores for schizophrenia and bipolar disorder predict creativity. Nat Neurosci. 2015;18:953–5. doi: 10.1038/nn.4040. [DOI] [PubMed] [Google Scholar]
- 41.de Los Campos G, Vazquez AI, Fernando R, Klimentidis YC, Sorensen D. Prediction of complex human traits using the genomic best linear unbiased predictor. PLoS Genet. 2013;9:e1003608. doi: 10.1371/journal.pgen.1003608. [DOI] [PMC free article] [PubMed] [Google Scholar]
- 42.Martens K, Hallin J, Warringer J, Liti G, Parts L. Predicting quantitative traits from genome and phenome with near perfect accuracy. Nat Commun. 2016;7:11512. doi: 10.1038/ncomms11512. [DOI] [PMC free article] [PubMed] [Google Scholar]
- 43.Speed D, Balding DJ. MultiBLUP: improved SNP-based prediction for complex traits. Genome Res. 2014;24:1550–7. doi: 10.1101/gr.169375.113. [DOI] [PMC free article] [PubMed] [Google Scholar]
- 44.Trynka G, et al. Dense genotyping identifies and localizes multiple common and rare variant association signals in celiac disease. Nat Genet. 2011;43:1193–201. doi: 10.1038/ng.998. [DOI] [PMC free article] [PubMed] [Google Scholar]
- 45.Abraham G, et al. Accurate and robust genomic prediction of celiac disease using statistical learning. PLoS Genet. 2014;10:e1004137. doi: 10.1371/journal.pgen.1004137. [DOI] [PMC free article] [PubMed] [Google Scholar]
- 46.Romanos J, et al. Analysis of HLA and non-HLA alleles can identify individuals at high risk for celiac disease. Gastroenterology. 2009;137:834–40. 840.e1–3. doi: 10.1053/j.gastro.2009.05.040. [DOI] [PubMed] [Google Scholar]
- 47.Perou CM, et al. Molecular portraits of human breast tumours. Nature. 2000;406:747–52. doi: 10.1038/35021093. [DOI] [PubMed] [Google Scholar]
- 48.Paik S, et al. A multigene assay to predict recurrence of tamoxifen-treated, node-negative breast cancer. N Engl J Med. 2004;351:2817–26. doi: 10.1056/NEJMoa041588. [DOI] [PubMed] [Google Scholar]
- 49.Prat A, et al. Phenotypic and molecular characterization of the claudin-low intrinsic subtype of breast cancer. Breast Cancer Res. 2010;12:R68. doi: 10.1186/bcr2635. [DOI] [PMC free article] [PubMed] [Google Scholar]
- 50.Prat A, Perou CM. Deconstructing the molecular portraits of breast cancer. Mol Oncol. 2011;5:5–23. doi: 10.1016/j.molonc.2010.11.003. [DOI] [PMC free article] [PubMed] [Google Scholar]
- 51.Comprehensive molecular portraits of human breast tumours. Nature. 2012;490:61–70. doi: 10.1038/nature11412. [DOI] [PMC free article] [PubMed] [Google Scholar]
- 52.Stephen J, et al. Time dependence of biomarkers: non-proportional effects of immunohistochemical panels predicting relapse risk in early breast cancer. Br J Cancer. 2014;111:2242–7. doi: 10.1038/bjc.2014.530. [DOI] [PMC free article] [PubMed] [Google Scholar]
- 53.Cardoso F, et al. 70-Gene Signature as an Aid to Treatment Decisions in Early-Stage Breast Cancer. N Engl J Med. 2016;375:717–29. doi: 10.1056/NEJMoa1602253. [DOI] [PubMed] [Google Scholar]
- 54.Gaonkar B, RTS, Davatzikos C. Interpreting support vector machine models for multivariate group wise analysis in neuroimaging. Med Image Anal. 2015;24:190–204. doi: 10.1016/j.media.2015.06.008. [DOI] [PMC free article] [PubMed] [Google Scholar]
- 55.Rasmussen PM, Madsen KH, Lund TE, Hansen LK. Visualization of nonlinear kernel models in neuroimaging by sensitivity maps. Neuroimage. 2011;55:1120–31. doi: 10.1016/j.neuroimage.2010.12.035. [DOI] [PubMed] [Google Scholar]
- 56.Li L, et al. Identification of type 2 diabetes subgroups through topological analysis of patient similarity. Sci Transl Med. 2015;7:311ra174. doi: 10.1126/scitranslmed.aaa9364. [DOI] [PMC free article] [PubMed] [Google Scholar]
- 57.Wang B, et al. Similarity network fusion for aggregating data types on a genomic scale. Nat Methods. 2014;11:333–7. doi: 10.1038/nmeth.2810. [DOI] [PubMed] [Google Scholar]
- 58.Pai S, et al. netDx: Interpretable patient classification using integrated patient similarity networks. 2016 doi: 10.15252/msb.20188497. bioRXiv preprint. [DOI] [PMC free article] [PubMed] [Google Scholar]
- 59.Chen F, et al. PRINCESS: Privacy-protecting Rare disease International Network Collaboration via Encryption through Software guard extensionS. Bioinformatics. 2017;33:871–878. doi: 10.1093/bioinformatics/btw758. [DOI] [PMC free article] [PubMed] [Google Scholar]
- 60.Ruffalo M, Stojanov P, Pillutla VK, Varma R, Bar-Joseph Z. Reconstructing cancer drug response networks using multitask learning. BMC Syst Biol. 2017;11:96. doi: 10.1186/s12918-017-0471-8. [DOI] [PMC free article] [PubMed] [Google Scholar]
- 61.Comprehensive genomic characterization defines human glioblastoma genes and core pathways. Nature. 2008;455:1061–8. doi: 10.1038/nature07385. [DOI] [PMC free article] [PubMed] [Google Scholar]
- 62.Cavalli FMG, et al. Intertumoral Heterogeneity within Medulloblastoma Subgroups. Cancer Cell. 2017;31:737–754.e6. doi: 10.1016/j.ccell.2017.05.005. [DOI] [PMC free article] [PubMed] [Google Scholar]
- 63.Integrated Genomic Characterization of Pancreatic Ductal Adenocarcinoma. Cancer Cell. 2017;32:185–203.e13. doi: 10.1016/j.ccell.2017.07.007. [DOI] [PMC free article] [PubMed] [Google Scholar]
- 64.Pena-Castillo L, et al. A critical assessment of Mus musculus gene function prediction using integrated genomic evidence. Genome Biol. 2008;9(Suppl 1):S2. doi: 10.1186/gb-2008-9-s1-s2. [DOI] [PMC free article] [PubMed] [Google Scholar]
- 65.Mostafavi S, Ray D, Warde-Farley D, Grouios C, Morris Q. GeneMANIA: a real-time multiple association network integration algorithm for predicting gene function. Genome Biol. 2008;9(Suppl 1):S4. doi: 10.1186/gb-2008-9-s1-s4. [DOI] [PMC free article] [PubMed] [Google Scholar]
- 66.Witt H, et al. Delineation of two clinically and molecularly distinct subgroups of posterior fossa ependymoma. Cancer Cell. 2011;20:143–57. doi: 10.1016/j.ccr.2011.07.007. [DOI] [PMC free article] [PubMed] [Google Scholar]
- 67.Romero P, et al. Computational prediction of human metabolic pathways from the complete human genome. Genome Biol. 2005;6:R2. doi: 10.1186/gb-2004-6-1-r2. [DOI] [PMC free article] [PubMed] [Google Scholar]
- 68.Kandasamy K, et al. NetPath: a public resource of curated signal transduction pathways. Genome Biol. 2010;11:R3. doi: 10.1186/gb-2010-11-1-r3. [DOI] [PMC free article] [PubMed] [Google Scholar]
- 69.Croft D, et al. The Reactome pathway knowledgebase. Nucleic Acids Res. 2014;42:D472–7. doi: 10.1093/nar/gkt1102. [DOI] [PMC free article] [PubMed] [Google Scholar]
- 70.Fabregat A, et al. The Reactome pathway Knowledgebase. Nucleic Acids Res. 2016;44:D481–7. doi: 10.1093/nar/gkv1351. [DOI] [PMC free article] [PubMed] [Google Scholar]
- 71.Schaefer CF, et al. PID: the Pathway Interaction Database. Nucleic Acids Res. 2009;37:D674–9. doi: 10.1093/nar/gkn653. [DOI] [PMC free article] [PubMed] [Google Scholar]
- 72.Subramanian A, et al. Gene set enrichment analysis: a knowledge-based approach for interpreting genome-wide expression profiles. Proc Natl Acad Sci U S A. 2005;102:15545–50. doi: 10.1073/pnas.0506580102. [DOI] [PMC free article] [PubMed] [Google Scholar]
- 73.Mi H, et al. The PANTHER database of protein families, subfamilies, functions and pathways. Nucleic Acids Res. 2005;33:D284–8. doi: 10.1093/nar/gki078. [DOI] [PMC free article] [PubMed] [Google Scholar]
- 74.Merico D, Isserlin R, Stueker O, Emili A, Bader GD. Enrichment map: a network-based method for gene-set enrichment visualization and interpretation. PLoS One. 2010;5:e13984. doi: 10.1371/journal.pone.0013984. [DOI] [PMC free article] [PubMed] [Google Scholar]
- 75.Guinney J, et al. The consensus molecular subtypes of colorectal cancer. Nat Med. 2015;21:1350–6. doi: 10.1038/nm.3967. [DOI] [PMC free article] [PubMed] [Google Scholar]
- 76.Battle A, Brown CD, Engelhardt BE, Montgomery SB. Genetic effects on gene expression across human tissues. Nature. 2017;550:204–213. doi: 10.1038/nature24277. [DOI] [PMC free article] [PubMed] [Google Scholar]
- 77.Cho H, Berger B, Peng J. Compact Integration of Multi-Network Topology for Functional Analysis of Genes. Cell Syst. 2016;3:540–548.e5. doi: 10.1016/j.cels.2016.10.017. [DOI] [PMC free article] [PubMed] [Google Scholar]
- 78.Webb S. Deep learning for biology. Nature. 2018;554:555–557. doi: 10.1038/d41586-018-02174-z. [DOI] [PubMed] [Google Scholar]
- 79.Gligorijević V, Barot M, Bonneau R. deepNF: Deep network fusion for protein function prediction. 2017 doi: 10.1093/bioinformatics/bty440. bioRXiv preprint. [DOI] [PMC free article] [PubMed] [Google Scholar]
- 80.Hofree M, Shen JP, Carter H, Gross A, Ideker T. Network-based stratification of tumor mutations. Nat Methods. 2013;10:1108–15. doi: 10.1038/nmeth.2651. [DOI] [PMC free article] [PubMed] [Google Scholar]
- 81.Hindorff LA, et al. Potential etiologic and functional implications of genome-wide association loci for human diseases and traits. Proc Natl Acad Sci U S A. 2009;106:9362–7. doi: 10.1073/pnas.0903103106. [DOI] [PMC free article] [PubMed] [Google Scholar]
- 82.Dixon JR, et al. Topological domains in mammalian genomes identified by analysis of chromatin interactions. Nature. 2012;485:376–80. doi: 10.1038/nature11082. [DOI] [PMC free article] [PubMed] [Google Scholar]
- 83.Nora EP, et al. Spatial partitioning of the regulatory landscape of the X-inactivation centre. Nature. 2012;485:381–5. doi: 10.1038/nature11049. [DOI] [PMC free article] [PubMed] [Google Scholar]
- 84.Bendl J, et al. PredictSNP2: A Unified Platform for Accurately Evaluating SNP Effects by Exploiting the Different Characteristics of Variants in Distinct Genomic Regions. PLoS Comput Biol. 2016;12:e1004962. doi: 10.1371/journal.pcbi.1004962. [DOI] [PMC free article] [PubMed] [Google Scholar]
- 85.McLaren W, et al. The Ensembl Variant Effect Predictor. Genome Biol. 2016;17:122. doi: 10.1186/s13059-016-0974-4. [DOI] [PMC free article] [PubMed] [Google Scholar]
- 86.Friend SH, Ideker T. Point: Are we prepared for the future doctor visit? Nat Biotechnol. 2011;29:215–8. doi: 10.1038/nbt.1794. [DOI] [PubMed] [Google Scholar]
- 87.Franz M, et al. Cytoscape.js: a graph theory library for visualisation and analysis. Bioinformatics. 2016;32:309–11. doi: 10.1093/bioinformatics/btv557. [DOI] [PMC free article] [PubMed] [Google Scholar]
- 88.Pratt D, et al. NDEx, the Network Data Exchange. Cell Syst. 2015;1:302–305. doi: 10.1016/j.cels.2015.10.001. [DOI] [PMC free article] [PubMed] [Google Scholar]
- 89.Fischbach GD, Lord C. The Simons Simplex Collection: a resource for identification of autism genetic risk factors. Neuron. 2010;68:192–5. doi: 10.1016/j.neuron.2010.10.006. [DOI] [PubMed] [Google Scholar]
- 90.Kennedy SH, et al. The Canadian Biomarker Integration Network in Depression (CAN-BIND): advances in response prediction. Curr Pharm Des. 2012;18:5976–89. doi: 10.2174/138161212803523635. [DOI] [PubMed] [Google Scholar]
- 91.Akbarian S, et al. The PsychENCODE project. Nat Neurosci. 2015;18:1707–12. doi: 10.1038/nn.4156. [DOI] [PMC free article] [PubMed] [Google Scholar]
- 92.Euesden J, Lewis CM, O'Reilly PF. PRSice: Polygenic Risk Score software. Bioinformatics. 2015;31:1466–8. doi: 10.1093/bioinformatics/btu848. [DOI] [PMC free article] [PubMed] [Google Scholar]
- 93.Comprehensive genomic characterization of squamous cell lung cancers. Nature. 2012;489:519–25. doi: 10.1038/nature11404. [DOI] [PMC free article] [PubMed] [Google Scholar]
- 94.Braun KVE, et al. Epigenome-wide association study (EWAS) on lipids: the Rotterdam Study. Clin Epigenetics. 2017;9:15. doi: 10.1186/s13148-016-0304-4. [DOI] [PMC free article] [PubMed] [Google Scholar]
- 95.Ceccarelli M, et al. Molecular Profiling Reveals Biologically Discrete Subsets and Pathways of Progression in Diffuse Glioma. Cell. 2016;164:550–63. doi: 10.1016/j.cell.2015.12.028. [DOI] [PMC free article] [PubMed] [Google Scholar]
- 96.Clarke TK, et al. Genome-wide association study of alcohol consumption and genetic overlap with other health-related traits in UK Biobank (N=112 117) Mol Psychiatry. 2017;22:1376–1384. doi: 10.1038/mp.2017.153. [DOI] [PMC free article] [PubMed] [Google Scholar]
- 97.Farshidfar F, et al. Integrative Genomic Analysis of Cholangiocarcinoma Identifies Distinct IDH-Mutant Molecular Profiles. Cell Rep. 2017;18:2780–2794. doi: 10.1016/j.celrep.2017.02.033. [DOI] [PMC free article] [PubMed] [Google Scholar]
- 98.Liu DJ, et al. Exome-wide association study of plasma lipids in >300,000 individuals. Nat Genet. 2017;49:1758–1766. doi: 10.1038/ng.3977. [DOI] [PMC free article] [PubMed] [Google Scholar]
- 99.Liu Y, et al. Epigenome-wide association data implicate DNA methylation as an intermediary of genetic risk in rheumatoid arthritis. Nat Biotechnol. 2013;31:142–7. doi: 10.1038/nbt.2487. [DOI] [PMC free article] [PubMed] [Google Scholar]
- 100.Verhaak RG, et al. Integrated genomic analysis identifies clinically relevant subtypes of glioblastoma characterized by abnormalities in PDGFRA, IDH1, EGFR, and NF1. Cancer Cell. 2010;17:98–110. doi: 10.1016/j.ccr.2009.12.020. [DOI] [PMC free article] [PubMed] [Google Scholar]
- 101.Xu Z, et al. Epigenome-wide association study of breast cancer using prospectively collected sister study samples. J Natl Cancer Inst. 2013;105:694–700. doi: 10.1093/jnci/djt045. [DOI] [PMC free article] [PubMed] [Google Scholar]
- 102.Farshidfar F, et al. Integrative Genomic Analysis of Cholangiocarcinoma Identifies Distinct IDH-Mutant Molecular Profiles. Cell Rep. 2017;19:2878–880. doi: 10.1016/j.celrep.2017.06.008. [DOI] [PMC free article] [PubMed] [Google Scholar]
- 103.Kucera M, Isserlin R, Arkhangorodsky A, Bader GD. AutoAnnotate: A Cytoscape app for summarizing networks with semantic annotations. F1000Res. 2016;5:1717. doi: 10.12688/f1000research.9090.1. [DOI] [PMC free article] [PubMed] [Google Scholar]
- 104.Engchuan W, et al. Performance of case-control rare copy number variation annotation in classification of autism. BMC Med Genomics. 2015;8(Suppl 1):S7. doi: 10.1186/1755-8794-8-S1-S7. [DOI] [PMC free article] [PubMed] [Google Scholar]
- 105.Gerstung M, et al. Combining gene mutation with gene expression data improves outcome prediction in myelodysplastic syndromes. Nat Commun. 2015;6:5901. doi: 10.1038/ncomms6901. [DOI] [PMC free article] [PubMed] [Google Scholar]
- 106.Yousefi S, et al. Predicting clinical outcomes from large scale cancer genomic profiles with deep survival models. Sci Rep. 2017;7:11707. doi: 10.1038/s41598-017-11817-6. [DOI] [PMC free article] [PubMed] [Google Scholar]