

Abstract
Over 90% of genetic variants associated with complex human traits map to non-coding regions, but little is understood about how they modulate gene regulation in health and disease. One possible mechanism is that genetic variants affect the activity of one or more cis-regulatory elements leading to gene expression variation in specific cell types. To identify such cases, we analyzed ATAC-seq and RNA-seq profiles from stimulated primary CD4+ T cells in up to 105 healthy donors. We found regions of accessible chromatin (ATAC-peaks) are co-accessible at kilobase and megabase resolution, consistent with the 3D chromatin organization measured by in situ Hi-C in T cells. 15% of genetic variants located within ATAC-peaks affected the accessibility of the corresponding peak (ATAC-QTLs). ATAC-QTLs have the largest effects on co-accessible peaks, are associated with gene expression, and are enriched for autoimmune disease variants. Our results provide insights into how natural genetic variants modulate cis-regulatory elements, in isolation or in concert, to influence gene expression.
Introduction
The vast majority of disease-associated loci identified through genome-wide association studies (GWAS)1–3 are located in non-coding regions of the genome, often distant from the nearest gene4. Quantitative trait loci (QTL) studies that associate genetic variants with molecular traits provide a framework for assessing the gene regulatory potential of disease-associated variants. For example, a statistically significant number of GWAS loci are associated with gene expression (expression QTLs – eQTLs) across diverse cell types and states5–10, implicating gene regulation in determining disease risk11,12.
Genetic analysis of variation in chromatin state13–17 is a powerful approach for identifying single nucleotide polymorphisms (SNPs) that directly affect cis-regulatory activity18. In lymphoblastoid cell lines, thousands of SNPs have been associated with DNase I hypersensitivity (measured by DNase-seq)19 and histone tail modifications (measured by ChIP-seq)20–22. Similarly, SNPs have been associated with variation in DNA methylation and histone tail modifications in resting primary immune cell types (neutrophils, monocytes and CD4+/CD45RA+ effector memory T cells)12. Most of the associated SNPs in these studies were also associated with nearby transcript abundance, suggesting the genetic perturbation of cis-regulatory activity as a determinant of gene expression variability11,12,19,21,23.
These studies have provided foundational resources for understanding the genetic basis of gene regulation in resting cells, but many disease states are associated with immune cell activation24,25. In particular, dysregulation of T cell homeostasis and activation are known to play a role in autoimmunity26,27, cancer28,29 and infectious diseases30, and hundreds of SNPs have been associated with gene expression during T cell activation and polarization10,31. Moreover, because both DNase-seq and ChIP-seq are laborious and require large cell numbers, it remains challenging to apply them to primary human cells at the scale required for genetic association.
Here, we optimized and performed Assay for Transposase Accessible Chromatin sequencing (ATAC-seq) on stimulated CD4+ T cells from 105 healthy individuals to characterize the extent of natural variability in chromatin state, identify its genetic basis, and assess its influence on gene expression. We further leveraged the variability between individuals to identify co-accessible chromatin regions and to relate those to genetic variation and 3D genome organization. Our work helps lay the foundation for the critical tasks of annotating cis-regulatory elements in primary human T cells and characterizing how genetic variation contribute to variability in gene regulation between individuals.
Results
Changes in T cell chromatin state in response to activation
We used ATAC-seq32 to assay CD4+ T cells in two different conditions: either unstimulated (Th), or stimulated in vitro using tetrameric antibodies against CD3 and CD28 for 48 hours (Thstim) (Fig. 1a). Aligned reads from six samples (five donors, one pair of donors were replicates) were pooled for each condition, yielding a total of 209 million reads for Thstim and 58 million for Th cells (Methods). Of these five donors, two are of East Asian, two are of African American and one is of European decent (Supplementary Fig. 1). There was a global increase in chromatin accessibility in response to stimulation, with 52,154 chromatin accessible peaks detected in Thstim (average width: 483 bp +/− 344 bp) and 36,487 in Th cells (average width of 520 bp +/− 319 bp) (MACS2, FDR < 0.05, Fig. 1a, b). Downsampling each Thstim sample to the same number of reads as the matching Th sample yielded a similar trend (24,665 Thstim vs. 17,313 Th peaks) suggesting the increased accessibility is not due to differences in sequencing depth. Of the 63,763 peaks identified in at least one condition, 27,446 are similarly accessible between the conditions (shared peaks), 28,017 are more accessible in Thstim cells (Thstim-specific peaks) (FDR < 0.05), and 8,298 are more accessible in Th cells (Th-specific peaks) (FDR < 0.05) (Fig. 1a, b, and Supplementary Table 1).
Figure 1. Changes in chromatin state in human T cell activation.
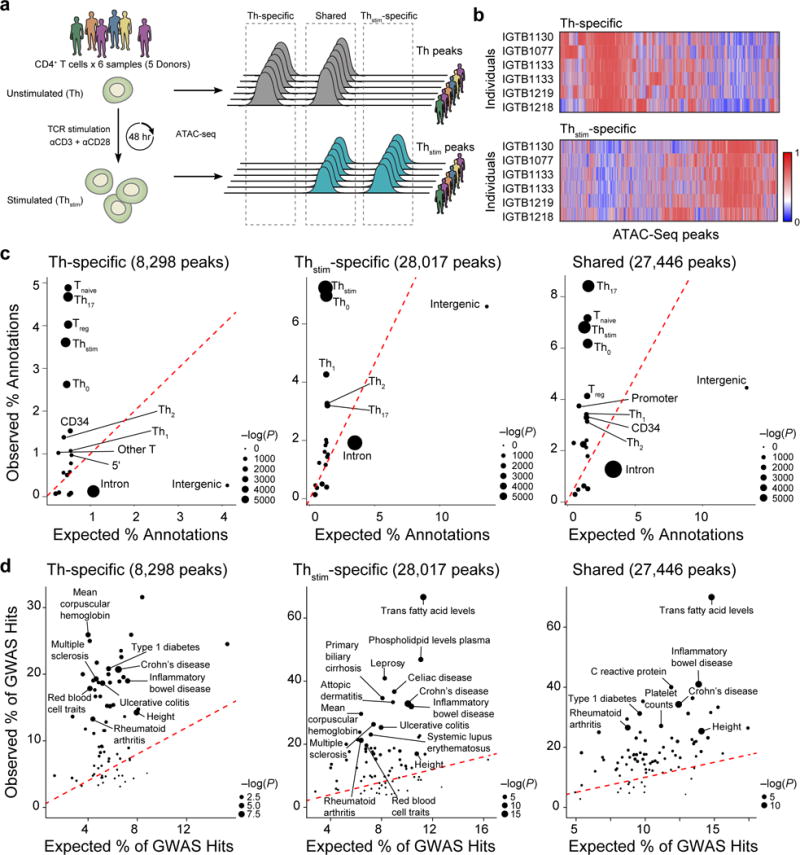
(a) Experimental overview (left) and schematic of nomenclature (right). (b) Differential chromatin accessibility. Regions of open chromatin (columns) in six samples (rows) before (top, Th-specific) and 48hr after (bottom, Thstim-specific) activation of primary T cells with anti-CD3/CD28 antibodies. (c) Overlap with previously annotated T cell enhancers. For each annotation, expected (x-axis) vs. observed (y-axis) percentages of annotated features overlapping Th-specific (left), Thstim-specific (center) and shared peaks (right). (d) Overlap with GWAS variants. For each phenotype or disease, expected (x-axis) vs. observed (y-axis) percentages of GWAS loci overlapping Th-specific (left), Thstim-specific (center), or shared (right) peaks.
Peaks of accessible chromatin are associated with distinctive genomic features and enriched for SNPs associated with autoimmune diseases. Compared to Th-specific peaks, Thstim-specific peaks overlap a higher percentage of enhancers defined using H3K27Ac marks18 in αCD3/αCD28- (Th0, 6.9% vs. 2.6%) and phorbol myristate acetate (PMA)-stimulated CD4+ T cells (Thstim, 7.2% vs. 3.6%); and a lower percentage of enhancers in regulatory (Treg, 1.4% vs. 4.0%), naïve (Tnaive, 1.2% vs. 4.9%) and IL17 producing CD4+ T cells (Th17, 3.2% vs. 4.6%) (Fig. 1c)18. Thstim-specific and shared peaks also overlap a higher percentage of SNPs associated with autoimmune diseases, including inflammatory bowel disease (IBD) (32% and 41% vs. 20%) and rheumatoid arthritis (21% and 27% vs. 13%) (Fig. 1d), highlighting the importance of profiling cells under stimulation to identify disease-relevant cis-regulatory elements.
Analyzing peaks of accessible chromatin in aggregate provides estimates of the frequencies and single-nucleotide resolution footprints of transcription factor (TF) binding32. Thstim-specific peaks are enriched for genomic locations bound by TFs important for CD4+ T cell activation or differentiation, including members of the AP-1 super family (e.g., 36% contain a BATF binding site) and interferon regulatory factors (e.g., 15% contain a IRF4 binding site)33–35 (Fig. 2a, b). Thstim-specific peaks overlapping regions bound by both BATF and IRF4 (17.4% of peaks)34 reveal a different footprint compared to those overlapping regions bound by only one of the TFs (Fig. 2b, left). Conversely, shared peaks are enriched for regions bound by CTCF and BORIS (encoded by CTCFL), two transcriptional repressors known to maintain chromatin state independent of cell type and state33–35 (Fig. 2a), and their binding footprints are invariant of condition (Fig. 2b, right). ETS1 binding sites overlapping shared, Thstim-, and Th-specific peaks have distinct footprints and binding motifs: we observed the canonical ETS1 motif (5′-CACTTCCTGT-3′) in shared peaks, a 3′ extended motif (5′-CACTTCCTGTCA-3′) in Th-specific peaks, and a T/G to T (5′-CACTTCCTGT-3′) substitution at the eighth position in Thstim-specific peaks, consistent with sequence motifs found at distal ETS1 binding sites (Fig. 2c)36. Th-specific peaks are more likely to overlap ETS/RUNX binding sites than shared or Thstim-specific peaks (OR = 2.7 and 3.9; Fisher’s exact test, P-value < 2.2×10⁻¹⁶ and P-value < 2.2×10⁻¹⁶, respectively) (Fig. 2d), which could be due to an enrichment of Th-specific peaks for Treg enhancers known to be bound by the ETS/RUNX complex37,38. An additional 6,102 Thstim-specific (6.6% of intergenic regions) and 4,118 shared peaks (4.5% of intergenic regions) were located in non-coding regions, previously not annotated by H3K27Ac18,39, of which 53.5% and 35.6% overlap known binding sites for TFs in the AP-1 super family and IRF family, respectively. Thus, regions of accessible chromatin overlap both known enhancers and TF binding sites important for polarization-independent activation of T cells, consistent with our stimulation protocol, and in aggregate reveal high-resolution footprints distinguishing condition specific and combinatorial transcription factor binding.
Figure 2. Changes in transcription factor enrichment in response to T cell activation.
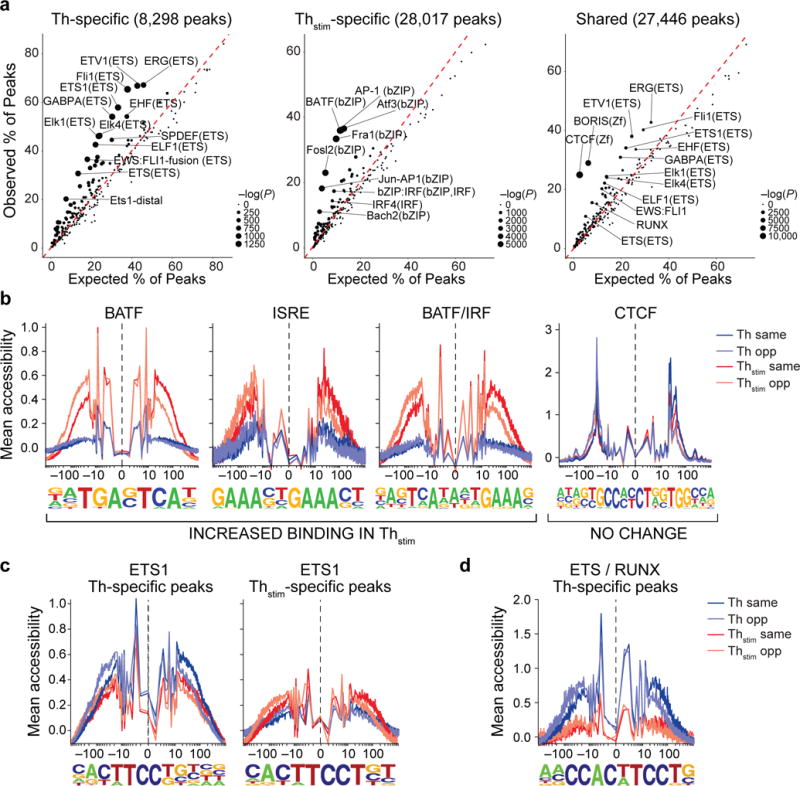
(a) Transcription factor motif enrichment. Expected (x-axis) vs. observed (y-axis) percentages of Th-specific (left), Thstim-specific (center), or shared (right) peaks overlapping each TF binding site annotation. (b-d) TF footprinting. For each TF motif (as defined in ENCODE63), nucleotide resolution average chromatin accessibility (y-axis) in Th (purple) or Thstim (red) cells along the TF binding site (x-axis; log(bp from center of each TF motif)). Aggregated locations are defined as (b) Thstim-specific peaks overlapping BATF, ISRE, and BATF/IRF motifs (three left panels) and shared peaks overlapping CTCF binding sites (right panel), (c) Th-specific (left) and Thstim-specific (right) peaks overlapping ETS1 binding sites, and (d) Th-specific peaks overlapping ETS1/RUNX combinatorial binding sites.
Chromatin co-accessibility at multiple genomic scales
Because Thstim-peaks, including shared and Thstim-specific peaks, better overlap known T cell cis-regulatory elements and autoimmune disease loci, we next characterized the inter-individual variability of chromatin accessibility only in stimulated T cells. We optimized the ATAC-seq protocol to profile stimulated CD4+ T cells (Supplementary Fig. 2; Methods) from 105 healthy donors in the ImmVar Consortium10, all of European descent (Fig. 3a and Supplementary Fig. 1). We obtained a median of 37 million (MAD +/−13 million) reads per sample, from highly complex libraries with low mitochondrial DNA (mtDNA) contamination (average contamination < 3%, Supplementary Fig. 3). Using a pool of 4.2 billion merged reads from all 105 individuals, we jointly called 167,140 peaks of accessible chromatin (heretoafter, ATAC-peaks) (MACS2, FDR < 0.05, Fig. 3a, b). These included 85.1% of the 52,154 Thstim peaks identified in the initial set of six samples from five individuals with similar enrichment for GWAS loci (Pearson R = 0.65) and enhancer elements (Pearson R = 0.88) (Supplementary Fig. 4).
Figure 3. Inter-individual chromatin co-accessibility.
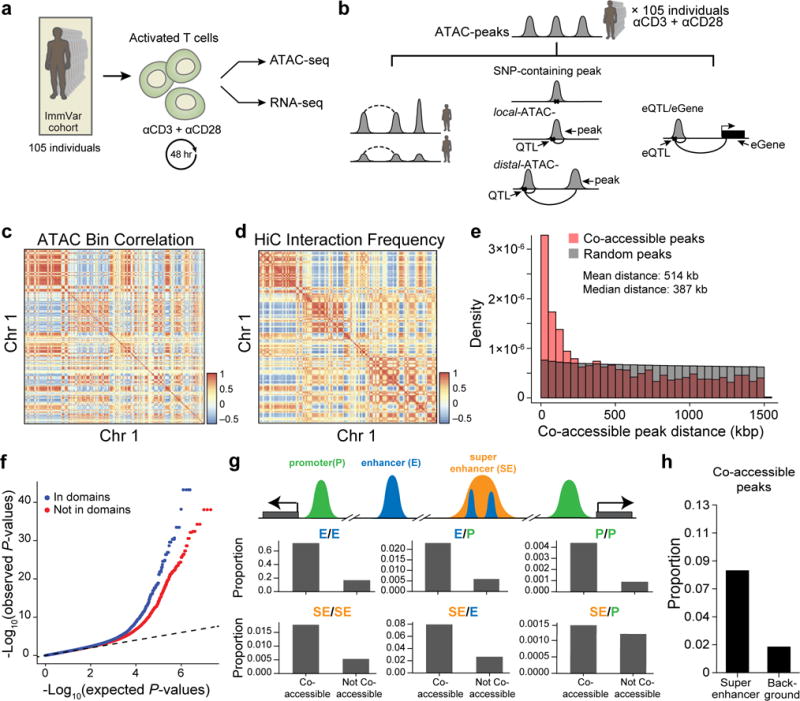
(a) Overview of T cell activation for 105 ATAC-seq and 95 RNA-seq samples. (b) Schematic of nomenclature for co-accessible peaks, SNP-containing peaks, local-ATAC-QTLs, distal-ATAC-QTLs, and eQTLs. Dashed lines denote a correlation between co-accessible peaks and solid lines denote a genetic association. (c) Megabase scale correlation of chromatin accessibility across 105 individuals. Heat map shows the pairwise Pearson correlation of chromatin accessibility between 1 Mb bins (row, column) for Chr 1. (d) Pearson correlation of Hi-C interactions at 1 Mb resolution for Chr 1. (e) Histogram of distances between significantly co-accessible peaks (pink) and random permuted peaks (grey). (f) Co-accessible peaks overlap with Hi-C domains. Q-Q plot of linear regression P-values for pairs of peaks residing in (blue) or out (red) of the same Hi-C domain. (g) Pairs of co-accessible peaks overlapping with multiple cis-regulatory regions. A cartoon depiction (top) of co-accessible peaks in promoters (green), enhancers (blue), and super enhancers (orange). Proportion (y-axis) of pairs of co-accessible peaks and non-co-accessible peaks overlapping pairs of annotated cis-regulatory elements (right). (h) Proportion of co-accessible peaks overlapping super-enhancers or randomly shuffled background.
Leveraging the variability in ATAC-peaks across 105 individuals, we found patterns of co-accessibility (defined as correlation between individual or sets of ATAC-peaks) at multiple genomic scales, recapitulating the 3D chromatin organization, as determined by domain-resolution in situ Hi-C40 of stimulated CD4+ T cells pooled from another five donors (Supplementary Table 2, and Supplementary Fig. 5). At the resolution of 1 Mb bins, we observed significant intra-chromosomal co-accessibility, as measured by correlation of total counts of ATAC-peaks within each bin (Chr1: Fig. 3c, other chromosomes: Supplementary Fig. 6). These pairwise correlations are qualitatively similar to and quantitatively consistent with (Pearson R = 0.66) Hi-C interaction frequencies at the same resolution (Fig. 3d and Supplementary Fig. 6), likely reflecting variability in the signal (regions of accessible chromatin) to noise (regions of inaccessible chromatin) ratio across samples similar to observations in single cells32. At 100 kb resolution, pairwise correlations are also consistent with Hi-C interaction frequencies (Pearson R = 0.52, Supplementary Fig. 7).
We next characterized the co-accessibility between pairs of ATAC-peaks within each 1.5 Mb bin across the genome by linear regression (Fig. 3b, dashed black line, left). After accounting for sources of variation (Supplementary Tables 3 and 4), we found 2,158 pairs of co-accessible peaks enriched for those in close proximity (on average 514 kb apart), encompassing 2% (3,204/167,140) of ATAC-peaks (permutation FDR < 0.05, Fig. 3e, Supplementary Table 5, and Supplementary Fig. 8). The sequencing coverage of co-accessible peaks is similar to that of all ATAC-peaks (Supplementary Fig. 9a), but they are individually more likely to overlap Tnaïve, Thstim, and Th17 enhancers (Supplementary Fig. 10) and binding sites for three pioneering factors: NRF, NFY, and STAF (FDR < 0.05, Supplementary Fig. 11). Pairs of co-accessible peaks were more correlated when both peaks reside in the same contact domain (estimated from Hi-C interactions, Fig. 3f) and 80% consisted of peaks overlapping pairs of cis-regulatory annotations (e.g. enhancer/enhancer, enhancer/promoter, super enhancer/promoter; Fig. 3g). Finally, co-accessible peaks were enriched in annotated Thstim super-enhancer regions41 (Fig. 3h, Methods)41,42. These results suggest that chromatin co-accessibility may be determined by the 3D conformation of the genome and may correspond to coordinated regulation of multiple cis-regulatory elements, including known T cell enhancers and regions bound by pioneering factors.
Genetic variants associated with chromatin accessibility
We next defined the genetic basis of chromatin accessibility by associating ATAC-peaks with common SNPs (minor allele frequency > 0.05) across the 105 individuals. To maximize statistical power, we analyzed only the 64,188 SNP-containing ATAC-peaks (Fig. 3b) and found 3,318 that were significantly associated with at least one SNP (RASQUAL43, P-value < 2.91×10⁻³, permutation FDR < 0.05) (Fig. 4a, Supplementary Fig. 12 and Supplementary Table 6). Each best-associated SNP we term a local ATAC quantitative trait locus (local-ATAC-QTL) and the corresponding peak a local-ATAC-peak (Fig. 3b, middle). We estimate that 15% of the 64,188 peaks are associated with at least one local-ATAC-QTL using a method to estimate the proportion of null hypotheses while accounting for incomplete power44. Sequencing coverage of local-ATAC-peaks was similar to all ATAC-peaks (Supplementary Fig. 9b) and the estimated effects of local-ATAC-QTLs are correlated with their effects on H3K27AC ChIP-seq peaks in similar cell types12 (Supplementary Fig. 13.
Figure 4. Genetic variants that affect chromatin states in human T cell activation.
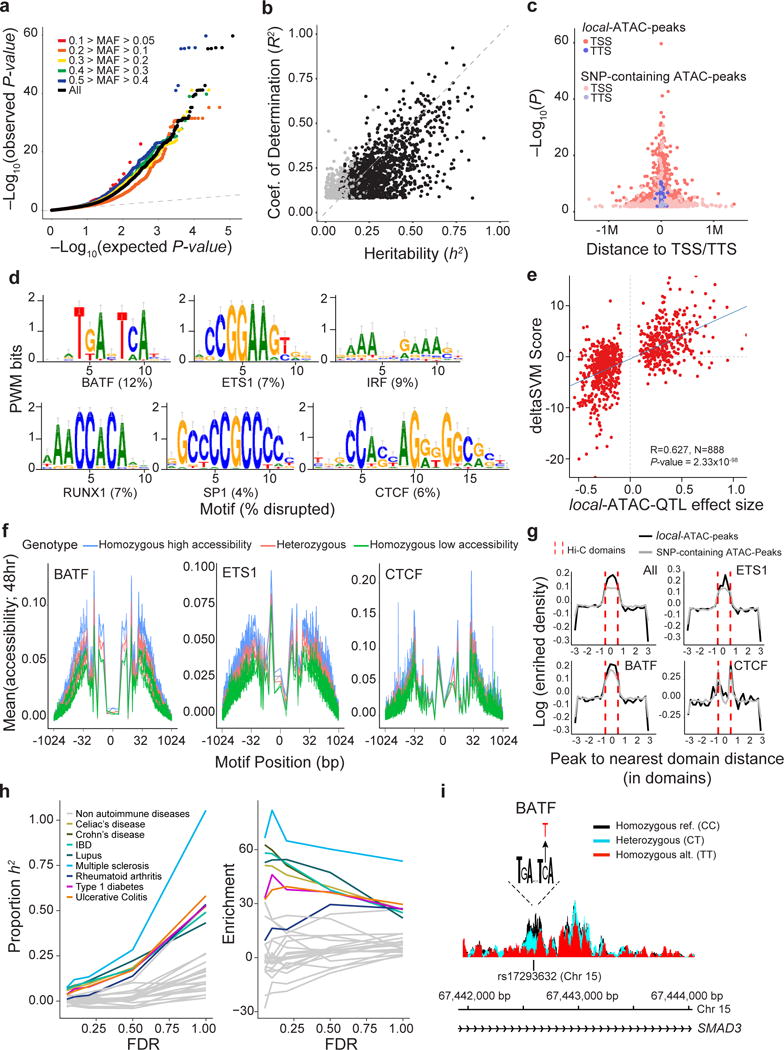
(a) Q-Q plot of linear regression P-values for all local-ATAC-QTLs (black) and local-ATAC-QTLs binned by minor allele frequency: 0.1 > MAF > 0.05 (red), 0.2 > MAF > 0.1 (orange), 0.3 > MAF 0.2 (yellow), 0.4 > MAF > 0.3 (green), 0.5 > MAF 0.4 (blue), and MAF > 0.05 (black). (b) Heritability of chromatin accessibility. For each of 1,428 local-ATAC-peaks, coefficient of determination (R2) of the best associated local-ATAC-QTL (y-axis) vs. cis heritability (h2) estimated based on all genotypes +/− 500 kb of each peak (x-axis). Black points: significantly heritable peaks (FDR < 0.05). (c) Enrichment of local-ATAC-peaks in TSS and TTS. 3,318 local-ATAC-peaks (dark pink and purple) vs. 3,318 randomly sampled SNP-containing ATAC-peaks (light pink and purple). (d-f) Disruption of TF binding sites by local-ATAC-QTLs. (d) Unsupervised TF binding site analysis of local-ATAC-peaks. Motifs for six TFs associated with most of the large gkmSVM weights, and the percentage of the overall disruption (%, bottom) explained by local-ATAC-QTLs. (e) Correlation of effect sizes of local-ATAC-QTLs (x-axis) vs. deltaSVM scores (y-axis). (f) Allele specificity of local-ATAC-QTLs. For BATF, ETS1 and CTCF motifs (as identified in ENCODE63), aggregated plots of mean chromatin accessibility (y-axis) of local-ATAC-peaks along the TF binding site (x-axis; log(bp from center of the TF motif)) for samples heterozygous (pink), homozygous for the high (blue) or low (green) local-ATAC-QTL alleles (g) Relation between contact domains and SNP-containing ATAC-peaks or local-ATAC-peaks. For ATAC-peaks or local-ATAC-peaks overlapping ETS1, CTCF, or BATF binding sites, enrichment density (y-axis) vs. distance (number of domains) of peak to nearest domain (x-axis). Hi-C contact domain boundaries are indicated (dotted red lines). (h) Partitioned heritability estimates. The proportion of the heritability for 28 diseases explained (proportion: left, y-axis; enrichment: right, y-axis) captured by local-ATAC-QTLs called at different FDR thresholds (x-axis). (i) Effects of local-ATAC-QTL rs17293632 on the accessibility of the corresponding BATF containing local-ATAC-peak on chromosome 15. ATAC-seq profiles were aggregated per rs17293632 genotypes (black: homozygous major allele, light blue: heterozygous, red: homozygous minor allele).
Several lines of evidence support a model where local-ATAC-QTLs affect accessibility by perturbing cis-regulatory elements active in stimulated T cells. First, for the 1,428/3,318 heritable local-ATAC-peaks determined by fitting a linear mixed model over SNPs +/− 500 kb of each peak45 (mean h2 = 44%, GCTA FDR < 0.05), 81% of the heritability is explained by the corresponding local-ATAC-QTLs (Fig. 4b and Supplementary Tables 6 and 7; Methods). This suggests a genetic architecture where a single SNP is responsible for the majority of heritable variation. Second, compared to SNP-containing ATAC-peaks, local-ATAC-peaks are preferentially located near transcription start and termination sites (Fig. 4c), are more enriched for T cell enhancers (P-value < 9.23×10−63, hypergeometric test; Supplementary Figure 14), and are more enriched for genomic regions bound by TFs involved in T cell development and activation (e.g. BATF, AP-1 and IRF) (Supplementary Figure 15). Applying deltaSVM46,47 to predict the effects of SNPs on TF binding for 903 ATAC-QTLs located within 300 bp of the middle of the corresponding peaks, we found that almost half (45%) are predicted to strongly disrupt bindings for one of six (BATF, ETS1, IRF, RUNX1, SP1 and CTCF) TF binding sites (Fig. 4d). The effect sizes of local-ATAC-QTLs are correlated with SNP motif disruption scores obtained by deltaSVM48 (Pearson R = 0.627, P-value < 2.33×10−98, Fig. 4e; Methods). For local-ATAC-peaks that overlap BATF, ETS1 and CTCF binding sites, differential accessibility between genotypes in the core motifs were observed at single nucleotide resolution, even though only 5% of the corresponding local-ATAC-QTLs directly alter the core motif sequences. This suggests that the genetic perturbation of TF binding – either directly by disrupting their sites, or more likely indirectly by first disrupting binding by other factors in the same cis-regulatory element – may be a major driver for the observed variation in chromatin accessibility across individuals (Fig. 4f and Supplementary Fig. 16). Note that the relation between the accessibility of local-ATAC-peaks and 3D chromatin organization is similar to that observed for SNP-containing ATAC-peaks in general (Fig. 4g). Both local-ATAC-peaks and SNP-containing ATAC-peaks overlapping BATF and ETS motifs are enriched within Hi-C contact domains, whereas those overlapping CTCF motifs are enriched at the contact domain boundaries (Fig. 4g). These results are consistent with previous reports of CTCF enrichment at contact domain boundaries40,49–51.
Local-ATAC-peaks are more likely to overlap GWAS SNPs from autoimmune diseases than other SNP-containing ATAC-peaks (Supplementary Figure 17), providing a functional context for interpreting disease associations. Even though local-ATAC-peaks consist of only ~5% of the SNP-containing ATAC-peaks, they overlap a much larger percentage of the loci associated with autoimmune diseases including Celiac’s disease (28%), Crohn’s disease (22%), and rheumatoid arthritis (12%), an 8-fold (hypergeometric P-value < 4.34×10⁻⁷), 6-fold (hypergeometric P-value < 8.58×10⁻¹⁷), and 5-fold (hypergeometric P-value < 6.18×10⁻⁸) enrichment, respectively. To corroborate this, we performed partitioned heritability analysis to test for enrichment of local-ATAC-QTLs in explaining the heritability of 28 common diseases where summary statistics are available. While local-ATAC-QTLs are highly enriched for disease associated variants (i.e. Celiac’s disease: 6%, enrichment = 51x and Crohn’s disease: 7%, enrichment = 63x), the results are not statistically significant after multiple testing correction. However, by relaxing the FDR thresholding for defining local-ATAC-QTLs, we found a general trend of increased proportion of heritability explained and statistical significance, and a decrease in enrichment, especially in autoimmune diseases (Fig. 4h; Methods). In fact, all SNP-containing ATAC-peaks (corresponding to FDR < 1) account for a statistically significant proportion of the heritability for all autoimmune diseases (> 22%, Bonferroni-corrected P-value < 1.3×10⁻², Fig. 4h; Methods). For example, rs17293632 (NC_000015.10:g.67442596C>T) has been associated with Crohn’s disease and IBD52 and is located in the first intron of SMAD3, a gene that encodes for a transcription factor involved in the TGF-β signaling pathway that regulates T cell activation and metabolism53. This SNP disrupts a consensus BATF binding site at a conserved position (deltaSVM=-12.72), and results in decreased chromatin accessibility in individuals that carry the alternate allele (Fig. 4i).
Together, these results suggest that when the accessibility of ATAC-peaks is affected by local-ATAC-QTLs residing within peaks, this often involves the disruption of TF binding, even though the SNPs almost always reside outside of the core TF binding site. Moreover, local-ATAC-QTLs in stimulated CD4+ cells are enriched for autoimmune disease loci, both in the number of overlaps and proportion of heritability explained.
Genetic determinants of chromatin co-accessibility
We next tested if the effect of each local-ATAC-QTL could be propagated to co-accessible peaks, for example through 3D chromatin organization, and thus have effects on multiple cis-regulatory elements simultaneously. We first estimated the heritability of ATAC-peaks using SNPs +/− 500 kb of each peak. As expected, local-ATAC-peaks (2,444/3,318 that converged) were more heritable (mean h2 = 0.22) than all ATAC-peaks (Fig. 5a). Co-accessible peaks were also more heritable than all ATAC-peaks, both those containing SNPs (mean h2 = 0.44 vs. mean h2 = 0.04) and those that do not (mean h2 = 0.10 vs. mean h2 = 0.04). Excluding the 3,318 local-ATAC-peaks, we identified 382 ATAC-peaks that were associated with a local-ATAC-QTL (RASQUAL, P-value < 1.27×10⁻⁴, permutation FDR < 0.05) located +/− 500 kb from the peak. We term each associated SNP a distal-ATAC-QTL and each associated peak a distal-ATAC-peak (Fig. 2b). Consistent with the heritability analysis, distal-ATAC-QTLs imparted the strongest effects on co-accessible peak (Fig. 5b and Supplementary Tables 2, 3).
Figure 5. Genetic determinants of co-accessible peaks.
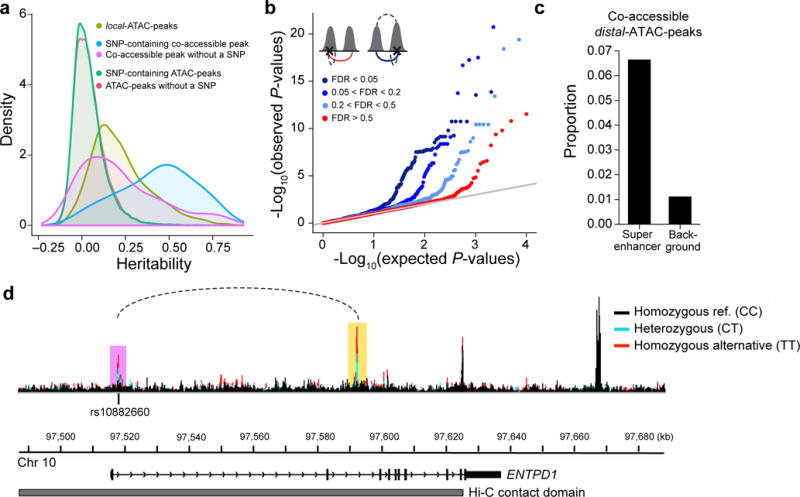
(a) Distribution of the heritability explained by SNPs +/− 500 kb of ATAC-peaks. Local-ATAC-peaks (olive). SNP-containing co-accessible peaks (blue). Co-accessible peaks without a SNP (purple). SNP-containing ATAC-peaks (green). ATAC-peaks without a SNP (red). (b) Q-Q plots of the linear regression P-values of distal-ATAC-peaks that are single peaks (red: co-accessibility FDR > 0.5), or co-accessible peaks called at various significance cutoffs (light blue: 0.2 < FDR < 0.5, medium blue: 0.05 < FDR < 0.2, dark blue: FDR < 0.05). The cartoons (upper left corner) depict the distal-ATAC-QTL association for single peaks (left cartoon; red line is the association plotted) and distal-ATAC-QTL association for co-accessible peaks (right cartoon; blue line is the association plotted; upper dashed line is the co-accessible peak at various significance cutoffs). (c) Proportion of co-accessible distal-ATAC-peaks overlapping super-enhancers or randomly shuffled background. (d) An example of a genetic variant (rs10882660) residing in the first intron in ENTPD1, associated locally (in purple) and distally (in yellow) to ATAC-peaks. The local and distal-ATAC-peaks are co-accessible (dotted line) and reside in a Hi-C contact domain (grey). ATAC-seq profiles were aggregated for individuals of different rs10882660 genotypes (black: homozygous major allele, light blue: heterozygous, red: homozygous minor allele).
Co-accessible peaks and co-accessible distal-ATAC-peaks are both more likely to overlap Thstim super enhancers than randomly shuffled super enhancers41. The effect is stronger in co-accessible distal-ATAC-peaks (6-fold vs. 4-fold) (Fig. 5c). In an example, rs10882660 (NC_000010.10:g.97517949A>G) is simultaneously a local- and distal-ATAC-QTL for a pair of co-accessible peaks residing in the 1st and 2nd introns of ectonucleoside triphosphate diphosphohydrolase I (ENTPD1) and a Hi-C contact domain (Fig. 5d). ENTPD1 encodes a protein that is one of the dominant drivers of hydrolysis of ATP and ADP in Tregs cells, whose expression can lead to tumor growth in mouse models54–57. These results and example suggest a model where local-ATAC-QTLs residing within peaks could also distally affect co-accessible peaks likely reflecting shared genetic effects on pairs of cis-regulatory elements.
Linking variation in chromatin state and gene expression
We hypothesized that variants affecting chromatin accessibility (local-ATAC-QTLs) would – in some cases – also impact the transcription of the genes controlled through these regulatory regions, and thus provide an important link between variant and target.
To test this hypothesis, we assessed if local-ATAC-QTLs are also associated with gene expression in stimulated CD4+ T cells, measured by RNA-seq from 95 donors (92 from an aliquot of the same cells with matching ATAC-seq data). After accounting for covariates and principal components for expression heterogeneity (Supplementary Tables 3, 4), we identified 424 genes significantly associated with at least one of 6,903 local-ATAC-QTLs located +/− 500 kb from the center of each gene (RASQUAL, P-value < 1.65×10⁻³, permutation FDR < 0.05, Fig. 6a, and Supplementary Table 8). The 383 best-associated SNPs are eQTLs, and we term the corresponding 424 genes eGenes (Fig. 2b, right). We estimate that 30% of local-ATAC-QTLs are also eQTLs (with a procedure to estimate the proportion of null hypotheses; Methods), consistent with previous reports in lymphoblastoid cell lines19,21. Considering all genetic variants located +/− 500 kb from the center of each eGene, we found 191/424 genes to be significantly heritable (GCTA FDR < 0.05), with the eQTL explaining on average 68% of the heritability (Fig. 6b and Supplementary Table 9). The lower estimates of explained heritability than local-ATAC-peaks suggests that the genetic control of gene expression may involve more than one SNP and cis-regulatory element in some cases.
Figure 6. Association of chromatin accessibility and gene expression.
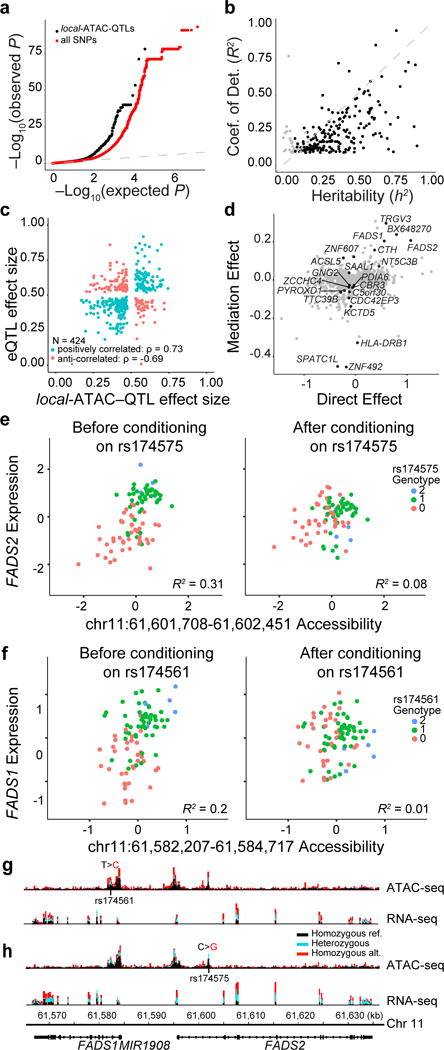
(a) eQTLs. Q-Q plot of associations between local-ATAC-QTLs (black) or all SNPs (red) and expression of genes +/− 500kb. (b) Heritability of gene expression. For each of 191 eGenes, coefficient of determination (R2) of the best associated eQTL (y-axis) vs. heritability (h2) of all variants +/− 500 kb of each gene (x-axis). Black points: significantly heritable peaks (FDR < 0.05). (c) Correlation of effect sizes between local-ATAC-QTLs (x-axis) and eQTLs (y-axis). (d) Mediation of eGenes. Average causal mediation effect estimates (y-axis) and average direct effect estimates (x-axis) for local-ATAC-peaks (mediator) and eGenes (outcome variable) sharing a SNP (instrument variable). FDR < 0.1 local-ATAC-peaks are colored in black. (e,f) Examples of gene expression conditioned on chromatin accessibility. (e) FADS2 expression (y-axis) vs. chromatin accessibility at chr11:61,601,708-61,602,451 (x-axis) before (left) and after (right) conditioning on rs174575. (f) FADS1 expression (y-axis) vs. chromatin accessibility at chr11:61,582,207-61,584,717 (x-axis) before (left) and after (right) conditioning, colored by rs174561 genotypes. (g,h) ATAC-seq (top) and RNA-seq (bottom) profiles were aggregated for individuals of different (g) rs174561 and (h) rs174575 genotypes (black: homozygous major allele, light blue: heterozygous, red: homozygous minor allele).
We next examined the sharing of genetic effects between local-ATAC-peaks and eGenes using a bivariate linear mixed model45 and mediation analysis58. Among the 383 SNPs that are simultaneously associated with chromatin accessibility (as local-ATAC-QTLs) and gene expression (as eQTLs), 286 have effect sizes in the same direction (Spearman ρ = 0.73) indicative of activating effects, while 138 have effect sizes in the opposite direction indicative of repressive effects (Spearman ρ = −0.69) (Fig. 6c). Because of limited sample size, measuring the genetic correlation for individual pairs of local-ATAC-peaks and eGenes is likely under powered. However, the distribution of genetic correlations for 161 pairs of local-ATAC-peaks and eGenes that converged (inverse variance weighted average of 0.66) was significantly higher than both randomly sampled (inverse variance weighted average of 0.23, Kolmogorov-Smirnov P-value < 4.32×10⁻¹⁰) and permuted ATAC-peaks (inverse variance weighted average of 0.07, Kolmogorov-Smirnov P-value < 1.68×10⁻¹⁰) (Supplementary Fig. 18 and Supplementary Table 10). This is corroborated by mediation analysis where the genetic effects on 21/424 eGenes were significantly mediated by the corresponding local-ATAC-peaks (FDR < 0.1, Fig. 6d) and the high correlation of the mediation effects and the inverse variance weighted genetic correlation (Pearson R = 0.52, P-value < 1.2×10⁻¹², Supplementary Fig. 19). For example, consider the locus spanning FADS1 and FADS2, genes that encode two fatty acid desaturases (FADS) that regulate inflammation, promote cancer development, and impact dermal and intestinal ulcerations (in FADS2 knockout mice)59–62. Before conditioning on rs174575 (NC_000011.10:g.61602003C>G), an eQTL for FADS2 and a local-ATAC-QTL for chr11:61,601,708-61,602,451, FADS2 expression and accessibility of ATAC-peak chr11:61,601,708-61,602,451 are correlated (R2 = 0.31, P-value < 8.25×10⁻⁹) and after conditioning there is no longer a correlation (R2 = 0.08, P-value < 6.1×10⁻³) (Fig. 6e). Similarly, after conditioning on rs174561 (NC_000011.10:g.61582708T>C), FADS1 expression is no longer correlated with accessibility of ATAC-peak chr11:61,582,207-61,584,717 (before conditioning: R2 = 0.2, P-value < 8.74×10⁻⁶; after conditioning: R2 = 0.01, P-value < 0.3) (Fig. 6f). Notably, rs174561 is an eQTL for FADS1, a local-ATAC-QTL associated with a pair of co-accessible peaks, and has been previously associated with Crohn’s disease. It is also in LD with rs174537 (NC_000011.10:g.61552680T>G, r2 = 0.82, D’ = 0.99), a SNP previously identified as an eQTL in blood63,64. The associated co-accessible peaks span the promoters of FADS1 and FADS2 (Fig. 6g, h). These results suggest that 30% of the time, genetic variants associated with chromatin accessibility are also associated with gene expression, and in some cases, such as the FADS1 and FADS2 loci previously associated with Crohn’s disease, can be directionally linked through mediation analysis.
Discussion
Although variability in gene expression has been extensively characterized, variability in chromatin state has been challenging to study in primary cells. To this end, we analyzed ATAC-seq profiles in primary CD4+ T cells from five individuals at rest and in response to stimulation. We found global remodeling of accessible chromatin after stimulation, with a significantly higher number of accessible regions overlapping a large proportion (12 - 28%) of SNPs associated with autoimmune diseases and different T cell enhancer subsets (e.g. Tregs, Th17, etc).
Due to these initial observations, we dissected the relationship between genetic variation and variability in chromatin accessibility in a physiologically-relevant system, stimulated CD4+ cells. Variation across 105 individuals highlights four inter-related phenomena. First, accessible regions co-vary across the genome of an individual (co-accessibility), reflective of the 3D structure of the genome. At individual peak resolution, ~2% of ATAC-peaks are co-accessible, especially if they are within the same Hi-C contact domain, and these are more likely to overlap T cell enhancers, pioneering factors, and “pairs” of regulatory regions, including super-enhancers. These results suggest that co-accessibility between pairs of peaks may be determined by the 3D conformation of the genome and may correspond to coordinated regulation of multiple cis-regulatory elements. Second, combining genetic variation with variation in individual peak accessibility, we identified local-ATAC-QTLs. Even though only a minority (5%) of local-ATAC-QTLs directly reside within the core binding sites of TFs, nearly half (45%) are predicted to dramatically disrupt binding at TF binding sites. Moreover, even though local-ATAC-peaks are only 5% of SNP-containing ATAC-peaks, they overlap ~10-30% of the previously reported loci for several common autoimmune diseases and explain 1-7% of the disease heritability. The overwhelming enrichment for autoimmune disease loci among local-ATAC-peaks could be the result of both the increased number of features tracking cell state and the propensity for disease-causing variants to perturb cis-regulatory elements containing key TFs active in specific cell types or states. Third, we found that local-ATAC-QTLs can further act distally on additional peaks in a 1 Mb window, with the strongest effects on ATAC-peaks that are co-accessible, which substantially increase their mechanistic and functional impact. Fourth, considering local-ATAC-QTLs in the context of variation in gene expression (by RNA-seq; 92 overlapping individuals), we estimated that 30% of local-ATAC-QTLs are also eQTLs, with bivariate and mediation analyses suggesting there may be mechanistic directionality between these functional phenotypes.
In a manner consistent with known modes of transcriptional regulation, our approach for a staged analysis, testing the effects of local-ATAC-QTLs on distal-ATAC-peaks and gene expression, allowed us to overcome power limitations from the sample size and the technical and biological variability in the assays to detect hundreds of genes associated with local-ATAC-QTLs. Despite this, there was limited power for bivariate analysis to quantify the shared genetic effects and establish causality for the observed association to both chromatin state and gene expression. These limitations will likely be overcome in future studies with larger sample sizes and higher sequencing depth.
Our findings, derived from large scale genetic association of quantitative chromatin and gene expression traits in primary human cells implicated in many diseases, provide a molecular framework for how disease-causing variants could alter local chromatin structure to modulate gene expression. With the recent advancement of single cell epigenomic65 and transcriptomic66,67,68 profiling, it should be possible to more directly detect context-specific genetic effects in a heterogeneous cell population. Future studies that use other disease-relevant primary cells and tissues will help pinpoint causal disease variants and understand the regulatory mechanism underlying common disease.
Materials and Methods
Study subjects and genotyping
Healthy subjects between the ages of 18 to 56 (avg. 29.9) enrolled in the PhenoGenetic study8 were recruited from the Greater Boston Area and gave written informed consent for the studies. Individuals were excluded if they had a history of inflammatory disease, autoimmune disease, chronic metabolic disorders or chronic infectious disorders. Genotyping using the Illumina Infinium Human OmniExpress Exome BeadChips (704,808 SNPs are common variants [MAF > 0.01] and 246,229 are part of the exomes; Illumina Inc., San Diego, CA) has been previously described18. The genotyping success rate was at least 97%. We applied rigorous subject and SNP quality control (QC) that includes: (1) gender misidentification; (2) subject relatedness; (3) Hardy-Weinberg Equilibrium testing; (4) use concordance to infer SNP quality; (5) genotype call rate; (6) heterozygosity outlier; and (7) mismatch detection using SNP overlapping reads from ATAC-seq and RNA-seq. We excluded 1,987 SNPs with a call rate < 95%, 459 SNPs with Hardy-Weinberg equilibrium P-value < 10−6, and 63,781 SNPs with MAF < 1% from the 704,808 common SNPs (a total of 66,461 SNPs excluded). Principal component analysis of genotypes from all individuals used in the study are shown in Supplementary Figure S6.
We used the IMPUTE2 software (version: 2.3.2) to impute the post-QC genotyped markers from the entire ImmVar cohort (N = 688) using reference haplotype panels from the 1000 Genomes Project (The 1000 Genomes Project Consortium Phase III) that contain a total of 37.9 Million SNPs in 2,504 individuals with ancestries from West Africa, East Asia, and Europe. After genotype imputation, we extracted the genotypes for 105 individuals assayed for chromatin accessibility and gene expression. Additional removal of SNPs with MAF < 0.05 in our cohort resulted in 4,558,693 and 4,421,936 common variants tested for chromatin accessibility and gene expression assays, respectively.
Preparation and activation of primary human CD4+ T cells
CD4+ T cells were isolated and stimulated as previously described10. Briefly, CD4+ T cells were isolated from whole blood by negative selection using RosetteSep human CD4+ T cell enrichment cocktail (STEMCELL Technologies Inc., Vancouver, BC) and RosetteSep density medium gradient centrifugation. Isolated CD4+ T cells were placed in freezing container at −80°C for overnight, and then moved into a liquid nitrogen tank for long-term storage. On the day of activation, CD4+ T cells were thawed in a 37°C water bath, counted and resuspended in RPMI-1640 supplemented with 10% FCS, and plated at 50,000 cells per well in a 96 well round-bottom plate. Cells were either left untreated or stimulated with beads conjugated with anti-CD3 and anti-CD28 antibodies (Dynabeads, Invitrogen #11131D, Life Technologies) at a cell:bead ratio of 1:1 for 48 hours, a time point we previously found to maximize the gene expression response in CD4+ T cells. At each time point, cells were further purified by a second step positive selection with CD4+ Dynabeads (Invitrogen #11145D, Life Technologies).
ATAC-seq profiling
ATAC-seq profiles were collected for 139 individuals (Supplementary Table 4). We performed ATAC-seq as previously described32, with a modification in the lysis buffer to reduce mitochondrial DNA contamination. 200,000 purified CD4+ T cells were lysed with cold lysis buffer (10 mM Tris-HCl, pH 7.4, 10 mM NaCl, 3 mM MgCl2 and 0.03% tween20). Immediately after lysis, nuclei were spun at 500g for 8 minutes at 4°C. After pelleting the nuclei, we carefully removed the supernatant and resuspended the nuclei with Tn5 transposase reaction mix (25 ul 2X TD buffer, 2.5 ul Tn5 transposase, and 22.5 ul nuclease-free water) (Illumina Inc). The transposition reaction was performed at 37°C for 30 minutes. Immediately after the transposition reaction, DNA was purified using a Qiagen MinElute kit. Libraries were sequenced on an Illumina HiSeq 2500 sequencer to an average read depth of 42 million (+/− 38 million) per sample (Supplementary Fig. S2), with low mtDNA contamination (0.30 – 5.39%, 1.96% on average), low rates of multiply mapped reads (6.7 – 56%, 19% on average) and a relatively high percentage of usable nuclear reads (60 – 92%, 79% on average).
RNA-seq profiling
RNA-seq profiles were collected for 95 individuals, of which 92 have matching ATAC-seq profiles (Supplementary Table 4). RNA was isolated using Qiagen RNeasy Plus Mini Kit and RNA integrity was quantified by Agilent RNA 6000 Nano Kit using the Agilent Bioanalyzer. Purified RNA were converted to RNA-seq libraries using a previously published protocol69, where reverse transcription was carried out based on the SMART template switching method and the resulting cDNA was further tagmented and PCR amplified using Nextera XT DNA Sample kit (Illumina) to add the Illumina sequencing adaptors. Samples were sequenced on Illumina HiSeq 2500 to an average depth of 16.9 million reads per sample (+/− 8.7 million).
In situ Hi-C
CD4+ T cells were isolated from commercially available fresh blood of healthy individuals (Research Blood Components). CD4+ T cells were stimulated for 48 hours with beads conjugated with anti-CD3 and anti-CD28 antibodies. In situ Hi-C was performed on the pool of donors as previously described40. Cells were crosslinked with 1% formaldehyde for 10 min at room temperature. After nuclei permeabilization, DNA was digested with MboI and digested fragments were labeled using biotinylated d-ATP and ligated. After reverse crosslinking, ligated DNA was purified and sheared to ~400 bp. Biotin labeled DNA fragments were then pulled down with streptavidin beads and prepped for Illumina sequencing40. The final libraries were sequenced using Illumina HiSeq and NextSeq to produce ~3.5 billion 100bp paired-end reads.
Alignment of ATAC-seq reads
25bp ATAC-seq reads were aligned to the human genome assembly (hg19) with the Burrows-Wheeler Aligner-MEM (version: 0.7.12)70. For each sample, multiply-mapped reads were filtered using Samtools “view”71 with option “-F 4” and mitochondrial reads were filtered out using BEDtools (function intersectBed)72. After filtering, we had a median of 37 million (MAD +/− 13 million) reads per sample.
ATAC-seq peak identification
Filtered ATAC-seq reads from six matched samples (five individuals, of which one individual was repeated) for Th and Thstim cells were merged (separately for Th and Thstim cells) using the Samtools function “merge”71. Peaks were called on the respective Th and Thstim merged bam files using MACS2 –callpeak (with parameters: –nomodel, –extsize 200, and –shift 100), resulting in 36,486 Th peaks with an average width of 520 bp (+/− 319 bp) and 52,154 Thstim peaks with an average width of 483 bp (+/− 344 bp) (Benjamini-Hochberg FDR < 0.05)73. The Th and Thstim peaks were further merged (using the BEDtools “merge” function), to a total of 63,763 jointly called peaks. BEDtools “coverage”72 was used to create a 63,763 (peaks) x 12 (6 samples by 2 conditions) input matrix used for detecting differentially accessible peaks. Differentially accessible peaks between Th and Thstim cells were identified using the DESeq2 R package (version 3.2)74, with 8,298 Th-specific peaks (FDR < 0.05, more accessibility in Th cells), 28,017 Thstim-specific peaks (FDR < 0.05, more accessibility in Thstim), and 27,446 shared peaks (FDR > 0.05).
For the co-accessibility and genetic analyses, 4.2 billion filtered ATAC-seq reads from 105 Thstim samples were merged to call 167,140 peaks (FDR < 0.05) using the same parameters as previously described, at an average peak size of 642 bp (+/− 512 bp). Coverage for each peak over all 105 samples was computed.
Percentage of peaks overlapping transcription factor binding motifs
Percentages of MACS2 called peaks overlapping TF binding motifs were computed using the default setting in the Homer suite75 function findMotifsGenome.pl (with genome reference hg19, option –size given). For co-accessible peaks and local-ATAC-peaks, background overlap percentages were computed using randomly sampled genomic regions preserving the width of each peak to assess the expected TF motif enrichment.
Transcription factor footprinting
Using the Homer suite tool annotatePeaks75, and options –m and –mbed, we found all instances of BATF, ISRE, BATF/IRF, ETS1, and CTCF motifs in shared, Th-specific and Thstim-specific peaks. Next, we determined the per-base coverage +/− 1 kb around the center of the motif using BEDtools “coverage”, only counting reads that begin at a given location in order to prevent smoothing of the chromatin accessibility signal, and splitting the reads into those that map to the same or opposite strand as the motif to account for biases in ATAC-seq requiring two transposases (i.e. one at a TF binding site and another at a nucleosome accessible region). For each TF footprint, we generated a matrix with the number of rows equal to the number of instances of the motif by 4,000 columns quantifying coverage: +/− 1kb from the same and opposite strand and as the motif. Final TF footprints were derived from median normalized reads.
Outlier analysis and sample mix-up analysis
ATAC-seq samples were further filter if the samples contained a minimum of 8 million QC-passed reads (median of 37 million, MAD +/−13 million) and were highly correlated with other samples (mean Pearson R > 0.68). ATAC-seq and RNA-seq profiles from the 105 individuals were further filtered to identify sample mix-ups. We used the software VerifyBamID76 to match each ATAC-seq and RNA-seq sample with the genotyping profile with the highest fIBD score. Samples with designated labels not matching the VerifyBamID predicted genotyping labels were flagged as sample mix-ups. We switched the designated label to the predicted label for cases where the fIBD > 90%. 15 out of the 139 total ATAC-seq samples were re-labeled and four out of the 110 total RNA-seq samples were re-labeled. For the ATAC-seq samples: 18 do not have genotypes, three are outliers, one did not match anyone. For the 110 RNA-seq samples: eight samples do not have genotypes, five are outliers, one did not match anyone. 111 ATAC-seq samples and 96 RNA-seq samples were used in the final analysis after filtering. In the response to activation study, there were five people total, 1 person was repeated for a total of six samples, none were genotyped.
Genetic association analysis of ATAC-peaks
Genetic association analysis was performed on 105 samples of European descent (Supplementary Fig. S6) by running RASQUAL43 on the 167,140 peaks identified in Thstim cells and 4,558,693 imputed genetic variants, testing variants within a 1 Mb window of each ATAC-peak, and filtering for a minor allele frequency of greater than 5% using uniquely mapped nuclear reads per individual. Sex and ten principal components (Supplementary Table 4) were included as covariates to minimize the effects of confounding factors. Using the RASQUAL “-r” option, 10 permutations were generated for each ATAC-peak. For local-ATAC-peak analysis, association statistics for 158,613 peak-SNP pairs where the SNP resides within the peak are compared. For distal-ATAC-peak analysis, association statistics for peak-SNP pairs where the SNP does not reside within the peak are compared. In each case, empirical P-values and the corresponding false discovery rates were computed using the R qvalue44 package to detect a total of 3,318 local -ATAC-peaks (FDR < 0.05) and 382 distal-ATAC-peaks (FDR < 0.05).
Hi-C data analysis
The sequenced reads were analyzed using the Juicer pipeline77. We sequenced 2,940,433,604 Hi-C read pairs in stimulated T cells. Loci were assigned to A and B compartments at 500 kB resolution. Contact domains were annotated using the Arrowhead algorithm with default Juicer parameters at 5kB for stimulated T cells. This yielded a list of 4,008 domains in stimulated T cells at MAPQ > 30. We also ran Arrowhead with these same respective parameters on MAPQ > 0 Hi-C maps, which yielded a list of 4,419 domains in stimulated T cells. The Hi-C maps and feature annotations were visualized using the Juicebox software77.
Determination of distance from ATAC-peak to contact domains
We determined the distance from each SNP-containing ATAC-peak to the middle of the closest contact domain. We analyzed the following features: (1) all SNP-containing ATAC-peaks; (2) local-ATAC-peaks; and all SNP-containing ATAC-peaks and local-ATAC-peaks containing (3) BATF, (4) ETS1, or (5) CTCF motifs. Homer annotatePeaks ‘–mbed’75 option was used to identify SNP-containing ATAC-peaks and local-ATAC-peaks that contain BATF, ETS1, and CTCF motifs, as previously described. We normalized the distances from each peak to the closest domain by the length of the domain. In order to determine that the distribution of the distance between a given peak and a contact domain is different than the null distribution, we kept the length of each contact domain constant and shuffled the positions of the contact domain. The distances from each peak to the contact domain were binned into 30 bins and divided by the binned distances between a given peak and the shuffled contact domains to determine enrichment at each position.
Co-accessible peak analysis
To identify co-accessible peaks, we computed the correlation between every pair of 167,140 ATAC-peaks within 1.5 Mb of each other using a linear regression model implemented by Matrix eQTL78. We first normalized the ATAC-peaks by (1) removing sequencing depth bias using median normalization, (2) standardizing the matrix by subtracting out the mean and dividing by the standard deviation for each peak; and (3) quantile normalizing the matrix79. Adjusting for sex and 15 principal components, we used Matrix eQTL to identify 2,158 pairs of co-accessible peaks (1,809 unique ATAC-peaks, FDR < 0.05). We reran the analysis using 10 permuted datasets generated by shuffling the peak counts for an individual to obtain a distribution of permuted P-values. The qvalue package was used to obtain empirical P-values and false discovery rates44.
RNA-seq analysis
25bp paired end RNA-seq reads were aligned to the hg19 using UCSC transcriptome annotations. Expression levels (expected counts) were determined using RSEM79. We applied trimmed mean of M-values normalization method (TMM) to the expected counts using the edgeR package and kept genes that had TMM count > 1 in at least 75% of the samples. For the mapping of eQTLs, we inputted expected counts for filtered genes into RASQUAL43. For the heritability analyses, we used log-transformed TMM counts of filtered genes in order to fit linear mixed models.
Percentage of GWAS loci overlapping
The GREGOR suite63 was used for calculating the percentage of GWAS loci in features of interest: (1) peaks differentially accessible in Th and Thstim cells, (2) co-accessible peaks, (3) SNP-containing peaks, and (4) local-ATAC-peaks. GWAS loci in the National Human Genome Research Institute GWAS catalogue as of November 2016 were overlapped. For local-ATAC-peaks, peaks were randomly permuted, while retaining the width of each peak to assess the expected GWAS enrichment.
Partitioned heritability analysis
Partitioned heritability analysis was performed using LD Score80. Summary statics for all SNPs for 28 GWAS (Alzheimer, anorexia, autism, bipolar disorder, BMI, celiac, coronary artery disease, crohn’s disease, DS, ever smoked fasting glucose, HDL, IBD, LDL, lupus, multiple sclerosis, neuroticism, primary biliary cirrhosis, rheumatoid arthritis, schizophrenia, SWB, triglycerides, type 1 diabetes, type 2 diabetes, ulcerative colitis, years of education 1, and years of education 2) phenotypes were downloaded from the Broad Institute (see URLs). Local-ATAC-QTLs were thresholded at FDR < 0.05, FDR < 0.1, FDR < 0.2, FDR < 0.5, and all tested SNPs. Using SNPs at each FDR threshold, annotation files and LD Scores were estimated for all 28 GWAS phenotypes using ‘ldsc.py –l2′. Finally, to calculate the partitioned heritability across each phenotype, including our local-ATAC-QTLs at each FDR threshold, respectively, ‘ldsc.py –h2′ was run.
Percentage overlapping T cell annotations
Using the Homer suite annotatePeaks.pl with the –genomeOntology option75, we calculated how many of the Thstim-specific peaks, co-accessible peaks, SNP-containing peaks, and local-ATAC-peaks fall T cell enhancers18. For co-accessible peaks, SNP-containing peaks, and local-ATAC-peaks peak subsets, background overlap was calculated using randomly sampled genomic regions preserving the width of each peak to assess the expected T cell enrichment.
Proportion in super-enhancer regions
Using the BEDtools “intersect” function, we calculated how many of the co-accessible peaks and co-accessible local-ATAC-peaks are also in stimulated Th super-enhancers (as reported in Hinsz et al.41). Background proportions were computed using randomly sampled genomic regions preserving the length of each super enhancer.
Proportion co-accessible peaks in known regulatory elements
Using the BEDtools “intersect” function72, we annotated each peak in our unique pairs of co-accessible peaks as residing in a known Thstim super enhancer (as reported in Hinsz et al.41), promoter (as reported in Fahr et al.18), and T cell promoter (as reported in Fahr et al.18). We determined if each peak in a pair of peaks resided in a promoter and a promoter, promoter and a super enhancer, a promoter and an enhancer, an enhancer and an enhancer, an enhancer and a super enhancer, and a super enhancer and a super enhancer. As background (‘non co-accessible peak’), we used pairs of ATAC-peaks with P-value > 0.9, sampled to the same number as co-accessible peaks, and performed the same analysis.
Gkm-SVM and deltaSVM
We ran gkm-SVM46,47 on 24,745 300bp ATAC-peaks centered on MACS summits using default parameters and an equal size GC matched negative set, excluding from training any region containing a SNP to be scored by deltaSVM, and repeated with 5 independent negative sets, and averaged the deltaSVM predictions, as previously described48. We then calculated deltaSVM for each SNP in a local-ATAC-peak, scoring 903 SNPs in 888 loci. We find a Pearson correlation of R=0.627 between ATAC-QTL beta and the largest deltaSVM SNP. 777 of the peak P-value SNPs had the largest deltaSVM, but 111 flanking SNPs scored more highly than the peak P-value SNP and disrupt immune associated TF binding sites. While the gkm-SVM weights fully specify the deltaSVM score, for interpretation we associated the large gkm-SVM weights with the most similar TF PWM from a catalog of JASPAR, Transfac, Uniprobe, and Homer motifs.
Heritability of gene expression and ATAC-peaks
For the univariate analyses, restricted maximum likelihood heritability (h2) estimates were calculated using GCTA software45 with algorithm 1 and no constraints on heritability (i.e., h2 can be less than 0), while the bivariate analysis was run constrained. For the gene expression heritability analysis, where gene expression was residualized for 12 principal components and sex, and ATAC-peak heritability analysis, where ATAC-peaks were residualized for 10 principal components and sex, we used genotypes +/− 500 kb from the transcription start site of the gene and center of each ATAC-peak, respectively. Of the 64,188 SNP-containing ATAC-peaks and 3,318 local-ATAC-peaks, 32,317 and 2,444 converged respectively. The bivariate GCTA analysis used genotypes +/− 500kb from the transcription start site of the gene. Randomly sampled ATAC-peaks (non local-ATAC-peaks) and permuted ATAC-peaks were plotted as background at the same number of the tested local-ATAC-peaks (N=161, standard errors < 1).
Mediation of eGenes by local-ATAC-peaks
Pairs of local-ATAC-peak and eGenes were matched through their shared eQTL. Our normalized ATAC-peak matrix, as previously described (Methods), was further adjusted for gender and 10 principal components was used as input local-ATAC-peaks. Normalized gene expression matrix, as previously described (Methods), was further adjusted for gender and 12 principal components used as input as input for our eGenes. For each eQTL a 92 x three matrix was formatted. Each row in the matrix corresponded to an individual and each column corresponded to (1) eQTL genotype, (2) normalized local-ATAC-peak, and (3) normalized eGene. First, we regressed local-ATAC-peak ~ eQTL. Second, we regressed eGene ~ eQTL + local-ATAC-peak. To test for statistically significant mediation effects, the mediator package58 ‘mediate’ function was called using both regression models as input.
Conditioning on eQTL
For each eQTL, the 92 x three matrix that was previously described (Methods) was used as input. To capture the effects of the eQTL, we regressed the eGene ~ local-ATAC-peak. To capture the effects after conditioning on the eQTL, we regressed the residuals of eGene ~ eQTL to the local-ATAC-peak.
Supplementary Material
Acknowledgments
We thank the ImmVar participants. We would like to thank Jason Buenrostro for critical reading of the manuscript and advice on ATAC-seq analysis, Jenna Pfiffner and Charles Fulco for initial experimental help with ATAC-seq, Alicia Schep for ATAC-seq nucleosome free caller, Natasha Asinovski and Ho-keun Kwon for help setting up primary T cell cultures and members of the Regev and Ye laboratories for discussions. R.E.G. and C.J.Y. are supported by NIH R01-AR071522 to C.J.Y. M.B. and K.L.H. are supported by NIH HG007348 to M.B., H.Y.C. is supported by NIH grant P50-HG007735, C.S.C is supported by the NIH through a Ruth L. Kirschstein National Research Service Award (F32-DK096822). This work was supported by the Klarman Cell Observatory at the Broad Institute. A.R. is a Howard Hughes Medical Institute Investigator.
Data availability: Raw data are deposited to the Gene Expression Omnibus with accession no. GSE86888.
Footnotes
URLs: Partitioned heritability summary statistics, https://data.broadinstitute.org/alkesgroup/sumstats_formatted/.
Author Contributions: A.R., C.J.Y. and C.S.C. conceived this project. C.S.C. and A.S. performed ATAC-seq and RNA-seq assays. I.W. cultured T cells and collected fixed pellet for HiC assay. A.P.A., I.M., M.Sh., S.H., N.C.D., and E.L.A. performed and analyzed the Hi-C dataset. R.E.G., M.T., D.L., M.G.G., and M.Su analyzed the ATAC-seq and RNA-seq datasets. K.L.H and M.A.B. additionally analyzed the ATAC-seq dataset. R.E.G. additionally analyzed the Hi-C dataset. T.F, P.L.D.J, and C.B. provided the patient samples. H.Y.C provided helpful comments and discussion. R.E.G., C.S.C., C.J.Y., and A.R. wrote the manuscript.
Competing Interest: A.R. is an SAB member of ThermoFisher Scientific, Syros Pharmaceuticals and Driver group and a founder of Celsius Therapeutics.
References
- 1.McCarthy MI, et al. Genome-wide association studies for complex traits: consensus, uncertainty and challenges. Nat Rev Genet. 2008;9:356–69. doi: 10.1038/nrg2344. [DOI] [PubMed] [Google Scholar]
- 2.Visscher PM, Brown MA, McCarthy MI, Yang J. Five years of GWAS discovery. Am J Hum Genet. 2012;90:7–24. doi: 10.1016/j.ajhg.2011.11.029. [DOI] [PMC free article] [PubMed] [Google Scholar]
- 3.Hirschhorn JN, Daly MJ. Genome-wide association studies for common diseases and complex traits. Nat Rev Genet. 2005;6:95–108. doi: 10.1038/nrg1521. [DOI] [PubMed] [Google Scholar]
- 4.Maurano MT, et al. Systematic localization of common disease-associated variation in regulatory DNA. Science. 2012;337:1190–5. doi: 10.1126/science.1222794. [DOI] [PMC free article] [PubMed] [Google Scholar]
- 5.Stranger BE, et al. Population genomics of human gene expression. Nat Genet. 2007;39:1217–24. doi: 10.1038/ng2142. [DOI] [PMC free article] [PubMed] [Google Scholar]
- 6.Lappalainen T, et al. Transcriptome and genome sequencing uncovers functional variation in humans. Nature. 2013;501:506–11. doi: 10.1038/nature12531. [DOI] [PMC free article] [PubMed] [Google Scholar]
- 7.Battle A, et al. Characterizing the genetic basis of transcriptome diversity through RNA-sequencing of 922 individuals. Genome Res. 2014;24:14–24. doi: 10.1101/gr.155192.113. [DOI] [PMC free article] [PubMed] [Google Scholar]
- 8.Raj T, et al. Polarization of the effects of autoimmune and neurodegenerative risk alleles in leukocytes. Science. 2014;344:519–23. doi: 10.1126/science.1249547. [DOI] [PMC free article] [PubMed] [Google Scholar]
- 9.Lee MN, et al. Common genetic variants modulate pathogen-sensing responses in human dendritic cells. Science. 2014;343:1246980. doi: 10.1126/science.1246980. [DOI] [PMC free article] [PubMed] [Google Scholar]
- 10.Ye CJ, et al. Intersection of population variation and autoimmunity genetics in human T cell activation. Science. 2014;345:1254665. doi: 10.1126/science.1254665. [DOI] [PMC free article] [PubMed] [Google Scholar]
- 11.Astle WJ, et al. The Allelic Landscape of Human Blood Cell Trait Variation and Links to Common Complex Disease. Cell. 2016;167:1415–1429 e19. doi: 10.1016/j.cell.2016.10.042. [DOI] [PMC free article] [PubMed] [Google Scholar]
- 12.Chen L, et al. Genetic Drivers of Epigenetic and Transcriptional Variation in Human Immune Cells. Cell. 2016;167:1398–1414 e24. doi: 10.1016/j.cell.2016.10.026. [DOI] [PMC free article] [PubMed] [Google Scholar]
- 13.Consortium, E.P. An integrated encyclopedia of DNA elements in the human genome. Nature. 2012;489:57–74. doi: 10.1038/nature11247. [DOI] [PMC free article] [PubMed] [Google Scholar]
- 14.Gerstein MB, et al. Architecture of the human regulatory network derived from ENCODE data. Nature. 2012;489:91–100. doi: 10.1038/nature11245. [DOI] [PMC free article] [PubMed] [Google Scholar]
- 15.Neph S, et al. An expansive human regulatory lexicon encoded in transcription factor footprints. Nature. 2012;489:83–90. doi: 10.1038/nature11212. [DOI] [PMC free article] [PubMed] [Google Scholar]
- 16.Thurman RE, et al. The accessible chromatin landscape of the human genome. Nature. 2012;489:75–82. doi: 10.1038/nature11232. [DOI] [PMC free article] [PubMed] [Google Scholar]
- 17.Roadmap Epigenomics C, et al. Integrative analysis of 111 reference human epigenomes. Nature. 2015;518:317–30. doi: 10.1038/nature14248. [DOI] [PMC free article] [PubMed] [Google Scholar]
- 18.Farh KK, et al. Genetic and epigenetic fine mapping of causal autoimmune disease variants. Nature. 2015;518:337–43. doi: 10.1038/nature13835. [DOI] [PMC free article] [PubMed] [Google Scholar]
- 19.Degner JF, et al. DNase I sensitivity QTLs are a major determinant of human expression variation. Nature. 2012;482:390–4. doi: 10.1038/nature10808. [DOI] [PMC free article] [PubMed] [Google Scholar]
- 20.Kasowski M, et al. Extensive variation in chromatin states across humans. Science. 2013;342:750–2. doi: 10.1126/science.1242510. [DOI] [PMC free article] [PubMed] [Google Scholar]
- 21.McVicker G, et al. Identification of genetic variants that affect histone modifications in human cells. Science. 2013;342:747–9. doi: 10.1126/science.1242429. [DOI] [PMC free article] [PubMed] [Google Scholar]
- 22.Kilpinen H, et al. Coordinated effects of sequence variation on DNA binding, chromatin structure, and transcription. Science. 2013;342:744–7. doi: 10.1126/science.1242463. [DOI] [PMC free article] [PubMed] [Google Scholar]
- 23.Waszak SM, et al. Population Variation and Genetic Control of Modular Chromatin Architecture in Humans. Cell. 2015;162:1039–50. doi: 10.1016/j.cell.2015.08.001. [DOI] [PubMed] [Google Scholar]
- 24.Elinav E, et al. Inflammation-induced cancer: crosstalk between tumours, immune cells and microorganisms. Nat Rev Cancer. 2013;13:759–71. doi: 10.1038/nrc3611. [DOI] [PubMed] [Google Scholar]
- 25.Donath MY, Shoelson SE. Type 2 diabetes as an inflammatory disease. Nat Rev Immunol. 2011;11:98–107. doi: 10.1038/nri2925. [DOI] [PubMed] [Google Scholar]
- 26.Ohashi PS. T-cell signalling and autoimmunity: molecular mechanisms of disease. Nat Rev Immunol. 2002;2:427–38. doi: 10.1038/nri822. [DOI] [PubMed] [Google Scholar]
- 27.Kronenberg M, Rudensky A. Regulation of immunity by self-reactive T cells. Nature. 2005;435:598–604. doi: 10.1038/nature03725. [DOI] [PubMed] [Google Scholar]
- 28.Speiser DE, Ho PC, Verdeil G. Regulatory circuits of T cell function in cancer. Nat Rev Immunol. 2016;16:599–611. doi: 10.1038/nri.2016.80. [DOI] [PubMed] [Google Scholar]
- 29.Restifo NP, Dudley ME, Rosenberg SA. Adoptive immunotherapy for cancer: harnessing the T cell response. Nat Rev Immunol. 2012;12:269–81. doi: 10.1038/nri3191. [DOI] [PMC free article] [PubMed] [Google Scholar]
- 30.Belkaid Y, Rouse BT. Natural regulatory T cells in infectious disease. Nat Immunol. 2005;6:353–60. doi: 10.1038/ni1181. [DOI] [PubMed] [Google Scholar]
- 31.Feuerer M, Hill JA, Mathis D, Benoist C. Foxp3+ regulatory T cells: differentiation, specification, subphenotypes. Nat Immunol. 2009;10:689–95. doi: 10.1038/ni.1760. [DOI] [PubMed] [Google Scholar]
- 32.Buenrostro JD, Giresi PG, Zaba LC, Chang HY, Greenleaf WJ. Transposition of native chromatin for fast and sensitive epigenomic profiling of open chromatin, DNA-binding proteins and nucleosome position. Nat Methods. 2013;10:1213–8. doi: 10.1038/nmeth.2688. [DOI] [PMC free article] [PubMed] [Google Scholar]
- 33.Kurachi M, et al. The transcription factor BATF operates as an essential differentiation checkpoint in early effector CD8+ T cells. Nat Immunol. 2014;15:373–83. doi: 10.1038/ni.2834. [DOI] [PMC free article] [PubMed] [Google Scholar]
- 34.Li P, et al. BATF-JUN is critical for IRF4-mediated transcription in T cells. Nature. 2012;490:543–6. doi: 10.1038/nature11530. [DOI] [PMC free article] [PubMed] [Google Scholar]
- 35.Murphy TL, Tussiwand R, Murphy KM. Specificity through cooperation: BATF-IRF interactions control immune-regulatory networks. Nat Rev Immunol. 2013;13:499–509. doi: 10.1038/nri3470. [DOI] [PubMed] [Google Scholar]
- 36.Cauchy P, et al. Dynamic recruitment of Ets1 to both nucleosome-occupied and -depleted enhancer regions mediates a transcriptional program switch during early T-cell differentiation. Nucleic Acids Res. 2016;44:3567–85. doi: 10.1093/nar/gkv1475. [DOI] [PMC free article] [PubMed] [Google Scholar]
- 37.Samstein RM, et al. Foxp3 exploits a pre-existent enhancer landscape for regulatory T cell lineage specification. Cell. 2012;151:153–66. doi: 10.1016/j.cell.2012.06.053. [DOI] [PMC free article] [PubMed] [Google Scholar]
- 38.Hollenhorst PC, et al. DNA specificity determinants associate with distinct transcription factor functions. PLoS Genet. 2009;5:e1000778. doi: 10.1371/journal.pgen.1000778. [DOI] [PMC free article] [PubMed] [Google Scholar]
- 39.Chen X, et al. ATAC-see reveals the accessible genome by transposase-mediated imaging and sequencing. Nat Methods. 2016;13:1013–1020. doi: 10.1038/nmeth.4031. [DOI] [PMC free article] [PubMed] [Google Scholar]
- 40.Rao SS, et al. A 3D map of the human genome at kilobase resolution reveals principles of chromatin looping. Cell. 2014;159:1665–80. doi: 10.1016/j.cell.2014.11.021. [DOI] [PMC free article] [PubMed] [Google Scholar]
- 41.Hnisz D, et al. Super-enhancers in the control of cell identity and disease. Cell. 2013;155:934–47. doi: 10.1016/j.cell.2013.09.053. [DOI] [PMC free article] [PubMed] [Google Scholar]
- 42.Whyte WA, et al. Master transcription factors and mediator establish super-enhancers at key cell identity genes. Cell. 2013;153:307–19. doi: 10.1016/j.cell.2013.03.035. [DOI] [PMC free article] [PubMed] [Google Scholar]
- 43.Kumasaka N, Knights AJ, Gaffney DJ. Fine-mapping cellular QTLs with RASQUAL and ATAC-seq. Nat Genet. 2016;48:206–13. doi: 10.1038/ng.3467. [DOI] [PMC free article] [PubMed] [Google Scholar]
- 44.Storey JD, Tibshirani R. Statistical significance for genomewide studies. Proc Natl Acad Sci U S A. 2003;100:9440–5. doi: 10.1073/pnas.1530509100. [DOI] [PMC free article] [PubMed] [Google Scholar]
- 45.Yang J, Lee SH, Goddard ME, Visscher PM. GCTA: a tool for genome-wide complex trait analysis. Am J Hum Genet. 2011;88:76–82. doi: 10.1016/j.ajhg.2010.11.011. [DOI] [PMC free article] [PubMed] [Google Scholar]
- 46.Ghandi M, Lee D, Mohammad-Noori M, Beer MA. Enhanced regulatory sequence prediction using gapped k-mer features. PLoS Comput Biol. 2014;10:e1003711. doi: 10.1371/journal.pcbi.1003711. [DOI] [PMC free article] [PubMed] [Google Scholar]
- 47.Ghandi M, M-N M, Ghareghani N, Lee D, Garraway L, Beer MA. gkmSVM, an R package for gapped-kmer SVM. Bioinformatics. 2016 Apr;19 doi: 10.1093/bioinformatics/btw203. [DOI] [PMC free article] [PubMed] [Google Scholar]
- 48.Lee D, et al. A method to predict the impact of regulatory variants from DNA sequence. Nat Genet. 2015;47:955–61. doi: 10.1038/ng.3331. [DOI] [PMC free article] [PubMed] [Google Scholar]
- 49.Hou C, Zhao H, Tanimoto K, Dean A. CTCF-dependent enhancer-blocking by alternative chromatin loop formation. Proc Natl Acad Sci U S A. 2008;105:20398–403. doi: 10.1073/pnas.0808506106. [DOI] [PMC free article] [PubMed] [Google Scholar]
- 50.Phillips JE, Corces VG. CTCF: master weaver of the genome. Cell. 2009;137:1194–211. doi: 10.1016/j.cell.2009.06.001. [DOI] [PMC free article] [PubMed] [Google Scholar]
- 51.Splinter E, et al. CTCF mediates long-range chromatin looping and local histone modification in the beta-globin locus. Genes Dev. 2006;20:2349–54. doi: 10.1101/gad.399506. [DOI] [PMC free article] [PubMed] [Google Scholar]
- 52.Franke A, et al. Genome-wide meta-analysis increases to 71 the number of confirmed Crohn’s disease susceptibility loci. Nat Genet. 2010;42:1118–25. doi: 10.1038/ng.717. [DOI] [PMC free article] [PubMed] [Google Scholar]
- 53.Delisle JS, et al. The TGF-beta-Smad3 pathway inhibits CD28-dependent cell growth and proliferation of CD4 T cells. Genes Immun. 2013;14:115–26. doi: 10.1038/gene.2012.63. [DOI] [PubMed] [Google Scholar]
- 54.Enjyoji K, et al. Targeted disruption of cd39/ATP diphosphohydrolase results in disordered hemostasis and thromboregulation. Nat Med. 1999;5:1010–7. doi: 10.1038/12447. [DOI] [PubMed] [Google Scholar]
- 55.Deaglio S, et al. Adenosine generation catalyzed by CD39 and CD73 expressed on regulatory T cells mediates immune suppression. J Exp Med. 2007;204:1257–65. doi: 10.1084/jem.20062512. [DOI] [PMC free article] [PubMed] [Google Scholar]
- 56.Plesner L. Ecto-ATPases: identities and functions. Int Rev Cytol. 1995;158:141–214. doi: 10.1016/s0074-7696(08)62487-0. [DOI] [PubMed] [Google Scholar]
- 57.Sun X, et al. CD39/ENTPD1 expression by CD4+Foxp3+ regulatory T cells promotes hepatic metastatic tumor growth in mice. Gastroenterology. 2010;139:1030–40. doi: 10.1053/j.gastro.2010.05.007. [DOI] [PMC free article] [PubMed] [Google Scholar]
- 58.Hicks R, Tingley D. Causal Mediation Analysis. Stata Journal. 2011;4 [Google Scholar]
- 59.Fan YY, et al. Characterization of an arachidonic acid-deficient (Fads1 knockout) mouse model. J Lipid Res. 2012;53:1287–95. doi: 10.1194/jlr.M024216. [DOI] [PMC free article] [PubMed] [Google Scholar]
- 60.Barrie A, et al. Prostaglandin E2 and IL-23 plus IL-1beta differentially regulate the Th1/Th17 immune response of human CD161(+) CD4(+) memory T cells. Clin Transl Sci. 2011;4:268–73. doi: 10.1111/j.1752-8062.2011.00300.x. [DOI] [PMC free article] [PubMed] [Google Scholar]
- 61.Sakata D, Yao C, Narumiya S. Prostaglandin E2, an immunoactivator. J Pharmacol Sci. 2010;112:1–5. doi: 10.1254/jphs.09r03cp. [DOI] [PubMed] [Google Scholar]
- 62.Stroud CK, et al. Disruption of FADS2 gene in mice impairs male reproduction and causes dermal and intestinal ulceration. J Lipid Res. 2009;50:1870–80. doi: 10.1194/jlr.M900039-JLR200. [DOI] [PMC free article] [PubMed] [Google Scholar]
- 63.Schmidt EM, et al. GREGOR: evaluating global enrichment of trait-associated variants in epigenomic features using a systematic, data-driven approach. Bioinformatics. 2015;31:2601–6. doi: 10.1093/bioinformatics/btv201. [DOI] [PMC free article] [PubMed] [Google Scholar]
- 64.Marigorta UM, et al. Transcriptional risk scores link GWAS to eQTLs and predict complications in Crohn’s disease. Nat Genet. 2017;49:1517–1521. doi: 10.1038/ng.3936. [DOI] [PMC free article] [PubMed] [Google Scholar]
- 65.Buenrostro JD, et al. Single-cell chromatin accessibility reveals principles of regulatory variation. Nature. 2015;523:486–90. doi: 10.1038/nature14590. [DOI] [PMC free article] [PubMed] [Google Scholar]
- 66.Klein AM, et al. Droplet barcoding for single-cell transcriptomics applied to embryonic stem cells. Cell. 2015;161:1187–201. doi: 10.1016/j.cell.2015.04.044. [DOI] [PMC free article] [PubMed] [Google Scholar]
- 67.Macosko EZ, et al. Highly Parallel Genome-wide Expression Profiling of Individual Cells Using Nanoliter Droplets. Cell. 2015;161:1202–14. doi: 10.1016/j.cell.2015.05.002. [DOI] [PMC free article] [PubMed] [Google Scholar]
- 68.Kang HM, et al. Multiplexed droplet single-cell RNA-sequencing using natural genetic variation. Nat Biotechnol. 2018;36:89–94. doi: 10.1038/nbt.4042. [DOI] [PMC free article] [PubMed] [Google Scholar]
- 69.Satija R, Farrell JA, Gennert D, Schier AF, Regev A. Spatial reconstruction of single-cell gene expression data. Nat Biotechnol. 2015;33:495–502. doi: 10.1038/nbt.3192. [DOI] [PMC free article] [PubMed] [Google Scholar]
- 70.Li H, Durbin R. Fast and accurate long-read alignment with Burrows-Wheeler transform. Bioinformatics. 2010;26:589–95. doi: 10.1093/bioinformatics/btp698. [DOI] [PMC free article] [PubMed] [Google Scholar]
- 71.Li H, et al. The Sequence Alignment/Map format and SAMtools. Bioinformatics. 2009;25:2078–9. doi: 10.1093/bioinformatics/btp352. [DOI] [PMC free article] [PubMed] [Google Scholar]
- 72.Quinlan AR, Hall IM. BEDTools: a flexible suite of utilities for comparing genomic features. Bioinformatics. 2010;26:841–2. doi: 10.1093/bioinformatics/btq033. [DOI] [PMC free article] [PubMed] [Google Scholar]
- 73.Zhang Y, et al. Model-based analysis of ChIP-Seq (MACS) Genome Biol. 2008;9:R137. doi: 10.1186/gb-2008-9-9-r137. [DOI] [PMC free article] [PubMed] [Google Scholar]
- 74.Love MI, Huber W, Anders S. Moderated estimation of fold change and dispersion for RNA-seq data with DESeq2. Genome Biol. 2014;15:550. doi: 10.1186/s13059-014-0550-8. [DOI] [PMC free article] [PubMed] [Google Scholar]
- 75.Heinz S, et al. Simple combinations of lineage-determining transcription factors prime cis-regulatory elements required for macrophage and B cell identities. Mol Cell. 2010;38:576–89. doi: 10.1016/j.molcel.2010.05.004. [DOI] [PMC free article] [PubMed] [Google Scholar]
- 76.Jun G, et al. Detecting and estimating contamination of human DNA samples in sequencing and array-based genotype data. Am J Hum Genet. 2012;91:839–48. doi: 10.1016/j.ajhg.2012.09.004. [DOI] [PMC free article] [PubMed] [Google Scholar]
- 77.Durand NC, et al. Juicer Provides a One-Click System for Analyzing Loop-Resolution Hi-C Experiments. Cell Syst. 2016;3:95–8. doi: 10.1016/j.cels.2016.07.002. [DOI] [PMC free article] [PubMed] [Google Scholar]
- 78.Shabalin AA. Matrix eQTL: ultra fast eQTL analysis via large matrix operations. Bioinformatics. 2012;28:1353–8. doi: 10.1093/bioinformatics/bts163. [DOI] [PMC free article] [PubMed] [Google Scholar]
- 79.Li B, Dewey CN. RSEM: accurate transcript quantification from RNA-Seq data with or without a reference genome. BMC Bioinformatics. 2011;12:323. doi: 10.1186/1471-2105-12-323. [DOI] [PMC free article] [PubMed] [Google Scholar]
- 80.Finucane HK, et al. Partitioning heritability by functional annotation using genome-wide association summary statistics. Nat Genet. 2015;47:1228–35. doi: 10.1038/ng.3404. [DOI] [PMC free article] [PubMed] [Google Scholar]
Associated Data
This section collects any data citations, data availability statements, or supplementary materials included in this article.