

Abstract
Arterial spin labeling (ASL), magnetization transfer contrast (MTC), and chemical exchange saturation transfer (CEST) methods generate different contrasts for MRI. However, they share many similarities in terms of pulse sequences and mechanistic principles. They all use radiofrequency (RF) pulse preparation schemes to label the longitudinal magnetization of certain proton pools and follow the delivery and transfer of this magnetic label to a water proton pool in a tissue region of interest, where it accumulates and can be detected using any imaging sequence. Due to the versatility of MRI, differences in spectral, spatial or motional selectivity of these schemes can be exploited to achieve pool specificity, such as for arterial water protons in ASL, protons on solute molecules in CEST, and protons on semi-solid cell structures in MTC. Timing of these sequences can be used to optimize for the rate of a particular delivery and/or exchange transfer process, for instance between different tissue compartments (ASL) or between tissue molecules (CEST/MTC).
In this review, magnetic labeling strategies for ASL and the corresponding CEST and MTC pulse sequences are compared, including continuous labeling, single-pulse labeling, and multi-pulse labeling. Insight into the similarities and differences among these techniques is important not only to comprehend the mechanisms and confounds of the contrasts they generate, but also to stimulate the development of new MRI techniques to improve these contrasts or to reduce their interference. This in turn should benefit many possible applications in the fields of physiological and molecular imaging and spectroscopy.
Keywords: Arterial Spin Labeling (ASL), Chemical Exchange Saturation Transfer (CEST), Magnetization Transfer Contrast (MTC), spatially selective, frequency selective, compartmental exchange, chemical exchange, mobile molecules, immobile proton pool, Cerebral Blood Flow (CBF)
Introduction
MRI is a versatile technique that appears to have unlimited possibilities for imaging not only anatomy, but also physiological and chemical properties. This wealth of information can be accessed by using pulse sequences that are composed of series of radiofrequency (RF) and magnetic field gradient pulses differing only in length, number, strength, and timing. For instance, arterial spin labeling (ASL) (1–5), magnetization transfer contrast (MTC) (6–9), and chemical exchange saturation transfer (CEST) (10–19) are three methods that have existed for a number of years in both pre-clinical and human imaging. ASL is a non-invasive method for measuring tissue perfusion, while CEST is a relatively new technology that can detect low (millimolar) concentrations of molecules through the presence of groups with exchangeable protons, such as hydroxyls (OH) (20–23), amides (NH) (24–28) and amines (NH2) (29–32). Chemical exchange is just one type of magnetization transfer (MT) used in imaging. In high resolution NMR, MT is a general term used to describe the process where magnetization is transferred from one spin population to another. Unfortunately, in clinical MRI, the term MT is used conventionally to specifically denote saturation transfer contrast originating from semi-solid macromolecules, such as for instance myelin in the white matter (33–35). To avoid confusion, we will refer to the latter as conventional magnetization transfer contrast (MTC). CEST signal, on the other hand, originates from the endogenous mobile proteins and metabolites in biological tissues, or from exogenously administered contrast agents.
Since ASL, CEST and MTC are used to measure completely different physiological and molecular properties, they have developed into separate fields. However, physicists and engineers in these fields are actually designing pulse sequences that are very similar, often without being aware of the overlap. This becomes more obvious when realizing that all of these methods include very similar preparation periods to achieve three mechanistic components: (i) some type of selective magnetic labeling of a proton pool that is stored as a change in longitudinal magnetization; (ii) delivery and/or transfer of this label to a water proton pool in a tissue region of interest; (iii) accumulation of the label for the purpose of increasing the signal to noise ratio (SNR). This preparation is then followed by detection, which can be done using any kind of image acquisition sequence. As such, a lot of the principles used in ASL pulse sequence design can be applied to CEST/MTC, and vice versa (36). In addition, it is therefore not surprising that both ASL and CEST images are contaminated by the MTC effect. Through the years, many variations of both ASL, CEST, and MTC methods have been developed and the respective research fields continue to grow (16,37). The purpose of this review is to describe the similarities and differences between these methods, both in terms of the processes involved as well as the building blocks of the pulse sequences that allow their measurement. By applying this knowledge, technical development for both ASL and CEST/MTC techniques can be further advanced by sharing of the pulse sequence building blocks and of the principles developed independently in each field.
Principles of Magnetic Label Generation, Delivery and Accumulation
ASL is a non-invasive MRI method for measuring blood flow (perfusion), i.e. the delivery of a certain amount of blood (mL) to a certain amount of tissue (100g) in a certain amount of time (min). In ASL, the labeling of the arterial blood water protons is accomplished by applying one or more RF pulses to tissue-feeding arteries. When the labeled blood water molecules reach the capillaries, they exchange with the tissue water pool (1,2), inducing an MRI signal decrease. For ASL, this is generally induced using inversion of the longitudinal magnetization, but saturation approaches (1/2 of the possible signal) exist too. The net signal difference between a label and a control imaging experiment (without RF application or with RF application at opposite frequency offset) is proportional to the blood flow, i.e., the signal from static spins is subtracted out (Fig. 1). The perfusion-weighted signal in ASL is only a few percent of the total MRI signal, and thus the experiment needs to be repeated several times to obtain sufficient SNR.
Figure 1.

The principle of ASL imaging. Labeling of arterial blood water is performed upstream to the imaging volume using RF pulses. A perfusion map is obtained by subtracting the label image and a control (baseline) image, in which the arterial blood water spins are not affected.
CEST detects molecular information by using RF pulses to magnetically label exchangeable protons (10,17). The labeled protons exchange with the water protons detected in MRI through physical spin exchange, generally referred to in the field as ”chemical exchange” as it happens between sites that are chemically different. After exchange, the label appears as a signal loss (“saturation”) on the water signal, generally on the order of a few percent. However, this is molar signal concentration and thus two to three orders of magnitude larger than the concentration of the solute (millimolar), which is a consequence of many repeated label-exchange events during the preparation period before image detection. The principles of acquisition and processing for a basic CEST experiment are described in Fig. 2. CEST results are often displayed using a saturation spectrum (Z-spectrum), showing the normalized water intensity as a function of saturation frequency. Notice that, similar to many ASL sequences, a control acquisition is applied without labeling or data are analyzed by subtracting a reference signal from labeling at opposite frequency in the Z-spectrum in an attempt to compensate for interfering effects.
Figure 2.

The principle of CEST technique. (A) Solute protons (s, blue) are in constant exchange with water protons (w, black). (A,B) An RF pulse labels (here: saturates) the solute protons at their specific resonance frequency in the 1H spectrum (here 8.25 ppm for amide protons). The saturation is transferred to the water pool (4.75 ppm) at exchange rate ksw, while non-saturated protons replenish the magnetization of the solute pool at exchange rate kws. This process continues as long as the RF saturation is on (tsat). If tsat is long enough, the saturation effect becomes visible on the water signal and the original signal S0 is reduced to Ssat (B, right). (C) By repeating the experiment with varying saturation frequencies, measurement of normalized water saturation (Ssat/S0) as a function of saturation frequency can be obtained, generating a so-called Z-spectrum (34). For saturation at 4.75 ppm, the signal disappears due to direct saturation (DS). The Z-spectrum frequencies correspond to the proton MR spectrum (positive frequency to the left), but shifted by assigning the water frequency to 0 ppm in Z-spectra. For short tsat, only DS is apparent. At longer tsat the CEST effect becomes visible at the frequency of the low-concentration exchangeable solute protons, in this example the amide protons at Δω = 8.25-4.75 = 3.5 ppm in the Z-spectrum. Direct saturation may interfere with detection of CEST effects, which is generally addressed by exploiting the symmetry of the DS through a so-called magnetization transfer ratio (MTR) asymmetry analysis with respect to the water frequency (D). This process is characterized by subtracting right (−Δω) and left (Δω) signal intensity ratios. Reproduced with permission from van Zijl P.C.M, Yadav N.N. Magn Reson Med 2011;65(4):927-948.
The CEST description in Fig. 2 is for a single pool of exchangeable protons, leading to a simple Z-spectrum with a single resonance at higher frequency relative to water. However, magnetic label can be transferred between protons within molecules and this effect also shows up in the Z-spectrum if the label is ultimately transferred to water protons (i.e. in a relayed manner). For instance, when labeling non-exchangeable protons, such as aliphatic groups in mobile proteins, the label is transferred to neighboring protons if they have a dipolar coupling and cross-relaxation occurs. This so-called nuclear Overhauser enhancement (NOE) can be relayed throughout the molecule (Fig. 3A), a process called spin diffusion, and ultimately be tranferred to water protons via exchange. Thus, resonances of aliphatic origin can also appear in the Z-spectrum (21,38–41) and, based on the mechanism, are indicated as relayed NOEs, or rNOEs (15,17,27). In Fig. 3B, the Z-spectrum of egg white is shown, which clearly contains CEST effects of amide protons and guanidinium protons (arginine side groups in proteins) as well as rNOE signals. The speed of spin diffusion increases with slower rotational motion and is almost instantaneous in solid-like material. This is the cause of the conventional magnetization transfer effect (Fig. 3C), where the distributed label can ultimately be transferred to solvent water protons either via bound water (dipolar transfer followed by water exchange) or via exchangeable protons similar to the two mechanisms for CEST signal. Notice that in mobile proteins, the direct dipolar transfer to bound water has been shown not to be a significant contributor (15,17,42,43). MTC MRI thus closely resembles the rNOE-CEST process, except that MTC detects solid-like macromolecules with broad lineshapes (microsecond T2). This can be seen in Fig. 3D, where the mobile protein resonances (CEST and rNOE) are visible with distinct resonance lineshapes at low RF irradiation field strength B1, while the strong MTC effects extend far beyond the spectral range of the solution MR spectrum. The MTC effects also increase faster with B1 and will become fully dominant in the aliphatic region above B1 values of a few microtesla.
Figure 3. Relayed NOE (rNOE) effects in mobile and semisolid proteins and their effect on the Z-spectrum.

The blue star indicates where the protons are labeled using either excitation or saturation; the red star indicates after label transfer; the green star after chemical exchange. A) Intramolecular NOE-relayed (rNOE) label transfer in a mobile protein, followed by exchange transfer to water via exchangeable protons (e.g. amide protons here). B) Z-spectrum of egg white at 2 different B1 levels to illustrate the occurrence of CEST (amide and guanidinium protons) and rNOE effects (aliphatic protons in the upfield, i.e. lower frequency region of Z-spectra) in mobile proteins (11.7 T MRI). C) Intramolecular NOE-relayed transfer in semisolid protein followed by intermolecular NOE to bound water, followed by either molecular (water) exchange or proton exchange to free water, such as can occur in MTC. D) In vivo Z-spectrum in mouse brain illustrating the dominant occurrence of resonances of mobile proteins at low B1 and the broad background due to MTC effects the contribution of which increases strongly with B1 (11.7 T MRI). Notice the asymmetry in the MTC effect with respect to the water frequency, originating from contributions of aliphatic protons. Parts a) and c) were reproduced, with permission, from van Zijl et al. Neuroimage, 2017 Apr 21. pii: S1053-8119(17)30340-3. doi: 10.1016/j.neuroimage.2017.04.045.
The most obvious similarity between ASL, CEST, and MTC is that all three methods employ RF pulses to achieve selective magnetic labeling of a certain pool of protons, which is stored as a change in longitudinal magnetization (saturation or inversion based). In ASL, these can be spatially selective RF pulses, requiring simultaneous application of a gradient pulse to cause a different spatial water frequency between the labeling plane and the imaging slices, or non-selective RF pulses with velocity-based selection. In CEST/MTC, the separation of the exchanging protons and water is achieved by RF frequency selection based on their inherent chemical shift (NMR spectral frequency) difference and without application of a simultaneous gradient pulse. The saturation/excitation RF pulses are applied with the frequency tuned to the offsets of the solute proton pool of interest in the proton spectrum (CEST) or far outside the proton spectrum (MTC). This parity between methods is exemplified in Figure 4. After spatial labeling of the spins in ASL or spectral labeling of the spins in CEST/MTC, a water signal reduction in the imaging volume is accomplished consequential to label delivery to the water proton pool. In ASL methods that use spatial selection, a post-labeling delay (PLD) of 1-2 second is typically necessary (Fig. 4D) to allow the labeled spins to reach the imaging slices and exchange (over the blood brain barrier) with non-labeled water molecules in tissue, where the label then accumulates. This delay is much shorter in velocity-selective ASL (VS-ASL) and not necessary in CEST/MTC experiments (Figs. 4E,F) where labeling and transfer occur continuously. However, the CEST/MTC preparation is still long (1-3 s or even more) due to the need to repeat the label-exchange process to achieve sensitivity enhancement. In all three methods, the label buildup is counteracted by T1 relaxation. In addition to the continuous wave spin labeling in ASL, CEST, and MTC (Fig. 4), a large number of pulsed labeling methods has been developed, as well as some hybrid methods. In the following sections, we will focus predominantly on the sequences that show similarity for ASL, CEST, and MTC.
Figure 4.

Conceptual similarities between (A) ASL, (B) CEST and (C) MTC, as well as the corresponding pulse sequences for continuous saturation: (D) the continuous ASL (CASL), (E) the continuous wave (CW) CEST and (F) the continuous wave (CW) MTC, respectively. All three techniques use an RF pulse for labeling (here saturation), but ASL employs spatial frequency selection of blood water protons, whereas CEST/MTC relies on spectral frequency selection of a solute proton pool. The methods then rely on compartmental (ASL), chemical (CEST), and dipolar plus molecular/chemical (MTC) exchange to tissue water protons. (D) CASL: a continuous wave together with a gradient is used for bolus labeling. After the labeling period, a post label delay (PLD) is applied before image acquisition for labeled blood water protons to reach the slice and exchange with tissue water protons. (E) CW-CEST: a continuous wave applied at a certain offset is used for saturating the protons, which then exchange with non-labeled water protons. This process occurs during the saturation time to achieve sensitivity enhancement allowing detection of mM solute molecules with molar sensitivity. (F) CW-MTC: the sequence is identical to the CW-CEST sequence, but usually higher saturation powers are applied to label the macromolecular pools. Due to the broad line-shape of the semi-solid macromolecular protons, the saturation frequency offsets are placed outside the solution MR proton spectral range to have selectivity to solid-like protons only.
Comparison of ASL, CEST, and MTC Pulse Sequences
The magnetic labeling in ASL, CEST, and MTC can be achieved by continuous saturation, pulsed saturation, or excitation methods (including inversion) that ultimately lead to a reduction (partial saturation) of the tissue water signal. In addition, this labeling can be modified (filtered) based on motional properties of the spins in terms of flow speed or rate of translational diffusion. Below we briefly review these labeling schemes and discuss similarities and differences.
1. Continuous labeling
1a. Continuous ASL (CASL)
In the continuous ASL (CASL) method (1), arterial blood water protons are labeled continuously in a thin slice proximal to the imaging plane (Figs. 4A, D), until a steady state is reached in the tissue longitudinal magnetization (usually after two to four seconds when label accumulation and T1 relaxation balance out). The labeling employs so-called flow-driven adiabatic inversion, which is performed by applying a low-power continuous RF pulse (~ 1.5 μT) with a magnetic field gradient in the flow direction. While this only saturates static spins, the spins that move in the gradient direction are inverted due to the variation in their resonance frequency. To achieve optimal inversion/labeling efficiency, the RF amplitude and gradient strength need to be tuned to the velocity of the arterial blood at the labeling site. An important aspect is the need for a post-labeling delay to reduce the sensitivity to heterogeneities in transit time of labeled blood (44) by allowing time for the majority of label to enter the tissues. For a more detailed description of CASL methods, see Ref. (45).
1b. Continuous wave (CW)-CEST
Continuous wave (CW)-CEST is the most widely applied technique in the CEST field mainly due to its easy implementation on animal scanners, and the well-established theory (15,46–48). It closely resembles the CASL sequence (Figs. 4D vs E) with two major differences: there is no gradient applied during RF labeling and the post-labeling delay is not necessary in CW-CEST. The appropriate saturation power level for optimum labeling efficiency in CW-CEST is chosen based on the exchange rate of the exchanging protons under study. Under the approximation of slow exchange on the NMR frequency time scale, the saturation efficiency of CW-CEST with respect to the solute-water proton exchange rate is described by (46)
| [1] |
where is the RF irradiation field strength. It can be seen that high saturation power is needed to achieve reasonable saturation efficiency for fast-exchanging protons, such as hydroxyl and amine groups with exchange rates higher than 1 kHz under physiological conditions. Therefore, it is challenging to detect small molecules with fast-exchanging protons on clinical scanners where the maximum B1 field is limited in duration and the assumption of slow exchange will not apply due to the spectral frequency difference between these protons and water being smaller than the exchange rate at low B0. In contrast, high saturation efficiency can be easily reached for slow-exchanging amide protons in the peptide bonds of small tissue proteins and peptides, as they exchange with an average rate of about 29 Hz (11,17) and the frequency offset of 3.5 ppm versus water corresponds to 448 Hz (or 2,800 rad/s) at 3 Tesla. The assumption for slow exchange (ksw << ) therefore applies readily. Power levels of 1-2 μT are used for CEST MRI of these slow exchanging protons.
CW-CEST experiments are usually performed by observing the reduced water signal due to saturation ( ) as a function of the offset of the saturation pulse. The acquisition of these Z-spectra (Figs. 2, 3) is the most time-consuming step in CEST studies. The CEST acquisition time can be reduced by recording Z-spectra in a single scan using the ultra-fast Z-spectra (UFZ) CEST sequence (49–52), which is identical to the CASL sequence (Fig. 4D). By applying a gradient during the saturation pulse, the saturation frequency offsets become a function of spatial position along the gradient direction in the sample. The disadvantages of this technique are low SNR and interference with spatial information since it uses the pixels for encoding CEST spectra at different frequencies. Thus, while it is a perfect technique for CEST agent screening using samples that are spatially homogeneous (52), it needs to be further developed for in vivo applications (53,54) where tissue composition differs spatially.
1c. Continuous wave (CW)-MTC
The CW-MTC sequence is identical to the CW-CEST sequence, but much higher B1 levels are typically used. Interestingly, while the short T2 of semisolid protons causes a Z-spectrum without fine structure, these protons can actually be excited selectively simply by going outside the proton spectral range for solutions (±5 ppm versus the water frequency). However, it should be clear from Figs. 3D and 4C that CEST effects within the proton spectral range cannot be measured separately from MTC using the simple CW approach. This can however be done with some pulsed approaches by exploiting the difference in T2, which will be discussed below.
2. Single-pulse labeling
2a. Pulsed ASL (PASL)
In pulsed ASL (PASL), labeling is performed with a short inversion pulse (5-20 ms) over an extended volume (i.e., a thick slab) (45,56,57) (Fig. 5A). Thus, whereas CASL relies on the continuous labeling of blood as it flows through a plane, PASL labels a large blood volume instantaneously and with high labeling efficiency. Even though adiabatic inversion pulses are used to obtain thick inversion slabs with sharp edges, inversion profile imperfections are still present and a gap between the labeling slab and the image volume is generally needed. A popular variant of PASL is FAIR (flow alternating inversion recovery) (55–57). A global inversion is employed in the labeling case, thereby creating labeling inside and outside the tissue of interest. For the control image, a slice selective inversion pulse is used, inverting only the magnetization in the tissue of interest. The original PASL implementation has been adapted and improved in several ways, which has been reviewed before (45,58). Some ASL preparation schemes employ composite inversion pulses, but as they cause a single inversion they are treated in this single-pulse section. Examples of these are the TILT (59) (Fig. 5B), UNFAIR (60) and FAIRER (61) methods.
Figure 5.

Time diagrams of the (A) FAIR/EPISTAR/PICORE: All three ASL sequences apply an inversion pulse to label the blood. A gradient is applied with the pulse simultaneously to control the position of the labeling slab. For the FAIR sequence, the offset of the inversion pulse is in the center of the imaging slice, while the other sequences are at one side of the imaging center. (B) TILT: two 90-degree pulses instead of one inversion pulse are used as labeling. In the control image, the phase and gradient for the second pulse is inverted. (E) SIR: A selective pulse at water frequency inverts the water signal to achieve labeling of the macromolecules. After the inversion, a delay was applied to allow the labeled macromolecule to exchange with water.
While the inversion efficiency is improved compared to CASL, the PASL techniques generally still have a lower signal-to-noise (29). This can be explained by the fact that PASL results in less labeled blood since the effective bolus duration (usually under 1 s) is limited by the coverage of the RF coil. Furthermore, in PASL, the spatial extent of the inversion slab causes the inverted blood protons to have a longer transit time to the imaging volume, on average, leading to a lower ASL signal due to T1 relaxation of the inverted proton magnetization. Still, PASL has proven to be a popular alternative to CASL, mostly due to its simpler implementation (58).
2b. Selective Inversion Recovery (SIR)
While PASL does not has a direct counterpart in CEST, where labeling and label transfer need to be repeated to attain sufficient SNR, it has in MTC for a sequence called selective inversion recovery (SIR) (62,63) (Fig. 5C). SIR uses a low-power selective inversion pulse on the free water protons, thus not affecting the majority of the semisolid macromolecular protons that resonate outside the pulse excitation range. This closely resembles the FAIR ASL sequence in which the blood water magnetization inside the imaging slices is inverted, while it is at equilibrium outside these slices. After the inversion, the water signal recovery follows a bi-exponential apparent relaxation pathway due to the magnetization transfer between water and the macromolecules. Under a first order approximation considering the exchange rate between macromolecules and water to be much higher than the relaxation rates of water and macromolecules the two relaxation times in SIR experiments are given by (63,64)
| (2) |
The relaxation rate is the observed water R1 in a conventional MRI T1 measurement by the inversion recovery method, while the relaxation rate determines the initial recovery process in the SIR experiments, which is dominated by the exchange rate . In analogy to this influx of fresh macromolecular magnetization to water in SIR, the water magnetization selectively inverted in the imaging slice using FAIR also recovers quicker due to fresh blood flowing into the imaging slice. The above equations (Eq. 2) can not only be used to extract MTC information by fitting the bi-exponential curves, but they also provide great insight into how the macromolecules in tissue impact the observed water relaxation. The T1 relaxation time of macromolecules is less than 1 s (87), and generally shorter than the tissue free water relaxation time (about 1-3 s at fields from 3-11.7 T, respectively). Therefore, the observed water relaxation is shortened by the MTC effect, and the magnitude of this effect depends on the macromolecular proton concentration (fraction fm in Eq. 2). This is why T1 maps on both human and animal brains measured by MRI usually resemble the fm map determined in quantitative MT experiments (65–68). It is important to realize that the component in SIR is only observable in the initial few hundred milliseconds due to the fact that . Fast-exchanging semisolid protons, however, affect the water signal only during the inversion pulse in SIR and do not contribute to the time-dependent buildup afterwards. Therefore, the SIR technique mainly detects the slow-exchanging components of the MTC pools. The measured exchange rate of MTC by SIR is approximately 15 Hz for GM, and 10 Hz for WM, which is far slower than the exchange rates detected by conventional CW-MTC methods (65,67,69).
3. Multi-pulse labeling
3a. Pseudocontinuous ASL (PCASL)
In addition to CASL and PASL, a hybrid method called pseudocontinuous ASL (PCASL, Fig. 6A) has recently emerged (70). This approach uses repeated short RF pulses to label the blood by mimicking a flow-driven adiabatic inversion process similar to CASL. The PCASL method has proven to be very useful since it exploits the higher labeling efficiency of PASL and the higher SNR of CASL, without the need of continuous RF transmission. Recently, a white paper for ASL came out where PCASL was the recommended labeling technique (3), primarily due to the high labeling efficiency, easy use on standard MRI hardware, and compensation of MTC interference effects. PCASL is normally implemented as a single time-point experiment with a PLD of 1.5-2 s, background suppression, and a fast 2D or 3D readout.
Figure 6.
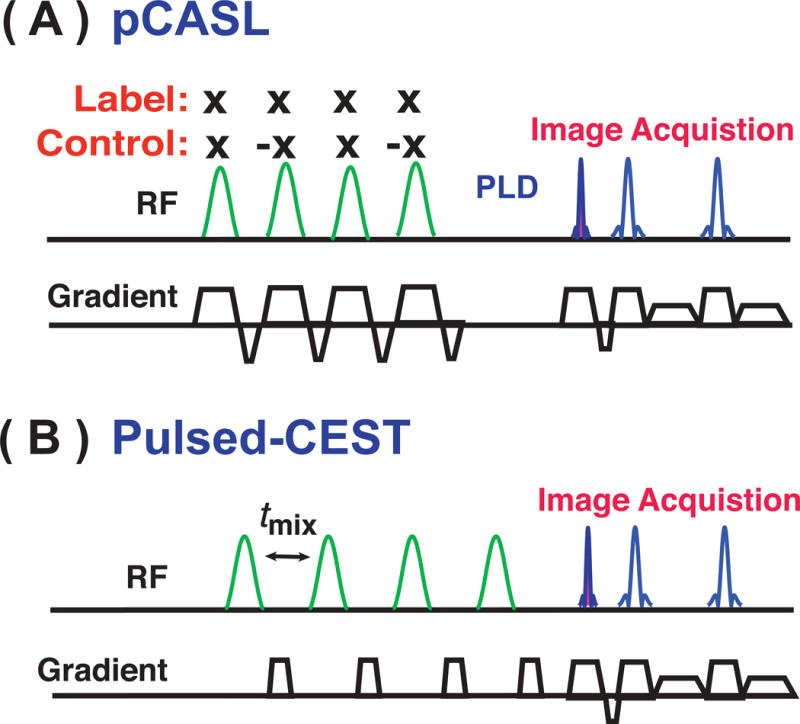
Time diagrams of (A) a typical pCASL sequence: a train of RF pulses together with gradients is used for bolus labeling. After the labeling duration, a PLD is applied before image acquisition. The RF polarity is constant in the labeling scan and alternated in the control scan. (B) Pulsed-CEST: A train of frequency selective pulses is used for the CEST labeling. Crusher gradients are applied during the mixing time to suppress unwanted spin echoes. Alternatively, phase cycling of the RF pulses can be applied to reduce such echoes.
3b. Pulsed CEST
Similar to the CASL sequence, CW-CEST is not easy to use on clinical MRI scanners due to hardware (amplifier) and specific absorption rate (SAR) limitations. Consequently, most CEST experiments on human MRI scanners employ some type of pulsed-CEST approach (27,71–73). Two types of pulses are used for CEST: saturation based or excitation based (16), and a train of such pulses is needed to enhance the detection sensitivity (16). A pulsed CEST experiment can be performed similarly to CW-CEST, i.e. by measuring the water signal saturation as a function of saturation or excitation frequency, but its information content can be extended by measuring the water signal reduction as a function of inter-pulse spacing (transfer delay time), i.e. similar to quantitative pulsed MTC experiments (65,68,74–76).
While pulsed CEST using saturation pulses is sometimes just used as an equivalent to a CW-experiment with small time intervals to adhere to amplifier specifications, it has an added flexibility in that variation of these time intervals can be used to filter out different CEST components based on exchange transfer rate. Even more versatility can be introduced using excitation pulses, where modules of excitation labeling and label transfer (so-called label-transfer modules or LTMs) are repeated to achieve the sensitivity enhancement required (77). Within these LTMs, the labeling of exchanging protons using excitation pulses can be achieved in many different ways, as exemplified in Fig. 7 (16). The versatility of pulsed CEST in terms of separating different types of exchanging protons by their relaxation time, line-shape or exchange rate (16,27,39,41,73,77–86) has stimulated the development of many advanced pulsed CEST methods such as the frequency-labeled exchange (FLEX) (77,81,87,88), chemical exchange rotation transfer (CERT) (89), variable delay multi-pulse (VDMP) (27,41,90), length-and-offset-varied saturation (LOVARS) (80,91), and transfer-edited (TRE-CEST) sequences (92), each of which offer their own unique advantages. The principle of using repeated LTMs has extended the possibilities of CEST from being a simple saturation transfer approach to one in which spin systems can be edited in a way similar to spectroscopy, but then with much increased sensitivity (16). Recently, even heteronuclear FLEX approaches were introduced (84,88), and these are just some examples of several editing schemes that are possible.
Figure 7.

Several CEST pulse sequences that employing excitation. The CEST preparation time (tprep) consists of a train of label transfer modules (LTMs), during which exchangeable protons are labeled and transferred to water. The labeling can be achieved using frequency-selective inversion (A), excitation and dephasing (B), or by employing the difference between frequency-selective signals acquired at multiple rotation angles (C) or transfer delays (D). One unique labeling strategy is the FLEX method (E), in which a range of frequencies covering multiple proton types are excited and the frequency of the protons modulated using chemical shift evolution during an evolution time (tevol). In the LTM for the transfer-rate-edited (TRE-) CEST approach in (F), all spins except for water are rapidly excited using an on-resonance binomial pulse. This is followed by selective saturation of a component at each offset. Reproduced with permission from van Zijl, P. C. M. and A. A. Sehgal (2016). eMagRes 5, 1-26.
Among the multi-pulse CEST techniques, the chemical exchange rotation transfer (CERT, Fig. 7C) method most closely resembles PCASL. In CERT (85,89), the labeling efficiency is maximum at the 180 degree flip angle and minimal with a flip angle of 360 degrees, and the CEST contrast is obtained by subtracting two images acquired under these conditions. In PCASL, the labeling and control images are acquired by changing the phase of every second pulse in the labeling pulse train (Fig. 6A), which leads to different flip angles for the water proton spins. While this phase approach should also be possible for pulsed CEST to remove the MTC confound, it may be only suitable for phantom studies since the excitation profile of a pulse train with alternating phases is a periodic function (86,93,94), which makes it difficult to apply in vivo due to the complicated CEST contributions.
Different from the CEST experiments, where a diversity of exchanging protons contributes in tissue, ASL labels only the water spins in the blood vessel. Therefore, many pulsed approaches in CEST used to separate different exchanging pools (e.g. based on resonance frequency or transfer rate) do not have direct counterparts in the ASL field. One special approach is the FLEX method (77,83), where the spins are phase labeled using their rotation frequency based on the frequency offset relative to water. This information is then stored as a change in the magnitude of the longitudinal magnetization and transferred to water protons (Figure 7E).
4. Labeling using motional filtering
Importantly, the principle of magnetization labeling is not limited to the above examples for ASL, CEST and MTC, using frequency or spatially selective RF pulses and inter-pulse delays. In principle gradient pulses can be included to further edit for specific proton pools, thus sensitizing the experiment to the motional properties of the pool components, for instance the velocity of their flow or the rate of molecular translational diffusion.
4a) Velocity encoding
In the velocity selective ASL experiment (VS-ASL) (95–102), uni-directional flow encoding is combined with non-selective (partial or full) RF saturation or excitation of arterial water protons. As the pulses are non-selective, excitation is close to the tissue of interest and long post-labeling delays not required. In Figures 8A and B, some generalized modules that can be used for velocity encoding are illustrated. The most basic one is in Figure 8A (95), where saturation of the flowing spins is achieved while static spins do not have signal loss. In the reference scan the gradients are removed. However, there are several issues with this basic approach, especially the limited flow selection profile (i.e. limited saturation efficiency), and a difference in diffusion weighting and eddy current effects with the control scan. The labeling efficiency can be greatly increased using the generalized approach of N repeated modules in Fig. 8B, where static spins experience a flip angle of 2 , while only a small fraction (narrow velocity band) of the flowing spins experience such a rotation, leaving most flowing spins unperturbed due to the phase acquired during the period that the magnetization is transverse and experiences velocity encoding. In the control scan the negative lobes are made positive and all spins experience a 2 angle. Labeling efficiencies close to those of PCASL have been reached (98). when using VS inversion (VSI: 2 ) and half of these using VS saturation (VSS: 2 ). However, the latter one has the advantage of tissue saturation in both control and label experiment, often advantageous for removal of background effects.
Figure 8.

Simple generalized labeling schemes for motion-selective labeling including refocusing of field inhomogeneities and a flip-back pulse to store remaining transverse magnetization as longitudinal magnetization. (A) Using simple Stejskal-Tanner gradient pair (B) Using composite gradient combinations that can be designed to reduce eddy currents and, for diffusion sensitization, to average sensitivity to motion direction (linear, planar and spherical/trace encoding). “N” is the number of LTMs. The parameter “M” can be 1-3, depending on the number of gradient directions used (x and/or y and/or z). Alternatively, there can be two or three consecutive gradients applied in the same direction, but polarity switched, to improve background gradient compensation (107) or to achieve flow compensation. At low gradient strength, velocities are encoded, while diffusion sensitization requires higher gradient strengths. A minimum gradient is needed to remove spurious signals excited by the refocusing pulse in case of B1-inhomogeneity. While 90° pulses are used here, they can be changed to other flip angles; Composite 180° RF pulses can be used to reduce B1 inhomogeneity effects. In addition, gradients can be added to the RF pulses to include spatial selection, or the 180° pulse lengthened for frequency selection.
4b) Diffusional encoding
Diffusional filtering can also be used to select for a certain subset of spins. This has been useful for compartmental filtering, e.g. to separate intra- and extracellular water in erythrocytes (103) or metabolites in cell suspensions (104–106) even allowing the measurement of metabolite transport over the cell membrane (104). This can be achieved using either a simple Stejskal-Tanner gradient pair enclosing the refocusing pulse (Fig. 8A, but now stronger gradients for diffusion weighting) or composite gradient pulses (one or more bipolar pairs) to compensate for eddy currents (Fig. 8C). To select certain motion characteristics, the gradient strength can be varied, but a minimum gradient strength is always needed to remove spurious signals excited by the 180° pulse itself. The gradients can in principle be in any direction when studying isotropic diffusion, but will be affected by gradient direction in anisotropic tissues when the diffusion time becomes sufficiently long to reach spatial boundaries, the chance of which is reduced when using short bipolar pairs such as in Fig. 8C. In anisotropic tissue, the composite gradient schemes can then be used for different types of encoding (e.g. spherical/trace type combinations) (107–109). Diffusion-filtered exchange schemes have been implemented to study cell membrane permeability using either spectroscopy (filter exchange spectroscopy (FEXSY) (110) or imaging (filter-exchange imaging (FEXI) (111–113)), respectively. In the latter experiments, after the initial diffusion filter to suppress fast diffusing water molecules, the compartments mix, leading to a signal buildup due to the fact that the diffusion constant, T2 and T1 of the fast diffusing component are larger than those of the slow diffusing component. When measuring the diffusion constant of the signal as a function of exchange time, an apparent exchange rate (AXR) can be reduced, which reflects microscopic tissue properties. While the precise properties may be hard to determine in real tissue with multiple compartments, there could potentially be some useful applications. AXR could of course also be determined by measuring T2 or T1 of the signal building up. This buildup process can be described by expressions similar to the CEST equations for slow exchange on the MR time scale. Diffusion weighting with stimulated echo sequences has also been applied to study exchange transfer in solution, called gradient-enhanced exchange spectroscopy (114).
Contamination of ASL and CEST Signals by MTC
ASL and CEST methods study protons of mobile molecules, which have an MR signal over a limited frequency range due to their finite T2, allowing the use of spatially or spectrally selective labeling. During spatial labeling, a spatial frequency difference is imposed with gradient application, while spectral labeling employs the frequency offset induced by the magnetic field of choice. However, as should be clear from Fig. 4C, the labeling approaches for both methods also affect the pool of protons in solid-like tissue macromolecules that have a very broad MR line-shape due to their very short T2 (microsecond range). This causes partial saturation of this proton pool that, through cross-relaxation mechanisms and chemical exchange, decreases the magnetization of the pool of free water protons and thus the image signal (33,115,116). The semisolid MTC effect increases strongly with B1 strength (Fig. 3D) and can easily be of the same order of magnitude as the signal changes due to perfusion or chemical exchange. The effect of MTC contamination in ASL is illustrated in Fig. 9A. Despite labeling blood water in a slice spatially remote from the imaging slice (green), there is a small signal saturation occurring in the imaging slice due to the broad asymmetric MTC component in the Z-spectrum. Since the ASL perfusion image is calculated by subtracting the labeling and control images, MTC effects in the labeling image can lead to perfusion overestimation unless either accounted for in the analysis, compensated for in the control image, or minimized by using a low-B1 acquisition. Compensation for MTC effects has been an important aspect in the development of new ASL sequences, with several sequences having identical labeling schemes and differing only in MTC compensation strategy (117–119).
Figure 9.

(A, B) The contamination in ASL due to MTC asymmetry is illustrated with low (A) and high (B) field gradient application during RF labeling. When a gradient is applied during RF labeling, the Z-spectrum becomes a function of spatial position along the gradient direction. The water signal difference at the imaging slices (indicated by a red arrow) will be contaminated by MTC effects due to MTC asymmetry (A). With a strong gradient, the signal difference due to MTC asymmetry will be reduced due to the large offset at the imaging slices with respect to the labeling plane (B). The MTC Z-spectra were simulated using a continuous wave saturation of 1 μT, and assuming an MTC pool with offset at −2.3 ppm and T2 of 0.1 ms. (C) Illustration of the Z-spectra of mouse brain recorded using CW-CEST sequence with saturation powers of 0.5 μT and 1 μT, respectively. A clear MTC asymmetry is visible that will affect the typical Z-spectra asymmetry analysis in CEST experiments (See Fig. 2).
MTC asymmetry based contamination is also a major issue in CEST studies as shown in Fig. 9C where Z-spectra from a mouse brain acquired with two different saturation powers are shown. The CEST signal of amide, guanidinium and aliphatic protons (relayed nuclear Overhauser enhancements, rNOEs) can be clearly seen at low saturation power (32,85,120), (Fig. 9C, top) while the MTC effect and its asymmetry with respect to the water resonance frequency are visible but small. With higher saturation power B1, the direct water saturation (DS) and especially the MTC become dominant, the latter with a complicated line-shape with maximum intensity around −2 to −4 ppm, i.e. originating from the aliphatic peaks in semisolid proteins and lipids, and overlapping with narrower rNOEs from mobile protons (17,27).
The MTC suppression techniques in both ASL and CEST follow similar principles. Usually two images, i.e. control and label, with different ASL and CEST contrast but with the same MTC effects are collected. Then, the MTC can be removed by subtracting the control and labeling images. Based on whether the labeling frequency of the control and labeling image in the Z-spectrum are identical or different, or whether no control scan is employed, the MTC suppression methods can be divided to three types.
1. Symmetric MTC compensation techniques
The most common way to approach reduction of MTC contamination in both ASL and CEST is by collecting images at two frequencies symmetric with respect to the water resonance (Fig. 2D and Fig. 9B). This will allow the MTC effects to be subtracted out under the assumption that they are symmetric with respect to water resonance. In practice, however, the MTC effect may not be compensated in the subtraction due to asymmetry of the MTC effect with respect to the water frequency (115,121) in the particular tissue, for instance the brain, which has strong myelin-based aliphatic MTC effects.
In ASL studies, the symmetric MTC compensation techniques use distal labeling in the control experiment. While a large fraction of the MTC (symmetric component) can be removed, the asymmetric component in brain tissue can not (see Fig. 9A). Fortunately, this MTC contamination can be minimized by applying a high field gradient during RF labeling, which leads to large frequency offsets between labeling and imaging slices. This is equivalent to a spatial narrowing of the Z-spectrum (Fig. 9B) reducing the contamination from MTC asymmetry. In the CASL method, MTC contamination is severe due to the relatively small magnetic field gradient applied during the extended RF labeling. In the original CASL implementation, Williams et al. used a distal labeling, i.e., with the labeling slice placed symmetrically on the other side of the imaging plane in the control experiment (2). However, such an approach is only valid under some special situations such as a single slice under low labeling power. When performing multi-slice perfusion imaging, the issue can be solved by the simultaneous proximal and distal irradiation (SPDI) technique proposed by Talagala et al. in which half the RF power is applied both proximally and distally to the image volume in the control experiment (122).
MTC effects are less severe in PASL, but not negligible. In conventional PASL, as in CASL, the standard approach is to reproduce the MTC effects in the control experiment. In the original EPISTAR method the MTC suppression is achieved by applying a distal inversion pulse in the control experiment (64). Again, this only truly compensates for a single-slice acquisition and symmetric MTC, and Edelman et al. later modified the sequence to work for multi-slice acquisition (123). The multi-slice EPISTAR uses two subsequent proximal inversion pulses of half the RF power for the control image and therefore is still susceptible to asymmetric MTC effects. However, these are likely very small for a single-pulse experiment.
In CEST studies, the simple MTRasym analysis approach with right-left signal subtraction demonstrated in Fig. 2D does not provide MTC compensation as a consequence of the MTC asymmetry and the occurrence of rNOEs of mobile macromolecules. However, the method is still widely used in CEST field since it a simple and efficient way to remove water direct saturation and the symmetric part of MTC, which constitute the majority of the contaminations to the CEST signal at high B1. However, due to the incomplete suppression of MTC asymmetry and the mobile rNOEs, most of the CEST contrasts reported based on MTRasym analysis are more accurately denoted as CEST weighted signals (21,24,29,31).
2. Single frequency MTC compensation techniques
Since the MTC effect is frequency dependent and asymmetric with respect to water, many successful removal methods use the irradiation frequency as a constant for both labeling and control images. Best is to use pulses of the same power and just opposite phase, but if that is not possible the contamination removal then has to exploit one of the unique properties of the MTC pool, such as its extremely short T2 relaxation time or the magnitude of the saturation transfer rate. This can be achieved varying the pulse power, pulse length or the inter-pulse delay. Due to the use of a unique frequency, we call them single frequency MTC compensation techniques.
For pulsed-ASL, Golay et al. suggested a simple MTC compensation approach for the TILT sequence (59), in which the label is performed with two subsequent 90° pulses of equal phase (causing inversion) and the control using two subsequent 90° pulses of opposite phase (i.e., no net excitation) (Fig. 5B). Wong et al. suggested that the subtraction error in PASL is dominated by slice profile imperfections, and that the MTC contamination is small (119). Therefore, they developed a PASL variant focused on improving the inversion profiles, called PICORE (119). Here, the labeling is performed with the normal inversion slab as in EPISTAR, and the control consists of an inversion pulse with the same off-resonance frequency as the inversion pulse in the label experiment, but in the absence of a slab-selective gradient. The MTC effect can also be well suppressed in PCASL. This is achieved due to two reasons; firstly, the gradient amplitude during the RF pulses is much larger than in CASL, causing the offset of the RF irradiation to be far away from the water resonance in the Z-spectrum, which results in a greatly reduced MTC asymmetry contamination. Secondly, and most importantly, the control scan of the PCASL method is recorded by changing the phase of every second RF pulse in the labeling module by 180 degrees, reproducing the MTC effect from the label experiment.
Although the MTC compensation method used in PCASL has been applied in CEST field (124), it introduces many issues due to the complicated pulse profile of the pulse train with alternating phase. In the CERT method, the same pulse shapes are used for both label and control experiments, but with different pulse length and power. The “average” (time-integral) power of the pulses is maintained to obtain equivalent labeling of the MTC pool, while the flip angle is varied to achieve different labeling efficiency for the exchangeable solute protons (85). Another strategy is removing the MTC based on its saturation transfer characteristics, which has been demonstrated using the VDMP pulsed CEST sequence (41) in Fig. 6B. It is important to realize though that the average exchange rate of the MTC component (50-60 Hz) measured with the VDMP sequence depends on the tissue components saturated or excited (and thus the B1 power and length). This average is for all fast- and slow-exchange protons in the saturated MTC pool (125), while the exchange rate of the slow-exchanging protons in MTC is known to be only of the order of 6-20 Hz (63,68). However, the suppression for a particular set of parameters can be achieved by experimentally optimizing the pulse delay (mixing time). The VDMP buildup curve, i.e. the CEST signal as a function of mixing time, shows distinguishable characteristics for protons with different exchange rates. The MTC can then be removed by subtracting images acquired at two mixing times at which the MTC signals are equal, while the APT and rNOE-CEST signals will be retained due to their much lower exchange rates (41).
3. MTC compensation without a control scan
Finally, MTC components in pulsed CEST can be removed using the time evolution properties of the magnetization in the Fourier transform of the Z-spectrum. This simple approach exploits the principle that the T2 of semi-solid protons is in the microsecond range, leading to a fast decay in the time domain that can be filtered out. This has been used in the first in vivo applications of the FLEX method (83,126) and also suggested to be possible through additional post-processing of the Z-spectrum, using the so-called time-domain removal of irrelevant magnetization (TRIM) approach (127).
The MTC contamination has been well solved in the ASL field. However, it is still a challenging problem in CEST studies, especially due to the occurrence of rNOEs in both semisolid tissue components (i.e. the MTC effect) and mobile proteins.
Hardware, Duty Cycle and Saturation Efficiency Considerations
On the clinical scanners, the RF pulse length usually is limited to less than 100-200 ms due to the RF amplifier restrictions (maximum pulse length and duty-cycle set by the manufacturer to protect the equipment). Also, the specific absorption rate (SAR) potentially is a consideration for both ASL and CEST sequences. Therefore, the CASL method is generally not used on clinical scanners anymore, primarily due to the high demand on RF duty cycle. However, CASL is widely used in animal scanners, where SAR is not an issue. MTC effects are of course still an issue, especially due to the increased MTR asymmetry at high field strengths, but this can be overcome using a two-coil setup (128,129) with a dedicated small labeling coil placed over the feeding arteries. As an additional bonus, since such a coil has a limited spatial coverage, the RF labeling pulses do not affect the macromolecules in the tissue of interest and the ASL signal will be free from confounding MTC effects.
Similar to the CASL method, CW-CEST also is not commonly used on clinical scanners. In order to reach maximum CEST signal, the length of the saturation pulse in CW-CEST would be best set to about two to three seconds for low saturation powers (13,14,51–54). Unfortunately, a much shorter saturation time (<1s) has been mandated for use on clinical scanners due to RF amplifier limitations (55–57). Recently, however, a novel parallel RF transmission based scheme has been proposed to elongate the total saturation time, enhancing the CEST signal on clinical scanners (130). Most clinical scanners now have a dual transmit mode for the body coil. During the RF saturation pulse, these two RF amplifiers can be operated in an alternating fashion, allowing the RF amplifiers to operate at several μT power while staying within the specified duty-cycle. A saturation time of several seconds for CW-CEST can be reached with this technique even for body coil excitation on human scanners. Usually, the saturation pulse in CW-CEST is a rectangular shaped pulse, which is close to optimum for slow-exchanging protons. The saturation pulse shape can be optimized with the gradient ascent pulse engineering (GRAPE) method, and it was found that a triangle type saturation pulse with rising amplitude can provide higher saturation transfer efficiency on fast-exchanging protons compared to a rectangular shaped pulse with the same RF power (131).
Potential
The above comparison of ASL, CEST and MTC pulse sequences shows many similarities, indicating that several modules of these sequences can be borrowed from each other. For example, image acquisition and background suppression ideas commonly applied in ASL can be implemented in CEST, which is also suffering from low SNR and can be easily deteriorated by motion. Similarly, the important principle exploited in CEST, the accumulation of signal for sensitivity enhancement before image acquisition, can also be applied in the ASL field.
1. Cine-ASL
A first example of the use of repeated label transfer modules in ASL is the cine-ASL approach (132,133), for which the timing diagram is shown in Fig. 10A. The sequence combines an electrocardiogram (ECG)-gated cine-FLASH sequence with a steady-pulsed arterial labeling approach to achieve quasi-continuous tagging. The arterial labeling is achieved by a spatially selective adiabatic hyperbolic secant inversion pulse, which labels the arterial blood just before it enters the myocardial tissue via the coronaries. The control scan is performed by positioning symmetry to the labeling slab with respect to the short axis imaging plane (Fig. 10A). Fig. 10B shows an example of cine-ASL perfusion maps for the healthy mouse heart. This cine-ASL scheme can be treated as an extension of the EPISTAR ASL method. By repeating the EPISTAR labeling module, the perfusion signal can be accumulated in the imaging plane similar to the CEST technique, which results in a doubling of the sensitivity compared to the single-pulse version called the Look-Locker FAIR Gradient Echo (LLFAIRGE) method (134). Cine-ASL allows quantitative assessment of myocardial blood flow (MBF) in both human and animals. Because of the requirement for a symmetric Control/Tag slab configuration in the EPISTAR labeling module, however, only a single slice perfusion image can be recorded in cine-ASL. This can be solved by repeating some alternative labeling schemes such as TILT (59). The cine-ASL sequence also has an analogous CEST/MTC sequence called steady state CEST (39,73), in which a segmented echo-planar imaging (EPI) readout is implemented after every short saturation pulse (see Fig. 10C). Using a cine-FLASH readout, a CEST-encoded cardiac cine MRI sequence has been developed, called CardioCEST (135).
Figure 10.

(A) The location of the Tag and Control slabs in Cine-ASL, which are placed symmetric relative to the imaging slice (green). The pulse sequence scheme shows a triggered FLASH acquisition during diastole combined with RF-pulse labeling applied in end systole at each cardiac cycle. (B) Short-axis perfusion maps measured using a Cine-ASL sequence for a study in which the isoflurane concentration was raised from 1.5% (left) to 2% (right). Perfusion increased from 5.6 to 16.0 mL/g/min with Cine-ASL. (C) The time diagram of the steady pulsed CEST method, which closely resembles the Cine-ASL technique. A saturation pulse is followed by segmented EPI readout. The readout can also be other imaging schemes such as FLASH. Reproduced with permission from Troalen T, et. al. Magn Reson Med 2013;70(5):1389-1398. and Capron T, et. al. Magn Reson Med 2015;74(4):990-998.
2. Multi-pulsed and Steady-Pulsed Imaging Labeling (MPIL and SPIL)
Further examples of LTM-repetition in ASL are the pulsed imaging labeling (PIL) sequences, developed for rapid acquisition of single and multi-slice perfusion images (36). In these approaches (Figs. 11A,B), the UNFAIR labeling module (60), which is modified from the FAIR labeling module by adding one extra global inversion pulse, is repeated instead of the EPISTAR module used in cine-ASL. Again, the principle is similar to pulsed CEST in Figure 7, but here a mixing time (tmix) is used to indicate the delivery period to the tissue. For systems where all blood can be labeled with a single LTM, PIL would not have much of an advantage over UNFAIR. For instance, when performing PIL on small animals using a 72 mm volume coil for transmission, the mixing time can be as long as two seconds for the mouse brain perfusion image since the coil can label all blood in the body and the bolus duration is basically a full body circulation time. However, in most human and some large animal cases, the excitation range of the transmit coil is limited and repeated labeling (bolus application) such as in the MPIL approach (Fig. 11A) can enhance the signal of interest. Fig. 11 C shows a calculation of enhancement comparing one versus multiple LTMs for a bolus duration length of 0.5 s, a tmix of 1 s, and a typical TR of 5s (at 11.7T, using T1 = 2.8s).
Figure 11.
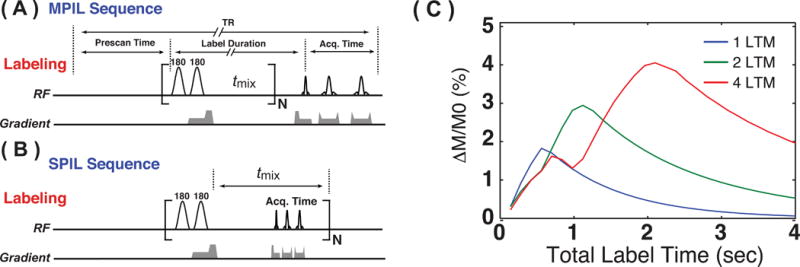
The multiple and steady pulsed imaging and labeling (MPIL and SPIL) approaches. (A) The MPIL sequence is composed of a series of label-transfer modules (LTMs), each containing two adiabatic inversion pulses, and followed by a mixing time (tmix) to enable the labeled water spins to perfuse into the tissue in the image slice. Following the labeling duration, a single slice image is recorded. (B) In SPIL, an image acquisition (FSE sequence) is applied during tmix and this label-transfer-acquisition module is repeated periodically. (C) Simulated MPIL perfusion kinetic curves, i.e. perfusion signal (M/M0) as a function of labeling duration defined in (A) for the short bolus duration (0.5s) with 1, 2, and 4 LTMs (11.7 T; T1 of arterial blood 2.8 s). A,B reproduced with permission from Xu J et. al. Magn Reson Med 2016;75(1):238-248.
Instead of multiple LTMs followed by acquisition, it is also possible to include multi-slice image acquisition within the mixing time and repeat that module, which is done in the SPIL approach (Fig. 11B). Here a steady state is generated that can be optimized for maximum efficiency with respect to the image data acquisition and labeling efficiency (36). Therefore, SPIL can achieve high acquisition efficiency compared to conventional PASL methods. Typical SPIL multi-slice perfusion images of a normal mouse brain are presented in Fig. 12A. In addition, Figs. 12B and C show examples of application to stroke and tumor models, respectively. Although, T2-weighted images do not show clear enhancement in the region with acute ischemia (Fig. 12B), SPIL perfusion images show clear hypoperfusion in the affected right hemisphere. In the tumor model (Fig. 12C), hypoperfusion in the tumor region can be observed, consistent with previous studies on the same model (136).
Figure 12.

(A) Multi-slice SPIL perfusion maps of a normal mouse brain acquired with tmix = 1 s. The control images are shown above the perfusion images for anatomical comparison. (B) Multi-slice T2w images and SPIL perfusion maps of a neonatal mouse brain with unilateral vessel occlusion. (C) Multi-slice T2w images and SPIL perfusion maps for a mouse with a 9L-glioma. The glioma regions show hypoperfusion. Reproduced with permission from Xu J et. al. Magn Reson Med 2016;75(1):238-248.
In addition to the typical advantages of PASL methods (i.e., no MTC background interference and straightforward implementation) SPIL has several unique advantages for performing multi-slice perfusion imaging: (i) it is robust with respect to pulse sequence settings: Arterial blood is saturated by a train of RF pulses, which is insensitive to the pulse flip angle; (ii) the steady state perfusion signal simplifies the quantification of CBF, and makes it less prone to potential confounds affecting other PASL methods such as finite bolus duration and label transition bands; (iii) SPIL perfusion images do not require correction for slice-specific post-label acquisition delays. Therefore, SPIL has potential for widespread application to ASL studies, at least in preclinical models. The MPIL sequence resembles the on-resonance variable delay multiple-pulsed (onVDMP) approach (86), in which a train of binomial pulses similar to the UNFAIR modules in MPIL is used and the inter-pulse delay can be varied to observe signal buildup.
3. Multiple velocity-selective saturation (VSS) modules in VSASL (mm-VSASL)
The mmVSASL approach is another example of how the idea of accumulating signal before acquisition can be used to create new ASL sequences and boost the perfusion signal (137). In this sequence, as also suggested by Norris and Schwarzbauer in their original paper (95), the velocity-selective saturation (VSS) module is repeated several times before image acquisition (Fig. 13), similar to the Multiple Pulsed Imaging Labeling (MPIL) technique (36). Simulations and experimental results on human brain (Fig. 14) suggest that mmVSASL with two VSS modules can reach 20% SNR improvement compared to the VSASL with a single VSS module, which is significantly higher than PASL and comparable to PCASL in terms of SNR (Fig. 14). The mmVSASL approach can also be extended to a steady state version following the cine-ASL and SPIL ideas.
Figure 13.

Sequence diagrams of conventional velocity-selective ASL (VSASL, left), and VSASL with two VSS modules (right). Reproduced with permission from Guo J et. al. Magn Reson Med 2015;74(3):694-705.
Figure 14.
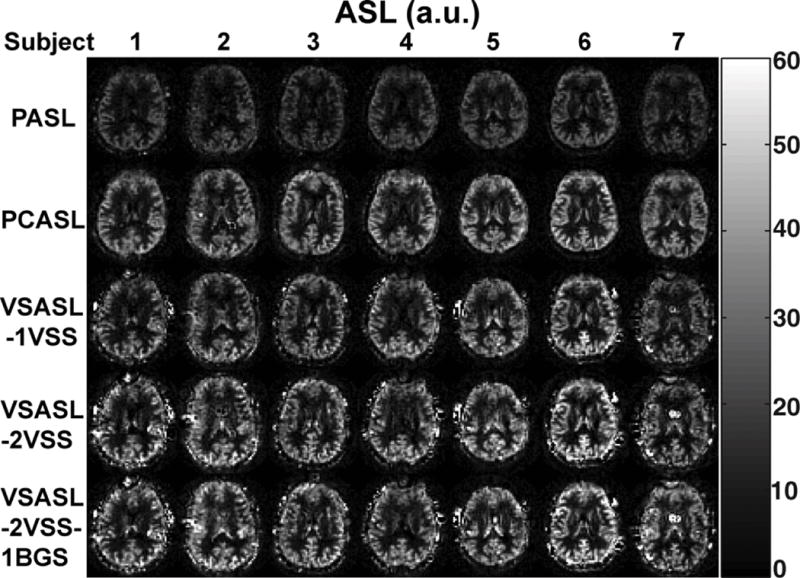
Examples of perfusion maps measured with different preparations in seven subjects. The maps from top to bottom were acquired with PASL, PCASL, VSASL-1VSS (single VSS), VSASL-2VSS (double VSS), and VSASL-2VSS-1BGS (double VSS with background suppression (BGS)). Reproduced with permission from Guo J et. al. Magn Reson Med 2015;74(3):694-705.
4. Studying multiple transfer events
The above examples, while sometimes including multiple transfers within a molecule (intramolecular NOEs), all are based on a “single” exchange transfer event between either two spatial compartments (ASL) or two molecules, i.e. solutes and water (CEST) or semi-solid structures and water (MTC). However, MRI can of course also detect multiple transfers if they are on the appropriate time scale (i.e. within a few T1s). For instance, early MTC studies reported a coupling between some metabolites and water through the semi-solid components in the tissue (138–141). This has recently led to the proposal of an approach that allows study of the exchange interaction between two molecules, a solute and a semi-solid target, through indirect monitoring with water imaging (142). The principle for this technique, which can be used to assess low-affinity molecular binding, is explained and exemplified in Fig. 15. It is called the “IMMOBILISE” approach, for “IMaging of MOlecular BInding using Ligand Immobilization and Saturation Exchange”. Notice that the principle of label refreshment resembles CEST, but is different in that the large substrate pool functions as a reservoir of saturated protons (saturation pump), while protons have to again be saturated in CEST. The data in Figures 15 E,F illustrate that the effect only occurs when the target is immobilized, as the transfer speed upon binding to mobile bovine serum albumin (BSA) is not fast enough. Two important aspects of the approach are that (1) only very low B1 values are needed for generating the saturated solute proton pool and that (2) the difference spectrum has high-resolution features, reflecting the signal origin in the fast tumbling solute molecules. This high specificity is not available in conventional magnetization transfer contrast (MTC) experiments that tend to use indiscriminate labelling and strong RF fields.
Figure 15.

(A-C) Principles of IMMOBILISE (IMaging of MOlecular BInding using Ligand Immobilization and Saturation Exchange) MRI. (A) Non-exchanging protons (CH, CH2 or CH3) in a solute molecule (large ball) that exchanges rapidly between free in solution and bound to an immobile target, are labelled magnetically in the free state (indicated by color change from yellow to red). (B) During binding, the substrate is immobilized, allowing fast transfer of label to protons on the binding target, after which the substrate is released. Spin diffusion rapidly distributes the label over the target protons. Due to continuous irradiation of substrate protons and availability of a large substrate pool, the released molecule is replaced by labeled substrate and the process repeats itself, saturating the target. (C) Ultimately, the MTC process transfers this label to water protons, causing signal loss. (D-H) Demonstration of IMMOBILISE MRI. (D) NMR spectrum of 100 mM caffeine solution. (E) Z-spectrum of bovine serum albumin (BSA) solution (20% w/w) without (Δ) and with (×) 100 mM caffeine for BSA solution. The difference spectrum (“IMMOBILISE” signal) in blue circles shows no effect. (F) The same as (E), but now with the binding target BSA immobilized using cross-linking. The IMMOBILISE spectrum shows the high resolution features of the caffeine CH3 and CH groups similar to (D). (G) Concentration dependence of caffeine in cross-linked BSA. (H) IMMOBILISE-MRI difference maps of 100 mM caffeine in PBS, BSA, and crosslinked BSA plus reference tubes with BSA, crosslinked BSA, and glutaraldehyde solution. Maps show integrated IMMOBILISE signal from −1 to −2 ppm. Frequencies in D–F are relative to the water proton frequency at 0 ppm (4.7 ppm in NMR spectroscopy). Data acquired at 11.7 T using 3 s, 0.5 μT CW saturation pulse. Reproduced, with permission, from Yadav NN et al. Sci Rep. 2017 Aug 31;7(1):10138.
Conclusions
Although the CEST, ASL, and MTC techniques are detecting different phenomena, they closely resemble to each other in terms of labeling and acquisition approaches. Therefore, when developing technologies for either field, it is of interest to have knowledge of all three techniques in order to get insight into principles that can be applied more generally. The three recent examples of cine-ASL, SPIL and mmVSASL illustrate the strength of implementing the idea of enhancing perfusion signal before acquisition, in a way similar to CEST approaches. In addition, novel label transfer approaches that can assess phenomena such as molecular binding (IMMOBILISE) are already being developed. More advanced ASL and CEST techniques will probably be developed in the future by borrowing principles from sequences already existing in some of the techniques.
Acknowledgments
This project was supported by grants from the Swedish Research Council (No. 2015-04170), the Crafoord Foundation, the Swedish Cancer Society (No CAN 2015/251), the Swedish Brain Foundation (No. FO2017-0236), and NIH grants RO1EB019934, RO1EB015032 and P41EB015909.
References
- 1.Williams DS, Detre JA, Leigh JS, Koretsky AP. Magnetic-Resonance-Imaging of Perfusion Using Spin Inversion of Arterial Water. Proc Natl Acad Sci U S A. 1992;89(1):212–216. doi: 10.1073/pnas.89.1.212. [DOI] [PMC free article] [PubMed] [Google Scholar]
- 2.Detre JA, Leigh JS, Williams DS, Koretsky AP. Perfusion imaging. Magn Reson Med. 1992;23(1):37–45. doi: 10.1002/mrm.1910230106. [DOI] [PubMed] [Google Scholar]
- 3.Alsop DC, Detre JA, Golay X, Gunther M, Hendrikse J, Hernandez-Garcia L, Lu H, Macintosh BJ, Parkes LM, Smits M, van Osch MJ, Wang DJ, Wong EC, Zaharchuk G. Recommended implementation of arterial spin-labeled perfusion MRI for clinical applications: A consensus of the ISMRM perfusion study group and the European consortium for ASL in dementia. Magn Reson Med. 2014 doi: 10.1002/mrm.25197. [DOI] [PMC free article] [PubMed] [Google Scholar]
- 4.Pollock JM, Tan H, Kraft RA, Whitlow CT, Burdette JH, Maldjian JA. Arterial spin-labeled MR perfusion imaging: clinical applications. Magn Reson Imaging Clin N Am. 2009;17(2):315–338. doi: 10.1016/j.mric.2009.01.008. [DOI] [PMC free article] [PubMed] [Google Scholar]
- 5.Alsop DC, Dai W, Grossman M, Detre JA. Arterial spin labeling blood flow MRI: its role in the early characterization of Alzheimer’s disease. J Alzheimers Dis. 2010;20(3):871–880. doi: 10.3233/JAD-2010-091699. [DOI] [PMC free article] [PubMed] [Google Scholar]
- 6.Balaban RS, Ceckler TL. Magnetization transfer contrast in magnetic resonance imaging. Magnetic Resonance Quarterly. 1992;8(2):116–137. [PubMed] [Google Scholar]
- 7.Henkelman RM, Huang X, Xiang QS, Stanisz GJ, Swanson SD, Bronskill MJ. Quantitative interpretation of magnetization transfer. Magn Reson Med. 1993;29(6):759–766. doi: 10.1002/mrm.1910290607. [DOI] [PubMed] [Google Scholar]
- 8.Pike GB. Pulsed magnetization transfer contrast in gradient echo imaging: a two-pool analytic description of signal response. Magn Reson Med. 1996;36(1):95–103. doi: 10.1002/mrm.1910360117. [DOI] [PubMed] [Google Scholar]
- 9.Stanisz GJ, Kecojevic A, Bronskill MJ, Henkelman RM. Characterizing white matter with magnetization transfer and T(2) Magn Reson Med. 1999;42(6):1128–1136. doi: 10.1002/(sici)1522-2594(199912)42:6<1128::aid-mrm18>3.0.co;2-9. [DOI] [PubMed] [Google Scholar]
- 10.Wolff S, Balaban R. NMR imaging of labile proton exchange. J Magn Reson. 1990;86:164–169. [Google Scholar]
- 11.Zhou J, van Zijl PCM. Chemical exchange saturation transfer imaging and spectroscopy. Progress in Nuclear Magnetic Resonance Spectroscopy. 2006;48(2–3):109–136. [Google Scholar]
- 12.Sherry AD, Woods M. Chemical Exchange Saturation Transfer Contrast Agents for Magnetic Resonance Imaging. Annual Review of Biomedical Engineering. 2008;10(1):391–411. doi: 10.1146/annurev.bioeng.9.060906.151929. [DOI] [PMC free article] [PubMed] [Google Scholar]
- 13.Aime S, Castelli DD, Crich SG, Gianolio E, Terreno E. Pushing the sensitivity envelope of lanthanide-based magnetic resonance imaging (MRI) contrast agents for molecular imaging applications. Acc Chem Res. 2009;42(7):822–831. doi: 10.1021/ar800192p. [DOI] [PubMed] [Google Scholar]
- 14.Liu G, Gilad AA, Bulte JWM, van Zijl PCM, McMahon MT. High-throughput screening of chemical exchange saturation transfer MR contrast agents. Contrast Media & Molecular Imaging. 2010;5(3):162–170. doi: 10.1002/cmmi.383. [DOI] [PMC free article] [PubMed] [Google Scholar]
- 15.van Zijl PCM, Yadav NN. Chemical exchange saturation transfer (CEST): What is in a name and what isn’t? Magn Reson Med. 2011;65(4):927–948. doi: 10.1002/mrm.22761. [DOI] [PMC free article] [PubMed] [Google Scholar]
- 16.van Zijl PCM, Sehgal AA. Proton Chemical Exchange Saturation Transfer (CEST) MRS and MRI. eMagRes. 2016;5(2):1–26. [Google Scholar]
- 17.van Zijl PCM, Lam WW, Xu J, Knutsson L, Stanisz GJ. Magnetization Transfer Contrast and Chemical Exchange Saturation Transfer MRI. Features and analysis of the field-dependent saturation spectrum. Neuroimage. 2017 doi: 10.1016/j.neuroimage.2017.1004.1045. [DOI] [PMC free article] [PubMed] [Google Scholar]
- 18.McMahon Michael T, Gilad Assaf A, Bulte Jeff WM. Zijl PCMv Chemical Exchange Saturation Transfer Imaging: Advances and Applications: Pan Stanford. 2017 [Google Scholar]
- 19.Jones KM, Pollard AC, Pagel MD. Clinical applications of chemical exchange saturation transfer (CEST) MRI. J Magn Reson Imaging. 2017 doi: 10.1002/jmri.25838. [DOI] [PMC free article] [PubMed] [Google Scholar]
- 20.van Zijl PC, Jones CK, Ren J, Malloy CR, Sherry AD. MRI detection of glycogen in vivo by using chemical exchange saturation transfer imaging (glycoCEST) Proc Natl Acad Sci U S A. 2007;104(11):4359–4364. doi: 10.1073/pnas.0700281104. [DOI] [PMC free article] [PubMed] [Google Scholar]
- 21.Ling W, Regatte RR, Navon G, Jerschow A. Assessment of glycosaminoglycan concentration in vivo by chemical exchange-dependent saturation transfer (gagCEST) Proc Natl Acad Sci U S A. 2008;105(7):2266–2270. doi: 10.1073/pnas.0707666105. [DOI] [PMC free article] [PubMed] [Google Scholar]
- 22.Chan KW, McMahon MT, Kato Y, Liu G, Bulte JW, Bhujwalla ZM, Artemov D, van Zijl PC. Natural D-glucose as a biodegradable MRI contrast agent for detecting cancer. Magn Reson Med. 2012;68(6):1764–1773. doi: 10.1002/mrm.24520. [DOI] [PMC free article] [PubMed] [Google Scholar]
- 23.Walker-Samuel S, Ramasawmy R, Torrealdea F, Rega M, Rajkumar V, Johnson SP, Richardson S, Goncalves M, Parkes HG, Arstad E, Thomas DL, Pedley RB, Lythgoe MF, Golay X. In vivo imaging of glucose uptake and metabolism in tumors. Nat Med. 2013;19(8):1067–1072. doi: 10.1038/nm.3252. [DOI] [PMC free article] [PubMed] [Google Scholar]
- 24.Zhou J, Payen JF, Wilson DA, Traystman RJ, van Zijl PC. Using the amide proton signals of intracellular proteins and peptides to detect pH effects in MRI. Nat Med. 2003;9(8):1085–1090. doi: 10.1038/nm907. [DOI] [PubMed] [Google Scholar]
- 25.Sun PZ, Zhou J, Sun W, Huang J, van Zijl PCM. Detection of the ischemic penumbra using pH-weighted MRI. J Cereb Blood Flow Metab. 2006;27(6):1129–1136. doi: 10.1038/sj.jcbfm.9600424. [DOI] [PubMed] [Google Scholar]
- 26.Zhou J, Tryggestad E, Wen Z, Lal B, Zhou T, Grossman R, Wang S, Yan K, Fu DX, Ford E, Tyler B, Blakeley J, Laterra J, van Zijl PC. Differentiation between glioma and radiation necrosis using molecular magnetic resonance imaging of endogenous proteins and peptides. Nat Med. 2011;17(1):130–134. doi: 10.1038/nm.2268. [DOI] [PMC free article] [PubMed] [Google Scholar]
- 27.Xu J, Yadav NN, Bar-Shir A, Jones CK, Chan KW, Zhang J, Walczak P, McMahon MT, van Zijl PC. Variable delay multi-pulse train for fast chemical exchange saturation transfer and relayed-nuclear overhauser enhancement MRI. Magn Reson Med. 2014;71(5):1798–1812. doi: 10.1002/mrm.24850. [DOI] [PMC free article] [PubMed] [Google Scholar]
- 28.Heo HY, Zhang Y, Burton TM, Jiang S, Zhao Y, van Zijl PCM, Leigh R, Zhou J. Improving the detection sensitivity of pH-weighted amide proton transfer MRI in acute stroke patients using extrapolated semisolid magnetization transfer reference signals. Magn Reson Med. 2017 doi: 10.1002/mrm.26799. [DOI] [PMC free article] [PubMed] [Google Scholar]
- 29.Cai K, Haris M, Singh A, Kogan F, Greenberg JH, Hariharan H, Detre JA, Reddy R. Magnetic resonance imaging of glutamate. Nat Med. 2012;18(2):302–306. doi: 10.1038/nm.2615. [DOI] [PMC free article] [PubMed] [Google Scholar]
- 30.Jin T, Wang P, Zong X, Kim S-G. Magnetic resonance imaging of the Amine–Proton EXchange (APEX) dependent contrast. NeuroImage. 2012;59(2):1218–1227. doi: 10.1016/j.neuroimage.2011.08.014. [DOI] [PMC free article] [PubMed] [Google Scholar]
- 31.Haris M, Singh A, Cai K, Kogan F, McGarvey J, Debrosse C, Zsido GA, Witschey WR, Koomalsingh K, Pilla JJ, Chirinos JA, Ferrari VA, Gorman JH, Hariharan H, Gorman RC, Reddy R. A technique for in vivo mapping of myocardial creatine kinase metabolism. Nat Med. 2014;20(2):209–214. doi: 10.1038/nm.3436. [DOI] [PMC free article] [PubMed] [Google Scholar]
- 32.Jin T, Wang P, Hitchens TK, Kim SG. Enhancing sensitivity of pH-weighted MRI with combination of amide and guanidyl CEST. Neuroimage. 2017;157:341–350. doi: 10.1016/j.neuroimage.2017.06.007. [DOI] [PMC free article] [PubMed] [Google Scholar]
- 33.Wolff SD, Balaban RS. Magnetization transfer contrast (MTC) and tissue water proton relaxation in vivo. Magn Reson Med. 1989;10(1):135–144. doi: 10.1002/mrm.1910100113. [DOI] [PubMed] [Google Scholar]
- 34.Bryant RG. The dynamics of water-protein interactions. Annu Rev Biophys Biomol Struct. 1996;25:29–53. doi: 10.1146/annurev.bb.25.060196.000333. [DOI] [PubMed] [Google Scholar]
- 35.Henkelman RM, Stanisz GJ, Graham SJ. Magnetization transfer in MRI: a review. NMR Biomed. 2001;14(2):57–64. doi: 10.1002/nbm.683. [DOI] [PubMed] [Google Scholar]
- 36.Xu J, Qin Q, Wu D, Hua J, Song X, McMahon MT, Northington FJ, Zhang J, van Zijl PC, Pekar JJ. Steady pulsed imaging and labeling scheme for noninvasive perfusion imaging. Magn Reson Med. 2016;75(1):238–248. doi: 10.1002/mrm.25641. [DOI] [PMC free article] [PubMed] [Google Scholar]
- 37.Barker PB, Golay X, Zaharchuk G. Clinical Perfusion MRI: Techniques and Applications. Cambridge University Press; 2013. [Google Scholar]
- 38.van Zijl PCM, Zhou J, Mori N, Payen J-F, Wilson D, Mori S. Mechanism of magnetization transfer during on-resonance water saturation. A new approach to detect mobile proteins, peptides, and lipids. Magn Reson Med. 2003;49(3):440–449. doi: 10.1002/mrm.10398. [DOI] [PubMed] [Google Scholar]
- 39.Jones CK, Huang A, Xu J, Edden RA, Schar M, Hua J, Oskolkov N, Zaca D, Zhou J, McMahon MT, Pillai JJ, van Zijl PC. Nuclear Overhauser enhancement (NOE) imaging in the human brain at 7T. NeuroImage. 2013;77C:114–124. doi: 10.1016/j.neuroimage.2013.03.047. [DOI] [PMC free article] [PubMed] [Google Scholar]
- 40.Jin T, Wang P, Zong X, Kim S-G. MR imaging of the amide-proton transfer effect and the pH-insensitive nuclear overhauser effect at 9.4 T. Magn Reson Med. 2013;69(3):760–770. doi: 10.1002/mrm.24315. [DOI] [PMC free article] [PubMed] [Google Scholar]
- 41.Xu X, Yadav NN, Zeng HF, Jones CK, Zhou JY, van Zijl PCM, Xu JD. Magnetization Transfer Contrast-Suppressed Imaging of Amide Proton Transfer and Relayed Nuclear Overhauser Enhancement Chemical Exchange Saturation Transfer Effects in the Human Brain at 7T. Magn Reson Med. 2016;75(1):88–96. doi: 10.1002/mrm.25990. [DOI] [PMC free article] [PubMed] [Google Scholar]
- 42.Otting G, Liepinsh E, Wuthrich K. Protein hydration in aqueous solution. Science. 1991;254(5034):974–980. doi: 10.1126/science.1948083. [DOI] [PubMed] [Google Scholar]
- 43.Hwang TL, van Zijl PC, Mori S. Accurate quantitation of water-amide proton exchange rates using the phase-modulated CLEAN chemical EXchange (CLEANEX-PM) approach with a Fast-HSQC (FHSQC) detection scheme. J Biomol NMR. 1998;11(2):221–226. doi: 10.1023/a:1008276004875. [DOI] [PubMed] [Google Scholar]
- 44.Alsop DC, Detre JA. Reduced transit-time sensitivity in noninvasive magnetic resonance imaging of human cerebral blood flow. J Cerebr Blood F Met. 1996;16(6):1236–1249. doi: 10.1097/00004647-199611000-00019. [DOI] [PubMed] [Google Scholar]
- 45.Barbier EL, Lamalle L, Decorps M. Methodology of brain perfusion imaging. J Magn Reson Imaging. 2001;13(4):496–520. doi: 10.1002/jmri.1073. [DOI] [PubMed] [Google Scholar]
- 46.Zhou J, Wilson DA, Sun PZ, Klaus JA, Van Zijl PC. Quantitative description of proton exchange processes between water and endogenous and exogenous agents for WEX, CEST, and APT experiments. Magn Reson Med. 2004;51(5):945–952. doi: 10.1002/mrm.20048. [DOI] [PubMed] [Google Scholar]
- 47.Woessner DE, Zhang S, Merritt ME, Sherry AD. Numerical solution of the Bloch equations provides insights into the optimum design of PARACEST agents for MRI. Magn Reson Med. 2005;53(4):790–799. doi: 10.1002/mrm.20408. [DOI] [PubMed] [Google Scholar]
- 48.Zaiss M, Bachert P. Exchange-dependent relaxation in the rotating frame for slow and intermediate exchange – modeling off-resonant spin-lock and chemical exchange saturation transfer. NMR Biomed. 2013;26(5):507–518. doi: 10.1002/nbm.2887. [DOI] [PubMed] [Google Scholar]
- 49.Swanson SD. Broadband excitation and detection of cross-relaxation NMR spectra. J Magn Reson. 1991;95(3):615–618. [Google Scholar]
- 50.Xu X, Lee JS, Jerschow A. Ultrafast scanning of exchangeable sites by NMR spectroscopy. Angew Chem Int Ed Engl. 2013;52(32):8281–8284. doi: 10.1002/anie.201303255. [DOI] [PMC free article] [PubMed] [Google Scholar]
- 51.Zaiss M, Bachert P. Chemical exchange saturation transfer (CEST) and MR Z-spectroscopy in vivo: a review of theoretical approaches and methods. Phys Med Biol. 2013;58(22):R221–269. doi: 10.1088/0031-9155/58/22/R221. [DOI] [PubMed] [Google Scholar]
- 52.Xu X, Yadav NN, Song X, McMahon MT, Jerschow A, van Zijl PC, Xu J. Screening CEST contrast agents using ultrafast CEST imaging. J Magn Reson. 2016;265:224–229. doi: 10.1016/j.jmr.2016.02.015. [DOI] [PMC free article] [PubMed] [Google Scholar]
- 53.Liu Z, Dimitrov IE, Lenkinski RE, Hajibeigi A, Vinogradov E. UCEPR: Ultrafast localized CEST-spectroscopy with PRESS in phantoms and in vivo. Magn Reson Med. 2016;75(5):1875–1885. doi: 10.1002/mrm.25780. [DOI] [PMC free article] [PubMed] [Google Scholar]
- 54.Wilson NE, D’Aquilla K, Debrosse C, Hariharan H, Reddy R. Localized, gradient-reversed ultrafast z-spectroscopy in vivo at 7T. Magn Reson Med. 2016;76(4):1039–1046. doi: 10.1002/mrm.26314. [DOI] [PMC free article] [PubMed] [Google Scholar]
- 55.Kwong KK, Chesler DA, Weisskoff RM, Donahue KM, Davis TL, Ostergaard L, Campbell TA, Rosen BR. MR perfusion studies with T1-weighted echo planar imaging. Magn Reson Med. 1995;34(6):878–887. doi: 10.1002/mrm.1910340613. [DOI] [PubMed] [Google Scholar]
- 56.Kim SG. Quantification of relative cerebral blood flow change by flow-sensitive alternating inversion recovery (FAIR) technique: application to functional mapping. Magn Reson Med. 1995;34(3):293–301. doi: 10.1002/mrm.1910340303. [DOI] [PubMed] [Google Scholar]
- 57.Kim SG, Tsekos NV, Ashe J. Multi-slice perfusion-based functional MRI using the FAIR technique: Comparison of CBF and BOLD effects. NMR Biomed. 1997;10(4–5):191–196. doi: 10.1002/(sici)1099-1492(199706/08)10:4/5<191::aid-nbm460>3.0.co;2-r. [DOI] [PubMed] [Google Scholar]
- 58.Petersen ET, Zimine I, Ho YC, Golay X. Non-invasive measurement of perfusion: a critical review of arterial spin labelling techniques. Br J Radiol. 2006;79(944):688–701. doi: 10.1259/bjr/67705974. [DOI] [PubMed] [Google Scholar]
- 59.Golay X, Stuber M, Pruessmann KP, Meier D, Boesiger P. Transfer insensitive labeling technique (TILT): Application to multislice functional perfusion imaging. Jmri-J Magn Reson Im. 1999;9(3):454–461. doi: 10.1002/(sici)1522-2586(199903)9:3<454::aid-jmri14>3.0.co;2-b. [DOI] [PubMed] [Google Scholar]
- 60.Tanabe JL, Yongbi M, Branch C, Hrabe J, Johnson G, Helpern JA. MR perfusion imaging in human brain using the UNFAIR technique. Jmri-J Magn Reson Im. 1999;9(6):761–767. doi: 10.1002/(sici)1522-2586(199906)9:6<761::aid-jmri2>3.0.co;2-c. [DOI] [PubMed] [Google Scholar]
- 61.Zhou J, Mori S, van Zijl PC. FAIR excluding radiation damping (FAIRER) Magn Reson Med. 1998;40(5):712–719. doi: 10.1002/mrm.1910400511. [DOI] [PubMed] [Google Scholar]
- 62.Gochberg DF, Gore JC. Quantitative imaging of magnetization transfer using an inversion recovery sequence. Magn Reson Med. 2003;49(3):501–505. doi: 10.1002/mrm.10386. [DOI] [PubMed] [Google Scholar]
- 63.Xu J, Li K, Zu Z, Li X, Gochberg DF, Gore JC. Quantitative magnetization transfer imaging of rodent glioma using selective inversion recovery. NMR Biomed. 2014;27(3):253–260. doi: 10.1002/nbm.3058. [DOI] [PMC free article] [PubMed] [Google Scholar]
- 64.Zaiss M, Zu Z, Xu J, Schuenke P, Gochberg DF, Gore JC, Ladd ME, Bachert P. A combined analytical solution for chemical exchange saturation transfer and semi-solid magnetization transfer. NMR Biomed. 2015;28(2):217–230. doi: 10.1002/nbm.3237. [DOI] [PMC free article] [PubMed] [Google Scholar]
- 65.Sled JG, Pike GB. Quantitative Interpretation of Magnetization Transfer in Spoiled Gradient Echo MRI Sequences. J Magn Reson. 2000;145(1):24–36. doi: 10.1006/jmre.2000.2059. [DOI] [PubMed] [Google Scholar]
- 66.van Buchem MA, Steens SCA, Vrooman HA, Zwinderman AH, McGowan JC, Rassek M, Engelbrecht V. Global estimation of myelination in the developing brain on the basis of magnetization transfer imaging: A preliminary study. Am J Neuroradiol. 2001;22(4):762–766. [PMC free article] [PubMed] [Google Scholar]
- 67.Ropele S, Seifert T, Enzinger C, Fazekas F. Method for quantitative imaging of the macromolecular 1H fraction in tissues. Magn Reson Med. 2003;49(5):864–871. doi: 10.1002/mrm.10427. [DOI] [PubMed] [Google Scholar]
- 68.Jiang X, van Gelderen P, Duyn JH. Spectral characteristics of semisolid protons in human brain white matter at 7 T. Magn Reson Med. 2017;78(5):1950–1958. doi: 10.1002/mrm.26594. [DOI] [PMC free article] [PubMed] [Google Scholar]
- 69.Ng M-C, Hua J, Hu Y, Luk KD, Lam EY. Magnetization transfer (MT) asymmetry around the water resonance in human cervical spinal cord. J Magn Reson Imaging. 2009;29(3):523–528. doi: 10.1002/jmri.21610. [DOI] [PMC free article] [PubMed] [Google Scholar]
- 70.Dai WY, Garcia D, de Bazelaire C, Alsop DC. Continuous Flow-Driven Inversion for Arterial Spin Labeling Using Pulsed Radio Frequency and Gradient Fields. Magn Reson Med. 2008;60(6):1488–1497. doi: 10.1002/mrm.21790. [DOI] [PMC free article] [PubMed] [Google Scholar]
- 71.Sun PZ, Benner T, Kumar A, Sorensen AG. Investigation of optimizing and translating pH-sensitive pulsed-chemical exchange saturation transfer (CEST) imaging to a 3T clinical scanner. Magn Reson Med. 2008;60(4):834–841. doi: 10.1002/mrm.21714. [DOI] [PMC free article] [PubMed] [Google Scholar]
- 72.Zhu H, Jones CK, van Zijl PC, Barker PB, Zhou J. Fast 3D chemical exchange saturation transfer (CEST) imaging of the human brain. Magn Reson Med. 2010;64(3):638–644. doi: 10.1002/mrm.22546. [DOI] [PMC free article] [PubMed] [Google Scholar]
- 73.Jones CK, Polders D, Hua J, Zhu H, Hoogduin HJ, Zhou J, Luijten P, van Zijl PC. In vivo three-dimensional whole-brain pulsed steady-state chemical exchange saturation transfer at 7 T. Magn Reson Med. 2012;67(6):1579–1589. doi: 10.1002/mrm.23141. [DOI] [PMC free article] [PubMed] [Google Scholar]
- 74.van Gelderen P, Jiang X, Duyn JH. Rapid measurement of brain macromolecular proton fraction with transient saturation transfer MRI. Magn Reson Med. 2017;77(6):2174–2185. doi: 10.1002/mrm.26304. [DOI] [PMC free article] [PubMed] [Google Scholar]
- 75.Yarnykh VL. Pulsed Z-spectroscopic imaging of cross-relaxation parameters in tissues for human MRI: Theory and clinical applications. Magn Reson Med. 2002;47(5):929–939. doi: 10.1002/mrm.10120. [DOI] [PubMed] [Google Scholar]
- 76.Pike GB, Glover GH, Hu BS, Enzmann DR. Pulsed magnetization transfer spin-echo MR imaging. J Magn Reson Imaging. 1993;3(3):531–539. doi: 10.1002/jmri.1880030316. [DOI] [PubMed] [Google Scholar]
- 77.Friedman JI, McMahon MT, Stivers JT, Van Zijl PC. Indirect detection of labile solute proton spectra via the water signal using frequency-labeled exchange (FLEX) transfer. Journal of the American Chemical Society. 2010;132(6):1813–1815. doi: 10.1021/ja909001q. [DOI] [PMC free article] [PubMed] [Google Scholar]
- 78.Vinogradov E, Zhang S, Lubag A, Balschi JA, Sherry AD, Lenkinski RE. On-resonance low B1 pulses for imaging of the effects of PARACEST agents. J Magn Reson. 2005;176(1):54–63. doi: 10.1016/j.jmr.2005.05.016. [DOI] [PubMed] [Google Scholar]
- 79.Scheidegger R, Vinogradov E, Alsop DC. Amide proton transfer imaging with improved robustness to magnetic field inhomogeneity and magnetization transfer asymmetry using saturation with frequency alternating RF irradiation. Magn Reson Med. 2011;66(5):1275–1285. doi: 10.1002/mrm.22912. [DOI] [PMC free article] [PubMed] [Google Scholar]
- 80.Song X, Gilad AA, Joel S, Liu G, Bar-Shir A, Liang Y, Gorelik M, Pekar JJ, van Zijl PC, Bulte JW, McMahon MT. CEST phase mapping using a length and offset varied saturation (LOVARS) scheme. Magn Reson Med. 2012;68(4):1074–1086. doi: 10.1002/mrm.23312. [DOI] [PMC free article] [PubMed] [Google Scholar]
- 81.Yadav NN, Jones CK, Xu J, Bar-Shir A, Gilad AA, McMahon MT, Zijl PCMv. Detection of rapidly exchanging compounds using on-resonance frequency labeled exchange (FLEX) transfer. Magn Reson Med. 2012;68:1048. doi: 10.1002/mrm.24420. [DOI] [PMC free article] [PubMed] [Google Scholar]
- 82.Zu Z, Janve VA, Xu J, Does MD, Gore JC, Gochberg DF. A new method for detecting exchanging amide protons using chemical exchange rotation transfer. Magn Reson Med. 2013;69(3):637–647. doi: 10.1002/mrm.24284. [DOI] [PMC free article] [PubMed] [Google Scholar]
- 83.Yadav NN, Jones CK, Hua J, Xu J, van Zijl PC. Imaging of endogenous exchangeable proton signals in the human brain using frequency labeled exchange transfer imaging. Magn Reson Med. 2013;69(4):966–973. doi: 10.1002/mrm.24655. [DOI] [PMC free article] [PubMed] [Google Scholar]
- 84.Zeng H, Xu J, Yadav NN, McMahon MT, Harden B, Frueh D, van Zijl PC. (15)N Heteronuclear Chemical Exchange Saturation Transfer MRI. J Am Chem Soc. 2016;138(35):11136–11139. doi: 10.1021/jacs.6b06421. [DOI] [PubMed] [Google Scholar]
- 85.Zu Z, Louie EA, Lin EC, Jiang X, Does MD, Gore JC, Gochberg D. Chemical exchange rotation transfer imaging of intermediate-exchanging amines at 2 ppm. NMR Biomed. 2017;30(10) doi: 10.1002/nbm.3756. [DOI] [PMC free article] [PubMed] [Google Scholar]
- 86.Xu J, Chan KW, Xu X, Yadav N, Liu G, van Zijl PC. On-resonance variable delay multipulse scheme for imaging of fast-exchanging protons and semisolid macromolecules. Magn Reson Med. 2017;77(2):730–739. doi: 10.1002/mrm.26165. [DOI] [PMC free article] [PubMed] [Google Scholar]
- 87.Garcia S, Chavez L, Lowery TJ, Han SI, Wemmer DE, Pines A. Sensitivity enhancement by exchange mediated magnetization transfer of the xenon biosensor signal. J Magn Reson. 2007;184(1):72–77. doi: 10.1016/j.jmr.2006.09.010. [DOI] [PubMed] [Google Scholar]
- 88.Martinho RP, Novakovic M, Olsen GL, Frydman L. Heteronuclear 1D and 2D NMR Resonances Detected by Chemical Exchange Saturation Transfer to Water. Angew Chem Int Ed Engl. 2017;56(13):3521–3525. doi: 10.1002/anie.201611733. [DOI] [PubMed] [Google Scholar]
- 89.Zu Z, Janve VA, Li K, Does MD, Gore JC, Gochberg DF. Multi-angle ratiometric approach to measure chemical exchange in amide proton transfer imaging. Magn Reson Med. 2012;68(3):711–719. doi: 10.1002/mrm.23276. [DOI] [PMC free article] [PubMed] [Google Scholar]
- 90.Chen L, Xu X, Zeng H, Chan K, Yadav NN, Cai S, Schunke KJ, Faraday N, van Zijl PCM, Xu J. Separating Fast and Slow Exchange Transfer and Magnetization Transfer Using Off-resonance Variable Delay Multiple Pulse (VDMP) MRI. Magn Reson Med. 2018 doi: 10.1002/mrm.27111. [DOI] [PMC free article] [PubMed] [Google Scholar]
- 91.Song X, Xu J, Xia S, Yadav NN, Lal B, Laterra J, Bulte JW, van Zijl PC, McMahon MT. Multi-echo length and offset VARied saturation (MeLOVARS) method for improved CEST imaging. Magn Reson Med. 2015;73(2):488–496. doi: 10.1002/mrm.25567. [DOI] [PMC free article] [PubMed] [Google Scholar]
- 92.Friedman JI, Xia D, Regatte RR, Jerschow A. Transfer Rate Edited experiment for the selective detection of Chemical Exchange via Saturation Transfer (TRE-CEST) J Magn Reson. 2015;256:43–51. doi: 10.1016/j.jmr.2015.04.010. [DOI] [PMC free article] [PubMed] [Google Scholar]
- 93.Wu WC, Fernandez-Seara M, Detre JA, Wehrli FW, Wang J. A theoretical and experimental investigation of the tagging efficiency of pseudocontinuous arterial spin labeling. Magn Reson Med. 2007;58(5):1020–1027. doi: 10.1002/mrm.21403. [DOI] [PubMed] [Google Scholar]
- 94.Jung Y, Wong EC, Liu TT. Multiphase pseudocontinuous arterial spin labeling (MP-PCASL) for robust quantification of cerebral blood flow. Magn Reson Med. 2010;64(3):799–810. doi: 10.1002/mrm.22465. [DOI] [PubMed] [Google Scholar]
- 95.Norris DG, Schwarzbauer C. Velocity selective radiofrequency pulse trains. J Magn Reson. 1999;137(1):231–236. doi: 10.1006/jmre.1998.1690. [DOI] [PubMed] [Google Scholar]
- 96.Wong EC, Cronin M, Wu WC, Inglis B, Frank LR, Liu TT. Velocity-selective arterial spin labeling. Magn Reson Med. 2006;55(6):1334–1341. doi: 10.1002/mrm.20906. [DOI] [PubMed] [Google Scholar]
- 97.Qiu D, Straka M, Zun Z, Bammer R, Moseley ME, Zaharchuk G. CBF measurements using multidelay pseudocontinuous and velocity-selective arterial spin labeling in patients with long arterial transit delays: comparison with xenon CT CBF. J Magn Reson Imaging. 2012;36(1):110–119. doi: 10.1002/jmri.23613. [DOI] [PMC free article] [PubMed] [Google Scholar]
- 98.Qin Q, van Zijl PC. Velocity-selective-inversion prepared arterial spin labeling. Magn Reson Med. 2016;76(4):1136–1148. doi: 10.1002/mrm.26010. [DOI] [PMC free article] [PubMed] [Google Scholar]
- 99.Jezzard P, Chappell MA, Okell TW. Arterial spin labeling for the measurement of cerebral perfusion and angiography. J Cereb Blood Flow Metab. 2017 doi: 10.1177/0271678X17743240. [DOI] [PMC free article] [PubMed] [Google Scholar]
- 100.Hernandez-Garcia L, Lahiri A, Schollenberger J. Recent progress in ASL. Neuroimage. 2018 doi: 10.1016/j.neuroimage.2017.1012.1095. [DOI] [PMC free article] [PubMed] [Google Scholar]
- 101.Matson GB. Design strategies for improved velocity-selective pulse sequences. Magn Reson Imaging. 2017;44:146–156. doi: 10.1016/j.mri.2017.09.006. [DOI] [PubMed] [Google Scholar]
- 102.Li W, Xu F, Schar M, Liu J, Shin T, Zhao Y, van Zijl PCM, Wasserman BA, Qiao Y, Qin Q. Whole-brain arteriography and venography: Using improved velocity-selective saturation pulse trains. Magn Reson Med. 2018;79(4):2014–2023. doi: 10.1002/mrm.26864. [DOI] [PMC free article] [PubMed] [Google Scholar]
- 103.Andrasko J. Water diffusion permeability of human erythrocytes studied by a pulsed gradient NMR technique. Biochim Biophys Acta. 1976;428(2):304–311. doi: 10.1016/0304-4165(76)90038-6. [DOI] [PubMed] [Google Scholar]
- 104.Van Zijl PC, Moonen CT, Faustino P, Pekar J, Kaplan O, Cohen JS. Complete separation of intracellular and extracellular information in NMR spectra of perfused cells by diffusion-weighted spectroscopy. Proc Natl Acad Sci U S A. 1991;88(8):3228–3232. doi: 10.1073/pnas.88.8.3228. [DOI] [PMC free article] [PubMed] [Google Scholar]
- 105.Pilatus U, Shim H, Artemov D, Davis D, van Zijl PC, Glickson JD. Intracellular volume and apparent diffusion constants of perfused cancer cell cultures, as measured by NMR. Magn Reson Med. 1997;37(6):825–832. doi: 10.1002/mrm.1910370605. [DOI] [PubMed] [Google Scholar]
- 106.Price WS, Barzykin AV, Hayamizu K, Tachiya M. A model for diffusive transport through a spherical interface probed by pulsed-field gradient NMR. Biophys J. 1998;74(5):2259–2271. doi: 10.1016/S0006-3495(98)77935-4. [DOI] [PMC free article] [PubMed] [Google Scholar]
- 107.Mori S, van Zijl PC. Diffusion weighting by the trace of the diffusion tensor within a single scan. Magn Reson Med. 1995;33(1):41–52. doi: 10.1002/mrm.1910330107. [DOI] [PubMed] [Google Scholar]
- 108.Wong EC, Cox RW, Song AW. Optimized isotropic diffusion weighting. Magn Reson Med. 1995;34(2):139–143. doi: 10.1002/mrm.1910340202. [DOI] [PubMed] [Google Scholar]
- 109.Lampinen B, Szczepankiewicz F, Martensson J, van Westen D, Sundgren PC, Nilsson M. Neurite density imaging versus imaging of microscopic anisotropy in diffusion MRI: A model comparison using spherical tensor encoding. Neuroimage. 2017;147:517–531. doi: 10.1016/j.neuroimage.2016.11.053. [DOI] [PubMed] [Google Scholar]
- 110.Aslund I, Nowacka A, Nilsson M, Topgaard D. Filter-exchange PGSE NMR determination of cell membrane permeability. J Magn Reson. 2009;200(2):291–295. doi: 10.1016/j.jmr.2009.07.015. [DOI] [PubMed] [Google Scholar]
- 111.Lasic S, Nilsson M, Latt J, Stahlberg F, Topgaard D. Apparent exchange rate mapping with diffusion MRI. Magn Reson Med. 2011;66(2):356–365. doi: 10.1002/mrm.22782. [DOI] [PubMed] [Google Scholar]
- 112.Nilsson M, Latt J, van Westen D, Brockstedt S, Lasic S, Stahlberg F, Topgaard D. Noninvasive mapping of water diffusional exchange in the human brain using filter-exchange imaging. Magn Reson Med. 2013;69(6):1573–1581. doi: 10.1002/mrm.24395. [DOI] [PubMed] [Google Scholar]
- 113.Benjamini D, Komlosh ME, Basser PJ. Imaging Local Diffusive Dynamics Using Diffusion Exchange Spectroscopy MRI. Phys Rev Lett. 2017;118(15):158003. doi: 10.1103/PhysRevLett.118.158003. [DOI] [PMC free article] [PubMed] [Google Scholar]
- 114.Moonen CTW, van Gelderen P, Vuister GW, van Zijl PCM. Gradient-enhanced exchange spectroscopy. J Magn Reson. 1992;97(2):419–425. doi: 10.1016/j.jmr.2011.09.006. [DOI] [PubMed] [Google Scholar]
- 115.Pekar J, Jezzard P, Roberts DA, Leigh JS, Frank JA, McLaughlin AC. Perfusion imaging with compensation for asymmetric magnetization transfer effects. Magn Reson Med. 1996;35(1):70–79. doi: 10.1002/mrm.1910350110. [DOI] [PubMed] [Google Scholar]
- 116.Pruessmann KP, Golay X, Stuber M, Scheidegger MB, Boesiger P. RF pulse concatenation for spatially selective inversion. J Magn Reson. 2000;146(1):58–65. doi: 10.1006/jmre.2000.2107. [DOI] [PubMed] [Google Scholar]
- 117.Edelman RR, Siewert B, Darby DG, Thangaraj V, Nobre AC, Mesulam MM, Warach S. Qualitative Mapping of Cerebral Blood-Flow and Functional Localization with Echo-Planar Mr-Imaging and Signal Targeting with Alternating Radio-Frequency. Radiology. 1994;192(2):513–520. doi: 10.1148/radiology.192.2.8029425. [DOI] [PubMed] [Google Scholar]
- 118.Kim SG, Tsekos NV. Perfusion imaging by a flow-sensitive alternating inversion recovery (FAIR) technique application to functional brain imaging. Magn Reson Med. 1997;37:425–435. doi: 10.1002/mrm.1910370321. [DOI] [PubMed] [Google Scholar]
- 119.Wong EC, Buxton RB, Frank LR. Implementation of quantitative perfusion imaging techniques for functional brain mapping using pulsed arterial spin labeling. NMR Biomed. 1997;10(4–5):237–249. doi: 10.1002/(sici)1099-1492(199706/08)10:4/5<237::aid-nbm475>3.0.co;2-x. [DOI] [PubMed] [Google Scholar]
- 120.Zaiss M, Windschuh J, Goerke S, Paech D, Meissner JE, Burth S, Kickingereder P, Wick W, Bendszus M, Schlemmer HP, Ladd ME, Bachert P, Radbruch A. Downfield-NOE-suppressed amide-CEST-MRI at 7 Tesla provides a unique contrast in human glioblastoma. Magn Reson Med. 2017;77(1):196–208. doi: 10.1002/mrm.26100. [DOI] [PubMed] [Google Scholar]
- 121.Hua J, Jones CK, Blakeley J, Smith SA, van Zijl PC, Zhou J. Quantitative description of the asymmetry in magnetization transfer effects around the water resonance in the human brain. Magn Reson Med. 2007;58(4):786–793. doi: 10.1002/mrm.21387. [DOI] [PMC free article] [PubMed] [Google Scholar]
- 122.T SL, B EL, W DS, S AC, K AP. Multislice perfusion MRI using continuous arterial water labeling: controlling for MT effects with simultaneous proximal and distal RF. sydney: 1998. p. 1998. [Google Scholar]
- 123.Edelman RR, Chen G. Epistar Mri: Multislice Mapping of Cerebral Blood Flow. Magn Reson Med. 1998;40(6):800–805. doi: 10.1002/mrm.1910400603. [DOI] [PubMed] [Google Scholar]
- 124.Narvainen J, Hubbard PL, Kauppinen RA, Morris GA. Z-spectroscopy with Alternating-Phase Irradiation. J Magn Reson. 2010;207(2):242–250. doi: 10.1016/j.jmr.2010.09.004. [DOI] [PubMed] [Google Scholar]
- 125.Xu X, Chan KWC, Liu H, Li Y, Liu G, van Zijl P CM, J Xu. On Resonance VDMP Technique for Improved glucoCEST Detection in Brain Tumors. Singapore Proceedings of the 24th Annual Meeting of ISMRM. 2016:1515. [Google Scholar]
- 126.Lin C-Y, Yadav NN, Friedman JI, Ratnakar J, Sherry AD, van Zijl PCM. Using frequency-labeled exchange transfer to separate out conventional magnetization transfer effects from exchange transfer effects when detecting ParaCEST agents. Magn Reson Med. 2012;67(4):906–911. doi: 10.1002/mrm.24161. [DOI] [PMC free article] [PubMed] [Google Scholar]
- 127.Yadav NN, Chan KW, Jones CK, McMahon MT, van Zijl PC. Time domain removal of irrelevant magnetization in chemical exchange saturation transfer Z-spectra. Magn Reson Med. 2013;70(2):547–555. doi: 10.1002/mrm.24812. [DOI] [PMC free article] [PubMed] [Google Scholar]
- 128.Silva AC, Zhang W, Williams DS, Koretsky AP. Multi-slice MRI of rat brain perfusion during amphetamine stimulation using arterial spin labeling. Magn Reson Med. 1995;33(2):209–214. doi: 10.1002/mrm.1910330210. [DOI] [PubMed] [Google Scholar]
- 129.Zhang W, Silva AC, Williams DS, Koretsky AP. NMR measurement of perfusion using arterial spin labeling without saturation of macromolecular spins. Magn Reson Med. 1995;33(3):370–376. doi: 10.1002/mrm.1910330310. [DOI] [PubMed] [Google Scholar]
- 130.Togao O, Hiwatashi A, Keupp J, Yamashita K, Kikuchi K, Yoshiura T, Yoneyama M, Kruiskamp MJ, Sagiyama K, Takahashi M, Honda H. Amide Proton Transfer Imaging of Diffuse Gliomas: Effect of Saturation Pulse Length in Parallel Transmission-Based Technique. PLoS One. 2016;11(5):e0155925. doi: 10.1371/journal.pone.0155925. [DOI] [PMC free article] [PubMed] [Google Scholar]
- 131.Rancan G, Nguyen TT, Glaser SJ. Gradient ascent pulse engineering for rapid exchange saturation transfer. J Magn Reson. 2015;252:1–9. doi: 10.1016/j.jmr.2014.12.016. [DOI] [PubMed] [Google Scholar]
- 132.Troalen T, Capron T, Cozzone PJ, Bernard M, Kober F. Cine-ASL: a steady-pulsed arterial spin labeling method for myocardial perfusion mapping in mice. Part I. Experimental study. Magn Reson Med. 2013;70(5):1389–1398. doi: 10.1002/mrm.24565. [DOI] [PubMed] [Google Scholar]
- 133.Capron T, Troalen T, Robert B, Jacquier A, Bernard M, Kober F. Myocardial perfusion assessment in humans using steady-pulsed arterial spin labeling. Magn Reson Med. 2015;74(4):990–998. doi: 10.1002/mrm.25479. [DOI] [PubMed] [Google Scholar]
- 134.Kober F, Iltis I, Cozzone PJ, Bernard M. Myocardial blood flow mapping in mice using high-resolution spin labeling magnetic resonance imaging: influence of ketamine/xylazine and isoflurane anesthesia. Magn Reson Med. 2005;53(3):601–606. doi: 10.1002/mrm.20373. [DOI] [PubMed] [Google Scholar]
- 135.Vandsburger M, Vandoorne K, Oren R, Leftin A, Mpofu S, Delli Castelli D, Aime S, Neeman M. Cardio-chemical exchange saturation transfer magnetic resonance imaging reveals molecular signatures of endogenous fibrosis and exogenous contrast media. Circulation Cardiovascular imaging. 2014;8(1) doi: 10.1161/CIRCIMAGING.114.002180. pii: e002180. [DOI] [PubMed] [Google Scholar]
- 136.Sun Y, Schmidt NO, Schmidt K, Doshi S, Rubin JB, Mulkern RV, Carroll R, Ziu M, Erkmen K, Poussaint TY, Black P, Albert M, Burstein D, Kieran MW. Perfusion MRI of U87 brain tumors in a mouse model. Magn Reson Med. 2004;51(5):893–899. doi: 10.1002/mrm.20029. [DOI] [PubMed] [Google Scholar]
- 137.Guo J, Wong EC. Increased SNR efficiency in velocity selective arterial spin labeling using multiple velocity selective saturation modules (mm-VSASL) Magn Reson Med. 2015;74(3):694–705. doi: 10.1002/mrm.25462. [DOI] [PMC free article] [PubMed] [Google Scholar]
- 138.Hinton DP, Bryant RG. 1H magnetic cross-relaxation between multiple solvent components and rotationally immobilized protein. Magn Reson Med. 1996;35(4):497–505. doi: 10.1002/mrm.1910350408. [DOI] [PubMed] [Google Scholar]
- 139.Swanson SD. Protein mediated magnetic coupling between lactate and water protons. J Magn Reson. 1998;135(1):248–255. doi: 10.1006/jmre.1998.1535. [DOI] [PubMed] [Google Scholar]
- 140.Kruiskamp MJ, de Graaf RA, van Vliet G, Nicolay K. Magnetic coupling of creatine/phosphocreatine protons in rat skeletal muscle, as studied by (1)H-magnetization transfer MRS. Magn Reson Med. 1999;42(4):665–672. doi: 10.1002/(sici)1522-2594(199910)42:4<665::aid-mrm7>3.0.co;2-9. [DOI] [PubMed] [Google Scholar]
- 141.Meyerhoff DJ. Proton magnetization transfer of metabolites in human brain. Magn Reson Med. 1999;42(3):417–420. doi: 10.1002/(sici)1522-2594(199909)42:3<417::aid-mrm1>3.0.co;2-t. [DOI] [PubMed] [Google Scholar]
- 142.Yadav NN, Yang X, Li Y, Li W, Liu G, van Zijl PCM. Detection of dynamic substrate binding using MRI. Scientific Reports. 2017;7(1):10138. doi: 10.1038/s41598-017-10545-1. [DOI] [PMC free article] [PubMed] [Google Scholar]