

Abstract
A number of tools based on high-performance affinity separations have been developed for studying drug-protein interactions. An example of one recent approach is ultrafast affinity extraction. This method has been employed to examine the free (or non-bound) fractions of drugs and other solutes in simple or complex samples that contain soluble binding agents. These free fractions have also been used to determine the binding constants and rate constants for the interactions of drugs with these soluble agents. This report describes the general principles of ultrafast affinity extraction and the experimental conditions under which it can be used to characterize such interactions. This method will be illustrated by utilizing data that have been obtained when using this approach to measure the binding and dissociation of various drugs with the serum transport proteins human serum albumin and alpha1-acid glycoprotein. A number of practical factors will be discussed that should be considered in the design and optimization of this approach for use with single-column or multi-column systems. Techniques will also be described for analyzing the resulting data for the determination of free fractions, rate constants and binding constants. In addition, the extension of this method to complex samples, such as clinical specimens, will be considered.
Keywords: ultrafast affinity extraction, human serum albumin, alpha1-acid glycoprotein, drug-protein interactions, affinity microcolumn, high performance affinity chromatography
1. Introduction
The extent of binding by many drugs to serum proteins can play a significant role in determining the eventual activity and fate of these drugs in the circulation [1,2]. This makes the measurement of a drug’s ability to bind to these proteins an important item to consider during the discovery, development and use of a new pharmaceutical [2]. The binding of a drug with agents in blood is often reversible and results in both bound and free fractions for the drug. Because the bound form of a drug cannot usually cross a cell membrane or bind to a receptor, it is the free fraction that often determines the overall activity of the drug [1–4]. Two serum proteins that bind to a broad range of drugs are human serum albumin (HSA) and alpha1-acid glycoprotein (AGP, or orosomucoid) [2]. More complex agents such as lipoproteins can also be involved in binding to drugs in the circulation [5–11].
A number of techniques have been utilized to study and measure the binding of drugs with serum proteins and other biological agents [2,7,12–33]. These methods have included separation-based approaches such as equilibrium dialysis, ultrafiltration, liquid chromatography and capillary electrophoresis. A number of spectroscopic methods have also been employed for this work, such as absorbance, fluorescence, circular dichroism, nuclear magnetic resonance, and surface plasmon resonance spectroscopy. Differential scanning calorimetry and isothermal titration calorimetry have been used as well for this purpose [2,7,12–33].
Another method that has been explored for studying drug-protein binding is high performance affinity chromatography (HPAC) [1,3,34–40]. In HPAC, a biological binding agent is used as a stationary phase for the isolation or analysis of components in a sample [1]. The retention of injected or applied solutes in HPAC is based on the specific and reversible interactions that occur in biological systems (e.g., drug-protein binding). This type of binding is combined in HPAC with supports such as silica particles or monolithic materials that have good mass transfer properties and are capable of withstanding the pressures and flow rates that are present in systems for high performance liquid chromatography [41].
HPAC has been used in a variety of formats to determine binding constants for drug-protein interactions, to study drug-solute competition for proteins, to characterize the binding sites for these processes, and to describe the rates of these interactions [1,42]. Some advantages of using HPAC for this type of work are its speed, precision, ability to be automated, and need for only a small amount of a protein or binding agent. Other attractive features of HPAC are its compatibility with many types of detectors, its good correlation with solution-based methods, and its ability to often reuse the same immobilized binding agent for many samples [1,3,12,42].
Ultrafast affinity extraction is an HPAC technique that has been recently developed for studying drug-protein binding [43–54]. Figure 1 illustrates the basis of this technique. This method uses an affinity microcolumn to extract the free fraction of a drug from a sample on a time scale that minimizes or allows controlled dissociation of the drug from its soluble binding agents. This approach has been used to measure the free fractions of drugs and other solutes in solute/protein mixtures and in biological samples [43–54]. The same method has also been used to determine equilibrium constants and rate constants for drug-protein interactions [49,54].
Figure 1.

The general basis for ultrafast affinity extraction.
This report will describe the general principles of ultrafast affinity extraction and various factors to consider when using this method to characterize drug- or solute-protein interactions. Practical aspects that will be considered will include the types of formats that can be used in this method; factors to optimize when using this method for free fraction measurements; and techniques for analyzing the resulting data to obtain equilibrium constants or rate constants. These items will be illustrated by using data that have been previously acquired by this method for various drugs that are known to bind to HSA or AGP in serum or blood [44–46,52,53].
2. Materials
The chemicals and biochemicals that are used in ultrafast affinity extraction should have known purities and be obtained from sources that have good batch-to-batch reproducibilities for these reagents. All buffers and aqueous solutions that are used in this method should be prepared using deionized water, as obtained from water purification devices such as a Milli-Q Advantage A10 system (Millipore, Billerica, MA, USA) or a NANOpure system (Barnstead, Dubuque, IA, USA). The aqueous buffers and solutions employed in ultrafast affinity extraction should ideally be filtered prior to injection or application to an HPLC system, such as by using 0.22 μm GNWP nylon filters from Fisher Scientific (Pittsburgh, PA,USA) or comparable filtration devices.
2.1. Solution and mobile phase preparation
The mobile phase used for ultrafast affinity extraction should mimic the pH and solution composition of the biological system that is being examined [1]. For the study of drug interactions with serum proteins, one common mobile phase that is used is 0.067 M potassium phosphate buffer, pH 7.4 [42]. This buffer can be prepared by dissolving 7.546 g of monobasic potassium phosphate and 37.724 g of dibasic potassium phosphate in 4.00 L water. The pH of this solution can then be adjusted to 7.40 by the slow addition of low concentrations of either hydrochloric acid or sodium hydroxide. After this buffer has been prepared and filtered, it should be stored at 4ºC when not in use. Other buffers or solutions can also be used as the mobile phase in ultrafast affinity extraction, depending on the nature of the system and types of interactions that are to be characterized.
The drug solutions to be used as standards or to be mixed with proteins should be ideally prepared in the mobile phase and combined with a known amount of the protein or added to a protein solution with a known concentration and that is prepared in the mobile phase. For example, in work with propranolol, a stock solution of 100 μM propranolol can be prepared by dissolving 2.95 mg of propranolol in 100 mL of a 0.067 M phosphate buffer, pH 7.4, and stirring the solution overnight. This stock solution can be diluted with 0.067 M phosphate buffer, pH 7.4, to prepare a 1 μM standard solution. In examining the binding of this drug to AGP, a 4.1 mg portion of AGP can be dissolved in 5 mL of the 1 μM propranolol working solution to give a sample that contains 1 μM propranolol and 20 μM AGP. Other drug and protein combinations can be used to make samples with alternative concentrations. Biological samples such as serum that have a known volume can be spiked directly with a small volume of a solution that contains a known concentration of the drug to be studied [52,53].
A sample/protein mixture that is used in ultrafast affinity extraction should be incubated at the desired temperature for interaction studies (e.g., 37ºC for work under physiological conditions) at least a half hour before it is used in any binding experiments. The individual drug and protein solutions or remaining drug/mixture should be stored, when not in use, under appropriate conditions to provide good stability for these reagents. For serum proteins, this often involves storage of these solutions at 37ºC. However, the length of time over which such solutions can be stored should be determined for each new drug or protein to ensure good stability for these reagents is present over the course of the binding studies.
2.2. Preparation of affinity microcolumns
Immobilized HSA or AGP was used as the stationary phase for the affinity microcolumns in the examples provided in this report because of the ability of these serum proteins to undergo fast and reversible binding to a wide range of drugs, as well as their ability to later elute these drugs under isocratic conditions at a physiological pH [1,48,50,55]. The affinity microcolumns and columns that were used in these prior reports had a typical inner diameter of 2.1 mm and lengths of 0.1–5.0 cm. However, other column dimensions can also be employed for ultrafast affinity extraction as long as the total column residence times are suitable for isolation of a free drug fraction. It was found for many drugs that the desired residence times are usually in the range of approximately 0.1–0.9 s when using HSA or AGP as the soluble binding agent [45,47,49,53,54].
A variety of supports can be used for HSA or AGP immobilization. The specific examples that were utilized in this report used Nucleosil Si-300–7 porous silica (7 μm particle size, 300 Å pore size) from Macherey-Nagel (Duren, Germany). However, other types of porous silica or even monolithic supports can also be modified for use in this type of work [56–58].
Many methods can be used to immobilize HSA onto porous silica or other types of HPLC supports [47,56–58,59–62]. One common example of such a technique is the Schiff base method, which is illustrated in Figure 2(a). In this method, a support such as silica is first converted into or obtained in a diol-bonded form [58,59,60]. This form enables the support to have low non-specific binding for many drugs and biological agents and makes this support easy to further modify for the immobilization of proteins or other binding agents [59,60,63]. The diol groups are then oxidized to aldehyde groups, which can be combined with primary amines on a protein such as HSA to form a Schiff base. The Schiff base is then converted to a secondary amine upon its formation by using sodium cyanoborohydride as a reducing agent. After immobilization has taken place, sodium borohydride is often added to reduce any remaining aldehydes to form alcohol groups [56,59,60].
Figure 2.

(a) The Schiff base method for the immobilization of HSA and (b) the hydrazide method for the immobilization of AGP.
The following conditions can be used to immobilize HSA to Nucleosil Si-300-7 silica by the Schiff base method. To make 0.10 g of HSA silica, 0.10 g of diol silica is first oxidized to form aldehyde groups by placing this support into 2 mL of 90% acetic acid that contains 0.10 g periodic acid. This mixture is covered with aluminum foil and shaken for 2 h at room temperature. The aldehyde-activated silica is then washed several times with water, followed by washing with 0.10 M potassium phosphate buffer, pH 6.0. The aldehyde-activated silica is next suspended in 0.5–1.0 mL of the 0.10 M phosphate buffer, pH 6.0, and combined with 10 mg HSA and 23 mg sodium cyanoborohydride. This mixture is allowed to react, with gentle shaking, for at least 3 days at 4ºC. The support is then washed several times with 0.10 M phosphate buffer, pH 8.0, and suspended in 2–3 mL of this pH 8.0 buffer and combined with 2.5 mg sodium borohydride, which is added in three equal portions over 90 min while the mixture is allowed to react at room temperature in a fume hood. The final support is washed with 0.5 M sodium chloride in 0.10 M potassium phosphate buffer, pH 8.0, followed by further washing with 0.067 M potassium phosphate buffer, pH 7.4. The support can be stored in the 0.067 M phosphate buffer, pH 7.4, and at 4ºC until use. A control support can be prepared in the same manner, but with no protein being added during the immobilization step [47–52].
Several methods have also been applied for immobilizing AGP onto HPLC-grade porous silica [64–66]. The AGP support that was used in this particular study was prepared using hydrazide-activated silica and mildly-oxidized AGP; this procedure has been shown to produce immobilized AGP with drug binding properties that mimic those for soluble AGP [65,66]. This hydrazide method is illustrated in Figure 2(b). In this immobilization scheme, silica is first converted into or obtained in a diol-bonded form and oxidized with periodate to give an aldehyde-activated form [65]. The aldehyde-activated silica is then reacted with an excess of oxalic dihydrazide to give hydrazide-activated support [65], with remaining aldehyde groups on the support later being reduced by adding sodium borohydride. The hydrazide-activated support is then combined with AGP that has undergone mild oxidation to produce aldehyde groups in its carbohydrate chains, which can form a stable hydrazone bond with the support.
The following conditions can be used to immobilize AGP to Nucleosil Si-300-7 silica by the hydrazide method [65]. To make 0.10 g of AGP silica, 0.10 g of diol silica is first oxidized to form aldehyde groups by placing this support into 2 mL of 90% acetic acid that contains 0.10 g periodic acid. This mixture is covered with aluminum foil and shaken for 2 h at room temperature. The aldehyde-activated silica is then washed several times with water. The aldehyde-activated silica is placed into 17.5 mL of a 0.10 M phosphate solution, pH 5.0, and allowed to react for 2 h at room temperature with a five-fold mole excess of oxalic dihydrazide versus the initial diol groups on the support (i.e., 1 mg/mL oxalic dihydrazide, in this case). The support is then washed several times with 0.10 M phosphate buffer, pH 7.0. Any remaining aldehyde groups on the support are reduced by adding 20 mL of 0.10 M potassium phosphate buffer, pH 8.0, that contains a 25-fold mole excess of sodium borohydride versus the initial diol groups, with this mixture being allowed to react for 90 min at room temperature in a fume hood. The final support is washed with 0.10 M phosphate buffer, pH 7.0, before its use in the immobilization of AGP [65].
To make 0.10 g of AGP silica, 10 mg of AGP is next dissolved in 2 mL of a 0.020 M sodium acetate solution, pH 7.0, that also contains 0.15 M sodium chloride, according to the literature for use in the mild oxidation of AGP [66]. This solution is combined in a 1:1 (v/v) ratio with a solution that contains 20 mM periodic acid in the same buffer. This mixture is covered in aluminum foil and allowed to react for 10 min in the dark at room temperature, with the reaction then being quenched by adding 0.25 mL of ethylene glycol per milliliter of solution. These conditions result in approximately five aldehyde groups being generated per AGP [66]. The oxidized AGP can be purified by washing it with 0.10 M phosphate buffer, pH 7.0, in centrifugal filtration devices [64], with the final volume of the AGP solution then being adjusted to 2.0 mL with the same buffer. This solution of oxidized and purified AGP is mixed with 0.10 g of hydrazide-activated silica, placed on an inversion shaker, and allowed to react for one week at 4ºC. The reaction is stopped by centrifuging the slurry, removing the supernatant, and washing the support with 0.10 M phosphate buffer, pH 7.0. Any unreacted hydrazide groups that remain on the support can be capped by adding a ~50-fold mol excess of glyceraldehyde versus the support’s original hydrazide content, with this mixture being shaken for 6 h at 4ºC. The final support is washed with 0.10 M phosphate buffer, pH 7.0, and stored in the same buffer at 4ºC until further use [53,54]. A control support can be prepared in a similar manner but with no AGP being added to the hydrazide-activated silica during the immobilization step.
In the examples that are cited in this report, microcolumns and columns with various sizes (i.e., lengths of 1–50 mm and 2.1 mm i.d.) were used with the immobilized HSA and AGP supports and control supports. For columns that had lengths of 5 mm or longer, the supports were downward slurry packed into stainless steel columns. The packing pressure was usually 4,000 psi (or 28 MPa) for this type of column. For microcolumns that had lengths below 5 mm, the supports were packed in a similar manner but instead used a frit-in-column design [67]. The typical packing pressure for these shorter columns was 3,000 psi (20 MPa). Either set of packing conditions used a neutral buffer such as 0.067 M phosphate buffer, pH 7.4, as the packing solution, with the columns being stored at 4 °C in the same buffer when not in use.
2.3. Apparatus
Most standard HPLC systems can be adapted for use in ultrafast affinity extraction. For the examples given in this report, a single-column chromatographic system for ultrafast affinity extraction usually consisted of such components as a PU-2080 plus pump from Jasco (Easton, MD, USA), a six-port LabPro valve from Rheodyne (Cotati, CA, USA), a Jasco UV-2075 UV absorbance detector, a Jasco AS-2057 plus autosampler, and a Jasco CO-2067 plus column oven. However, other types of pumps, detectors, autoinjectors and equipment for column temperature control can also be employed for this type of system. The general design for this single-column system is shown in Figure 3(a). During the binding experiments that were carried out for the examples cited in this report, the temperature of the column oven was often maintained at 37 ºC, although other temperature can also be utilized. The size used for the microcolumn in this system will depend on the affinity of the injected drug/solute for the immobilized binding agent and the flow rates that are to be used for isolation of the free drug/solute fraction [47,49–52]. However, microcolumn sizes in the range of 1–10 mm long and 2.1 mm I.D. have been used in prior work with this approach, with this size tending to increase as the affinity of the injected drug or solute decreases for the immobilized binding agent [48–53].
Figure 3.
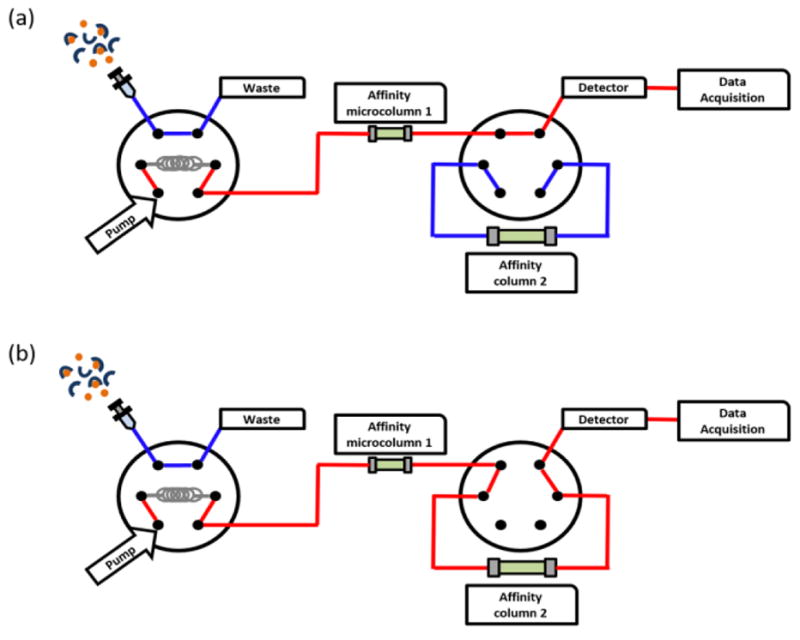
The typical designs for systems used in ultrafast affinity extraction based on (a) a single-column or (b) a two-column system.
As is shown in going from Figure 3(a) to 3(b), the basic set up of a two-column system for ultrafast affinity extraction and the equipment used in this system are similar to those for the single-column system. The main additions are a second column, which is usually larger than the first, and a six-port valve, which is used to place the second affinity column in line with the first column. After elution of the non-retained peak from the first column, the position of the six-port valve is switched to carry a portion of the retained peak from the first column and onto the second affinity column. The components eluting from the second column are then monitored by a device such as an absorbance detector. This two-column approach can be used to provide a higher level of resolution between the retained and non-retained drug fractions than can be obtained when using only a single-column system [53]. Typical sizes for the second column in this system have been 5–25 mm long and 2.1 mm I.D., with the column size that is needed again tending to increase as the affinity of the drug/solute decreases for the immobilized binding agent [48,50,52,53].
3. Methods
3.1. Optimization of ultrafast affinity extraction
The general scheme for the use of a single-column affinity system to measure free drug fractions is shown in Figure 4(a) [54]. First, the drug and protein mixture is allowed to incubate at the desired temperature prior to injection of this mixture onto an affinity microcolumn that contains an immobilized binding agent for the drug (e.g., immobilized HSA or AGP). At low-to-moderate flow rates, some of the protein-bound drug in the sample will dissociate as the sample passes through the microcolumn, as represented by the top portion of Figure 4(a). This dissociated drug increases the measured free drug fraction and provides data that can be used to estimate the dissociation rate constant for the soluble drug-protein complex [54]. As the sample passes through the microcolumn at a sufficiently high flow rate, only the original free fraction of the drug is retained by the microcolumn as the soluble, bound form of the drug and excess soluble protein are eluted as a non-retained peak. As is shown in the bottom portion of Figure 4(a), the free drug fraction that is measured under these conditions can be used to estimate the actual or apparent equilibrium constant for the drug-protein interaction in solution.
Figure 4.

General approaches for the separation and analysis of free drug or solutes fractions by using ultrafast affinity extraction using (a) a single-column system or (b) a two-column system.
Figure 4(a) shows how the residence time for a sample inside an affinity microcolumn can play an important role when using ultrafast affinity extraction to measure free drug fractions [47,49,51–54]. This factor can be modulated by altering either the column size or flow rate [47,49–52]. The effect of changing the flow rate during ultrafast affinity extraction is shown in Figure 5. In this illustration, the apparent free fraction for a drug decreases as the flow rate is increased from a low-to-moderate level and reaches a constant value at higher flow rate [54]. At the low-to-moderate flow rates (i.e., less than 0.85 mL/min, in this example), some drug that was bound to proteins in the sample is able to dissociate from these proteins, resulting in an increase in the apparent free drug fraction. However, this apparent free drug fraction approaches the true value when the flow rate becomes high enough to keep this dissociation at a negligible level. The flow rate that is needed to obtain this condition will vary from one drug and protein system to the next, but generally occurs when the sample residence time is on the order of a few hundred milliseconds [47,49,51,53].
Figure 5.

Effect of injection flow rate on the column residence time (dashed line) and apparent free drug fractions (solid line), as illustrated for 10 μL injections of samples containing 1 μM propranolol and 20 μM soluble AGP onto a 2 mm × 2.1 mm i.d. AGP microcolumn at pH 7.4 and 37 ºC. Reproduced with permission from Ref. [54].
Figure 4(b) shows the general scheme for using ultrafast affinity extraction with a two-column system to measure free drug fractions [53]. In this case, an affinity microcolumn and longer affinity column can be connected in series during part of the separation. The drug and protein mixture is first injected onto only the affinity microcolumn, which will extract and retain the free drug fraction from the sample while the bound form of the drug and excess soluble protein elute as non-retained components [50,52,53]. For samples that are complex or that contain a large amount of protein, baseline resolution may not always be obtained between the retained and non-retained peaks of the first column. In this situation, a second and longer affinity column can be placed online with the affinity microcolumn after most of the non-retained components have eluted. A part of the free drug fraction that is retained by the first column is then delivered to the second column to enable further separation of the free drug fraction from other sample components [50,52,53].
One important factor to consider during this transfer process is the time that is used to switch the second column online with the first [50,52,53]. The effect of varying this time on the measured free drug fraction is illustrated in Figure 6 [53]. When the switching time is short, the result is in an increase in the apparent free drug fraction due to contamination from non-retained components in the sample, as shown in Figure 6(b). When the switching time is made longer, this contamination is minimized and a consistent free drug fraction is observed. However, using switching times that are too long will also create a loss in precision for the measured free drug fraction as less of the retained peak enters the second column, as demonstrated in both Figures 6(a) and 6(b). As a result, use of an intermediate switching time is generally recommended to provide both good accuracy and reasonable precision for the measured free drug fraction [53].
Figure 6.

Effect of changing the valve switching time in ultrafast affinity extraction when using a two-column system. These effects are illustrated for (a) the recovery of carbamazepine at 0.5 mL/min on a 10 mm × 2.1 mm i.d. AGP column that was placed on-line with a 5 mm × 2.1 mm i.d. AGP column at various times following the injection of a 3 μL sample mixture of 15 μM carbamazepine/20 μM AGP/481 μM HSA onto the first column at 3.0 mL/min, and (b) the apparent free drug fractions that were measured by using the same chromatographic conditions and sample when using a two-column system. All of the times show represent the elapsed interval after sample injection. The error bars represent ± 1 standard error of the mean (n = 3) and all the measurements were made at pH 7.4 and 37 ºC. Reproduced with permission from Ref. [53].
3.2. Measurement of free drug fractions
The first way ultrafast affinity extraction can be used is to measure the free fraction of a drug in a drug/protein mixture or more a complex sample that contains the drug and binding agents [47]. Figure 7 shows some typical chromatograms from such a study, as obtained with an HSA microcolumn and by using samples that contained the drug tolbutamide or a mixture of tolbutamide and soluble HSA [50]. Once this type of separation has been optimized (i.e., as described in the previous section for work at column residence times that minimize drug-protein dissociation in the sample), the free drug fraction in the sample can be determined by dividing the retained peak area observed for the drug by the total peak area that is measured for a standard that contains the same total concentration of the drug but no protein [50,52,53]. It has been demonstrated in several studies that good agreement is seen in the free fractions that are measured under these conditions when compared to the results that are obtained by a reference method such as ultrafiltration [45–48,52,53]. This method has also been employed in examining systems that span a wide range of affinities (see Section 3.4), free fractions and free solute concentrations. This has included free drug and hormone fractions that have ranged from 0.09% to 92% [44,47,48,50,52], with precisions that are often comparable to or better than those obtained by reference methods [44–48,53].
Figure 7.

Typical chromatograms obtained from the application of 185 μM tolbutamide (therapeutic concentration) in the absence or presence of 526 μM HSA (physiological concentration) onto a single 5 mm × 2.1 mm i.d. HSA microcolumn at 2.25 mL/min. Reproduced with permission from Ref. [50].
3.3. Determination of rate constants
Another way ultrafast affinity extraction can be employed is to determine the dissociation rate constant (kd) for a drug-protein complex. This can be accomplished by measuring the free drug fraction at low-to-medium flow rates when a drug-protein mixture is injected onto the affinity microcolumn [49]. The apparent free fractions are then measured, as described in the previous section, and used to prepare a plot according to Eqs. (1) or (2) [49].
| (1) |
| (2) |
In these two equivalent equations, F0 is the true original free fraction of drug D in the sample (e.g., as determined at high flow rates), and Ft is the apparent free fraction that is measured at low-to-moderate flow rates (i.e., conditions where the drug-protein complex DP is allowed to dissociate for time t in the microcolumn). According to Eqs. (1) and (2), plots made of either ln[(1 − F0)/(1 − Ft)] or ln[1/(1 − Ft)] versus t should result in a linear relationship in which the slope provides the dissociation rate constant kd for the complex of the drug with the soluble protein [49].
Eq. (1) can be used when a direct and separate measurement can be made of F0, as discussed in Section 3.2. As an alternative, Eq. (2) allows the value of F0 to instead be obtained from the intercept of a plot of ln[1/(1 − Ft)] versus t. This second approach tends to provide a less precise estimate of F0 than when using a direct measurement of this parameter. However, this second method can also be more useful for obtaining both F0 and kd in situations where sufficiently high flow rates cannot be used with an affinity microcolumn to directly measure F0 [49].
Figure 8 shows some plots that are acquired when using Eqs. (1) and (2) for kinetic studies, as based on data for the drug verapamil and soluble AGP [54]. Table 1 lists some dissociation rate constants that have been obtained when using ultrafast affinity extraction with either Eq. (1) or (2) to examine various drugs in the presence of soluble HSA or AGP [49,54]. The dissociation rate constants that have been measured by this method have ranged from 10−2 to 101 s−1, as have been obtained with systems with binding affinities spanning from 104 to 109 M−1 and with good agreement with literature values [12,49,51,52,70]. In the case of a binding agent such as HSA that tends to have simple saturable interactions with drugs [49], consistent values for dissociation rate constants have been acquired with this method when varying either the drug or protein concentration that is used in the sample [49,51]. However, more complex binding agents such as AGP have been found to have concentration-dependent values for their apparent dissociation rate constants [54]. This latter effect has been proposed to be the result of a combination of dissociation mechanisms that may be present in this type of drug/protein system [54,68,69].
Figure 8.

Analysis of the interactions by verapamil with soluble AGP by using ultrafast affinity extraction and Eqs. (1) and (2). The samples contained 10 μM verapamil and 20 μM AGP. The error bars represent a range of ± 1 S.D. These results are based on data from Ref. [54].
Table 1.
Dissociation rate constants measured for various drugs with soluble HSA and soluble AGP by using ultrafast affinity extraction on HSA and AGP microcolumnsa
| Dissociation rate constant, kd (s−1) | |||
|---|---|---|---|
| Drug and HSA | Estimate, Eq. (1)b | Estimate, Eq. (2) | Literature [Ref.] |
| Warfarin | 0.80 (± 0.05) | 0.72 (± 0.05) | 0.41–2 [74–76] |
| Tolbutamide | 0.59 (± 0.03) | 0.58 (± 0.04) | 0.49 (± 0.15) [75] |
| Acetohexamide | 0.67 (± 0.03) | 0.63 (± 0.03) | 0.58 (± 0.02) [75] |
| Verapamil | 0.35 (± 0.02) | 0.36 (± 0.02) | 0.38 (± 0.05) [77] |
| Gliclazide | 0.61 (± 0.02) | 0.59 (± 0.04) | Not reported |
| Chlorpromazine | 3.96 (± 0.13) | 3.35 (± 0.30) | Not reported |
| Drug and AGP (drug:protein concentrations) | Estimate, Eq. (1)b | Estimate, Eq. (2) | Literature [Ref.] |
| Verapamil (10 μM:20 μM) | 0.62 (± 0.05) | 0.59 (± 0.07) | Not reported |
| Lidocaine (15 μM:20 μM) | 0.63 (± 0.05) | 0.61 (± 0.05) | 0.73 (± 0.07) [77] |
| Imipramine (3 μM:40 μM) | 0.27 (± 0.04) | 0.24 (± 0.04) | 0.13 (± 0.01) [54] |
| Disopyramide (3 μM:25 μM) | 0.29 (± 0.04) | 0.28 (± 0.06) | 0.38 (± 0.02) [54] |
| Chlorpromazine (3 μM:40μM) | 0.60 (± 0.03) | 0.56 (± 0.02) | 0.10 (± 0.01) [54] |
| Propranolol (1 μM:20 μM) | 0.24 (± 0.02) | 0.24 (± 0.02) | S-Propranolol 0.19 (± 0.01) [54] |
The values listed in this table are from Refs. [49,54]. All of the kd values obtained by ultrafast affinity extraction were measured at pH 7.4 and 37 °C. The samples used in the binding studies with HSA that contained 10 μM of a given drug and 20 μM HSA. In the work with AGP, the drug and protein concentrations are given in the table. The values in the parentheses represent a range of ± 1 S.D., as determined from the slopes of the best-fit lines constructed according to Eqs. (1) and (2).
These values were found by using Eq. (1) when a point at the origin was included in the data set.
3.4. Determination of binding constants
Use of a small column residence time can result in free drug fractions that can be employed to estimate the equilibrium constant for a drug-protein interaction (e.g., as related to the original free drug fraction in the initial sample). For instance, a free fraction that is determined under these conditions can be used with Eq. (3) to provide the association equilibrium constant (Ka) for a drug-protein system that has a single-site, saturable interaction [47].
| (3) |
In this equation, [A]0 and [P]0 are the total concentrations of the drug/analyte and soluble protein in the injected sample, and F0 is the original free fraction of the drug/analyte in the sample at equilibrium (i.e., as measured at a flow rate that minimizes drug-protein dissociation in the column). The same general relationship can be used to estimate the global affinity constant (nKa’) for a system in which there are multiple, independent and saturable interactions between a drug and protein [47]. Although weaker, non-specific interactions may also make up part of estimates for this global affinity constant, their contribution in most cases should be small when compared to the contributions by higher affinity sites in the system. This last feature is reflected by the good agreement that has been seen in several past studies between the global affinities that are measured by this approach and those that have been obtained by other methods, as has been noted for systems with affinities that have spanned from 103 – 109 M−1 [47–53].
Another method that can be used to estimate the equilibrium constants for drugs with soluble proteins is based on the estimate of F0 that is obtained in kinetic studies when using Eq. (2) [49]. In this approach, the value of F0 can be acquired from the intercept of a plot of ln[1/(1 − Ft)] versus t, which can then be used along with Eq. (3) to find Ka or nKa’. Table 2 lists some association equilibrium constants and global affinities that have been obtained in prior work when using either of these methods for various drugs and soluble forms of HSA or AGP [49,54].
Table 2.
Equilibrium constants measured for various drugs with soluble HSA and AGP by using ultrafast affinity extraction on HSA and AGP microcolumnsa
| Association equilibrium constant, Ka, or global affinity constant, nKa’ (M−1) | |||
|---|---|---|---|
| Drug and HSA | Estimate, Eq. (3) | Estimate, Eqs. (2–3) | Literature [Ref.] |
| Warfarin | 2.4 (± 0.4) × 105 | 1.6 (± 0.2) × 105 | 2.0–5.7 × 10⁵ [78–80] |
| Tolbutamide | 1.1 (± 0.4) × 105 | 0.9 (± 0.2) × 105 | 1.1 (± 0.1) × 105 [81]b |
| Acetohexamide | 1.8 (± 0.5) × 105 | 1.3 (± 0.1) × 105 | 1.7( ± 0.1) × 105 [82]b |
| Verapamil | 1.5 (± 0.4) × 104 | 1.6 (± 0.2) × 104 | 1.4 ( ± 0.1) × 104 [83]c |
| Gliclazide | 8.0 (± 0.6) × 104 | 6.9 (± 1.0) × 104 | 7.9 (± 0.1) × 104 [84]b |
| Chlorpromazine | 6.2 (± 0.5) × 104 | 4.9 (± 0.5) × 104 | 6.4 × 10⁴ [85] |
| Drug and AGP (drug:protein concentrations) | Estimate, Eq. (3) | Estimate, Eqs. (2–3) | Literature [Ref.] |
| Verapamil (10 μM:20μM) | 1.2 (± 0.1) × 105 | 1.0 (± 0.2) × 105 | 1.2 × 10⁵ [86,87] |
| Lidocaine (10 μM:20 μM) | 1.1 (± 0.2) × 105 | 1.6 (± 0.4) × 105 | 1.1 – 1.7 (± 0.2) × 105 [88] |
| Imipramine (10 μM:20 μM) | 1.5 (± 0.1) × 105 | 1.6 (± 0.4) × 105 | 1.4 – 1.7 × 10⁵ [89,90] |
| Disopyramide (5 μM:7.5μM) | 6.9 (± 0.3) × 105 | 6.7 (± 1.1) × 105 | 6.3 × 10⁵ [91] |
| Chlorpromazine (5 μM:10μM) | 5.4 (± 0.4) × 105 | 3.9 (± 0.8) × 105 | 4–17 × 105 [92,93] |
| Propranolol (5 μM:10μM) | 2.9 (± 0.2) × 105 | 3.6 (± 0.8) × 105 | 3–14 × 105 [68,94] |
The values listed in this table are from Refs. [49,54]. Other conditions were the same as in Table 1. The values in parentheses represent a range of ± 1 S.D., as determined by error propagation.
The global affinity constants for these drugs were calculated from data in the given references.
This value represents the average association equilibrium constant for R- and S-verapamil at their high affinity site on HSA.
A more complex model, as described by Eqs. (4–6), can be used with ultrafast affinity extraction and free fraction measurements to examine the interaction for a drug with two separate binding agents. This type of model has been used to measure the association equilibrium constants or global affinities for a number of drugs in serum which can bind to both AGP and HSA [53].
| (4) |
| (5) |
| (6) |
In these equations Ka,A is the apparent or global affinity constant for a drug/analyte with AGP; [D-A]eq is the equilibrium concentration for this drug’s complex with AGP; F is the measured free drug fraction; [D]0, [A]0 and [H]0 are the original total sample concentrations of the drug, AGP and HSA, respectively; [D-H]eq is the concentration of the drug’s complex with HSA; and Ka,H is the association equilibrium constant or global affinity constant of drug with HSA [53].
Another model that has been used with free fraction analysis is a mixed-model, as described by combining Eq. (3) and Eqs. (7–8). This particular model combines a non-saturable process, as represented by Eq. (7), with saturable binding, as shown in Eq. (3), for systems that may have both types of interactions present [54].
| (7) |
| (8) |
In these equations, [D] is the solution-phase concentration of the drug; [DP] is the concentration of the same drug that has partitioned into the protein; KD is the distribution constant; CD is the total concentration of the drug; Ka is the association equilibrium constant; and [P0] is again the total concentration of the soluble protein [54].
In general, a single-column system is usually sufficient to acquire an equilibrium constant for a drug-protein system when the drug and protein are present at similar concentrations (e.g., if the concentration of the protein is one- to two-times the drug’s concentration) [47,49,54]. A two-column system is more commonly employed with complex samples or when there is a large difference in the concentrations of the drug and protein [48,50,52,53]. Complex mixtures that have been examined with two-column systems have included samples that contain more than one form of a drug (e.g., drug enantiomers) [48], drug/protein mixtures that are prepared at therapeutic or physiological concentrations, and drugs that are present in clinical samples [50–52].
Ultrafast affinity extraction has been used in equilibrium studies for systems that have varied from weak-to-strong binding [71]. For instance, this method has been used with affinity columns containing antibodies to measure the free fraction of warfarin in samples containing a mixture of this drug and HSA [43]. Ultrafast affinity extraction has also been utilized in combination with flow-based displacement immunoassays to measure the free fractions of thyroxine and phenytoin in clinical samples [44–46]. In addition, this method has been used to measure the free fractions and equilibrium constants for various drugs with HSA/glycated HSA [47,49,50,52] or AGP [53,54] and to study the interactions of testosterone with both HSA and sex-hormone binding globulin [51].
4. Conclusion
This report has described the method of ultrafast affinity extraction and has shown how this approach can be employed as a tool for studying drug- or solute-protein interactions. The general principles of this method were discussed, along with various experimental factors to consider in the design and optimization of this technique and methods for analyzing the resulting data for equilibrium or kinetic studies. Several applications for this approach were also described. These applications included measurement of the free fractions for drugs and other solutes in simple solutions or biological samples [43–54], and the use of this method to characterize the equilibrium constants or rate constants for drug/solute-protein interactions [43–54]. These applications and experimental considerations were illustrated by using data that have been obtained through this method for various drugs and solutes that are known to bind to HSA and AGP and with binding strengths that have ranged from 103 to 109 M−1 [44–46,52,53].
Several advantages for ultrafast affinity extraction have been noted in these applications. For instance, this is a label-free method that can be used with a variety of detection techniques [12]. Unlike other common approaches for biointeraction analysis (e.g., traditional HPAC and surface plasmon resonance), this method allows for solute-protein binding to be examined directly in solution, rather than between a solute and immobilized binding agent [12,49,51]. Other appealing features of this method include its ability to work with either low or high affinity systems, its need for only a small amount of sample, and its ability to provide results in few minutes after sample injection [12,52]. One current limitation of this method is that some preliminary studies must be conducted to determine the correct column sizes and flow rates to employed to extract the free solute fraction and separate it from non-retained sample components [12,49,70]. However, this limitation is being overcome as more information and experience is being obtained with this technique and further applications are being reported for this approach [47–53]. This additional information and set of applications should, in turn, allow for even more uses for this method in the future in areas that include biochemical or pharmaceutical research and clinical analysis [12,44–53].
5. Notes
-
5.1
The diol coverage of the modified Nucleosil Si-300 support that was used for the examples cited in this report was around 300 μmol diol/g silica. This value may differ when using other types of silica and will depend on the pore size and surface area of the support [72,73].
-
5.2
The degree of capture for a drug in ultrafast affinity extraction will vary with the flow rate, amount of immobilized binding agent, and size of the affinity microcolumn. The examples cited in this report typically had a capture efficiency of 95% or more when using HSA and AGP microcolumns [47,49].
-
5.3
When ultrafast affinity extraction is used with serum, these samples should be filtered (e.g., twice using syringe filters with 0.2 μm nylon membranes) prior to their combination with a drug or injection onto an HPLC system [52,53].
-
5.4
Although some immobilization schemes can lead to non-specific interactions of a solute to a support, it has been noted that this does not lead to any major effects in the measurement of binding constants by ultrafast affinity extraction [53]. This is the case because the affinity microcolumn is used only to capture and measure the free solute fraction. The actual binding event that is examined is the solution-phase interaction of the drug/solute with a soluble protein, and this process is not altered by non-specific interactions due to the support [53].
-
5.5
The protein content of the supports that were used here to illustrate the applications of ultrafast affinity extraction were 22 mg AGP/g silica and 46–66 mg HSA/g silica [47–53]. The use of supports with smaller or larger protein contents may require the use of column sizes that are slightly larger or smaller, respectively, than those used in these particular examples, as the protein content will affect the degree of retention and separation that is obtained for the retained free drug fraction versus non-retained sample components [47].
Highlights.
Ultrafast affinity extraction is discussed as a method for studying drug-protein binding.
Various practical aspects are considered in the design and use of this approach.
This method is illustrated using data obtained various drugs with serum proteins.
Applications that are described include both kinetic and equilibrium studies.
Acknowledgments
This work was funded by the National Institutes of Health under grants R01 DK069629 and R01 GM044931.
Abbreviations
- AGP
alpha1-acid glycoprotein
- HPAC
high performance affinity chromatography
- HPLC
high performance liquid chromatography
- HSA
human serum albumin
Footnotes
Publisher's Disclaimer: This is a PDF file of an unedited manuscript that has been accepted for publication. As a service to our customers we are providing this early version of the manuscript. The manuscript will undergo copyediting, typesetting, and review of the resulting proof before it is published in its final citable form. Please note that during the production process errors may be discovered which could affect the content, and all legal disclaimers that apply to the journal pertain.
References
- 1.Hage DS, Jackson A, Sobansky MR, Schiel JE, Yoo MJ, Joseph KS. Characterization of drug-protein interactions in blood using high-performance affinity chromatography. J Sep Sci. 2009;32:835–853. doi: 10.1002/jssc.200800640. [DOI] [PMC free article] [PubMed] [Google Scholar]
- 2.Vuignier K, Schappler J, Veuthey JL, Carrupt PA, Martel S. Drug-protein binding: a critical review of analytical tools. Anal Bioanal Chem. 2010;398:53–66. doi: 10.1007/s00216-010-3737-1. [DOI] [PubMed] [Google Scholar]
- 3.Li Z, Beeram SR, Bi C, Suresh D, Zheng X, Hage DS. High-performance affinity chromatography: applications in drug-protein binding studies and personalized medicine. Adv Protein Chem Struct Biol. 2016;102:1–39. doi: 10.1016/bs.apcsb.2015.09.007. [DOI] [PubMed] [Google Scholar]
- 4.Schmidt S, Gonzalez D, Derendorf H. Significance of protein binding in pharmacokinetics and pharmacodynamics. J Pharm Sci. 2010;99:1107–1122. doi: 10.1002/jps.21916. [DOI] [PubMed] [Google Scholar]
- 5.Wainer IW. The impact of new liquid chromatography chiral stationary phase technology on the study of stereoselective pharmacokinetics. Trends Anal Chem. 1993;12:153–158. [Google Scholar]
- 6.Hage DS, Tweed SA. Recent advances in chromatographic and electrophoretic methods for the study of drug-protein interactions. J Chromatogr B. 1997;699:499–525. doi: 10.1016/s0378-4347(97)00178-3. [DOI] [PubMed] [Google Scholar]
- 7.Kwong TC. Free drug measurements: methodology and clinical significance. Clin Chim Acta. 1985;151:193–216. doi: 10.1016/0009-8981(85)90082-8. [DOI] [PubMed] [Google Scholar]
- 8.Svensson CK, Woodruff MN, Baxter JG, Lalka D. Free drug concentration monitoring in clinical practice. Rationale and current status. Clin Pharmacokinet. 1986;11:450–469. doi: 10.2165/00003088-198611060-00003. [DOI] [PubMed] [Google Scholar]
- 9.Ekins R. The free hormone hypothesis and measurement of free hormones. Clin Chem. 1992;38:1289–1293. [PubMed] [Google Scholar]
- 10.Robbins J. Thyroxine transport and the free hormone hypothesis. Endocrinology. 1992;131:546–547. doi: 10.1210/endo.131.2.1639006. [DOI] [PubMed] [Google Scholar]
- 11.Chan S, Gerson B. Free drug monitoring. Clin Lab Med. 1987;7:279–287. [PubMed] [Google Scholar]
- 12.Zheng X, Li Z, Beeram S, Podariu M, Matsuda R, Pfaunmiller EL, White CJ, II, Carter N, Hage DS. Analysis of biomolecular interactions using affinity microcolumns: a review. J Chromatogr B. 2014;968:49–63. doi: 10.1016/j.jchromb.2014.01.026. [DOI] [PMC free article] [PubMed] [Google Scholar]
- 13.Kim H, Austin J, Hage DS. Identification of drug-binding sites on human serum albumin using affinity capillary electrophoresis and chemically modified proteins as buffer additives. Electrophoresis. 2002;23:956–963. doi: 10.1002/1522-2683(200203)23:6<956::AID-ELPS956>3.0.CO;2-7. [DOI] [PubMed] [Google Scholar]
- 14.Oravcova J, Bohs B, Lindner W. Drug protein binding studies - new trends in analytical and experimental methodology. J Chromatogr B. 1996;677:1–28. doi: 10.1016/0378-4347(95)00425-4. [DOI] [PubMed] [Google Scholar]
- 15.Chignell CF. Drug-protein binding: recent advances in methodology: spectroscopic techniques. Ann NY Acad Sci. 1973;226:44–59. doi: 10.1111/j.1749-6632.1973.tb20467.x. [DOI] [PubMed] [Google Scholar]
- 16.Plotnikov V, Rochalski A, Brandts M, Brandts JF, Williston S, Frasca V, Lin LN. An autosampling differential scanning calorimeter instrument for studying molecular interactions. Assay Drug Dev Technol. 2002;1:83–90. doi: 10.1089/154065802761001338. [DOI] [PubMed] [Google Scholar]
- 17.Myszka DG, Rich RL. Implementing surface plasmon resonance biosensors in drug discovery. Pharm Sci Technolog Today. 2000;3:310–317. doi: 10.1016/s1461-5347(00)00288-1. [DOI] [PubMed] [Google Scholar]
- 18.O’Reilly RA, Motley CH. Interaction of several coumarin compounds with human and canine plasma albumin. Mol Pharmacol. 1971;7:209–218. [PubMed] [Google Scholar]
- 19.O’Reilly RA. Binding of sodium warfarin to plasma albumin and its displacement by phenylbutazone. Ann NY Acad Sci. 1973;226:293–308. doi: 10.1111/j.1749-6632.1973.tb20491.x. [DOI] [PubMed] [Google Scholar]
- 20.Toon S, Low LK, Gibaldi M, Trager WF, O’Reilly RA, Motley CH, Goulart DA. The warfarin-sulfinpyrazone interaction: stereochemical considerations. Clin Pharmacol Ther. 1986;39:15–24. doi: 10.1038/clpt.1986.3. [DOI] [PubMed] [Google Scholar]
- 21.Cheng Y, Ho E, Subramanyam B, Tseng J-L. Measurements of drug-protein binding by using immobilized human serum albumin liquid chromatography-mass spectrometry. J Chromatogr B. 2004;809:67–73. doi: 10.1016/j.jchromb.2004.06.006. [DOI] [PubMed] [Google Scholar]
- 22.Buchholz L, Cai C-H, Andress L, Cleton A, Brodfuehrer J, Cohen L. Evaluation of the human serum albumin column as a discovery screening tool for plasma protein binding. Eur J Pharm Sci. 2002;15:209–215. doi: 10.1016/s0928-0987(01)00219-6. [DOI] [PubMed] [Google Scholar]
- 23.Valko K, Nunhuck S, Bevan C, Abraham MH, Reynolds DP. Fast gradient HPLC method to determine compounds binding to human serum albumin. Relationships with octanol/water and immobilized artificial membrane lipophilicity. J Pharm Sci. 2003;92:2236–2248. doi: 10.1002/jps.10494. [DOI] [PubMed] [Google Scholar]
- 24.Valko K, Du CM, Bevan CD, Reynolds DP, Abraham MH. Rapid-gradient HPLC method for measuring drug interactions with immobilized artificial membrane: comparison with other lipophilicity measures. J Pharm Sci. 2000;89:1085–1096. doi: 10.1002/1520-6017(200008)89:8<1085::aid-jps13>3.0.co;2-n. [DOI] [PubMed] [Google Scholar]
- 25.Valko K. Application of high-performance liquid chromatography based measurements of lipophilicity to model biological distribution. J Chromatogr A. 2004;1037:299–310. doi: 10.1016/j.chroma.2003.10.084. [DOI] [PubMed] [Google Scholar]
- 26.Talbert AM, Tranter GE, Holmes E, Francis PL. Determination of drug-plasma protein binding kinetics and equilibria by chromatographic profiling: exemplification of the method using L-tryptophan and albumin. Anal Chem. 2002;74:446–452. doi: 10.1021/ac010643c. [DOI] [PubMed] [Google Scholar]
- 27.Jewell RC, Brouwer KLR, McNamara PJ. Alpha 1-acid glycoprotein high performance liquid chromatography column (EnantioPAC) as a screening tool for protein binding. J Chromatogr. 1989;487:257–264. doi: 10.1016/s0378-4347(00)83035-2. [DOI] [PubMed] [Google Scholar]
- 28.Skogsberg U, Allenmark S. Determination of enantiomer separation factors by nuclear magnetic resonance spectroscopy and by chiral liquid chromatography. J Chromatogr A. 2001;921:161–167. doi: 10.1016/s0021-9673(01)00858-5. [DOI] [PubMed] [Google Scholar]
- 29.Thompson RA, Andersson S, Allenmark S. Direct liquid chromatographic separation of enantiomers on immobilized protein stationary phases. VII. Sorbents obtained by entrapment of cross-linked bovine serum albumin in silica. J Chromatogr A. 1989;465:263–270. [Google Scholar]
- 30.Dalsgaard PW, Rode AJ, Pedersen AJ, Rasmussen BS, Windberg CN, Linnet K. Screening of 30 acidic and neutral pharmaceuticals in whole blood by fully automated SPE and UPLC-TOF-MS. Drug Test Anal. 2013;5:254–258. doi: 10.1002/dta.1442. [DOI] [PubMed] [Google Scholar]
- 31.Dalsgaard PW, Rasmussen BS, Mueller IB, Linnet K. Toxicological screening of basic drugs in whole blood using UPLC-TOF-MS. Drug Test Anal. 2012;4:313–319. doi: 10.1002/dta.303. [DOI] [PubMed] [Google Scholar]
- 32.Vuignier K, Veuthey J-L, Carrupt P-A, Schappler J. Global analytical strategy to measure drug-plasma protein interactions: from high-throughput to in-depth analysis. Drug Discov Today. 2013;18:1030–1034. doi: 10.1016/j.drudis.2013.04.006. [DOI] [PubMed] [Google Scholar]
- 33.Vuignier K, Veuthey J-L, Carrupt P-A, Schappler J. Characterization of drug-protein interactions by capillary electrophoresis hyphenated to mass spectrometry. Electrophoresis. 2012;33:3306–3315. doi: 10.1002/elps.201200116. [DOI] [PubMed] [Google Scholar]
- 34.Vuignier K, Guillarme D, Veuthey J-L, Carrupt P-A, Schappler J. High performance affinity chromatography (HPAC) as a high-throughput screening tool in drug discovery to study drug-plasma protein interactions. J Pharm Biomed Anal. 2013;74:205–212. doi: 10.1016/j.jpba.2012.10.030. [DOI] [PubMed] [Google Scholar]
- 35.Bhatia P, Kolinski M, Moaddel R, Jozwiak K, Wainer IW. Determination and modelling of stereoselective interactions of ligands with drug transporters: a key dimension in the understanding of drug disposition. Xenobiotica. 2008;38:656–675. doi: 10.1080/00498250802109207. [DOI] [PMC free article] [PubMed] [Google Scholar]
- 36.Singh NS, Habicht K-L, Dossou KSS, Shimmo R, Wainer IW, Moaddel R. Multiple protein stationary phases: a review. J Chromatogr B. 2014;968:64–68. doi: 10.1016/j.jchromb.2014.04.005. [DOI] [PMC free article] [PubMed] [Google Scholar]
- 37.Noctor TAG, Diaz-Perez MJ, Wainer IW. Use of a human serum albumin-based stationary phase for high-performance liquid chromatography as a tool for the rapid determination of drug-plasma protein binding. J Pharm Sci. 1993;82:675–676. doi: 10.1002/jps.2600820629. [DOI] [PubMed] [Google Scholar]
- 38.Ohlson S, Bergstrom M, Leickt L, Zopf D. Weak affinity chromatography of small saccharides with immobilized wheat germ agglutinin and its application to monitoring of carbohydrate transferase activity. Bioseparation. 1998;7:101–105. doi: 10.1023/a:1008073314855. [DOI] [PubMed] [Google Scholar]
- 39.Ohlson S, Duong-Thi M-D, Bergstrom M, Fex T, Hansson L, Pedersen L, Guazotti S, Isaksson R. Toward high-throughput drug screening on a chip-based parallel affinity separation platform. J Sep Sci. 2010;33:2575–2581. doi: 10.1002/jssc.201000314. [DOI] [PubMed] [Google Scholar]
- 40.Leickt L, Mansson A, Ohlson S. Prediction of affinity and kinetics in biomolecular interactions by affinity chromatography. Anal Biochem. 2001;291:102–108. doi: 10.1006/abio.2001.5019. [DOI] [PubMed] [Google Scholar]
- 41.Hage DS, Anguizola JA, Bi C, Li R, Matsuda R, Papastavros E, Pfaunmiller E, Vargas J, Zheng X. Pharmaceutical and biomedical applications of affinity chromatography: recent trends and developments. J Pharm Biomed Anal. 2012;69:93–105. doi: 10.1016/j.jpba.2012.01.004. [DOI] [PMC free article] [PubMed] [Google Scholar]
- 42.Hage DS, Anguizola J, Barnaby O, Jackson A, Yoo MJ, Papastavros E, Pfaunmiller E, Sobansky M, Tong Z. Characterization of drug interactions with serum proteins by using high-performance affinity chromatography. Curr Drug Metab. 2011;12:313–328. doi: 10.2174/138920011795202938. [DOI] [PMC free article] [PubMed] [Google Scholar]
- 43.Clarke W, Chowdhuri AR, Hage DS. Analysis of free drug fractions by ultrafast immunoaffinity chromatography. Anal Chem. 2001;73:2157–2164. doi: 10.1021/ac0009752. [DOI] [PubMed] [Google Scholar]
- 44.Clarke W, Schiel JE, Moser A, Hage DS. Analysis of free hormone fractions by an ultrafast immunoextraction/displacement immunoassay: studies using free thyroxine as a model system. Anal Chem. 2005;77:1859–1866. doi: 10.1021/ac040127x. [DOI] [PubMed] [Google Scholar]
- 45.Ohnmacht CM, Schiel JE, Hage DS. Analysis of free drug fractions using near-infrared fluorescent labels and an ultrafast immunoextraction/displacement assay. Anal Chem. 2006;78:7547–7556. doi: 10.1021/ac061215f. [DOI] [PMC free article] [PubMed] [Google Scholar]
- 46.Schiel JE, Tong Z, Sakulthaew C, Hage DS. Development of a flow-based ultrafast immunoextraction and reverse displacement immunoassay: analysis of free drug fractions. Anal Chem. 2011;83:9384–9390. doi: 10.1021/ac201973v. [DOI] [PMC free article] [PubMed] [Google Scholar]
- 47.Mallik R, Yoo MJ, Briscoe CJ, Hage DS. Analysis of drug-protein binding by ultrafast affinity chromatography using immobilized human serum albumin. J Chromatogr A. 2010;1217:2796–2803. doi: 10.1016/j.chroma.2010.02.026. [DOI] [PMC free article] [PubMed] [Google Scholar]
- 48.Zheng X, Yoo MJ, Hage DS. Analysis of free fractions for chiral drugs using ultrafast extraction and multi-dimensional high-performance affinity chromatography. Analyst. 2013;138:6262–6265. doi: 10.1039/c3an01315d. [DOI] [PMC free article] [PubMed] [Google Scholar]
- 49.Zheng X, Li Z, Podariu MI, Hage DS. Determination of rate constants and equilibrium constants for solution-phase drug-protein interactions by ultrafast affinity extraction. Anal Chem. 2014;86:6454–6460. doi: 10.1021/ac501031y. [DOI] [PMC free article] [PubMed] [Google Scholar]
- 50.Zheng X, Matsuda R, Hage DS. Analysis of free drug fractions by ultrafast affinity extraction: interactions of sulfonylurea drugs with normal or glycated human serum albumin. J Chromatogr A. 2014;1371:82–89. doi: 10.1016/j.chroma.2014.10.092. [DOI] [PMC free article] [PubMed] [Google Scholar]
- 51.Zheng X, Bi C, Brooks M, Hage DS. Analysis of hormone-protein binding in solution by ultrafast affinity extraction: interactions of testosterone with human serum albumin and sex hormone binding globulin. Anal Chem. 2015;87:11187–11194. doi: 10.1021/acs.analchem.5b03007. [DOI] [PMC free article] [PubMed] [Google Scholar]
- 52.Zheng X, Podariu M, Matsuda R, Hage DS. Analysis of free drug fractions in human serum by ultrafast affinity extraction and two-dimensional affinity chromatography. Anal Bioanal Chem. 2016;408:131–140. doi: 10.1007/s00216-015-9082-7. [DOI] [PMC free article] [PubMed] [Google Scholar]
- 53.Bi C, Zheng X, Hage DS. Analysis of free drug fractions in serum by ultrafast affinity extraction and two-dimensional affinity chromatography using α1-acid glycoprotein microcolumns. J Chromatogr A. 2016;1432:49–57. doi: 10.1016/j.chroma.2015.12.084. [DOI] [PMC free article] [PubMed] [Google Scholar]
- 54.Beeram S, Bi C, Zheng X, Hage DS. Chromatographic studies of drug interactions with alpha1-acid glycoprotein by ultrafast affinity extraction and peak profiling. J Chromatogr A. 2017;1497:92–101. doi: 10.1016/j.chroma.2017.03.056. [DOI] [PMC free article] [PubMed] [Google Scholar]
- 55.Anguizola J, Joseph KS, Barnaby OS, Matsuda R, Alvarado G, Clarke W, Cerny RL, Hage DS. Development of affinity microcolumns for drug-protein binding studies in personalized medicine: interactions of sulfonylurea drugs with in vivo glycated human serum albumin. Anal Chem. 2013;85:4453–4460. doi: 10.1021/ac303734c. [DOI] [PMC free article] [PubMed] [Google Scholar]
- 56.Mallik R, Jiang T, Hage DS. High-performance affinity monolith chromatography: development and evaluation of human serum albumin columns. Anal Chem. 2004;76:7013–7022. doi: 10.1021/ac049001q. [DOI] [PubMed] [Google Scholar]
- 57.Jiang T, Mallik R, Hage DS. Affinity monoliths for ultrafast immunoextraction. Anal Chem. 2005;77:2362–2372. doi: 10.1021/ac0483668. [DOI] [PubMed] [Google Scholar]
- 58.Mallik R, Hage DS. Development of an affinity silica monolith containing human serum albumin for chiral separations. J Pharm Biomed Anal. 2008;46:820–830. doi: 10.1016/j.jpba.2007.03.017. [DOI] [PMC free article] [PubMed] [Google Scholar]
- 59.Zheng X, Podariu M, Bi C, Hage DS. Development of enhanced capacity affinity microcolumns by using a hybrid of protein cross-linking/modification and immobilization. J Chromatogr A. 2015;1400:82–90. doi: 10.1016/j.chroma.2015.04.051. [DOI] [PMC free article] [PubMed] [Google Scholar]
- 60.Hage DS, Kim HS. Immobilization methods for affinity chromatography. In: Hage DS, editor. Handbook of Affinity Chromatography. 2. Taylor & Francis; New York: 2006. pp. 35–78. [Google Scholar]
- 61.Jackson AJ, Xuan H, Hage DS. Entrapment of proteins in glycogen-capped and hydrazide-activated supports. Anal Biochem. 2010;404:106–108. doi: 10.1016/j.ab.2010.05.004. [DOI] [PMC free article] [PubMed] [Google Scholar]
- 62.Jackson AJ, Anguizola J, Pfaunmiller EL, Hage DS. Use of entrapment and high-performance affinity chromatography to compare the binding of drugs and site-specific probes with normal and glycated human serum albumin. Anal Bioanal Chem. 2013;405:5833–5841. doi: 10.1007/s00216-013-6981-3. [DOI] [PMC free article] [PubMed] [Google Scholar]
- 63.Matsuda R, Anguizola J, Hoy KS, Hage DS. Analysis of drug-protein interactions by high-performance affinity chromatography: interactions of sulfonylurea drugs with normal and glycated human serum albumin. Methods Mol Biol. 2015;1286:255–277. doi: 10.1007/978-1-4939-2447-9_21. [DOI] [PubMed] [Google Scholar]
- 64.Bi C, Jackson A, Vargas-Badilla J, Li R, Rada G, Anguizola J, Pfaunmiller E, Hage DS. Entrapment of alpha1-acid glycoprotein in high-performance affinity columns for drug-protein binding studies. J Chromatogr B. 2016;1021:188–196. doi: 10.1016/j.jchromb.2015.11.021. [DOI] [PMC free article] [PubMed] [Google Scholar]
- 65.Ruhn PF, Garver S, Hage DS. Development of dihydrazide-activated silica supports for high-performance affinity chromatography. J Chromatogr A. 1994;669:9–19. doi: 10.1016/0021-9673(94)80332-3. [DOI] [PubMed] [Google Scholar]
- 66.Xuan H, Hage DS. Immobilization of α1-acid glycoprotein for chromatographic studies of drug-protein binding. Anal Biochem. 2005;346:300–310. doi: 10.1016/j.ab.2005.08.025. [DOI] [PubMed] [Google Scholar]
- 67.Schiel JE. PhD dissertation. University of Nebraska; Lincoln, NE: 2009. Clinical and Pharmaceutical Applications of High Performance Affinity Chromatography. [Google Scholar]
- 68.Mallik R, Xuan H, Guiochon G, Hage DS. Immobilization of α1-acid glycoprotein for chromatographic studies of drug–protein binding. II. Correction for errors in association constant measurements. Anal Biochem. 2008;376:154–156. doi: 10.1016/j.ab.2008.01.035. [DOI] [PMC free article] [PubMed] [Google Scholar]
- 69.Handa K, Ohta T, Hirai M, Arai M, Ogata H. Enantioselective binding of propranolol, disopyramide, and verapamil to human α1-acid glycoprotein. J Pharm Sci. 2000;89:751–757. doi: 10.1002/(SICI)1520-6017(200006)89:6<751::AID-JPS6>3.0.CO;2-8. [DOI] [PubMed] [Google Scholar]
- 70.Bi C, Beeram S, Li Z, Zheng X, Hage DS. Kinetic analysis of drug protein interactions by affinity chromatography. Drug Discov Today Technol. 2015;17:16–21. doi: 10.1016/j.ddtec.2015.09.003. [DOI] [PMC free article] [PubMed] [Google Scholar]
- 71.Hage DS. Analysis of biological interactions by affinity chromatography: clinical and pharmaceutical applications. Clin Chem. 2017;63:1083–1093. doi: 10.1373/clinchem.2016.262253. [DOI] [PMC free article] [PubMed] [Google Scholar]
- 72.EPfaunmiller E, Moser AC, Hage DS. Biointeraction analysis of immobilized antibodies and related agents by high-performance immunoaffinity chromatography. Methods. 2012;56:130–135. doi: 10.1016/j.ymeth.2011.08.016. [DOI] [PMC free article] [PubMed] [Google Scholar]
- 73.Walters RR. High-performance affinity chromatography: pore-size effects. J Chromatogr A. 1982;249:19–28. [Google Scholar]
- 74.Rich RL, Day YS, Morton TA, Myszka DG. SPR biosensor studies of the direct interaction between 27 drugs and a liposome surface. Anal Biochem. 2001;296:197–207. doi: 10.1006/abio.2001.5314. [DOI] [PubMed] [Google Scholar]
- 75.Yoo MJ, Hage DS. Use of peak decay analysis and affinity microcolumns containing silica monoliths for rapid determination of drug-protein dissociation rate. J Chromatogr A. 2011;1218:2072–2078. doi: 10.1016/j.chroma.2010.09.070. [DOI] [PMC free article] [PubMed] [Google Scholar]
- 76.Chen J, Schiel JE, Hage DS. Noncompetitive peak decay analysis of drug-protein dissociation by high-performance affinity chromatography. J Sep Sci. 2009;32:1632–1641. doi: 10.1002/jssc.200900074. [DOI] [PMC free article] [PubMed] [Google Scholar]
- 77.Yoo MJ, Hage DS. High-throughput analysis of drug dissociation from serum proteins using affinity silica monoliths. J Sep Sci. 2011;34:2255–2263. doi: 10.1002/jssc.201100280. [DOI] [PMC free article] [PubMed] [Google Scholar]
- 78.Loun B, Hage DS. Chiral separation mechanisms in protein-based HPLC columns. 1. Thermodynamic studies of (R)- and (S)-warfarin binding to immobilized human serum albumin. Anal Chem. 1994;66:3814–3822. doi: 10.1021/ac00093a043. [DOI] [PubMed] [Google Scholar]
- 79.Yoo MJ, Schiel JE, Hage DS. Evaluation of affinity microcolumns containing human serum albumin for rapid analysis of drug-protein binding. J Chromatogr B. 2010;878:1707–1713. doi: 10.1016/j.jchromb.2010.04.028. [DOI] [PMC free article] [PubMed] [Google Scholar]
- 80.Chen J, Hage DS. Quantitative studies of allosteric effects by biointeraction chromatography: analysis of protein binding for low-solubility drugs. Anal Chem. 2006;78:2672–2683. doi: 10.1021/ac052017b. [DOI] [PMC free article] [PubMed] [Google Scholar]
- 81.Joseph KS, Anguizola J, Hage DS. Binding of tolbutamide to glycated human serum albumin. J Pharm Biomed Anal. 2011;54:426–432. doi: 10.1016/j.jpba.2010.09.003. [DOI] [PMC free article] [PubMed] [Google Scholar]
- 82.Joseph KS, Anguizola J, Jackson AJ, Hage DS. Chromatographic analysis of acetohexamide binding to glycated human serum albumin. J Chromatogr B. 2010;878:2775–2781. doi: 10.1016/j.jchromb.2010.08.021. [DOI] [PMC free article] [PubMed] [Google Scholar]
- 83.Mallik R, Yoo MJ, Chen S, Hage DS. Studies of verapamil binding to human serum albumin by high-performance affinity chromatography. J Chromatogr B. 2008;876:69–75. doi: 10.1016/j.jchromb.2008.10.022. [DOI] [PMC free article] [PubMed] [Google Scholar]
- 84.Matsuda R, Anguizola J, Joseph KS, Hage DS. High-performance affinity chromatography and the analysis of drug interactions with modified proteins: binding of gliclazide with glycated human serum albumin. Anal Bioanal Chem. 2011;401:2811–2819. doi: 10.1007/s00216-011-5382-8. [DOI] [PMC free article] [PubMed] [Google Scholar]
- 85.chenheng, Kim HS, Wainer IW. Rapid analysis of the interactions between drugs and human serum albumin (HSA) using high-performance affinity chromatography (HPAC) J Chromatogr B. 2008;870:22–26. doi: 10.1016/j.jchromb.2008.05.029. [DOI] [PMC free article] [PubMed] [Google Scholar]
- 86.Israili ZH, Dayton PG. Human alpha-1-glycoprotein and its interactions with drugs. Drug Metab Rev. 2001;33:161–235. doi: 10.1081/dmr-100104402. [DOI] [PubMed] [Google Scholar]
- 87.McGowan FX, Reiter MJ, Pritchett ELC, Shand DG. Verapamil plasma binding: relationship to α1-acid glycoprotein and drug efficacy. Clin Pharmacol Ther. 1983;33:485–490. doi: 10.1038/clpt.1983.66. [DOI] [PubMed] [Google Scholar]
- 88.Soman S, Yoo MJ, Jang YJ, Hage DS. Analysis of lidocaine interactions with serum proteins using high-performance affinity chromatography. J Chromatogr B. 2010;878:705–708. doi: 10.1016/j.jchromb.2010.01.016. [DOI] [PMC free article] [PubMed] [Google Scholar]
- 89.Nyberg G, Maartensson E. Determination of free fractions of tricyclic antidepressants. Naunyn-Schmiedeberg’s Arch Pharmacol. 1984;327:260–265. doi: 10.1007/BF00502459. [DOI] [PubMed] [Google Scholar]
- 90.Freilich DI, Giardina EGV. Imipramine binding to alpha-1-acid glycoprotein in normal subjects and cardiac patients. Clin Pharmacol Ther. 1984;35:670–674. doi: 10.1038/clpt.1984.93. [DOI] [PubMed] [Google Scholar]
- 91.Lima JJ, Jungbluth GL, Devine T, Robertson LW. Stereoselective binding of disopyramide to human plasma protein. Life Sci. 1984;35:835–839. doi: 10.1016/0024-3205(84)90408-9. [DOI] [PubMed] [Google Scholar]
- 92.Wright DS, Friedman ML, Jenkins SH, Heineman WR, Halsall HB. Sequestration electrochemistry: the interaction of chlorpromazine and human orosomucoid. Anal Biochem. 1988;171:290–293. doi: 10.1016/0003-2697(88)90488-5. [DOI] [PubMed] [Google Scholar]
- 93.Piafsky KM, Borga O, Odar-Cederlof I, Johansson C, Sjoqvist F. Increased plasma protein binding of propranolol and chlorpromazine mediated by disease-induced elevations of plasma α1 acid glycoprotein. N Engl J Med. 1978;299:1435–1439. doi: 10.1056/NEJM197812282992604. [DOI] [PubMed] [Google Scholar]
- 94.Xuan H, Hage DS. Immobilization of α1-acid glycoprotein for chromatographic studies of drug-protein binding. Anal Biochem. 2005;346:300–310. doi: 10.1016/j.ab.2005.08.025. [DOI] [PubMed] [Google Scholar]