

Abstract
Impact of retort processing on the characteristics and bioactivity of herbal soup, based on hydrolyzed collagen from seabass fish skins, as sterilized health drink in glass bottles, was investigated. Retort processing was conducted at either 115 °C or 121 °C for 5, 7, 9 or 11 min (F0 values) and compared to no retort processing. All retort processing conditions yielded sterile soups, but some differences in moisture content, pH, viscosity, UV-absorbance, browning index, fluorescence intensity, color, α-amino group and total reducing compound contents were observed, compared to those without retort processing. Retort processing enhanced antioxidative activity of herbal hydrolyzed collagen (HHC) soups, regardless of conditions. HHC soups with F0 value of 7 at 115 °C (115/7) and 121 °C (121/7) showed significantly higher ABTS and DPPH radical scavenging activities, ferric reducing antioxidant power and H2O2 scavenging activity, compared to others. Retort processing had no significant (p > 0.05) effect on the appearance, color, odor, viscosity, flavor, taste and overall perception of HHC soups. The 115/7 and 121/7 samples stimulated cell proliferation and enhance collagen production of L929 mouse fibroblast cells. It was therefore concluded that retort processing could be used for preparing sterilized HHC soup as a ready-to-serve functional drink that is both healthy and safe.
Keywords: Hydrolyzed collagen, Herbal soup, Retort, Antioxidative activity, Fibroblast proliferation, Collagen production
Introduction
The growing demand for medicinal plants and herbs as healthy food supplements, health drinks and tonics have fueled the development of numerous products enriched with bioactive components. Traditional herbs have been used from time immemorial in health care in China and many other countries especially in Asia including Thailand. Herbal products with health benefits are sold in several forms including tablets, tea, liquid extracts and soups (Ekor 2013). Many soups and water extracts are commercialized and marketed as diet supplements and health foods and many herbal soups are considered as bioactive functional foods. Maillard reaction products (MRPs) and the formation of colloidal nanostructures of self-assembling single molecules extracted from plants and the flesh of animals generally occur during the preparation of these soups due to extended boiling. These reactions have been shown to affect the chemical compositions and bioactivity of herbal soup (Ke et al. 2012).
With increasing consumer demand for health promoting foods and drinks, fish protein hydrolysate has been shown to be important because of its nutracuetical properties and Thiansilakul et al. (2007) and Gómez-Guillén et al. (2011) produced fish skin hydrolysates with bioactivity. To enhance bioactivity of fish skin hydrolysate, Karnjanapratum et al. (2016) employed the Maillard reaction and the resulting hydrolysate showed increased antioxidative activity. Benjakul et al. (2017; 2018) developed seabass skin hydrolyzed collagen (HC), with negligible fishy odor, using enzymatic hydrolysis. To increase its nutraceutical value in herbal soup, selected herbs could be used as the source of active compounds to supplement the peptides in the hydrolysate. Several herbs are rich in phenolic compounds, which have been known to possess a wide range of bioactivities, particularly antioxidant activity. Radicals generated can cause a number of diseases. The intake of drink rich in polyphenols has been considered to prevent several diseases such as cancer, neurodegeneration and inflammation (Halliwell 2006; Huang et al. 2010; Ferguson 2010). Hydrolysate from fish skin has been proven to nourish the skin via the induction of fibroblast cell proliferation and collagen production (Benjakul et al. 2018). Thus, the development of herbal soup containing hydrolyzed collagen could bring about the nutraceutical product for health and skin care.
Retort processing is a major preservation techniques widely used in thermal processing for shelf-life extension of foods particularly in the production of ready-to-serve products (Gokhale and Lele 2012). A sterilization temperature above 100 °C is used for production of low acid foods in hermetically sealed containers and in a pressure cooker. Temperatures usually range from 110 to 121 °C, depending on the pressure used and the type of product. Sterilization is generally carried out at 121 °C but the temperature of 115 °C is commonly used for heat sensitive material (Heinz and Hautzinger 2007). Therefore, the retort conditions must be optimized for specific products. An effective thermal process could be designed by varying the sterility level using different times (F0) and temperatures. Nevertheless, thermal conditions could affect the taste, appearance and nutrition as well as bioactivity of final products (Majumdar et al. 2015). Therefore, it is necessary to determine the optimum conditions to ensure the safety, nutritive value and bioactivity of each product.
The objective was to produce soup that had high nutritional content, derived from healthy natural sources, which are safe to eat. To achieve this objective the physical, chemical, sensory and antioxidative characteristics of herbal soup based on seabass skin HC, produced under different retorting conditions was studied. In addition the effects of the soups prepared from different retorting conditions were tested on cell proliferation and collagen production enhancement in an in vitro cell culture system.
Materials and methods
Chemicals and cell lines
Alcalase (EC 3.4.21.62) from Bacillus licheniformis and papain (E.C. 3.4.22.2) from papaya (Carica papaya) latex were gifted from Siam Victory Chemicals Co, Ltd. (Bangkok, Thailand). 2,4,6-trinitrobenzenesulphonic acid (TNBS), bathophenanthrolinedisulphonic acid, 2,2′-azinobis (3-thylbenzothiazoline-6-sulfonic acid) (ABTS), 6-hydroxy-2,5,7,8-tetramethyl-chroman-2-carboxylic acid (Trolox) and 3-(2-pyridyl)-5,6-diphenyl-1,2,4-triazine-4′,4′′-disulfonic acid sodium salt (ferrozine) were purchased from Sigma-Aldrich Chemical Co. (St. Louis, MO, USA). Dulbecco’s modified Eagle’s medium (DMEM) was procured from Corning (Mediatech Inc., Manassas, VA, USA). L929 cells (mouse fibroblast, subcutaneous connective tissue) were purchased from the European Collection of Animal Cell Cultures (Salisbury, UK). Fetal bovine serum (FBS) was obtained from Invitrogen (Paisley, Scotland). All chemicals and reagents for cell culture were obtained from Sigma Chemical Co. All chemicals were of analytical grade.
Preparation of hydrolyzed collagen from seabass skin
Hydrolyzed collagen (HC) from seabass skin was prepared following the method described by Benjakul et al. (2017) with a slight modifications. Briefly, skins of seabass (Lates calcarifer) weighing 2.5–3.0 kg were cleaned by removing the remaining flesh and washing with cold tap water (≤ 10 °C). The samples were placed in polyethylene bags and stored at − 20 °C until used.
Frozen skins were cut into pieces (3.0 × 3.0 cm) using an electric sawing machine (Union Kitchen & Service Co., Ltd., Bangkok, Thailand). The cut frozen skins were thawed and pretreated with alkaline (0.10 M NaOH) and acid (0.10 M citric acid) solutions as described by Benjakul et al. (2017). The resulting pretreated skins were then used for preparing the HC.
Two-step hydrolysis was carried out using 3% papain (pH 7.0) at 40 °C for 3 h, followed by 2% Alcalase (pH 8.0) at 50 °C for 2 h according to the method of Benjakul et al. (2017). After enzyme inactivation, the resulting mixture was filtered through two layers of cheesecloth and two layers of fiberglass filter to remove the debris. The filtrate was then fed into the filter unit, which consisted of a 5µ pleated polypropylene sediment filter (4.5 inch diameter × 20 inches long) (PF10TT, Treatton, Taiwan) at a feed flow rate of 2 L/min using a diaphragm pump (R/O-450, Treatton, Taiwan). The filtered HC was collected and used for preparation of herbal HC soup.
Preparation of herbal HC soup
Herbal HC (HHC) soup was prepared using a traditional Thai process. The dried herbs used in the formulation were as follows (based on total weight): 19.5% Chinese yam tubers (Dioscorea opposita Thunb.), 18.0% Longan fruit (Dimocarpus longan Lour.), 15.5% Gojiberry fruit (Lycium barbarum L.), 13.0% Rehmannia root (Rehmannia glutinosa Libosch.), 10.0% Solomon’s seal (Polygonum multiflorum Thunb.), 8.5% Codonopsis root (Salvia miltiorrhiza Bge), 6.5% Milkvetch root (Astragalus mongholicus Bge.), 5.0% Dong quai [Angelica sinensis (Oliv.) Diels.] and 4.0% Szechuan Lovage root (Ligusticum chuanxiong Hort.). The mixed herbs (120 g) were added to 2 L of deionized water and the mixture was heated at 95 °C for 30 min using a hot plate (C-MAG HS 7, IKA Works Inc., Wilmington, NC, USA) and then filtered through two layers of cheesecloth and the filtrate was transferred manually into 75 mL pasteurized glass bottles with screw caps (5.2 cm diameter × 45 cm high) and was termed ‘herbal extract’. The total reducing compound content was determined by Folin–Ciocalteu reagent (Sato et al. 1996) and shown to be 531.72 mg Gallic equivalent/L. For comparison HC was used instead of deionized water for preparing the HHC soup, in which the same extracting conditions were used. After filtration, the resulting HHC soup was poured into the glass bottles and capped as described above.
Retort process for sterilization
Screw-capped glass bottles containing HHC soup were subjected to thermal processing using a pilot-scale horizontal stationary retort system (Water Spray Retort AT2000, Owner Foods Machinery Co., Ltd., Bangkok, Thailand). Two retort temperatures, 115 and 121 °C, and four retorting periods (F0 values) 5, 7, 9 and 11 min were used. Pressure was maintained at 1.63 kg/cm2 for 115 °C and 1.83 kg/cm2 121 °C throughout the process using a hot water–air mixture.
All glass bottles were placed on perforated trays and then transferred into a retort vessel. Thermocouples (22 × SSA12080E700TS probes, E Val Flex Module, ELLAB, Denmark) were inserted into five of the bottles for measurement of sample temperatures during the thermal process. Data were recorded using a data logging device (E Val Flex System, ELLAB, Denmark) and temperature input data were converted into corresponding process lethality values. These process lethality values were expressed as F0 values. After reaching the required F0 value, the glass bottles were cooled rapidly, by recirculating water, to 45 °C. All glass bottles containing samples were subsequently stored in a dry place at room temperature (28–30 °C) and the samples were subjected to the following analyses.
Analyses
Sterility test
Sterility tests of all the samples with different retort processing conditions were conducted by ADCET (Agro-Industry Development Center for Export, Prince of Songkla University). Total viable aerobic and anaerobic counts of mesophilic and thermophilic microorganisms were determined at 35 and 55 °C, respectively, according to the method of BAM (FDA 2001).
Physicochemical characteristics
Physicochemical characteristics of retort processed HHC (R-HHC) soup, non-retorted processed HHC (NR-HHC) soup, HC and herbal extract were determined as follows.
Moisture content and pH value The samples were analyzed for moisture content using analytical method No. 950.46 (AOAC 2000) and pH using a pH meter (Sartorius PB-10, Göttingen, Germany).
Viscosity measurement Viscosity of the samples was determined at 4 and 25 °C using a Brookfield Viscometer Model RV-DV II Pro+ (Brookfield Engineering Inc, Middleborough, MA, USA) at 200 rpm. The UL cylindrical spindle (ULA-15E) was used along with Brookfield Ametek UL adapter.
Measurement of UV-absorbance and browning index Prior to measurement, appropriate dilution of the samples was made using distilled water and the absorbance was measured at 294 and 420 nm using a UV-1601 spectrophotometer (Shimadzu, Kyoto, Japan) for determining UV-absorbance and browning intensity, respectively (Karnjanapratum et al. 2016).
Measurement of fluorescence intensity Fluorescence intensity of MRP samples with an appropriate dilution was measured at an excitation wavelength of 347 nm and emission wavelength of 415 nm using a RF-1501 Fluorescence Spectrophotometer (Shimadzu, Kyoto, Japan) (Karnjanapratum et al. 2016).
Determination of color Color was measured in a Hunter Lab Colorimeter (C04-1005-631 colorFlex, Reston, VA, USA). The values were expressed as L* (lightness), a* (redness/greenness) and b* (yellowness/blueness). Total difference in color (∆E*) and chroma (∆C*) were then calculated according to Eqs. (1) and (2), respectively (Gennadios et al. 1996; Jangchud and Chinnan 1999).
| 1 |
| 2 |
where ∆L*, ∆a* and ∆b* are the differences between the corresponding color parameter of the sample and that of white standard (L* = 93.65, a* = − 0.95 and b* = 0.52).
Determination of α-amino group content The α-amino group content was determined according to the method of Benjakul and Morrissey (1997). To diluted samples (125 μL), 2.0 mL of 0.2 M phosphate buffer, pH 8.2 and 1.0 mL of 0.01% TNBS solution was added. The solution was mixed thoroughly and placed in a temperature-controlled water bath at 50 °C for 30 min in the dark. The reaction was terminated by adding 2.0 mL of 0.1 M sodium sulfite and mixture was cooled at room temperature for 15 min. l-leucine standard solutions with concentrations ranging from 0.5 to 5.0 mM were used. The absorbance was read at 420 nm and α-amino group content was expressed in term of l-leucine.
Total reducing compound content Total reducing compound content was measured using the Folin–Ciocalteu method described by Sato et al. (1996) with slight modifications. Briefly, 100 µL of sample were transferred into a test tube and 0.75 mL of Folin–Ciocalteu reagent (twofold diluted with deionized water) was added and mixed well. The mixture was allowed to stand at room temperature for 5 min. Then, 0.75 mL of 2% (w/v) sodium carbonate was added to the mixture and mixed gently. After standing at room temperature for 90 min, the absorbance was read at 725 nm using a spectrophotometer (Shimadzu, Kyoto, Japan). Gallic acid solutions (0.01–0.05 mg/mL) were used for standard curve preparation.
Antioxidative activity
All samples were determined for antioxidative activity using different assays. The activities determined in all the assays were expressed as µmol TE/mL sample.
ABTS (2,2′-azino-bis[3-ethylbenzothiazoline-6-sulphonic acid]) radical scavenging activity was determined by the method described by Binsan et al. (2008). A standard curve was prepared from Trolox ranging from 50 to 600 μM.
FRAP (ferric reducing antioxidant power) was determined according to the method described by Benjakul et al. (2017). The standard curve was prepared using Trolox ranging from 0 to 500 µM.
DPPH (2,2-diphenyl-1-1picryl-hydrazyl) radical scavenging activity was quantified as described by Benjakul et al. (2017). The standard curve was prepared using Trolox (0–60 µM).
Hydrogen peroxide (H2O2) scavenging activity was assayed according to the method of Wettasinghe and Shahidi (2000). Trolox (0–10 mM) was used as the standard.
Sensory evaluation
Sensory characteristics of R-HHC and NR-HHC soups were evaluated by 50 untrained panellists. All panellists were asked to evaluate samples for appearance, color, odor, viscosity, flavor, taste and overall likeness using a nine-point hedonic scale, using a score of 1 = not like very much, 5 = neither like nor dislike and 9 = like extremely. The samples were labelled with random three-digit codes. Panellists were instructed to rinse their mouth with water after each sample evaluation and the order of presentation of the samples was randomized (Meilgaard et al. 1999).
Impact of the HHC soup on cell proliferation and enhancement of collagen production of mouse fibroblast cells (L929)
The R-HHC soups that had high antioxidative activity and high likeness score were selected to evaluate their impact on cell proliferation and enhancement of collagen production of L929 cell line, in comparison with herbal extract, HC and NR-HHC soup.
Cell culture
L929 (mouse, subcutaneous connective tissue) cells were cultured in 25 cm3 Corning bottles, with DMEM, at 7.2–7.4 pH. The medium was supplied with 10% FBS. All the culture bottles containing the cell lines were maintained at 37 °C in a 5% CO2 flux incubator (Binder Model C 170, Binder Inc., Johnson Ave Bohemia, NY, USA).
MTT assay: proliferative assays
Triplicate L929 cell lines were seeded at a density of 2 × 10⁴ cells/mL (100 µL) in 96 well plates and 100 µL of the sample solution, at different concentrations, was added to the cell lines. After incubation at 37 °C for 72 h, cell viability was assessed using the MTT (3-(4,5-dimethylthiazol-2-yl)-2,5-diphenyltetrazolium bromide) assay in a MTT I Proliferation Kit (Roche Diagnostics; Burgess Hill, West Sussex, UK) according to the manufacturer’s instructions. Absorbance was read at 570 nm using a FLUOstar Omega microplate reader (BMG LABTECH GmbH, Offenburg, Germany).
Enhancement of collagen production
The selected samples were used to study the collagen production enhancement of mouse fibroblast cell line (L929) using the soluble collagen assay (Biocolor Ltd., UK). L929 cells (100 µL, 2 × 10⁴ cells/mL) were seeded in 96 well plates and incubated at 37 °C for 24 h. The selected samples (100 µL) were then added to the cell lines and consecutively incubated at 37 °C for 48 h. The supernatant was collected (100 µL) and used for measuring the soluble collagen content according to the manufacturer’s instructions. Absorbance was read at 540 nm using a FLUOstar Omega microplate reader. The standard curve was prepared using bovine collagen (0–500 µg/mL).
Statistical analysis
Experiments were carried out in triplicate. Data were subjected to analysis of variance (ANOVA) and comparison of means was carried out using the Duncan’s Multiple Range Test (Steel and Torrie 1980). Statistical analysis was performed using the Statistical Package for Social Science (SPSS 11.0 for windows, SPSS Inc., Chicago, IL, USA).
Results and discussion
Microbiological quality of HHC soups
The microbiological qualities of HHC soups, treated with different retort processing conditions, were evaluated to ensure the safety using a sterility test. There were no total viable aerobic and anaerobic counts for both mesophile and thermophile in all samples that had been subjected to the retorting process, irrespective of time and temperature combination used. This indicated that the thermal processes used could yield HHC soup in glass bottle with microbial safety. Jang and Lee (2012) and Shah et al. (2017) reported similar results for several processed foods that had been retorted for their safety for consumer and shelf-life extension.
Physicochemical properties of HHC soups
Solid content, pH value and viscosity
The effects of various retort processing conditions on composition and properties of HHC soups were tested. Solid content, pH and viscosity of HHC soups from retort processing (R-HHC soup) using different temperatures (115 and 121 °C) and F0 values (5, 7, 9 and 11 min), HC, herbal extract and HHC soups that were not retorted (NR-HHC soup) are shown in Table 1. Solids content of R-HHC soup were not significantly different (p < 0.05) to NR-HHC soup, but herb extract had 3.01% solids content, which was significantly higher (p < 0.05) than the solids content of HC (0.76%). Herb extract was mildly acidic (pH 5.82) (Table 1), which might be due to the presence of some acids or acidic compounds in the herbs. When HC (pH 7.53) was used for extraction of herb, the resulting HHC soup had decreased pH and R-HHC soup had a significantly lower (p < 0.05) pH than of NR-HHC soup. Notably, R-HHC soup, with higher F0 values, showed significantly (p < 0.05) lower pH levels, especially those with the F0 value of 11 min, for both temperatures used. However, there was no significant difference (p > 0.05) in pH value between retort processed samples at 115 and 121 °C when the same F0 was used. Jeong et al. (2004) and Juániz et al. (2016) had previously shown that heating could liberate low molecular weight phenolic compounds from high molecular weight polymers. Jeong et al. (2004) reported that 5-hydroxyvaleric acid, vanillic acid and ferulic acid were detected when sufficient heat treatment was applied in preparing antioxidative phenolic compounds from fruit peel. Karnjanapratum et al. (2016) reported that the decrease in pH of unicorn leatherjacket fish skin (Aluterus monoceros) hydrolysate was in accordance with the formation of MRPs. Thus MRPs formation might be related to the decreased pH levels of HHC soup subjected to retort process.
Table 1.
Solid content, pH value and viscosity of HHC soups with different retort processing conditions
| Samples | F0 | Treatment time (min) | Solid content (%) | pH | Viscosity (cP) | |
|---|---|---|---|---|---|---|
| 25 °C | 4 °C | |||||
| HC | – | 0.76 ± 0.01d | 7.53 ± 0.09a | 2.06 ± 0.01Bc | 2.15 ± 0.02Ac | |
| Herbal extract | – | 3.01 ± 0.00c | 5.82 ± 0.03f | 2.23 ± 0.01Bb | 2.30 ± 0.02Ab | |
| NR-HHC | – | 3.61 ± 0.01b | 7.26 ± 0.02b | 2.29 ± 0.04Ba | 2.46 ± 0.01Aa | |
| R-HHC | ||||||
| 115 | 5 | 22 | 3.64 ± 0.00ab | 6.86 ± 0.02cd | 2.32 ± 0.01Ba | 2.48 ± 0.01Aa |
| 7 | 30 | 3.66 ± 0.03ab | 6.82 ± 0.02cd | 2.32 ± 0.01Ba | 2.46 ± 0.01Aa | |
| 9 | 37 | 3.61 ± 0.01b | 6.78 ± 0.09cd | 2.30 ± 0.02Ba | 2.47 ± 0.01Aa | |
| 11 | 46 | 3.63 ± 0.08ab | 6.54 ± 0.02e | 2.30 ± 0.01Ba | 2.45 ± 0.01Aa | |
| 121 | 5 | 5 | 3.64 ± 0.03ab | 6.92 ± 0.01c | 2.30 ± 0.02Ba | 2.47 ± 0.02Aa |
| 7 | 9 | 3.68 ± 0.02a | 6.71 ± 0.28d | 2.31 ± 0.01Ba | 2.45 ± 0.01Aa | |
| 9 | 13 | 3.67 ± 0.03a | 6.79 ± 0.06cd | 2.29 ± 0.01Ba | 2.47 ± 0.01Aa | |
| 11 | 16 | 3.65 ± 0.03ab | 6.52 ± 0.03e | 2.31 ± 0.01Ba | 2.46 ± 0.01Aa | |
Data are mean ± standard deviation (n = 3)
115 and 121 indicate the temperature used in retort process at 115 and 121 °C, respectively
HC, hydrolyzed collagen; Herb extract, herbal extract using water as medium; NR-HHC, non-retort processed herbal hydrolyzed collagen soup; R-HHC, retort processed herbal hydrolyzed collagen soup
a, b, c, d, e in the same column indicate the significant difference (p < 0.05)
A, B indicates significant difference of viscosity measured at different temperature (p < 0.05)
Viscosity of HHC soups as affected by different retort processing conditions were measured at 25 and 4 °C (Table 1). Higher viscosity was observed for NR-HHC soup, compared to those of herbal extract or HC (p < 0.05). It was noted that there was no significant difference (p < 0.05) in viscosity between R-HHC and NR-HHC soups. Nevertheless, the viscosity of HHC soups at 4 °C was significantly higher (p < 0.05) than that of 25 °C. At the lower temperature, the peptides might be favorably localized or aligned together due to the lower enthalpy. Similar result was reported by Bozdogan (2015) who studied viscosity of bitter orange juice as affected by temperature and found that progressively lower viscosity was observed as the temperature increased; therefore temperature was another factor that could affect physical property or viscosity of HHC soups.
Browning index, absorbance at 294 nm and fluorescence intensity
The impact of retort processing conditions on the Maillard reaction in HHC soups was monitored by measuring browning index including the absorbance at 294 nm and fluorescence intensity. Browning index A420 and A294 of HHC soup with different retort processing conditions are presented in Fig. 1. A420 has been used as a measure of browning index of final products and A294 represents intermediate products of the Maillard reaction. A420 (Fig. 1a) and A294 (Fig. 1b) of NR-HHC were significantly higher (p < 0.05) than those of HC and herbal extract. The result suggested that MRPs could be generated during preparation of HHC soup. Carbonyl compounds in herbs might undergo glycation with free amino group of HC, especially at higher temperatures. Generally, A420 increased with increasing F0. The lower A294 was observed when F0 values increased at both the temperatures tested. This result suggests that the generation of MRPs took place while the intermediate products were converted to final MRPs.
Fig. 1.

A420 (a), A294 (b) and fluorescence intensity (c) of HHC soups with different retort processing conditions. HC, hydrolyzed collagen; Herbal extract, herbal extract using water as medium; NR-HHC, non-retort processed herbal hydrolyzed collagen soup; R-HHC, retort processed herbal hydrolyzed collagen soup. Bars represent standard deviation (n = 3). Different letters on the bars indicate significant differences (p < 0.05). Numbers denote F0 values (5, 7, 9 and 11 min)
A similar trend was also found for fluorescence intensity (Fig. 1c), in which HHC soups showed significantly higher intensity (p < 0.05) than HC and herbal extract. Jing and Kitts (2002) reported that fluorescence in the Maillard reaction occurs prior to the generation of brown pigments and can be used to indicate the reaction rate and MRPs formation. NR-HHC soup showed significantly higher fluorescence intensity (p < 0.05) than HC and herbal extract. In addition, the retorting process enhanced the fluorescence intensity of resulting HHC soups (R-HHC soups). Fluorescence intensity was increased as Fo increased for both the temperatures used. Samples retorted at 121 °C showed significantly lower fluorescence intensity (p < 0.05) than those retorted at 115 °C. The differences in MRPs, including intermediates and final products, might govern the varying bioactivity of samples obtained from different retort processing conditions. Benjakul et al. (2005) showed a correlation between antioxidative activity and fluorescence intensity or browning intensity in sugar-amino acid model systems. The Maillard reaction was associated with improved antioxidative activity of hydrolysate from unicorn leatherjacket fish skin (Aluterus monoceros) and silver carp muscle (Hypophthalmichthys molitrix) (Karnjanapratum et al. 2016; You et al. 2011).
Color
The effect of retort processing conditions used on color of HHC soups was determined. Color of HHC soups was evaluated in comparison with HC and herb extract (Table 2). NR-HHC soup showed the marked decrease in lightness (L*) that coincided with increased yellowness (b*). Total color difference (∆E*) and difference in chroma (∆C*) of HHC soups were significantly different (p < 0.05) from those of HC and herb extract. Darker and browner colors were found in HHC soup, compared to HC, which was in agreement with the higher browning index (Fig. 1) of HHC soup. Ke et al. (2012) showed that non-enzymatic glycation (Maillard reaction) and formation of nanostructures distinguish soups from their raw materials, yielding soup with bio-functions. In general, there were no significant differences (p > 0.05) in A420, L*, a*, b*, ∆E* and ∆C* values between NR-HHC and R-HHC soups. Furthermore, different retort processing conditions in the ranges tested did not affect the color of the HHC soups.
Table 2.
Color profile and α-amino group content of HHC soups with different retort processing conditions
| Samples | F0 | Color | α-amino group content (mmol/L sample) | Total reducing compound content (mg/L sample) | ||||
|---|---|---|---|---|---|---|---|---|
| L* | a* | b* | ∆E* | ∆C* | ||||
| HC | 36.27 ± 0.03a | 5.89 ± 0.07c | 18.59 ± 0.08b | 61.79 ± 0.02c | 11.07 ± 0.04b | 76.38 ± 1.84a | 315.96 ± 2.57e | |
| Herb extract | 31.59 ± 0.32b | 19.04 ± 0.13a | 42.71 ± 2.96a | 77.10 ± 1.88b | 45.32 ± 2.73a | 2.60 ± 0.92d | 531.72 ± 4.22d | |
| NR-HHC | 12.14 ± 0.31c | 10.52 ± 0.12b | 12.83 ± 0.60c | 79.81 ± 0.24a | 8.28 ± 0.254c | 75.32 ± 2.76a | 865.60 ± 21.71c | |
| R-HHC | ||||||||
| 115 | 5 | 12.47 ± 0.40c | 10.12 ± 0.83b | 12.79 ± 0.69c | 79.50 ± 0.60a | 8.15 ± 0.15c | 66.30 ± 6.44b | 930.09 ± 9.29b |
| 7 | 12.21 ± 0.42c | 10.11 ± 0.72b | 12.7 ± 0.20c | 79.67 ± 1.20a | 8.29 ± 0.25c | 67.89 ± 4.60b | 979.18 ± 16.95a | |
| 9 | 12.21 ± 0.71c | 10.17 ± 0.53b | 12.72 ± 0.56c | 79.87 ± 0.33a | 8.19 ± 0.31c | 62.05 ± 3.68bc | 928.64 ± 13.88b | |
| 11 | 12.12 ± 0.36c | 10.18 ± 0.29b | 12.80 ± 0.46c | 79.79 ± 0.56a | 8.21 ± 0.29c | 62.05 ± 4.01bc | 943.50 ± 11.71b | |
| 121 | 5 | 12.37 ± 0.53c | 9.93 ± 0.83b | 12.76 ± 0.56c | 79.81 ± 0.64a | 8.25 ± 0.33c | 57.80 ± 2.79c | 922.48 ± 35.96b |
| 7 | 12.43 ± 0.55c | 10.20 ± 0.95b | 12.73 ± 0.55c | 79.50 ± 0.50a | 8.28 ± 0.41c | 58.33 ± 1.84c | 922.30 ± 17.27b | |
| 9 | 12.13 ± 0.81c | 10.26 ± 0.69b | 12.75 ± 0.35c | 79.71 ± 0.94a | 8.26 ± 0.53c | 61.52 ± 4.01bc | 932.99 ± 8.75b | |
| 11 | 12.15 ± 0.40c | 10.20 ± 0.20b | 12.75 ± 0.88c | 79.74 ± 0.98a | 8.23 ± 0.27c | 66.30 ± 4.60b | 1002.01 ± 10.35a | |
Data are mean ± standard deviation (n = 3)
115 and 121 indicate the temperature used in retort process at 115 and 121 °C, respectively
HC, hydrolyzed collagen; Herb extract, herbal extract using water as medium; NR-HHC, non-retort processed herbal hydrolyzed collagen soup; R-HHC, retort processed herbal hydrolyzed collagen soup
a, b, c, d, e in the same column indicate the significant difference (p < 0.05)
α-amino group
Changes in peptides in HC due to different retort processing conditions were monitored by measuring free α-amino group content of HHC soups in comparison with those of HC and herbal extract (Table 2). NR-HHC soup had similar α-amino group contents to HC that were not significantly different (p < 0.05). Nevertheless, very low α-amino group content was found in the herbal extract, indicating that they contained negligible free amino groups. HC was rich in free amino groups. There were significantly decreased (p < 0.05) levels of α-amino group content in R-HHC soups compared to NR-HHC soup but no significant differences (p > 0.05) were observed in α-amino group content with different F0 values when the retort temperature was 115 °C. Nevertheless, the significant increase (p < 0.05) in α-amino group content was found in R-HHC soups with F0 of 11 min at 121 °C, but the α-amino group content tended to decrease with increasing F0 at 115 °C, which was in accordance with the increase in browning index and fluoresces intensity (Fig. 1). The results suggested that α-NH2 or ε-NH2 groups in the HC are covalently attached to the carbonyl group of herbal extract to form advanced glycation end products to a greater extent with increasing heating time (F0 values). Budryn et al. (2016) had previously shown that phenolic-amino acid interactions could take place during food processing, leading to the reduction of free amino acids and peptides in protein hydrolysates. For soup prepared with a retort temperature of 121 °C, the increase in the free amino group content might be due to the formation of the low molecular weight peptides at high temperature (Karnjanapratum and Benjakul 2015). Therefore, the retorting process used in the present study might have induced some chemical reactions, particularly Maillard reaction and phenolic compound-peptide complex, which might be related to bioactivity of resulting HHC soup.
Total reducing compound content
Total reducing compound contents of herbal extract and HHC soups with and without being subjected to the retort process were also investigated using the Folin–Ciocalteu (F–C) reagent (Table 2). F–C reagent was reactive towards reducing compounds including phenols, thiols, proteins and amino acids (Everette et al. 2010). HC contained the reducing compounds of 315.86 mg/L, while higher total reducing compound content was noted for W/O-Retort (865.60 mg/L). This was attributed to the reducing power of both HC and herbal extract (531.72 mg/L). Slight increases in total reducing compound content were observed after being subjected to the retort process, but different lethality levels used had no significant effect (p < 0.05) on total reducing compound content for both the temperatures tested. Among all the samples, the HHC soups obtained from F0 at 7 and 11 min with the retort temperatures of 115 and 121 °C showed the highest reducing compound contents. It was postulated that an increase in total reducing compound content might correlate with the changes in phenolic compounds or peptides, in which the fragmentation of high molecular weight polyphenols and peptides occurred and generated new low molecular weight derivatives (Lee et al. 2003; Jeong et al. 2004; Juániz et al. 2016; Karnjanapratum and Benjakul 2015). On the other hand, Budryn et al. (2016) found that the decrease in reducing power might be governed by the formation HC-phenolic complex. In general, the generation of new complexes could empower the bioactivity more effectively than the innate ingredients (Ke et al. 2012). Therefore, total reducing compound content of HHC soups generally determined the bioactivity of HHC soups.
Antioxidative activities of HHC soups
The impact of the retort processing used on antioxidative activities of HHC soups was investigated using different in vitro chemical assays. ABTS and DPPH radical scavenging activities, ferric reducing antioxidant power and hydrogen peroxide scavenging activity of HHC soups with different retort processing conditions are shown in Fig. 2. ABTS radical scavenging activity (Fig. 2a) of HC and herbal extract samples were 89.81 and 1126.85 µmol TE/L sample, respectively and significant increases in activity (p < 0.05) were found for NR-HHC soup indicating that the herbal extract could contribute to the increased activity in HHC soup. Moreover, the generation of new compounds, especially MRPs in the presence of herbal extract and peptides in HC, could result in the increased ABTS radical scavenging activity of the HHC soups. As the F0 values increased the ABTS radical scavenging activity significantly increased (p < 0.05) in R-HHC soups prepared at the retort temperature of 121 °C. Nevertheless, there was no significant difference (p > 0.05) between samples prepared at 151 °C with different F0 values. Similar results were observed for FRAP (Fig. 2b). FRAP of NR-HHC soup were significantly higher (p < 0.05) than those of HC and herbal extract. FRAP increased in all the R-HHC soups. Increased F0 values could enhance the activity of R-HHC soups, particularly those with retort temperature of 121 °C. Chotphruethipong et al. (2017) showed that phenolic compounds act as antioxidants not only because of their ability to donate hydrogen or electrons but also their stable radical intermediates. MRPs formed in R-HHC soups also contributed to the increased antioxidative activity. In general, ABTS radical scavenging activity and FRAP correlated well with browning index (Fig. 1a) and fluorescence intensity (Fig. 1c). The correlations between antioxidative activity and MRPs have been previously reported (You et al. 2011; Wang et al. 2016). Due to high ABTS radical scavenging activity and reducing power, HHC soups produced using the retorting process would have enhanced antioxidative activity thus increasing their health benefits.
Fig. 2.
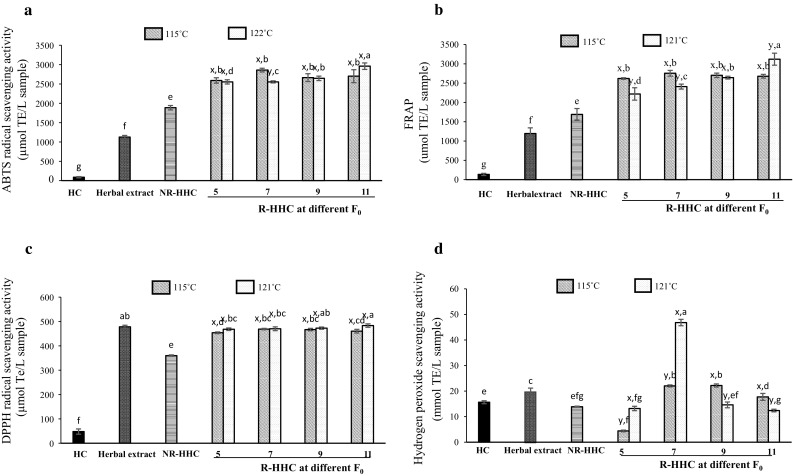
Antioxidative activities of HHC soups with different retort processing conditions. HC, hydrolyzed collagen; Herbal extract, herbal extract using water as medium; NR-HHC, non-retort processed herbal hydrolyzed collagen soup; R-HHC, retort processed herbal hydrolyzed collagen soup. Bars represent standard deviation (n = 3). a,b,c,d,e,f,gSignificant differences (p < 0.05). x,ySignificant differences within the same F0 value (p < 0.05). Numbers denote F0 values (5, 7, 9 and 11 min)
DPPH radical and H2O2 scavenging activities of different samples are shown in Fig. 2c, d, respectively and both activities of NR-HHC soup were significantly lower (p < 0.05) than those of herbal extract. However, the retort process used showed the potential enhancement of activities. It was noted that the highest DPPH radical scavenging activity was observed at the highest F0 value used, particularly at 121 °C, which was significant at p < 0.05. No significant (p >0.05) increase in DPPH radical scavenging activity was observed in R-HHC soups prepared at 115 °C when the F0 value increased. H2O2 scavenging activity of R-HHC soups varied, depending on retort conditions (Fig. 2d). Among all samples, the soup prepared at 121 °C with an F0 value of 7 min showed the highest activity, which was significantly higher at p < 0.05. Karnjanapratum and Benjakul (2015) had shown that thermal processing affected antioxidative activity of fish skin hydrolysate. Phenolic compounds also contributed to H2O2 scavenging activity (Juániz et al. 2016). The decreased H2O2 scavenging activity was observed for autoclaved fish skin hydrolysates (Karnjanapratum and Benjakul 2015). H2O2 has been known to be generated in vivo by several oxidizing enzymes, such as superoxide dismutase. Together with reactive oxygen species, it can be broken down to hydroxyl radical (·OH) and singlet oxygen (O·−2) via the Fenton reaction in the presence of Fe2+ (Wang et al. 2007). ·OH and O·−2 can initiate lipid peroxidation and be toxic to cells. Therefore, it is crucial for cells to remove H2O2 via an antioxidant defense (Wang et al. 2007). The results indicated that the retort process used for shelf-life extension could influence the antioxidative activities of HHC soups in different ways.
Sensory characteristics
To investigate the effect of retort processing conditions on sensory properties, a nine-point hedonic scale was used to evaluate the likeness of different HHC soups along with R-HHC soups in comparison with NR-HHC soup (Table 3). All samples showed acceptability with the score for likeness being greater than or equal to 7 (moderately like) for all attributes tested. In general, there was no significant difference (p > 0.05) in likeness score for all attributes between R-HHC and NR-HHC soups. All samples had similar scores for viscosity (Table 1) and color (Table 2) among all the samples, which were not significantly (p > 0.05) different indicating that the conditions of retort process used in the present study had no detrimental effect on sensory properties of HHC soup. Shah et al. (2017) reported similar results for retort processed meat curry in which there was no difference in sensory properties of products at 121 °C with different retorting times (F0 of 7–11 min).
Table 3.
Sensory characteristics of HHC soups with different retort processing conditions
| Characteristics | NR-HHC | R-HHC | |||||||
|---|---|---|---|---|---|---|---|---|---|
| 115 | 121 | ||||||||
| 5 | 7 | 9 | 11 | 5 | 7 | 9 | 11 | ||
| Appearance | 7.84 ± 1.21 | 7.84 ± 0.83 | 7.68 ± 1.11 | 7.74 ± 0.93 | 7.89 ± 1.05 | 7.68 ± 0.82 | 7.68 ± 1.11 | 7.58 ± 0.90 | 7.79 ± 0.85 |
| Color | 7.79 ± 1.32 | 7.63 ± 1.54 | 7.53 ± 1.68 | 7.37 ± 1.74 | 7.63 ± 1.71 | 7.63 ± 1.38 | 7.68 ± 1.73 | 7.47 ± 1.71 | 7.53 ± 1.58 |
| Odor | 7.63 ± 0.96 | 7.42 ± 1.30 | 7.58 ± 1.12 | 7.37 ± 1.26 | 7.79 ± 1.23 | 7.42 ± 1.12 | 7.42 ± 1.68 | 7.42 ± 1.30 | 7.63 ± 1.30 |
| Flavor | 7.26 ± 0.99 | 7.26 ± 1.48 | 7.16 ± 1.21 | 7.26 ± 1.15 | 7.37 ± 1.46 | 7.21 ± 1.51 | 7.11 ± 1.79 | 7.42 ± 1.46 | 7.47 ± 1.31 |
| Viscosity | 7.21 ± 1.32 | 7.00 ± 1.11 | 7.11 ± 1.10 | 7.00 ± 0.88 | 7.00 ± 1.00 | 7.00 ± 1.05 | 7.05 ± 1.13 | 7.00 ± 1.05 | 7.00 ± 1.05 |
| Taste | 7.00 ± 1.00 | 7.32 ± 1.06 | 7.21 ± 1.27 | 7.37 ± 1.07 | 7.53 ± 1.02 | 7.37 ± 1.30 | 7.00 ± 1.41 | 7.42 ± 1.22 | 7.32 ± 1.00 |
| Overall | 7.16 ± 1.17 | 7.42 ± 1.02 | 7.26 ± 1.10 | 7.21 ± 0.92 | 7.42 ± 0.84 | 7.47 ± 0.90 | 7.05 ± 1.31 | 7.32 ± 0.95 | 7.47 ± 1.12 |
Data are mean ± standard deviation (n = 3)
115 and 121 indicate the temperature used in retort process at 115 and 121 °C, respectively
5, 7, 9, 11 indicate F0 value of retort process used
NR-HHC, non-retort processed herbal hydrolyzed collagen soup; R-HHC, retort processed herbal hydrolyzed collagen soup
Effect of selected HHC soups on cell proliferation of L929 cells
Since R-HHC soups from both retort temperatures with an F0 value of 7 min possessed high activity for all antioxidative assays tested and had high acceptance by the sensory panel, these two treatments were selected for a comparison of their effect on cell proliferation and collagen production of L929 mouse fibroblast cells using a MTT test in comparison with HC, herbal extract and NR-HCC soup at various concentrations (Fig. 3a). None of the samples showed toxicity to L929 cell viability. More than 80% of cell viability was found at all the concentrations tested, compared with that of control that had 100% cell proliferation. HC showed the stimulatory effect on cell growth with the highest cell proliferation (110–112%), regardless of concentration. Collagen peptides in HC might serve as a good nutrient for cell growth but lower cell viability was observed for herb extract, which might be related to its acidity since its pH was less than 6 (Table 1). Consequently, slightly decreased pH levels of the culture medium (pH 6.2–6.5) were obtained, but herbal extract showed no cytotoxic effect on L929 cell proliferation under the concentration range tested. It was noted that the retort processing used could increase the potential of R-HHC soup in cell growth stimulation as evidenced by the increased cell proliferation. The activities of samples retorted at 115/7 and 121/7 were not significantly different (p < 0.05) at the same concentration tested. Nevertheless, 115/7 samples, especially at 6-times and 4-times dilution, showed comparable activity to those of HC and were not significantly different (p < 0.05), which resulted in the highest cell proliferation. Antioxidative compounds have previously been shown to possess various bioactivities such as potential to stimulate proliferation of L929 cells (Pitz et al. 2016) and antitumor activity (Chen et al. 2013). Liu et al. (2014) reported, using flow cytometry scanning, that collagen peptides markedly increased osteoblast growth by promoting DNA synthesis. Thus, the stimulation effect of R-HHC soups on L929 cell proliferation, especially for 115/7 sample, was confirmed.
Fig. 3.
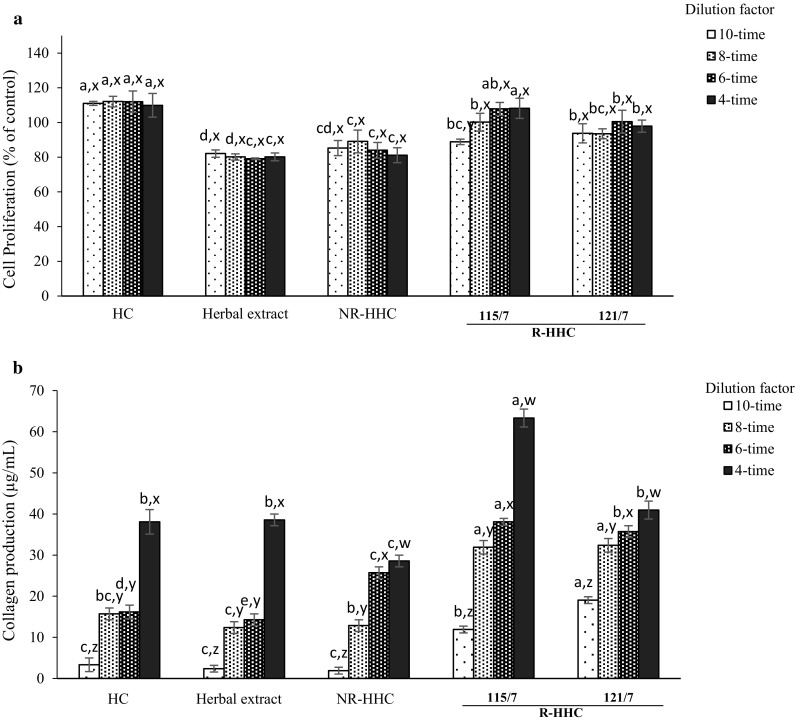
Effect of HHC soups with different retort processing conditions on cell proliferation (a) and enhancement of collagen production (b) of mouse fibroblast L929 cells. HC, hydrolyzed collagen; Herb extract, herbal extract using water as medium; NR-HHC, non-retort processed herbal hydrolyzed collagen soup; 115/7, retort processed herbal hydrolyzed collagen soup with F0 value of 7 min at 115 °C; 121/7, retort processed herbal hydrolyzed collagen soup with F0 value of 7 min at 121 °C. Bars represent standard deviation (n = 3). a,b,c,dSignificant differences (p < 0.05). x,ySignificant differences within the same sample (p < 0.05)
Effect of selected HHC soups on collagen production of L929 cells
The impact of selected HHC soups on collagen production of L929 cells was investigated using in vitro cell culture. Collagen production enhancement of R-HHC soups (115/7 and 121/7 samples) is shown in Fig. 3b. Collagen production of L929 mouse fibroblasts was enhanced in a dose dependent manner in NR-HHC, both R-HHC samples and both retorting processes (115/7 and 121/7). HC showed similar (p > 0.05) activity to those of herb extract. NR-HHC soup, particularly at 6-times dilution, had significantly higher potential (p < 0.05) than HC and herbal extract at the same concentration used. Nevertheless, significantly lower activity (p < 0.05) of NR-HHC soup was observed when the highest concentration (4-time dilution) was applied. Thus, retort processing augmented the effects of HHC soup in inducing collagen production of L929 cells. The 115/7 sample showed the significantly higher potential (p < 0.05) in enhancing collagen production in L929 cells, which was in accordance with its cell proliferation stimulation (Fig. 3). Schwarz (2015) found that in high collagen producing cells, particularly fibroblasts, the pathway is controlled by post-transcriptional regulation, which requires feedback control between secretion and translation rates and is based on the helical structure of the procollagen molecule and additional tissue-specific modifications. Shibuya et al. (2014) found that fish collagen peptide could activate in vitro fibroblast cell growth and transcriptionally up-regulate type I collagen in vivo. Therefore, HHC soups, especially those subject to 115/7, promoted collagen production in L929 fibroblast cells by regulating/stimulating DNA synthesis.
Conclusion
Retort processed HHC soups in glass bottle were prepared using different retort processing conditions. Retort process generally caused some changes in physicochemical properties, while enhancing antioxidative activities of resulting HHC soups. The sensory evaluation panel found that R-HHC soups had high acceptance, which was comparable to NR-HHC soup. High antioxidative activities were found in R-HHC soups with F0 value of 7 min at both 115 and 121 °C. These HHC soups could induce cell proliferation as well as enhance collagen production of L929 cells. Therefore, it is concluded that R-HHC soup in glass bottles could be a new ready-to-serve functional drink that has health benefits.
Acknowledgements
This work was supported by the Higher Education Research Promotion and National Research University Project of Thailand, Office of the Higher Education Commission. The TRF Distinguished Research Professor Grant was also acknowledged.
References
- AOAC . Official method of analysis of AOAC International. 17. Washington DC: Association of Official Analytical Chemists; 2000. [Google Scholar]
- Benjakul S, Morrissey MT. Protein hydrolysates from Pacific whiting solid wastes. J Agric Food Chem. 1997;45:3423–3430. doi: 10.1021/jf970294g. [DOI] [Google Scholar]
- Benjakul S, Lertittikul W, Bauer F. Antioxidative activity of Maillard reaction products from a porcine plasma protein-sugar model system. Food Chem. 2005;93:189–196. doi: 10.1016/j.foodchem.2004.10.019. [DOI] [Google Scholar]
- Benjakul S, Karnjanapratum S, Visessanguan SW. Production and characteriszation of odorless antioxidative hydrolyzed collagen from seabass (Lates calcarifer) skin without descaling. Waste Biomass Valorization. 2017 [Google Scholar]
- Benjakul S, Karnjanapratum S, Visessanguan W. Hydrolysed collagen from Lates calcarifer skin: Its acute toxicity and impact on cell proliferation and collagen production of fibroblasts. Int J Food Sci Technol. 2018 [Google Scholar]
- Binsan W, Benjakul S, Visessanguan W, Roytrakul S, Tanaka M, Kishimura H. Antioxidative activity of Mungoong, an extract paste, from the cephalothorax of white shrimp (Litopenaeus vannamei) Food Chem. 2008;106:185–193. doi: 10.1016/j.foodchem.2007.05.065. [DOI] [Google Scholar]
- Bozdogan A. Viscosity behavior of bitter orange (Citrus aurantium) juice as affected by temperature and concentration. CyTA J Food. 2015;13:535–540. [Google Scholar]
- Budryn G, Zaczynska D, Rachwal-Rosiak D. Effect of green coffee polyphenols on properties of protein hydrolysates in model systems. J Food Process Preserv. 2016 [Google Scholar]
- Chen L, Song L, Li T, Zhu J, Xu J, Zheng Q, Yu R. A new antiproliferative and antioxidant peptides isolated from Arca subcrenata. Mar Drugs. 2013;11:1800–1814. doi: 10.3390/md11061800. [DOI] [PMC free article] [PubMed] [Google Scholar]
- Chotphruethipong L, Benjakul S, Kijroongrojana K. Optimization of extraction of antioxidative phenolic compounds from cashew (Anacardium occidentale L.) leaves using response surface methodology. J Food Biochem. 2017 doi: 10.1007/s13197-019-03617-9. [DOI] [PMC free article] [PubMed] [Google Scholar]
- Ekor M. The growing use of herbal medicines: issues relating to adverse reactions and challenges in monitoring safety. Front Pharmacol. 2013 doi: 10.3389/fphar.2013.00177. [DOI] [PMC free article] [PubMed] [Google Scholar]
- Everette JD, Bryant QM, Green AM, Abbey YA, Wangila GW, Walker RB. A thorough study of reactivity of various compound classes towards the Folin–Ciocalteu reagent. J Agric Food Chem. 2010;58:8139–8144. doi: 10.1021/jf1005935. [DOI] [PMC free article] [PubMed] [Google Scholar]
- FDA (2001) Bacteriological analytical manual, Chapter 21A, examination of canned foods U.S. Department of Health and Human Services, Food and Drug Administration, Center for Food Safety and Applied Nutrition. https://www.fda.gov/Food/FoodScienceResearch/LaboratoryMethods/ucm109398.htm. Accessed 19 Oct 2017
- Ferguson LR. Chronic inflammation and mutagenesis. Mutat Res. 2010;690:3–11. doi: 10.1016/j.mrfmmm.2010.03.007. [DOI] [PubMed] [Google Scholar]
- Gennadios A, Weller CL, Hanna MA, Froning GW. Mechanical and barrier properties of egg albumen films. J Food Sci. 1996;61:585–589. doi: 10.1111/j.1365-2621.1996.tb13164.x. [DOI] [Google Scholar]
- Gokhale SV, Lele SS. Retort process modeling for Indian traditional foods. J Food Sci Technol. 2012 doi: 10.1007/s13197-012-0844-3. [DOI] [PMC free article] [PubMed] [Google Scholar]
- Gómez-Guillén MC, Giménez B, López-Caballero ME, Montero MP. Functional and bioactive properties of collagen and gelatin from alternative sources: a review. Food Hydrocoll. 2011;25:1813–1827. doi: 10.1016/j.foodhyd.2011.02.007. [DOI] [Google Scholar]
- Halliwell B. Oxidative stress and neurodegeneration: where are we now? J Neurochem. 2006;97:1634–1658. doi: 10.1111/j.1471-4159.2006.03907.x. [DOI] [PubMed] [Google Scholar]
- Heinz G, Hautzinger P. 2007/20 Meat processing technology for small-to medium-scale producers. Food and Agriculture Organization of the United Nations (FAO): Bangkok; 2007. [Google Scholar]
- Huang WY, Cai YZ, Zhang Y. Natural phenolic compounds from medicinal herbs and dietary plants: potential use for cancer prevention. Nutr Cancer. 2010 doi: 10.1080/01635580903191585. [DOI] [PubMed] [Google Scholar]
- Jang DH, Lee KT. Quality changes of ready-to-eat ginseng chicken porridge during storage at 25°C. Meat Sci. 2012;92:469–473. doi: 10.1016/j.meatsci.2012.05.013. [DOI] [PubMed] [Google Scholar]
- Jangchud A, Chinnan MS. Properties of peanuts protein film: sorption isotherm and plasticizer effect. Lebenson Wiss Technol. 1999;32:89–94. doi: 10.1006/fstl.1998.0498. [DOI] [Google Scholar]
- Jeong SM, Kim SY, Kim DR, Jo SC, Nam KC, Ahn DU, Lee SC. Effect of heat treatment on the antioxidant activity of extracts from citrus peels. J Agric Food Chem. 2004;52:3389–3393. doi: 10.1021/jf049899k. [DOI] [PubMed] [Google Scholar]
- Jing H, Kitts DD. Chemical and biochemical properties of casein-sugar Maillard reaction products. Food Chem Toxic. 2002;40:1007–1015. doi: 10.1016/S0278-6915(02)00070-4. [DOI] [PubMed] [Google Scholar]
- Juániz I, Ludwig IA, Huarte E, Pereira-Caro G, Moreno-Rojas JM, Cid C, De Peña MP. Influence of heat treatment on antioxidant capacity and (poly)phenolic compounds of selected vegetables. Food Chem. 2016;197:466–473. doi: 10.1016/j.foodchem.2015.10.139. [DOI] [PubMed] [Google Scholar]
- Karnjanapratum S, Benjakul S. Characteristics and antioxidative activity of gelatin hydrolysates from unicorn leatherjacket skin as affected by autolysis-assisted process. J Food Process Preserv. 2015;39:915–926. doi: 10.1111/jfpp.12304. [DOI] [Google Scholar]
- Karnjanapratum S, Benjakul S, O’Brian N. Production of antioxidative Maillard reaction products from gelatin hydrolysate of unicorn leatherjacket skin. J Aquat Food Prod Technol. 2016 [Google Scholar]
- Ke LJ, Zhou JW, Gao GZ, Shao B, Wang HQ, Rao PF. Revealing the secreat of soups’ healing power: nanostructures and their functions. J Food Drug Anal. 2012;20:275–279. [Google Scholar]
- Lee SC, Kim JH, Jeong SM, Kim DR, Ha JU, Nam KC, Ahn DU. Effect of far-infrared radiation on the antioxidant activity of rice hulls. J Agric Food Chem. 2003;51:4400–4403. doi: 10.1021/jf0300285. [DOI] [PubMed] [Google Scholar]
- Liu J, Zhang B, Song SJ, Ma M, Si SY, Wang YH, Xu BX, Feng K, Wu JG, Guo YC. Bovine collagen peptides compounds promote the proliferation and differentiation of MC3T3-E1 pre osteoblasts. PLoS ONE. 2014 doi: 10.1371/journal.pone.0099920. [DOI] [PMC free article] [PubMed] [Google Scholar]
- Majumdar RK, Dhar B, Roy D, Saha A. Optimization of process conditions for Rohu fish in curry medium in retortable pouches using instrumental and sensory characteristics. J Food Sci Technol. 2015;52:5671–5680. doi: 10.1007/s13197-014-1673-3. [DOI] [PMC free article] [PubMed] [Google Scholar]
- Meilgaard M, Civille GV, Carr BT. Sensory evaluation techniques. 3. Boca Raton: CRC Press; 1999. [Google Scholar]
- Pitz HS, Pereira A, Blasius MB, Voytena APL, Affonso RCL, Fanan S, Trevisan ACD, Ribeiro-do-Valle RM, Maraschin M. In vitro evaluation of the antioxidant activity and wound healing properties of Jaboticaba (Plinia peruviana) fruit peel hydroalcoholic extract. Oxid Med Cell Longev. 2016 doi: 10.1155/2016/3403586. [DOI] [PMC free article] [PubMed] [Google Scholar]
- Sato M, Ramarathnam N, Suzuki Y, Ohkubo T, Takeuchi M, Ochi H. Varietal differences in the phenolic content and superoxide radical scavenging potential of wines from different sources. J Agric Food Chem. 1996;44:37–41. doi: 10.1021/jf950190a. [DOI] [Google Scholar]
- Schwarz RI. Collagen I and the fibroblast: high protein expression requires a new paradigm of post-transcriptional, feedback regulation. Biochem Biophys Rep. 2015;3:38–44. doi: 10.1016/j.bbrep.2015.07.007. [DOI] [PMC free article] [PubMed] [Google Scholar]
- Shah MA, Bosco SJD, Mir SA. Evaluation of shelf life of retort pouch packaged Rogan josh, a traditional meat curry of Kashmir, India. Food Packag Shelf Life. 2017;12:76–82. doi: 10.1016/j.fpsl.2017.04.001. [DOI] [Google Scholar]
- Shibuya S, Ozawa Y, Toda T, Watanabe K, Tometsuka C, Ogura T, Koyama Y, Shimizu T. Collagen peptide and vitamin C additively attenuate age-related skin atrophy in Sod1-deficient mice. Biosci Biotechnol Biochem. 2014;78:1212–1220. doi: 10.1080/09168451.2014.915728. [DOI] [PubMed] [Google Scholar]
- Steel RGD, Torrie JH. Principles and procedures of statistics: a biometrical approach. 2. New York: McGraw-Hill; 1980. [Google Scholar]
- Thiansilakul Y, Benjakul S, Shahidi F. Antioxidative activity of protein hydrolysate from round scad muscle using alcalase and flavourzyme. J Food Biochem. 2007;31:266–287. doi: 10.1111/j.1745-4514.2007.00111.x. [DOI] [Google Scholar]
- Wang JS, Zhao QZ, Jiang YM. Antioxidant properities of papain hydrolysates of wheat gluten in different oxidation systems. Food Chem. 2007;101:1658–1663. doi: 10.1016/j.foodchem.2006.04.024. [DOI] [Google Scholar]
- Wang L, Jiang Z, Tian B, Bai L, Shi X, Zhang X. Effects of galactose concentration on characteristics of angiotensin-I-converting enzyme inhibitory peptides derived from bovine casein in Maillard reaction. Int J Food Prop. 2016;19:2238–2250. doi: 10.1080/10942912.2015.1121397. [DOI] [Google Scholar]
- Wettasinghe M, Shahidi F. Scavenging of reactive-oxygen species and DPPH free radicals by extracts of borage and evening primrose meals. Food Chem. 2000;70:17–26. doi: 10.1016/S0308-8146(99)00269-1. [DOI] [Google Scholar]
- You J, Luo Y, Shen H, Song Y. Effect of substrate ratios and temperatures on development of Maillard reaction and antioxidant activity of silver carp (Hypophthalmichthys molitrix) protein hydrolysate-glucose system. Int J Food Sci Technol. 2011;46:2467–2474. doi: 10.1111/j.1365-2621.2011.02769.x. [DOI] [Google Scholar]