Abstract
Ergosterol, a precursor of vitamin D2, is present in the cell membrane of all fungi. It can be transformed into vitamin D2 by UV-B exposure. In this study, a basidiomycete, Pleurotus sapidus, cultivated in liquid malt extract medium was exposed to UV-B light. In addition, autoclaved, abiotic mycelium was put through UV-B exposure for the first time. The effects of different UV-B exposure times, surface areas and temperatures on vitamin D2 formation were analyzed. The conversion of ergosterol to vitamin D2 at ambient temperature almost reached completion within 10 min resulting in vitamin D2 concentrations of 365 µg (g dry matter)−1. Prolonged exposure of the biotic mycelium for up to 60 min resulted in a reduced vitamin D2 concentration with stagnation at about 280 µg (g dry matter)−1. Exposure of the abiotic mycelium showed a slower increase but also leveled off at the same concentration. Furthermore, it could be shown that vitamin D2 formation depends on the temperature and the exposed surface area. The vitamin D2 concentration augmented after increasing the exposed surface from 65.0 to 298.6 cm2. The ergosterol content of P. sapidus was analyzed in a way similar to vitamin D2 and resulted in 3.75 ± 0.06 mg (g dry matter)−1 ergosterol.
Electronic supplementary material
The online version of this article (10.1007/s13197-018-3290-z) contains supplementary material, which is available to authorized users.
Keywords: Ergosterol, UV-B treatment, Temperature dependence, Surface areas, Vitamin D2 enrichment
Introduction
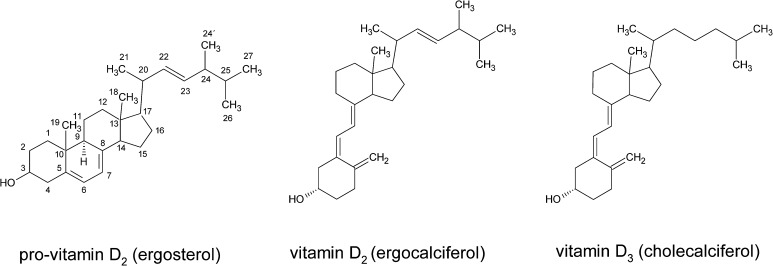
Vitamin D is an essential component of a healthy human diet. A deficiency can lead to severe osteomalacia and rickets due to insufficient bone mineralization. In humans, vitamin D3 is formed in the skin from its precursor 7-dehydrocholesterol by exposure to sunlight (Holick 2004). In case of insufficient sun exposure and, thus, reduced vitamin D3 formation, it can be supplied via food intake from a few animal sources such as egg yolk or fish. An alternative is vitamin D2 present in fruiting bodies of fungi (Mattila et al. 1994). In comparison to the animal derived vitamin D3, D2 has an additional methyl group at C24 and a double bond between C22 and C23 (Fig. 1). The precursor of vitamin D2 is ergosterol (Fig. 1), a membrane lipid almost exclusively located in the cell membrane of fungi. Ergosterol can easily be transformed into vitamin D2 by UV-B exposure (Roberts et al. 2008). Nevertheless, there still remains a controversy if vitamin D2 has the same physiological properties as vitamin D3 (Armas et al. 2004; Holick 2008). Both these vitamins (D2 and D3) are hydroxylated in the human liver to 25-hydroxyvitamin D followed by a transformation in the kidney to 1,25-dihydroxyvitamin D, which is the biological active form of vitamin D (Wacker and Holick 2013). The formation of vitamin D starts with the pro-vitamins 7-dehydrocholesterol in case of vitamin D3 and ergosterol in case of vitamin D2, which are transformed via a ring opening. This results in the formation of the thermodynamically unstable pre-vitamin D under UV-light exposure. The pre-vitamin D then changes its conformation into vitamin D3 or D2, depending on the pre-vitamin. In addition, there is also a formation of biologically inactive photoproducts such as toxisterol, suprasterol, lumisterol or tachysterol (Abillon and Mermet-Bouvier 1973; Havinga 1973; Holick 1995; Wittig et al. 2013). Each reaction is an equilibrium reaction, e.g. the reaction pre-vitamin D to vitamin D balances out 20% pre-vitamin D and 80% vitamin D (Havinga 1973).
Fig. 1.
Structures of pro-vitamin D2 (ergosterol), vitamin D2 (ergocalciferol) and D3 (cholecalciferol)
In mushrooms, the vitamin D2 concentration depends mainly on the location where fruiting bodies grow, e.g. in the open field or inside a green house. Mattila et al. (1994, 2001) showed that fresh wild mushrooms of Cantharellus tubaeformis contain up to 29.82 µg (100 g)−1 vitamin D2, whereas no significant amount could be detected (< 0.1 µg (100 g)−1) in cultivated button mushrooms. Thus, mushrooms cultivated in green houses have a disadvantage concerning their vitamin D2 content in comparison to wild mushrooms. Numerous studies focused on post-harvest UV treatment of cultivated fruiting bodies (Jasinghe and Perera 2006; Roberts et al. 2008; Wittig et al. 2013) to increase their vitamin D2 concentration. Nevertheless, due to the different shapes of fruiting bodies, their different sizes as well as their convex surface, homogeneous vitamin D2 enrichment is hard to achieve. An alternative is the usage of vegetative mycelium of mushrooms propagated in liquid cultures. Up to now, very few studies have been published on the UV-B treatment of vegetative mycelium (Huang et al. 2015), but no studies are published on vitamin D2 enrichment in liquid cultures. In the present study, the oyster mushroom Pleurotus sapidus is grown in submerged cultures to achieve a certain amount of biomass, which is then exposed to UV-B light. Since the formation of vitamin D2 is a thermal isomerization reaction, the effect of different temperatures during UV-B exposure is investigated in this study as well as the effect of different surface areas of the liquid culture. Furthermore, for the first time the differences between abiotic and biotic liquid cultures are studied in regard to vitamin D2 enrichment.
Materials and methods
Chemicals
Standards of cholecalciferol (vitamin D3) 99.9%, ergocalciferol (vitamin D2) 99.1%, 7-dehydrocholesterol ≥ 95.0%, ergosterol ≥ 95.0% were purchased from Sigma-Aldrich (Steinheim, Germany). All chemicals were at least of analytical grade while solvents for chromatography were of HPLC-grade.
Cultivation of Pleurotus sapidus
Pleurotus sapidus, strain 8266 from DSMZ (Braunschweig, Germany) was used throughout the study. All procedures were performed under sterile conditions. Stock cultures of P. sapidus were maintained on malt extract agar plates (per liter: 20 g L−1 malt extract, 15 g L−1 agar agar) at 24 °C in darkness. After transferring 1 cm2 of an overgrown agar plug of the stock culture into an 250 mL Erlenmeyer flask containing 100 mL malt extract medium (20 g malt extract per liter), the agar plug was homogenized with an Ultra Turrax (IKA, Staufen, Germany) for 30 s at 10,000 rpm. Pre-cultures were grown aerobically at 150 rpm on a rotary shaker (2.5 cm shaking diameter, Multitron, Infors, Einsbach, Germany) at 24 °C in darkness for 6 days. For the main culture 200 mL malt extract medium was inoculated in a 500 mL Erlenmeyer flask with 20 mL homogenized pre-culture (Ultra Turrax, 30 s, 10,000 rpm). The cultivation was performed for 4 days at 24 °C and 150 rpm in the dark.
Harvest of the main culture
The main cultures were harvested by centrifugation (10 min, 3283g, 4 °C) after UV-exposure. Mycelium was washed thrice with deionised water. The mycelium was freeze-dried and stored at − 20 °C until further analysis. The moisture content of the lyophilisates was determined using the Moisture Analyzer MA35 (Sartorius, Göttingen, Germany). All results were calculated based on dry matter (DM).
UV-exposure
Unless otherwise mentioned, all exposures were performed in crystallizing dishes with a diameter of 19.5 cm (resulting in a height of sample of 1 cm) at ambient temperature (25 °C). Two 1.7 m long Arimed B 12 100 W lamps (JW Sales GmbH, Brand Division Cosmedico Medical Systems, Stuttgart, Germany) with a defined spectral output of ca. 285–350 nm, max. ca. 290–310 nm (Wittig et al. 2013), were used as the UV source. The lamps were mounted at a distance of 30 cm to each other and with 10.6 cm between the lamp edges to the tables surface onto which the crystallizing dishes were placed.
The submerged mycelium cultures of P. sapidus were poured into the crystallization dishes and exposed to UV-B light (0, 1.5, 5, 10, 20, 30, 45 and 60 min). In a second experiment, the cultures were autoclaved (20 min, 121 °C) and homogenized (Ultra Turrax 30 s, 10,000 rpm) prior to exposure. In a third set up, different sizes of crystallizing dishes were used to create different surface areas exposed for 10 min (diameter: 9.1, 13.8 and 19.5 cm resulting in 3.7, 1.6 and 1.0 cm sample height and 65.0, 149.6 and 298.6 cm2 exposed surface, respectively). In a fourth experiment the exposure (0, 1.5, 5, 10 and 30 min) took place at 3 and 22 °C, respectively.
In addition to the experiments mentioned above, pure ergosterol solution (500 µg mL−1 in methanol) was exposed to UV-B light for 0, 1.5, 5, 10 and 30 min (n = 3). 50 mL was poured into a crystallizing dish with a diameter of 7.4 cm that resulted in a solution height of 1.2 cm. After irradiation, the volume was adjusted to 50 mL in a volumetric flask to compensate for the evaporation of methanol during irradiation. 500 µL of the exposed ergosterol was mixed with 500 µL of an internal standard solution containing 500 µg mL−1 7-dehydrocholesterol (7-DHC) and 200 µg mL−1 vitamin D3. After membrane filtration, the solutions were used directly for HPLC.
Extraction method
The lyophilized mycelium was ground to powder using liquid nitrogen. The extraction of vitamin D was performed as described previously by Mau et al. (1998) and Wittig et al. (2013) with minor modifications. Briefly, approximately 2 g of ground mycelium was accurately weighed into an amber round bottom flask (250 mL). To this 50 mL ethanol (≥ 99,8%), 4 mL sodium ascorbate solution (17.5 g sodium ascorbate in 100 mL 1 M sodium hydroxide solution), 10 mL KOH/H2O (50/50, w/w) and 500 µL vitamin D3 (internal standard, 200 µg mL−1 in methanol) were added. The saponification was performed under reflux at 80 °C for 1 h with occasional shaking of the flask. After adding 50 mL deionised water, the mixture was filtered through a pleated filter. The filtrate was transferred into a separatory funnel and consecutively extracted with 50 mL diethyl ether, 50 mL n-pentane/10 mL ethanol, 50 mL n-pentane and finally with 20 mL n-pentane. Pooled solvent fractions were further extracted three times with 50 mL 3% KOH in 5% ethanol and washed with deionised water until extracts were neutralized. Extracts were dried overnight using anhydrous sodium sulphate at 4 °C. After filtering off sodium sulphate, the solvent was removed by a rotary evaporator (40 °C) and the residue was re-dissolved in 1.5 mL methanol using ultra-sonication for 5 min. After centrifugation (10 min, 18,000g, 4 °C) and membrane filtration (0.22 µm) of the re-dissolved residue, the supernatant was used for analysis by high performance chromatography with a diode array detector (HPLC–DAD).
HPLC–DAD
A LaChrom system (Merck, Darmstadt, Germany) consisting of the high performance liquid chromatography (HPLC)-pump L-7100, the autosampler L-7200 with a Rheodyne injector (100 µL sample loop), the diode-array-detector (DAD) L-7455, the interface D-7000 and the HPLC System Manager HSM (version 4.1) was used for sterol analysis. Two columns [Chromolith Performance RP-18e 100–4.6 mm with guard column Chromolith High Resolution RP-18e 5-4.6 mm (Merck KGaA, Darmstadt, Germany) and EC 250/4 Nucleosil 100-5 C18 (Macherey–Nagel, Düren, Germany)] were connected in series via a PEEK capillary (20.8 cm, ID 0.175 mm) and PEEK fittings. An injection volume of 10 µL was used. Column temperature was maintained at 40 °C using a Jetstream II Plus (Waters, Milford Massachusetts, USA). Separation of the analytes was performed with 1 mL min−1 of methanol (A), acetonitrile (B) and 0.05% formic acid (C). A gradient according to Wittig et al. (2013) was used with minor modifications: 70% B and 30% C as start condition, to 100% B over 2 min, isocratic 100% B for 8 min, to 95% B and 5% A over 10 min, isocratic 95% B and 5% A for 30 min, to 100% B over 5 min and finally to 70% B and 30% C over 5 min to equilibrate the system. A wavelength range from 250 to 310 nm was measured while calculation were made with chromatograms recorded at 265 nm, which is the characteristic absorption maximum of vitamin D2 and D3 (Zonta and Stancher 1982).
Calibration standards
Stock solutions of both vitamin D2 and D3 were prepared by dissolving 10 mg in 10 mL methanol (1 mg mL−1), respectively. The vitamin D3 stock solution was diluted to 200 µg mL−1 with methanol. Calibrating solutions were prepared by serial dilution with final concentrations from 3.9 to 250 µg mL−1 vitamin D2 and 100 µg mL−1 vitamin D3. The corresponding calibration function (y = 0.0087x + 0.0035) of plotting the ratio of the peak areas of vitamin D2 and D3 against the vitamin D2 concentration resulted in a coefficient of determination of R2 = 1.0000. The limit of detection (LOD) and the limit of quantitation (LOQ) were calculated based on DIN 32645 (calibrating method) with n = 7, significance level of 99% and k = 3. A LOD of 1.13 µg mL−1 and a LOQ of 3.98 µg mL−1 were achieved. For ergosterol quantification, a calibration curve from 7.8 to 500 µg mL−1 ergosterol and 250 µg mL−1 7-DHC was prepared by serial dilution (y = 0.0039x − 0.0001, R2 = 0.9997).
LC–MS-analysis
For LC–MS and LC–MS/MS analyses, a Shimadzu HPLC (series 10-AvP) connected to an ABSciex QTrap 3200 mass spectrometer was utilized. The chromatographic conditions were chosen according to the HPLC–DAD measurements (see above), with an injection volume of 25 µL. The isocratic elution employing eluent A and B (5:95) was reduced from 30 to 10 min. In-line UV detection was performed at 265 and 290 nm based on absorption maxima reported by Wittig et al. (2013).
LC–MS scans were performed using a quadrupole scan range from 350 to 450 m/z. The capillary voltage and the ion source temperature were set to 5000 V and 350 °C, respectively. Between the HPLC and ion source, the flow was split with a ratio of 1:8. LC–MS/MS analyses were conducted in the multiple reaction monitoring (MRM) mode. For each vitamin (D2, D3, D4), the fragment ion resulting from the loss of one water molecule was recorded with a dwell time of 100 ms. The collision energy was set to 15 V.
Quantification of ergosterol in P. sapidus
The quantification of ergosterol in P. sapidus grown in submerged malt extract medium was performed in a way similar to the vitamin D extraction and quantification (see above) with minor modifications. Weighed portions of mycelium ranged from 0.5 to 2.8 g DM (n = 4). As an internal standard 7-dehydrocholesterol (7-DHC) dissolved in methanol (1 mg mL−1) was used. The calibration of ergosterol ranged from 7.8 to 500 µg mL−1 ergosterol and 100 µg 7-DHC (y = 0.0093x). Compared to the calibration, the samples showed higher ratios for ergosterol peaks to 7-DHC peaks. Thus, a second calibration with 10 µg 7-DHC was made (y = 0.0984x) and a correction factor was calculated by division of the slopes, which resulted to 0.0944. For quantification, the ratio of the peak areas of ergosterol and 7-DHC of the samples were multiplied with 10 and divided by the correction factor.
Results and discussion
Effect of different exposure times
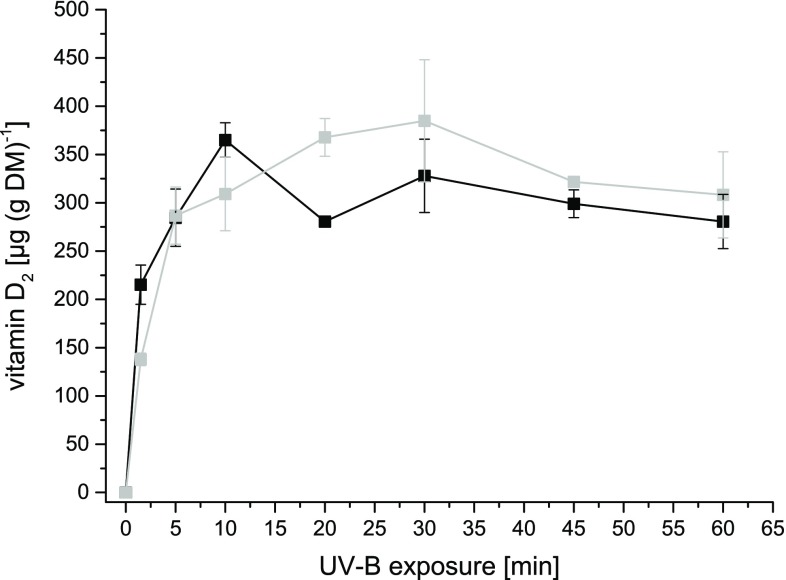
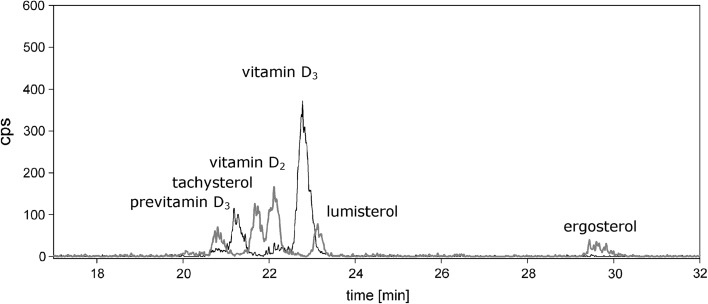
When exposing the vegetative mycelium of P. sapidus to UV-B light, the vitamin D2 concentration increased rapidly at the beginning and reached a maximum after 10 min (Fig. 2). A prolonged exposure time did not result in a higher vitamin D2 concentration, but in a decrease followed by stagnation at a concentration of 280 µg (g DM)−1. After 1.5 min, more than half of the final vitamin D2 concentration had been obtained. Besides vitamin D2, the LC–MS analysis of the mycelial sample exposed for 10 min also revealed other ergosterol based D2-compounds, such as pre-vitamin D2, tachysterol and lumisterol (Fig. 3), which are known from previous studies (Abillon and Mermet-Bouvier 1973; Havinga 1973; Holick 1995; Wittig et al. 2013). In literature, numerous studies evaluate the conversion of ergosterol to vitamin D2 in fungi under several conditions. Most publications (Table 1) reported the enrichment in fruiting bodies of mushrooms, especially in Pleurotus ostreatus and Agaricus bisporus (Jasinghe and Perera 2005, 2006; Mau et al. 1998; Roberts et al. 2008; Wittig et al. 2013). Very few studies have elaborated on vitamin D2 enrichment in freshly harvested mycelium (Huang et al. 2015; Wu and Ahn 2014). Huang et al. (2015) reported 81.71 µg (g DM)−1 vitamin D2 in freshly harvested mycelium of P. ostreatus. In this study, 400 g of moist mycelium was spread in a single layer in 30 cm × 30 cm stainless steel trays and exposed for 2 h (UV-B; intensity: 0.39 mW cm−2, doses for 2 h: 2.59 J cm−2) at an ambient temperature (25 °C). In the present study, 365 µg (g DM)−1 of vitamin D2 could be analyzed in liquid mycelial cultures after 10 min only. This remarkable difference might be due to altered exposure conditions, e.g. intensities or UV-B doses. In a recent paper by Urbain et al. (2016), the applied energy of the UV-B light in J cm−2 was used to standardize the exposure. In the experimental setup of the present study, the same system as published by Wittig et al. (2013) was used, which resulted in an applied UV-B dosage of 1.15 mW cm−2 for 10 min. This accounted for an overall UV-B dosage of 0.69 J cm−2, which is in the range of the dosages applied by Urbain et al. (2016) ranging from 0.26 to 2.01 J cm−2 for fruiting bodies of A. bisporus. Nevertheless, with the highest UV-B dosage of 2.01 J cm−2, vitamin D2 concentrations of only 102 µg (g DM)−1 were achieved in A. bisporus fruiting bodies. In P. ostreatus (Wittig et al. 2013) and P. sapidus (present study) larger vitamin D2 concentrations have been obtained, but a stagnation in the conversion of ergosterol to vitamin D2 can be observed after a certain exposure time. Up to now, several hypotheses have been made to explain the stagnation of vitamin D2 enrichment. Formation of browning pigments, which could decelerate the vitamin D2 production, as well as photo-degradation during exposure via oxidative atmosphere have been considered to stagnate the vitamin D2 production (Jasinghe and Perera, 2005; Vayalil et al. 2003). Further transformation of vitamin D2 into hydroxylated forms of vitamin D2 by mono-oxygenases has been proposed as well (Jasinghe and Perera 2005). In the present study, we did not observe mycelial coloration, which makes the first reason less plausible to explain the stagnation occurred during the exposure (Fig. 2). Although the vitamin D2 concentration in the abiotic mycelium showed a slightly slower increase compared to the biotic one (Fig. 2), a further transformation due to enzymatic activities can be excluded, since the inactivated mycelium showed similar vitamin D2 concentrations leveling off at about 300 µg (g DM)−1. A dependent t test for paired samples revealed no significant differences in the vitamin D2 concentration between abiotic and biotic mycelium. To evaluate whether a stagnation in conversion of ergosterol into vitamin D2 is also present in vitro, ergosterol was dissolved in methanol and exposed to UV-B light (Supplementary Fig. 1). The ergosterol concentration decreased concomitantly with an increase in vitamin D2 concentration. This illustrates that another effect on the ergosterol conversion other than the above mentioned must be present in the fungal cell. But how much ergosterol of the fungus can be converted into vitamin D2? For P. sapidus, cultivated in liquid malt extract medium, an ergosterol content of 3.75 ± 0.06 mg (g DM)−1 was measured via HPLC–DAD. Generally, the ergosterol content of basidiomycetes can vary dramatically between 0.68 mg (g DM)−1 and 7.80 mg (g DM)−1 (Jasinghe and Perera 2005). P. ostreatus, a close relative of P. sapidus, contains 4.40 ± 0.08 mg (g ergosterol)−1 in dry fungal biomass (Jasinghe and Perera 2005). In another study, Jasinghe and Perera (2006) analyzed 184 µg (g DM)−1 vitamin D2 in fresh fruiting bodies of P. ostreatus after exposing each side for 1 h to UV-B at 35 °C. A comparison of both studies results in a transformation rate of ergosterol to vitamin D2 in fruiting bodies of 4%. In vegetative mycelium of P. sapidus, the highest amount of vitamin D2 after exposure accounted for 10% of the initial ergosterol content of the mycelium.
Fig. 2.
Vitamin D2 concentrations in P. sapidus biotic (black) and abiotic (grey) mycelium after exposure for up to 60 min at ambient temperature
Fig. 3.
Overlaid mass spectra of P. sapidus mycelium exposed for 10 min to UV-B. Multiple reaction monitoring of cholesterol-based molecules (385 → 367, black) and ergosterol-based molecules (397 → 379, grey); cps: counts per second
Table 1.
Concentrations of vitamin D2 in P. ostreatus
| Fungi | UV-band | Conditions | Vitamin D2 [µg (g DM)−1] | References |
|---|---|---|---|---|
| P. ostreatus (fresh fruiting bodies) | UV-B | 2 h, 25 °C | 69.0 ± 2.0 | Huang et al. (2015) |
| P. ostreatus (fresh mycelium) | UV-B | 2 h, 25 °C | 81.71 | |
| P. ostreatus | UV-A | 2 h, 27 °C (gills facing UV source) | 45.1 ± 3.1 | Jasinghe and Perera (2005) |
| P. ostreatus | UV-B | 1 h, 35 °C, 80% moisture | 184 ± 6 | Jasinghe and Perera (2006) |
| P. ostreatus | UV-B | 1 h, 20 °C (5 mm slices) | 141.32 | Wittig et al. (2013) |
| P. ostreatus (fresh fruiting bodies) | UV-B | 94.28 min, 28.16 °C | 239.67 | Wu and Ahn (2014) |
| P. ostreatus (lyophilisated powder) | UV-B | 10 min, 28.16 °C, 1 g spread onto 500 cm2 | 498.1 |
Effect of process parameters on the vitamin D2 concentration
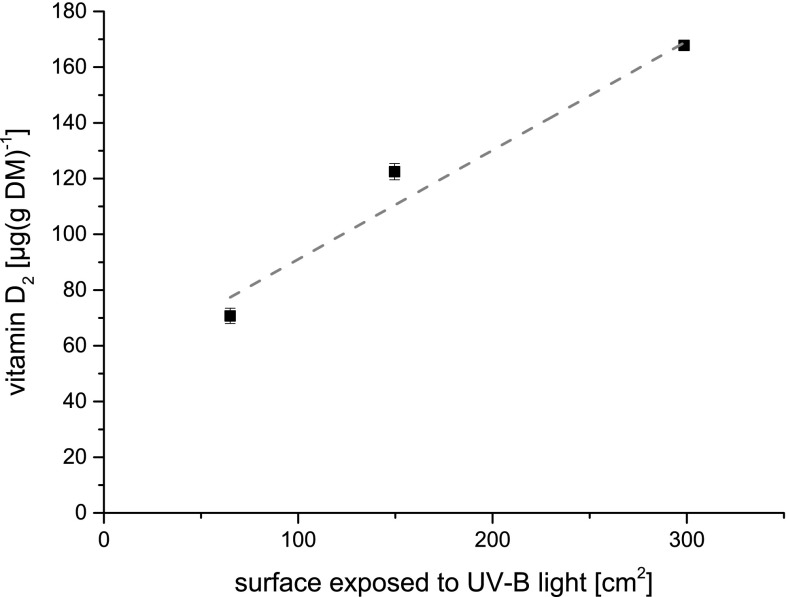
As shown above, the biotic activity of P. sapidus showed no effect on vitamin D2 formation, whereas the surface area, which was exposed to UV-B light, had a significant influence on the formation of vitamin D2. Increasing the surface area from 65.0 to 298.6 cm2 at ambient temperature, the vitamin D2 concentration could be more than doubled (Fig. 4). Up to 168 µg (g DM)−1 vitamin D2 could be transformed from ergosterol. A comparable attempt to aggregate the vitamin D2 concentration was done by Wu and Ahn (2014) by exposing lyophilized and ground P. ostreatus mycelium to UV-B (Table 1). 1 g of lyophilized powder was spread over an exposed area of 500 cm2 thereby doubling the vitamin D2-concentration from 239.7 µg (g DM)−1 of exposed fruiting bodies to 498.1 µg (g DM)−1 of the mushroom powder. The fact that an enlargement of the exposed surface area leads to an increased concentration of vitamin D2 is in accordance with the results reported in the present study, where an almost linear correlation between exposed surface area and vitamin D2 concentration could be observed (Fig. 4).
Fig. 4.
Vitamin D2 concentrations in P. sapidus mycelium as a function of exposed surface (65.0, 149.6 and 298.6 cm2) after exposure to UV-B light at ambient temperature
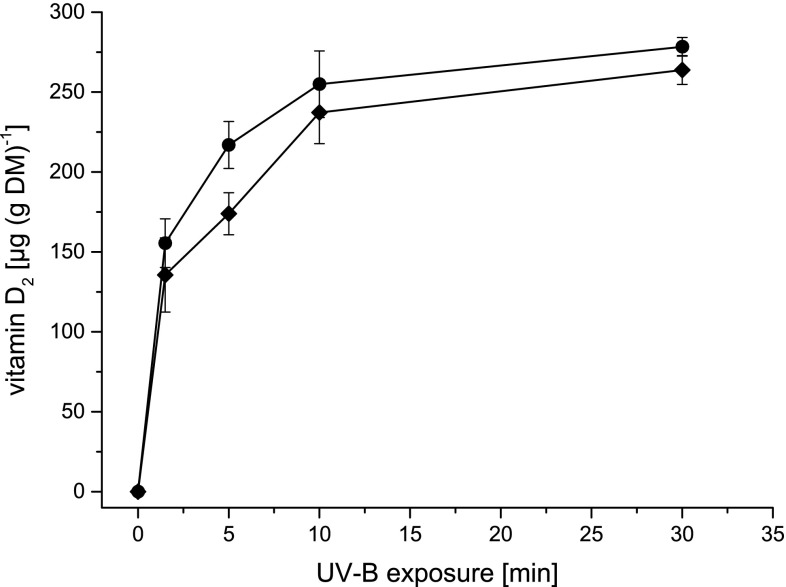
Another important parameter for an enhancement of the vitamin D2 concentration in mushrooms is the temperature. Jasinghe and Perera (2005) studied the effect of different temperatures during exposure of the Shiitake mushroom Lentinula edodes. They found an optimum temperature of 35 °C followed by a decrease at higher temperatures, which they claimed on heat stress, cell death and photo-degradation. In our study, the effect of temperature on the vitamin D2 formation was marginal (Fig. 5). The concentration of vitamin D2 is only slightly lower at a temperature of 3 °C compared to 22 °C, which is probably due to the temperature dependent isomerization.
Fig. 5.
Vitamin D2 concentrations in submerged cultivated mycelium of P. sapidus, exposed at 3 °C (diamonds) and 22 °C (circles)
Based on the presented results, 10 min of UV-B exposure at ambient temperature (25 °C) and an exposed surface of 298.6 cm2 led to 365 µg (g DM)−1 vitamin D2 in a biotic submerged culture of P. sapidus. Larger exposed surface enhanced the vitamin D2 concentration. The vitamin D2 concentration in an exposed abiotic system led to a slower increase of vitamin D2, but leveled up at the same concentration as the biotic system. Overall, the results show that vitamin D2 transformation depends on many factors such as temperature during exposure, exposure time and exposed surface.
Electronic supplementary material
Below is the link to the electronic supplementary material.
Acknowledgements
We thank Garima Maheshwari for improving the use of English in the manuscript. Funding was provided by Hessisches Ministerium für Wissenschaft und Kunst.
References
- Abillon E, Mermet-Bouvier R. Effect of wavelength on production of previtamin D2. J Pharm Sci. 1973;62:1688–1691. doi: 10.1002/jps.2600621023. [DOI] [PubMed] [Google Scholar]
- Armas LAG, Hollis BW, Heaney RP. Vitamin D2 is much less effective than vitamin D3 in humans. J Clin Endocr Metab. 2004;89:5387–5391. doi: 10.1210/jc.2004-0360. [DOI] [PubMed] [Google Scholar]
- Havinga E. Vitamin D, example and challenge. Experientia. 1973;29:1181–1316. doi: 10.1007/BF01935064. [DOI] [PubMed] [Google Scholar]
- Holick MF. Environmental factors that influence the cutaneous production of vitamin D. Am J Clin Nutr. 1995;61:638–646. doi: 10.1093/ajcn/61.3.638S. [DOI] [PubMed] [Google Scholar]
- Holick MF. Vitamin D: importance in the prevention of cancers, type 1 diabetes, heart disease, and osteoporosis. Am J Clin Nutr. 2004;79:362–371. doi: 10.1093/ajcn/79.3.362. [DOI] [PubMed] [Google Scholar]
- Holick MF. Vitamin D: a D-lightful health perspective. Nutr Rev. 2008;66:182–194. doi: 10.1111/j.1753-4887.2008.00104.x. [DOI] [PubMed] [Google Scholar]
- Huang SJ, Lin CP, Tsai SY. Vitamin D2 content and antioxidant properties of fruit body and mycelia of edible mushrooms by UV-B irradiation. J Food Compos Anal. 2015;42:38–45. doi: 10.1016/j.jfca.2015.02.005. [DOI] [Google Scholar]
- Jasinghe VJ, Perera CO. Distribution of ergosterol in different tissues of mushrooms and its effect on the conversion of ergosterol to vitamin D2 by UV irradiation. Food Chem. 2005;92:541–546. doi: 10.1016/j.foodchem.2004.08.022. [DOI] [Google Scholar]
- Jasinghe VJ, Perera CO. Ultraviolet irradiation: the generator of vitamin D2 in edible mushrooms. Food Chem. 2006;95:638–643. doi: 10.1016/j.foodchem.2005.01.046. [DOI] [Google Scholar]
- Mattila PH, Piironen VI, Uusi-Rauva EJ, Koivistoinen PE. Vitamin D contents in edible mushrooms. J Agric Food Chem. 1994;42:2449–2453. doi: 10.1021/jf00047a016. [DOI] [Google Scholar]
- Mattila P, Könkö K, Eurola M, Pihlava JM, Astola J, Vahteristo L, Hietaniemi V, Kumpulainen K, Valtonen M, Piironen V. Contents of vitamins, mineral elements, and some phenolic compounds in cultivated mushrooms. J Agric Food Chem. 2001;49:2343–2348. doi: 10.1021/jf001525d. [DOI] [PubMed] [Google Scholar]
- Mau JL, Chen PR, Yang JH. Ultraviolet irradiation increased vitamin D2 content in edible mushrooms. J Agric Food Chem. 1998;46:5269–5272. doi: 10.1021/jf980602q. [DOI] [Google Scholar]
- Roberts JS, Teichert A, McHugh TH. Vitamin D2 formation from post-harvest UV-B treatment of mushrooms (Agaricus bisporus) and retention during storage. J Agric Food Chem. 2008;56:4541–4544. doi: 10.1021/jf0732511. [DOI] [PubMed] [Google Scholar]
- Urbain P, Valverde J, Jakobsen J. Impact on vitamin D2, vitamin D4 and agaritine in Agaricus bisporus mushrooms after artificial and natural solar UV light exposure. Plant Foods Hum Nutr. 2016;71:314–321. doi: 10.1007/s11130-016-0562-5. [DOI] [PubMed] [Google Scholar]
- Vayalil PK, Elmets CA, Katiyar SK. Treatment of green tea polyphenols in hydrophilic cream prevents UVB-induced oxidation of lipids and proteins, depletion of antioxidant enzymes and phosphorylation of MAPK proteins in SKH-1 hairless mouse skin. Carcinogenesis. 2003;24:927–936. doi: 10.1093/carcin/bgg025. [DOI] [PubMed] [Google Scholar]
- Wacker M, Holick MF. Sunlight and vitamin D. Dermato-Endocrinol. 2013;5:51–108. doi: 10.4161/derm.24494. [DOI] [PMC free article] [PubMed] [Google Scholar]
- Wittig M, Krings UK, Berger RG. Single-run analysis of vitamin D photoproducts in oyster mushroom (Pleurotus ostreatus) after UV-B treatment. J Food Compos Anal. 2013;31:266–274. doi: 10.1016/j.jfca.2013.05.017. [DOI] [Google Scholar]
- Wu WJ, Ahn BY. Statistical optimization of ultraviolet exposure conditions for vitamin D2 synthesis in oyster mushrooms (Pleurotus ostreatus) using response surface methodology. PLoS ONE. 2014;9:e95359. doi: 10.1371/journal.pone.0095359. [DOI] [PMC free article] [PubMed] [Google Scholar]
- Zonta F, Stancher B. High-performance liquid chromatography of fat-soluble vitamins: separation and identification of vitamins D2 and D3 and their isomers in food samples in the presence of vitamin A, vitamin E and carotene. J Chromatogr. 1982;246:105–112. doi: 10.1016/S0021-9673(00)82787-9. [DOI] [PubMed] [Google Scholar]
Associated Data
This section collects any data citations, data availability statements, or supplementary materials included in this article.


