

Abstract
To determine whether glutathione (GSH) loss or increased ROS are more important to neuron loss, aging and Alzheimer disease (AD), we stressed or boosted GSH levels in neurons isolated from aging 3xTg-AD neurons compared to age-match non-transgenic neurons (non-Tg). Here, by titrating with buthionine sulfoximine (BSO), an inhibitor of γ-glutamylcysteine synthetase (GCL), we observed that GSH depletion increased neuronal death of 3xTg-AD cultured neurons at increasing rates across the age-span, while non-transgenic (non-Tg) neurons were resistant to GSH depletion until old age. Remarkably, the rate of neuron loss with ROS did not increase in old age and was the same for both genotypes, which indicates that cognitive deficits in the AD-model were not caused by ROS. Therefore, we targeted for neuroprotection activation of the redox sensitive transcription factor, Nrf2 (Nuclear erythroid-related factor 2) by 18α-glycyrrhetinic acid to stimulate glutathione synthesis through GCL. This balanced stimulation of a number of redox enzymes restored the lower Nrf2 and GCL levels seen in 3xTg-AD neurons compared to non-Tg and promoted translocation of Nrf2 to the nucleus. By combining the Nrf2 activator together with the NADH precursor, nicotinamide, we increased neuron survival against beta-amyloid stress in an additive manner. These stress tests and neuroprotective treatments suggest that the redox environment is more important to neuron survival than ROS. The dual neuroprotective treatment with nicotinamide and an Nrf2 inducer indicates that these age-related and AD-related changes are reversible.
Keywords: Glutathione, ROS, neurodegeneration, neuroprotection, stress, aging, Nrf2, 3xTg-AD
1. Introduction
The leading theory of aging is Harman’s “free radical” theory according to which, reactive oxygen species, ROS, cause an accumulation of macromolecular damage in mitochondria and other organelles to precipitate aging (Harman, 1988). In order to control ROS generation, redox dependent small molecules and enzymes like glutathione (GSH), superoxide dismutase (SOD) and thioredoxins (Txr) buffer the excess free radicals while allowing necessary ROS signaling (Finkel 2003; Rigoulet et al., 2011). If accumulation of ROS damage is proposed to cause aging, then decreasing ROS by overexpression of antioxidants should increase longevity. But overexpression of SOD1, SOD2, catalase, glutathione peroxidase (GPx) alone or in combination in transgenic mouse models has failed to increase longevity (Huang et al., 2000; Perez et al., 2009), decreasing the strength of the free radical theory of aging. Interest in free radical ROS damage is heightened since age is the strongest epidemiological factor in Alzheimer’s disease (AD) associated with ROS damage to nucleic acids (Nunomura et al., 1999), proteins (Sultana et al., 2006; Sultana and Butterfield, 2012) and lipids (Markesbery and Lovell, 1998). However, clinical trials with antioxidants targeted against oxidative stress have failed to show any improvement in cognition of the AD patients (Petersen et al., 2005; Lloret et al., 2009). In a recent 2012 clinical trial, a combination of antioxidants containing vitamin E (800 IU), vitamin C (500 mg) and alpha lipoic acid (900 mg), decreased plasma F2-isoprostane levels 19% relative to the placebo group, but surprisingly, worsened the cognitive ability of the patients (Galasko et al., 2012). Sohal & Orr (2012) have argued against a controlling role for ROS in aging, since the magnitude of aging effects are not proportional to the increases in ROS detected in aged animals. By viral vector delivery of SOD and catalase to aging rats, ROS damage decreased but improvements in memory did not correlate with ROS damage (Lee et al., 2012). Thus, the unsuccessful targeting of ROS in aging and AD to extend longevity or improve cognition undermines the free radical theory of aging and AD. Here we investigate a possible upstream cause of excess ROS in terms of redox control by a major cellular redox buffer, glutathione.
An alternative Epigenetic Oxidative Redox Shift (EORS) theory of aging proposes that sedentary behavior promotes the accumulation of dysfunctional mitochondria with aging, which in turn leads to an oxidized redox shift, upstream of ROS-mediated macromolecular damage (Brewer, 2010a; Sohal & Orr, 2012). In support of the epigenetic changes with aging, we found robust changes in histone H3 and H4 acetylation and methylation levels in neurons from the 3xTg AD-model mouse (Walker et al., 2012). In support of the redox shift with human aging, an oxidative redox shift in GSH/GSSG levels in plasma occurs from the age of 50 to age of 85 (Jones, 2006a; Jones, 2006b). In further support in neurons from an AD-model mouse, we observed a redox deficit in NAD(P)H capacity early in life, and a lower level of the redox buffer GSH, even before elevated ROS and ROS-mediated damage (Ghosh et al., 2012). After middle age, both of these redox buffers declined and ROS levels increased. These redox deficits were reversible with the NAD+ precursor, nicotinamide, which was previously shown to improve memory in 3xTg-AD mice (Green et al., 2008). To further establish the relationship of GSH to ROS, here we titrated neuron levels of GSH by inhibition of synthesis with buthionine sulfoximine (BSO) (Griffith and Meister, 1979) and further correlated the effects on neurodegeneration.
The de novo synthesis of GSH is dependent on the redox-sensitive transcription factor nuclear factor (erythroid-derived 2)-related factor (Nrf2) that controls the GSH rate limiting enzyme γ-glutamyl-cysteine synthetase (glutamate-cysteine ligase) with catalytic subunit C (Gclc). Gclc decreases with rat age (Zhu et al., 2006). Although, both ROS elevation and GSH depletion are associated with aging and AD, it remains unclear whether an elevated ROS causes GSH declines and neurodegeneration or declines in GSH cause ROS to increase and neurodegeneration, perhaps in parallel or independent of ROS. Simic et al., (1997) observed that the number of CA1 hippocampal neurons were negatively correlated with aging (r = −0.84) while in AD, a 23% greater neuron loss was observed than controls. Since GSH levels decline with age and in AD, one of the causes for this neuron loss could be low GSH levels. Therefore, our aim here was to determine which of the following hypotheses are causal to neurodegeneration in aging and in an AD model:
Elevated ROS cause GSH declines, i.e., excessive ROS consumes GSH to accelerate neurodegeneration.
Declines in GSH cause neurodegeneration and a ROS increase, i.e., a decline in GSH levels by inadequate synthesis or regeneration leads to neurodegeneration plus excessive ROS levels.
The distinction is important because targeting upstream causes is more likely to be effective therapy than downstream targets. We titrated glutathione levels by inhibition of Gclc with BSO to separate redox functions from ROS levels and the impact of each on neurodegeneration, aging and AD. Further, we determined whether redox interventions could be neuroprotective to compensate for age and AD related GSH depletion. As redox interventions, we used the NAD+ precursor nicotinamide (Ghosh et al., 2012) and a Nrf2 inducer, 18-alpha-glycyrrhetinic acid that protects fibroblasts against senescence (18α-GA; Kapeta et al., 2010). We used non-transgenic (non-Tg) and LaFerla’s triple transgenic mouse model of AD (3xTg-AD) (Oddo et al., 2003). This model has human mutant amyloid precursor protein (APP), presenilin 1 (PS1) and tau that lead to increased deposition of A-beta and memory deficits by 6 months, although in our colony, memory deficits in males were not detected until 18–22 months. We performed experiments in neurons isolated and cultured from the hippocampus and frontal cortex of mice across the age-span to separate intrinsic changes in neurons from an aging hormone, immune and vascular system (Brewer, 1997; Brewer and Torricelli, 2007). Here, our strategy imposed a stress of incremental GSH depletion with either a) no additional neuroprotection or b) incremental neuroprotection with nicotinamide and an inducer of the Nrf2 (Nrf-2) transcription factor to determine whether GSH depletion or ROS elevation contributes more to neuron death. Since the antioxidant approach has been largely ineffective and while the Nrf2 induction and nicotinamide treatment are both partially effective against neurodegeneration, here we explore a combination of providing energy as a redox substrate and mitochondrial function with nicotinamide (Liu et al., 2012) together with protection of redox balance with a Nrf2 inducer.
2. Materials and methods
2.1 Mouse model
We used LaFerla’s triple transgenic mouse model of Alzheimer’s disease (3xTg-AD) with human transgenes APP (SWE), PS1 (M146V) and Tau (P301L) under control of thy 1.2 promoters (Oddo et al. 2003). Non-transgenic (non-Tg) mice on the same mixed C57BL6/129 background from LaFerla were used as controls. For all our experiments, we used male 3xTg-AD and non-Tg animals (to avoid cycling estrogen effects on behavior) housed 1–4 per cage, fed rodent diet 5001 (LabDiet, Purina, distributed by El Mel, St Louis, MO, with 28.5% calories from protein, 13.5% from fat and 58% from carbohydrates) ad libidum at controlled temperature, humidity and a 12 hour light, 12 hour dark cycle. All animals were genotyped before experiments. DNA was extracted from tail snips using Roche High Pure PCR Template Preparation Kit (Indianapolis, IN). We used two primer sets for identifying the 3xTg-AD mutant. The following primers identified the PS1 gene F5′-CAC ACG CAA CTC TGA CAT GCA CAG GC – 3′, R5′ – AGG CAG GAA GAT CAC GTG TTC AAG TAC – 3′ (Invitrogen, Carlsbad, CA). The PCR product was digested with the restriction enzyme BSTEII (New England Biolabs, Ipswich, MA). Non-Tg mice showed a single band (~ 550 bp) and 3xTg-AD mouse showed two bands (~ 300 and 250 bp). The following primers identified the hAPP gene F5′-GCT TGC ACC AGT TCT GGA TGG – 3′, R5′ – GAG GTA TTC AGT CAT GTG CT -3′. Non-Tg mice showed no amplification and 3xTg mouse showed one band (~ 300 bp).
2.2 Morris water maze test
The Morris Water Maze test was used to assess spatial learning and memory. The test was conducted in a circular tank with a 1.5 m diameter. A 10 cm diameter platform was placed 1 cm below the surface of the pool at a constant location. Crayola™ nontoxic white paint was added until water was opaque. The pool was maintained at 23ºC + 2 degrees. Mice were tested for 3 trials/day over 5 days, with each of three non-platform quadrant entry locations. Mice that failed to reach the platform within 90s were guided to the location, then returned to the home cage. An inter-trial interval of at least 20 minutes from the start of one trial until the start of the next was practiced to allow time for grooming and rest. Any-Maze software (Wood Dale, IL) was used to track the mice and collect data. Although the onset of memory deficits in 3xTg-AD mice have been variously reported in the Morris water maze as 6–14 months (Billings et al., 2005; Clinton et al., 2007; McKee et al., 2008), mostly in females (McKee et al., 2008), in our colony of 3xTg-AD male mice, we did not observe memory deficits in the until 20–22 months (Supplementary Fig. 1). As a control, we also tested female 12–15 month animals for the time they took to reach the hidden platform and the path efficiency; however, we did not observe any genotype associated learning and memory deficits in the female 3xTg-AD mice (Supplementary Fig. 1 D).
2.3 Primary neuron culture
Adult hippocampal and cortical neurons were isolated from Non-Tg and 3xTg-AD age matched male mice at 2, 4, 8, 11, and 21 month time points (Brewer and Torricelli, 2007). The combined hippocampus and frontal-cortex of each hemisphere (~ 140 mg tissue) were sliced at 0.5 mm and combined in Hibernate A (BrainBitsLLC.com), 2% B27 supplement (Invitrogen), 0.5 mM Glutamax (Invitrogen). The tissue was digested with 2 mg/mL papain (Worthington, Lakewood, NJ) for 30 min at 30ºC. Slices were triturated and the neurons separated from debris and microglia on an Optiprep density gradient. In order to limit the toxicity caused by excess debris, each hippocampus and hemi-cortex was digested, triturated, and spun through a density gradient in separate tubes. After the gradient, the neuron-enriched fractions of each hippocampus and frontal-cortex were combined. Viable cells were counted by exclusion of trypan blue. Neurons were plated at 32,000 cells/cm2 on 15 mm glass coverslips (Assistent brand, Carolina Biologicals, Burlington, NC) that were coated overnight with poly-D-lysine, 100 μg/mL in water. The cells were plated and cultured in Neurobasal A/B27/Glutamax with 10 ng/mL FGF2 and 10 ng/mL PGDFbb (Invitrogen, Carlsbad, CA) for trophic support. Cells were cultured for 7–12 days at 37°C in 5% CO2, 9% O2 at saturated humidity (Forma, Marietta, OH).
2.4 Buthionine sulfoximine (BSO) titration
At 8 days in culture, 100% of the media containing anti-oxidants in the B27 was replaced with Neurobasal A/0.5 mM Glutamax. For glutathione inhibition, the following concentrations of L-buthionine sulfoximine (BSO, B1525, Sigma-Aldrich) were added to the cultured neurons: 0, 2.5, 5, 10 and 20 μM and incubated for 15 hr at 37°C in 5% CO2, 9% O2 at saturated humidity.
2.5 18-alpha glycyrrhetinic acid (18α-GA) and nicotinamide treatment
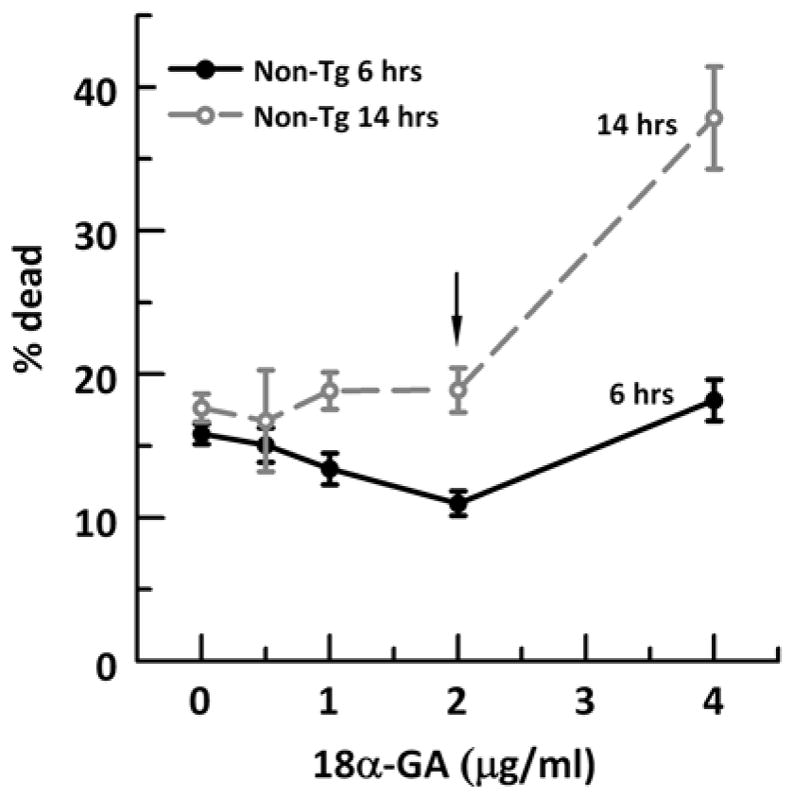
As identified in a screen to optimally induce Nrf2 transcription factor (Kapeta et al., 2010), we treated cells for 14 hr with 2 μg/ml 18α-GA in 0.01% DMSO. 0.01% DMSO was used as vehicle as indicated. In order to test the time and dose-efficacy of 18α-GA in our hippocampal/cortex neuronal cultures, we incubated neurons for 6 or 14 hours with an increasing 18α-GA dose from 0 to 4 μg/ml (Supplementary Fig. 2). At either time point, a dose of 2 μg/ml or 4.2 μM was most effective in minimizing neuron loss. Although an incubation of 6 hrs with 2 μg/ml was the optimum dose and time for neuron survival, neuroprotection against an overnight BSO-induced stress was effective only when we co-incubated with 18α-GA for 14 hr (data not shown). So for our experiments we used 12–14 hrs incubation with 2 μg/ml 18α-GA. 2 mM nicotinamide (Sigma, St. Louis, MO) in Neurobasal A/0.5 mM Glutamax was added as a precursor of NAD+ to influence redox balance. Neurons were treated for 15 hrs with either 18α-GA, nicotinamide, both or vehicle as indicated.
2.6 Immunocytochemistry
Cultured neurons attached to glass coverslips 8 days in vitro (with or without treatment) were fixed with 4% paraformaldehyde in PBS for 10 mins. Then, a blocking and permeabilization solution of 5% NGS and 0.5% Triton X-100 in PBS was applied to the slips for 20 mins. The following primary antibodies diluted in 0.5% NGS and 0.05% Triton X-100 were used: for characterizing neurons, rabbit-anti-MAP2 (Microtubule-associated protein 2) IgG, (Sigma), for astroglia, conjugated mouse anti-GFAP/Alexa Fluor 488 (Glial fibrillary acidic protein, 1:400, Molecular probes A21294), for Nrf2, rabbit anti-Nrf2 (1:50, C-20: sc-722, Santa Cruz Biotechnology, Inc, Dallas, TX). The primary antibodies were allowed to bind overnight at 4°C. Secondary antibodies of conjugated mouse anti-GFAP/Alexa Fluor 48 diluted 1:2000, Alexafluor 488 goat anti-rabbit (Molecular Probes #A-11034) diluted 1:300 and/or Alexafluor 568 goat anti-rabbit diluted 1:1000 (Molecular Probes #A-11036) were allowed to bind for 1 hr at 22ºC. Bisbenzamide, final concentration 0.25 μg/mL, was applied to slips for 2 min to label nuclei. Coverslips were mounted on a slide with AquaMount (Histo Biotec Inc., Wilmington, DE) and imaged at 20X (for neurons and astroglia) or 100x oil immersion objective (for Nrf2) using Olympus dichroic filters for DAPI (bisbenzamide), FITC (GFAP or Nrf2) and TRITC (MAP2). Image-pro plus software (version 7.0, Media Cybernetics, Bethesda, MD) was used for analysis of fluorescence intensity. For Nrf2 fluorescence measurements, first we created an outline for nuclear bisbenzamide stain and used that outline to measure nuclear Nrf2 fluorescence. Next, we masked the nuclear area to exclude any nuclear fluorescence and measured the cytoplasmic fluorescence. Total fluorescence was measured for either nuclear or cytoplasmic regions per neuron as the following: (Area/neuron x mean intensity)/100. Fluorescence excitation, camera-gain and exposure and imaging thresholds were kept constant for each dye.
2.7 HPLC of GSH/GSSG
Extraction, derivatization, and analysis of brain GSH/GSSG was adapted from Jones and Liang (2009). Anesthetized animals were decapitated and approximately 40 mg of combined hippocampus and cortex was dissected in Hibernate A (BrainBits) at 4°C. The tissue was weighed and homogenized in 10 μl/mg preservation solution with a plastic pestle (Fisher Scientific K749520-0000) at room temperature and then placed on ice. The preservation solution which prevents oxidation and blocks free thiols was composed of 0.16 M L-serine ( Sigma #S-4311), 2.5 mg/mL heparin ( Sigma #H3149), 50 mM bathophenanthroline disulfonic acid (Sigma #146617), 0.144 M sodium iodoacetate (Sigma #57858), 0.4 M boric acid Sigma # B0394), 0.1 M sodium tetraborate decahydrate (Sigma # 71999), 165 μM internal standard γ-glutamylglutamate (MP Biomedicals #157205;). Within 30 minutes of dissection, homogenates were centrifuged at 8,000 X g for 2 min at 4°C to remove insoluble tissue. The collected supernatant was diluted 1:1 with ice cold 10% perchloric acid containing 0.2 M boric acid and centrifuged at 8,000 X g for 2 min at 4°C to precipitate protein. Samples of 180 μl were derivatized in a 2 mL glass vial, free thiols acetylated with 36 μl of 36 μM sodium iodoacetate and the pH adjusted to 9.0 ± 0.2 with a saturated KOH/tetraborate solution containing 1.6 M potassium tetrahydroborate tetrahydrate ( Sigma #P5754) and 1 M KOH. After incubating for 20 min at room temperature, 180 μl of freshly prepared dansyl chloride (20 mg/mL in acetone, Sigma # 39220) was added and incubated overnight in the dark at 22 ºC. The next day, 300 μl of chloroform was added and mixed to extract unreacted dansyl chloride, followed by centrifugation for 1 min., 80 μl of the top aqueous phase was transferred to glass small volume HPLC vial inserts (Waters #WAT094170). An injection volume of 40 μl was applied to a 250 X 4.6 mm 5 μm APS-2 Hypersil column (Thermo Scientific). Analytes were detected by fluorescence (excitation, 335 nm; emission, 515 nm) on a Waters Breeze 2 HPLC System. The mobile phase consisted of two solutions. Solvent A was 80% (v/v) HPLC grade methanol/water. Solvent B was 0.8 M sodium acetate trihydrate ( Sigma # 236500) in 60% methanol, 30% HPLC grade glacial acetic acid (Sigma # 45726), 10% water, pH 4.6. A solvent gradient was pumped at 1 ml/min as follows: 80% A, 20% B for 10 min, linear gradient to 20% A, 80% B from 10 to 30 min, conditions remained at 20% A, 80% B from 30 to 46 min, and returned to 80% A, 20% B from 46 to 48 min. Equilibration time was 12 min until injection of the next sample. As the column aged with the GSSG peak eluting at less than 30 min, % B was decreased to 10%. A mix of standards, including external standards of 10 μM GSH and GSSG, and internal standard γ-glutamylglutamate, was run after each sample to assure peak identification. GSH and GSSG concentrations were calculated relative to the area under the curve of the known internal standard originally 165 μM γ-glutamylglutamate. We used the Nernst equation to calculate the redox state of the tissue, Eh (in mV) = E0 + 30 log ([GSSG]/[GSH]2), where GSH and GSSG are molar concentrations and E0 is −264 mV for pH 7.4 (Rost and Rapoport, 1964).
2.8 Simultaneous measurement of ROS and glutathione in live cells
To determine ROS levels and antioxidant glutathione defenses, we followed the protocol as used before (Brewer et al., 2010) with few changes. At 8 days in culture, 100% of the media containing antioxidants in the B27 was replaced with Neurobasal A/Glutamax without B27 with or without treatments (BSO, nicotinamide or 18α-GA) for 15 hours at 37ºC, 5 % CO2 and 9% O2. Prior to experiments, cells attached to 15 mm glass cover slips were mounted in a slip holder (Warner instruments, Hamden, CT) in 800 μL of Neurobasal A, Glutamax, 20 μM 2′, 7′-dichlorofluorescein diacetate (DCFDA, # 0399, Invitrogen) for 20 min. to measure ROS. During the last 5 minutes of DCF incubation, 100 μM monochlorobimane (MCB, # M1381, Invitrogen) was added to measure glutathione (Hulbert and Yakubu, 1983). While MCB will detect GSH in both neurons and astrocytes, the astrocyte concentration is less than 5% in our preparations and we measured fluorescence in neurons, which are easily distinguished from astroglia by their dendritic branching. After incubation, cells were rinsed twice with Hibernate A low fluorescence (BrainBits LLC, Springfield, IL), Glutamax containing 4.6 μg/ml propidium iodide (PI) to stain dead cells. Cells were imaged through a 40x objective/NA 0.60 using Olympus DAPI (MCB), FITC (DCF), and TRITC (PI) optics. Image-pro plus software (version 7.0, Media Cybernetics, Bethesda, MD) was used for analysis of fluorescence intensity. Fluorescence excitation, camera gain and exposure and imaging thresholds were kept constant for each dye. Fluorescence total per cell was calculated as the fluorescence intensity times the area of the cell above threshold (um2/100, as a convenient scaling factor). Care was taken to set exposures and gain so that less than 5% of pixels were at the maximum threshold of 4095.
2.9 RNA isolation and RTqPCR
Flash frozen hippocampus plus cortex or hippocampal/cortex neurons were used for RTqPCR. Neurons plated at 32,000 cells/cm2 on 12 cm2 glass coverslips (Assistent brand, Carolina Biologicals, Burlington, NC) were collected with a sterile cell scraper (Fisher) and covered with 350 μl of lysis reagent (supplied in the RNeasy Mini Kit; Qiagen # 74104) and homogenized with a mini-pestle in a microcentrifuge tube (Fisher). For forebrain hippocampus plus cortex, homogenates were prepared with the RNeasy Lipid Tissue Mini Kit (Qiagen # 74804). After homogenization, subsequent steps followed the manufacturer’s protocol to yield ~18 μg RNA. One microgram of total RNA was used to create a cDNA pool of ~30 μg utilizing the High Capacity RNA-to-cDNA Kit (Applied Biosystems, #4387406) following the company’s instructions. Briefly, the reaction mixture contained: 1 μg of total RNA, 10 μl of Applied Biosystem’s RT buffer, 1 μl of Applied Biosystems’ reverse transcriptase (RT), nuclease free water to bring the total volume to 20 μl. Sixty nanograms of cDNA were used in a 20 μl multiplex Taqman reaction with probe + primers for mouse Nrf2 (Mm00477784_m1 Nfe2l2, Cat. # 4331182) or Gclc (Mm00802655_m1 Gclc, Cat. # 4331182) in a 2× master mix (Applied Biosystems # 4369016). qPCR reactions were carried out in the AB StepOne Plus PCR system (Applied Biosystems) according to manufacturer’s optimized conditions of 10 min at 95°C for enzyme activation followed by 40 cycles of 15 s denaturation at 95°C and 1 min anneal/extend at 60°C. The StepOne Software v2.1 (Applied Biosystems) determined the cycle threshold fluorescent intensity (Ct). The relative change in mRNA levels between untreated control (1) and treated sample (2) was measured using the following formula normalized to the levels of GAPDH: 2^(Ct Target gene1-Ct GAPDH1)-(Ct Target gene2-Ct GAPDH2) (Soong et al., 2001)
2.10 Aβ42 treatment
A mixture of oligomeric and fibrillary Aβ1-42 (American Peptide #62-0-80) was prepared by incubating at 500 μM peptide in PBS for 72 hr at 37°C and then diluting in Neurobasal A/0.5 mM Glutamax to a final concentration of 10 μM. Neurons were treated for 15 hr with or without Aβ1-42.
2.11 Live-dead assay
For neuron survival, live cells on glass coverslips were stained with fluorescein diacetate (15 μg/ml; Sigma–Aldrich, St. Louis, MO) and dead cells with propidium iodide (4.6 μg/ml; Sigma –Aldrich) (Brewer et al., 1993). After washing the slips with HBSS (Invitrogen), cells were observed by blue and green fluorescence excitation through a 20x objective (Olympus) for green (live) and red (dead) fluorescence. Wash solutions were also examined for dead cells and added to the adherent dead cell count. Survival was calculated as the average percent live divided by the total cells (live + dead) in 5–8 adjacent fields.
2.12 Statistics
Data are presented as means and standard errors. Student’s T test was used to assess the difference of means using Prostat that was also used to obtain linear fits to BSO inhibition data (Poly Software, Pearl River, NY). We used p < 0.05 to reject the null hypothesis.
3. Results
3.1 Age-related rise in ROS depends on glutathione depletion
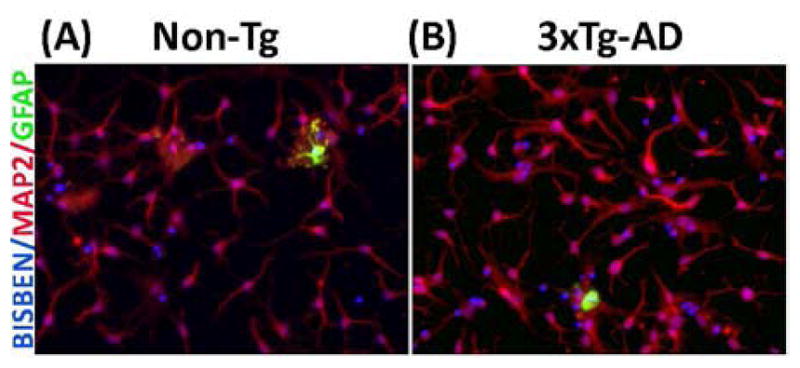
Previously we have shown that adult hippocampus/cortex neuron cultures have similar healthy neuron growth in both non-Tg and 3xTg-AD mice with less than 10% decline with age from 11 to 21 month (Ghosh et al., 2012). To further examine the purity of our neuron cultures, we determined the percent astroglia and neurons in 21 mo non-Tg and 3xTg-AD cultures by immunocytology of GFAP for astroglia and MAP2 for neurons. Fig. 1 (A and B) shows a typical low percentage of astroglia among about 90% MAP2 positive neurons. From over 400 cells from each genotype, we observed 3 + 1 % GFAP-positive cells in non-Tg cultures and 4 + 1 % in 3xTg-AD cultures, with over 88–90% neurons and the remainder likely microglia (Patel and Brewer, 2003). This analysis indicates that the following single-cell measures are neuron specific.
Fig 1. Characterization of adult hippocampal neuron culture at 8 days in vitro.

Bisbenzamide (blue nuclei) stained cells from 21 month old (A) non-Tg and (B) 3xTg-AD mice overlapping with either red MAP2 stain for differentiated adult neurons or green GFAP stain for astroglia shows about 90% of the cultured cell are neurons.
In order to simulate the age and AD-related increase in ROS and decrease in GSH, we stressed neurons by inhibiting glutathione synthesis with buthionine sulfoximine (BSO), an inhibitor of γ-glutamyl cysteine synthetase subunit c (Gclc), the rate-limiting enzyme of glutathione synthesis. By titrating inhibition in the non-Tg and 3xTg-AD neurons across the age span we also expected to determine whether the relationship of GSH to ROS was similar in young and old neurons and in the AD model. To assess the effects of inhibition, we applied fluorescent probes monochlorobimane (MCB) for glutathione levels and dichlorofluorescein diacetate (H2DCF-DA) for ROS levels.
Previously, we found that in aging non-transgenic (non-Tg) mouse neurons, resting GSH levels declined after middle age while ROS levels remained constant (Ghosh et al., 2012). Additionally, in 3xTg- AD compared to non-Tg neurons, GSH levels were lower from the earliest 2-month age without an increase in ROS. If ROS increases cause GSH declines, then age and AD-related intrinsic increases in ROS will result in exacerbated declines in GSH levels with BSO inhibition, deprived of culture medium antioxidants. Fig. 2A shows the expected increases in ROS and declines in GSH with inhibition of GSH synthesis at all ages and both genotypes. However, the response magnitudes were altered with age. Fig. 2C, D shows age and genotype changes in GSH and ROS levels without BSO, before added stress. Clearly, GSH levels rise until middle age in both genotypes, but greatly decline at 21 mo. ROS levels also increase with age, but importantly, rise much less from middle age to old age. The 3xTg-AD neurons have much lower GSH levels at all ages than the non-Tg neurons, possibly peaking at an earlier age than the non-Tg neurons. Compared to ROS levels in non-Tg neurons, higher levels of ROS do not appear in the 3xTg-AD neurons until 8 months, after which the difference remains fairly constant. The absence of a genotype difference in ROS at 2 and 4 months suggests that early ROS differences cannot cause genotype related memory differences.
Fig. 2. Glutathione depletion in neurons precedes elevated ROS levels.
A) Dose dependent decline of glutathione and increase of ROS with increasing concentration of buthionine sulfoximine (BSO) in 2, 4, 8, 11 and 21 month non-Tg (ROS: gray dashed line, open circle, GSH gray solid line, open circle) and 3xTg- AD (ROS: black dashed line, filled circle, GSH black solid line, filled circle) neurons. * = p < 0.01. B) Relationship of ROS changes to GSH levels from the titrations in (A) in non-Tg (dashed line linear fit) and 3xTg-AD neurons (solid line linear fit) for each indicated age. C) GSH fluorescence per neuron at zero BSO indicates an early deficit in 3xTg-AD neurons while D) ROS fluorescence levels increase only after 4 months in both genotypes with ROS levels higher in 3xTg-AD than non-Tg neurons. E) Age-related rate of ROS generation as a function of GSH depletion is higher in 3xTg-AD neurons than the non-Tg neurons. N = 400–600 neurons from 3–4 animals per genotype per age.
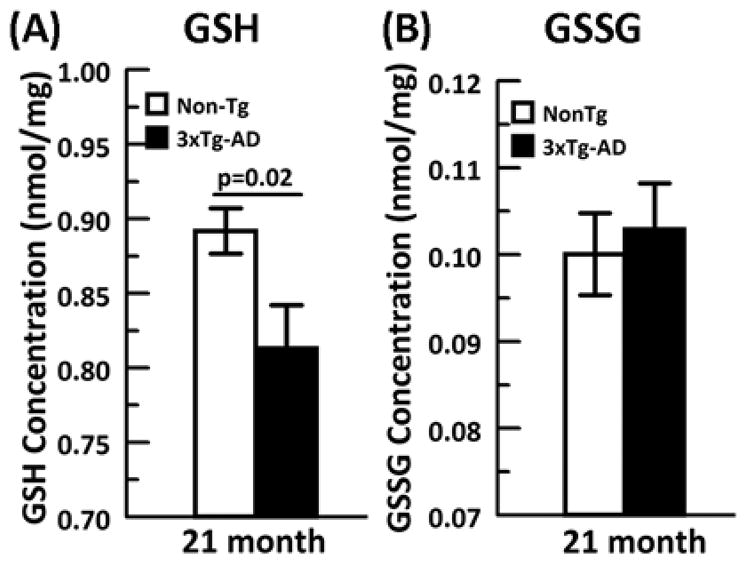
We next examined whether under GSH stress the relationship of GSH and ROS remains constant with age. We plotted the increase in ROS levels as a function of the decrease in GSH levels from each BSO inhibition across the age span for both non-Tg and 3xTg-AD neurons (Fig. 2B). Largely linear fits suggested direct ROS dependence on GSH and allowed comparisons of the ROS/GSH slope with age (Fig. 2E). ROS as a function of GSH actually declined from young to middle age of 11 months due to a slower decline in GSH levels than the increase in ROS levels. However, at 21 months, ROS levels increased dramatically in both genotypes. The dramatic rise in slope is due to a small rise in ROS from 11 to 21 month coupled to a much larger decline in GSH. Compared to non-Tg, 3xTg-AD neurons at all ages exhibited a higher rate of ROS generation as GSH was depleted. To confirm our neuronal GSH measures with samples from flash frozen brains, we performed HPLC on 21 month old hippocampus/cortex for GSH and GSSG concentrations (nmol/mg protein) (Fig. 3 A and B) and GSH/GSSG redox state. The 21 month brain data for GSH was consistent with our in vitro measures with a 3xTg-AD GSH concentration significantly lower than the non-Tg brain. The oxidized GSSG levels were not different between genotypes. Applying the Nernst equation to this data produced a redox state of −171 + 1 mV for the non-Tg animals and a more oxidized −168 + 1 mV for the 3xTg-AD brains (p=0.08, t-test). These HPLC measures from brain support the significance of the direction of change seen in cultured neurons. These observations lead us to conclude that in old age, a decline in GSH in neurons appears more causal to the rise in ROS (hypothesis B) and that this effect is larger in the 3xTg-AD than the non-Tg neurons.
Fig. 3. HPLC from brain extracts of 21 month animals indicates that.
A) GSH concentration from 3xTg-AD (black solid bar) is significantly lower than non-Tg (white bar) while B) GSSG concentrations (nmol/mg) are similar in both genotypes. N= 10–11 animals per genotype.
3.2 Age-related neuron loss depends on glutathione depletion
Since neuron loss is a characteristic of aging and neurodegeneration with AD (Simic et al., 1997), we measured cell death as a function of glutathione depletion or ROS elevation. With gradual GSH depletion (Fig. 4A), we observed increased neuron loss in both genotypes across the age span. An increase in ROS was also associated with neuron death (Fig. 4B), but with no genotype differences in slope. In order to determine the relationship between neuron loss and GSH depletion or ROS elevation as a function of age, we derived % dead/GSH and % dead/ROS slopes across the age span from Fig. 3A, B. As depicted in Fig. 4C, non-Tg neurons exhibited little or no shift in the rate of cell loss with GSH loss through middle age (11 months) which correlates with the previously observed increase in GSH defense through middle age (Fig. 4B). However, 3xTg-AD neuron loss with GSH depletion largely increases throughout the age span. At all ages, the rate of neuron loss with GSH depletion in the 3xTg-AD exceeds that from the non-Tg neurons. The relationship of neuron loss to increases in ROS caused by GSH depletion is shown in Fig. 4. Surprisingly, although neuron loss increased as ROS increased until middle age, the death as a function of ROS actually decreased at the oldest age of 21 months for both genotype neurons. Therefore, higher neuron loss at 21 month cannot be explained with elevated ROS. Moreover, the 3xTg-AD and non-Tg neurons had similar increments in death as a function of ROS levels, which implies that ROS are unlikely to explain the increased cell loss during GSH depletion in neurons from the 3xTg-AD mouse or memory deficits (Supplementary Fig. 1C). Thus, neuron loss in old age and in the AD-model showed greater dependency on GSH depletion than ROS elevation, in support of GSH causal hypothesis B over ROS causal hypothesis A.
Fig. 4. Genotype differences in neurodegeneration from glutathione depletion in neurons precedes elevated ROS levels, sustained into old age.

A) Age and dose dependent increase in neuron death with decline of glutathione and B) increase in ROS with increasing concentration of buthionine sulfoximine (BSO) in 2, 4, 8, 11 and 21 month non-Tg (gray line, open circle, and 3xTg-AD (black solid line, filled circle) neurons. C) Neuron death with GSH loss expressed as a slope indicates greater susceptibility of neuron loss with GSH depletion across the age span in both non-Tg (black dashed line, open circle) and 3xTg-AD (black solid line, filled circle), with 3xTg-AD being more sensitive to GSH depletion. D) Neuron death with ROS elevation expressed as a slope indicates similar responses in both non-Tg and 3xTg-AD neurons, but neuron loss in oldest 21 month declined in both genotypes from 11 month with ROS elevation. N = 400–600 neurons from 3–4 animals per genotype per age.
3.3 Nrf2 and Gclc mRNA expression and Nrf2 nuclear translocation deficits in 3xTg-AD neurons are partially reversed by 18-alpha- glycyrrhetinic acid (18α-GA)
Since glutathione levels declined after middle age in non-Tg neurons and we observed a larger difference in GSH than ROS levels in 3xTg-AD mice neurons, we wanted to determine whether deficits in the upstream transcription of GSH synthesis were responsible for the age and AD-related changes. Nrf2 is a redox-sensitive transcription factor, which transactivates several redox restorative genes (Table 1) including glutathione cysteine ligase (Gcl, subunit c), the rate-limiting enzyme for glutathione synthesis.
Table 1.
Prominent neuronal Nrf2 (Nrf2) regulated redox and antioxidant genes from Nrf2+/+/Nrf2 −/− mice (adapted from Lee et al., 2003)
| Redox gene | Fold change | Reaction |
|---|---|---|
| 1. NQ01 | 4.9 | NAD(P)H + H+ + quinone →NAD(P)+ + hydroquinone |
| 2. GST (glutathione-Stransferase) A4 (membrane) | 4.7 | Conjugation of reduced glutathione to electrophiles Glutathione + RX <==> glutathione-R +HX |
| 3. GST mu 1 (cytoplasmic) | 2.2 | Glutathione + RX <==> glutathione-R +HX |
| 4. GST mu3 (cytoplasmic) | 1.9 | Glutamate +cysteine (ATP)→ glutamyl cysteine |
| 5. Thioredoxin reductase | 1.7 | Thioredoxin reductase +Thioredoxin-S2 + NADPH + H+ thioredoxin-(SH)2 + NADP+ |
| 6. Malic enzyme | 1.6 | malate + NAD+ <==> oxaloacetate + NADH + H+ |
| 7. Heme oxygenase 1 | 1.5 | Heme b + 3O2 + 3½NADPH + 3½H+ + 7e- → biliverdin + Fe2+ + CO + 3½NADP+ + 3H2O |
| 8. Gclc, glutamyl-cysteine ligase, subunit C | 1.3 | Glutamate + cysteine →gamma glutamylcysteine |
| Antioxidant | ||
| 9. Catalase | 1.5 | 2H2O2 → 2H2O + O2 |
By qPCR from mRNA extracts from mouse brains, Nrf2 transcription factor expression in the combined hippocampus+cortex was observed to drop 20% in non-Tg and 53% in 3xTg-AD from 4 to 11 respectively, however we did not notice any change in Nrf2 expression from 11 to 21 mo (Fig. 5A). Moreover, 3xTg-AD Nrf2 expression was 48–50 % lower than non-Tg at 11 and 21 mo. To compare our in vivo results with our neuron cultures, we performed qPCR from mRNA extracts of scraped neurons. 3xTg-AD neurons exhibit 50% lower Nrf2 at 11 mo. that at 21 mo. dropped to 20% of the non-Tg neurons (Fig. 5B). Nrf2 levels were not significantly different with age. In a screen, Kapeta et al. (2010) found that the licorice compound 18α-GA maximally induced Nrf2 expression in human fibroblasts, however, it is not known whether 18α-GA has similar effects on adult primary neurons. As seen in Fig. 5B, treatment of neurons with 18α-GA resulted in a 5 fold increase in Nrf2 in both 11 and 21 mo. non-Tg neurons. In 3xTg-AD neurons, 18α-GA partially restored the Nrf2 deficits 2-fold beyond the levels of untreated non-Tg neurons for both ages measured, but not to the level of non-Tg neurons treated with 18α-GA.
Fig. 5. 18α-glycyrrhetinic acid (18α-GA) stimulates Nrf2 mRNA and translocates Nrf2 protein to the nucleus.
A) Age related Nrf2 mRNA levels from brain declines after 4 mo. in both non-Tg (gray dashed line, gray filled circle) and 3xTg-AD mice (black dashed line, black filled circle), N=6 animals/age/genotype. P values indicate genotype differences at specific ages. 18α-GA stimulates mRNAs for B) Nrf2 transcription factor and C) γ-glutamyl cysteine ligase, subunit c (Gclc) in neurons from 11 or 21 mo. brains. Vehicle (veh, DMSO) or 2 μg/ml 18α-GA in neurons from 11 (light grey bars) or 21 (black bars) month non-Tg and 3xTg-AD (11 month: white bars, 21 month: dark grey bars) brains. N=4–6 animals per genotype. D) Immunocytology for 21 mo untreated or 18α-GA treated non-Tg (upper panel) and 3xTg- AD (lower panel) neurons staining for Nrf2 (green) and bisbenzamide (blue) shows more green Nrf2 overlapping with blue bisbenzamide after 18α-GA treatment. E) Increased Nrf2 nuclear translocation with 18α-GA treatment in non-Tg (grey bars) and 3xTg-AD (black bars), n= 80–110 neurons from two 21 month animals/genotype.
Transcription levels of the Gclc gene varied more than Nrf2 with age and genotype (Fig. 5C). In both vehicle-treated genotypes, Gclc levels for 21 mo. neurons decreased 96% compared to vehicle treated 11 mo neurons. In non-Tg neurons, 18α-GA treatment increased Gclc transcripts 2.7 fold in both 11 and 21 mo. neurons. In the 3xTg-AD neurons, 18α-GA also increased 11 mo. Gclc transcripts 3 fold, but failed to produce an increase in 21 mo. neurons.
To confirm whether the protein levels of Nrf2 reflected the mRNA levels, we performed immunocytochemistry on 21 month untreated or 18α-GA-treated neurons (Fig. 5D). As shown in Fig. 5E, nuclear Nrf2 was 21% higher in the non-Tg than the 3xTg-AD neurons. Moreover, when treated with 18α-GA, nuclear Nrf2 for both non-Tg and 3xTg-AD neurons increased by 53% and 64% respectively as depicted by more green Nrf2 stain overlapping with the blue bisbenzamide stain (Fig 5D). Although the 3xTg-AD nuclear levels increased, they were 15% lower than non-Tg neurons. On the other hand, the cytoplasmic Nrf2 levels in non-Tg neurons decreased with 18α-GA treatment although insignificantly in 3xTg-AD neurons.
Together, these results indicate that age and genotype deficiencies in the upstream Nrf2 transcription factor and rate-limiting enzyme Gclc could contribute to the GSH redox buffer deficits we observed in middle-aged and 3xTg-AD neurons.
3.4 Nicotinamide and 18α-GA increase GSH and decrease ROS in old neurons
Nicotinamide is a direct NAD+ precursor which when administered through drinking water increases NADH and NADPH in striatum and thalamus of mouse brain (Klaidman et al., 2001), or improves cognitive deficits in 3xTg-AD mice (Green et al., 2008). Nicotinamide added to middle age 3xTg-AD neurons in culture increased GSH and decreased ROS (Ghosh et al., 2012). NADPH can also serve as a substrate to recycle oxidized glutathione (GSSG) via glutathione reductase. Since 18α-GA treatment increased Gclc expression, our strategy was to combine both these drugs to determine whether supply of a redox substrate for recycling GSSG to GSH together with induction of an enzyme for synthesis of GSH would combine to boost GSH levels and decrease ROS levels more than either alone. As a model of redox stress, we also treated cells with 10 μM BSO to deplete GSH. 19 month non-Tg and 3xTg-AD were treated with either nicotinamide, 18α-GA alone or together in the presence or absence of 10 μM BSO and probed for GSH and ROS levels (Fig. 6A). The high levels of ROS and low levels of GSH that result from the BSO treatment were largely reversed by the combination of nicotinamide and 18α-GA. Compared quantitatively (Fig. 6B,C), the GSH levels in 3xTg-AD neurons start lower and ROS levels start higher than the non-Tg neurons. Addition of either nicotinamide or 18α-GA alone to the 3xTg-AD neurons improved GSH levels by 10% and 34% respectively and lowered ROS levels. However, adding the combination of nicotinamide and 18α-GA elevated GSH levels by 63%, and lowered ROS levels by 59%, more than either drug alone. A similar pattern was observed under stress with BSO, completely restoring even 3xTg-AD GSH and ROS levels to those of untreated non-Tg neurons. This shows that in neurons from old animals, the neuronal redox deficits in GSH can be reversed more effectively by using the combination of a redox precursor and induction of redox enzymes.
Fig. 6. The NAD(P)H precursor, nicotinamide and the redox enzyme inducer, 18α-GA, additively increase GSH and decrease ROS levels.

A) Simultaneous measurement of glutathione with monochlorobimane (MCB) and ROS with dichlorofluorescein (DCF) and their merged effect on live 19 month cultured 3xTg-AD neurons with the indicated treatments. B) Additive increase in GSH levels in non-Tg (gray sold bars) and 3xTg-AD (black solid bars) and C) decrease in ROS levels with indicated treatments of 10 μM BSO, 2 mM nicotinamide (Nic), 2 μg/ml 18α-GA alone or in combination. N=200–300 neurons from 2 animals per genotype.
3.5 Additive neuroprotective effects of nicotinamide and 18α-GA against GSH depletion
Next, we measured the effects of nicotinamide and 18α-GA on neuron viability (Fig. 7A). Without BSO stress, neither nicotinamide nor 18α-GA affected viability. However, in combination, they decreased neuron death by 42% in the non-Tg and 29% in 3xTg-AD neurons. With stress from 10 μM BSO, the percent dead neurons more than doubled. Treatment with nicotinamide or 18α-GA alone did not significantly decrease cell death in non-Tg neurons but slightly decreased death in 3xTg-AD neurons. However, when both nicotinamide and 18α-GA were added, dead cells dropped 36% for non-Tg and 46% for 3xTg-AD neurons compared to the untreated BSO state, approximately combining the effects of each drug alone. This additive effect suggests independent mechanisms of action of nicotinamide and 18α-GA.
Fig. 7. Nicotinamide and 18α-GA provide neuroprotection against GSH or beta-amyloid stress.

11 month non-Tg (white bars) and 3xTg-AD neurons (grey bars) treated with nicotinamide or 18α-GA decreased neuron death against A) GSH depletion or B) Beta-amyloid stress. Note the additive neuroprotection provided by the combination of nicotinamide and 18α-GA in both models of stress toxicity in both genotypes.
3.6 Nicotinamide and 18α-GA provide neuroprotection against Aβ42 toxicity
One of the pathologies of AD is deposition of extracellular amyloid beta (Aβ) with the 42 amino acid peptide, Aβ42 thought to be particularly toxic to neurons. In order to investigate whether nicotinamide and 18α-GA have protective effects against Aβ42 toxicity, we treated non-Tg neurons with 5 μM Aβ42 peptide (Fig. 7B). Addition of Aβ42 increased cell death almost 3 fold. Co-treatment of Aβ42-treated neurons with nicotinamide or 18α-GA decreased cell death by 16% or 28% respectively, compared to Aβ42 treatment alone (p = 0.002 or p < 0.001). Interestingly, when Aβ42-stressed neurons were treated with the combination of nicotinamide and 18α-GA, the cell death declined by 41% indicating an additive protective effect of nicotinamide and 18α-GA against Aβ42 toxicity.
4. Discussion
4.1 Redox is upstream of ROS and more important for neurodegeneration
Lifelong buildup of ROS mediated damage is often claimed to cause aging and AD, yet antioxidant therapies targeted at decreasing ROS have proven unsuccessful in extending longevity or improving cognition. Our previous findings in aging rat (Parihar et al., 2008) and mouse non-Tg and 3xTg-AD neurons showed that an oxidative redox shift seen in GSH and NAD(P)H levels preceded elevated ROS levels and that only after the levels of redox buffers NAD(P)H and GSH declined were ROS levels elevated (Ghosh et al., 2012). These observations led to our current study to determine whether short-term interventions to decrease GSH: A) immediately add to age-related increases in ROS at all ages with proportionate neuron loss or whether B) the decrements in GSH fail to accelerate ROS increases with age but still cause proportionate neuron loss. By imposing this stress test on neurons by titrated inhibition of GSH synthesis, we examined the down-stream effects on ROS and neuron viability. In non- Tg neurons, we here found that the rate of increase in ROS actually declined as GSH levels declined from young through middle age and was only modestly increased in old age. These findings provide evidence against hypothesis A, but support B, that control of GSH is upstream of ROS. A similar pattern was observed in the 3xTg-AD neurons but the rates of ROS generation/GSH depletion were higher than the non-transgenic neurons across the age-span, possibly supporting a ROS cause in the AD mouse, but the neuron death experiments of Figure 2 indicate that ROS may not cause the neurodegeneration.
Using the same stress test of GSH depletion, we also established the dependence of neurodegeneration on GSH and ROS. Again in non-Tg neurons, neuron loss was mostly unaffected by GSH depletion until old age. But in 3xTg-AD neurons, neurodegeneration increased nearly continuously with age as GSH was depleted. Further, neuron loss was substantially higher at all ages in 3xTg-AD neurons than non-Tg neurons. Simultaneous measures of neuron loss as a function of ROS increases indicated increased neuron loss with age, but only until middle age. In old age, the rate of neuron loss with ROS actually decreased, failing to support a causal role of ROS in age-related neurodegeneration. Therefore, neurodegeneration in old age is more dependent on GSH loss than increased ROS, lending support to a more causal role of GSH for neurodegeneration. Further, the nearly identical profiles of neurodegeneration with ROS for both genotypes argues that cognitive deficits in 3xTg-AD neurons at any age are not a simple function of ROS, but more a function of GSH levels.
4.2 Glutathione as a redox buffer
Additional understanding of these results may derive from lower GSH levels shifting the GSH/GSSG redox state lower, in an oxidative direction promoting cell death. Non-Tg neurons may also be able to compensate for the GSH loss by adjusting other important redox couples like NADH/NAD+, NADPH/NADP+ or Cys/CySS so that the redox state remains balanced favoring neuron survival through middle age. This redox shift could be facilitated by the increases in glutathione peroxidase (Gpx) observed by Resende et al. (2008) in brain extracts from 3xTg-AD mice relative to non-Tg brain. Increased Gpx may adequately detoxify lipid and protein ROS damage, but at the expense of consuming GSH. Since NAD(P)H levels and regenerating capacity decline in old age neurons (Ghosh et al. 2012), the ability to restore the GSH is limited in old non-Tg neurons and in the 3xTg-AD neurons at all ages. Moreover, glutathione-S-transferase, which catalyzes the conjugation of GSH to several electrophilic compounds for detoxification, increases 1.3 fold in the hippocampus of aged rats compared to young ones (p=0.001) (Blalock et al., 2003), possibly as sufficient ROS detoxification, but in the process would consume a more important GSH and lead to an oxidative redox shift and eventual neurodegeneration.
The de novo synthesis of GSH is under the transcriptional control of the redox-sensitive factor Nrf2 that regulates the expression of several GSH associated enzymes including γ-glutamyl cysteine synthetase (GCS), the rate-limiting enzyme for GSH synthesis. The 3xTg-AD genotype-related deficit in GSH was also due to 30–50% lower levels of Nrf2 and Gclc mRNA levels than non-Tg neurons. Our observation is consistent with human studies where Nrf2 levels in AD brain are significantly lower than the age-matched control (Ramsey et al., 2007). Although Nrf2 activation is commonly associated with antioxidant responses, redox control genes are more prominent than anti-oxidant genes based on comparisons of cultured primary neurons from wild-type Nrf2+/+ mice and Nrf2 −/− mice (Table 1)(Lee et al., 2003). If glutathione is viewed as a redox-active agent along with reactions involving electron donors NADH and NADPH and their acceptors, we note the prominence of genes activated for redox regulation. The most obvious antioxidant, catalase, does not appear until the end of the list.
4.3 Balanced redox induction combined with an energy precursor produces additive benefits
Our 3xTg-AD mouse model expresses human mutant presenilin I (PSEN I) which raises intracellular resting calcium and disrupts calcium signaling (Cheung, et al., 2008; Stutzmann, et al., 2004). The mutated hAPP in the 3xTg-AD overproduces A-beta oligomers mutation (Kawahara, et al., 2009) which separately increase intracellular calcium (Grolla, et al., 2013). Together, these increases in intracellular calcium cause increases in ROS along with bioenergetic demands. Since we observed that ROS was not the leading cause of death in old neurons, and previously we found that an oxidative redox shift precedes ROS mediated macromolecular damage (Ghosh et al., 2012), we wanted to determine if redox interventions could increase GSH and improve neuron survival. Others and we have shown that the NAD+ precursor nicotinamide can improve cognition and shift the redox ratio toward a more reduced state in 3xTg-AD neurons (Green et al., 2008; Ghosh et al., 2012; Liu et al., 2012). Moreover, Kapeta et al. (2010) screened small molecules for protection against fibroblast senescence and found 18α-GA to be an efficient Nrf2 inducer. At concentrations 3–25x higher than the 4 μM we used, this drug detrimentally inhibits embryonic astroglial gap junctional communication (Blanc, et al., 1998; Ozog, et al., 2002), a mechanism unlikely to explain our observed adult neuroprotection. Our strategy was to stimulate a balanced redox induction by boosting both the substrate and the enzymes for redox control to determine if redox intervention can be beneficial in aging and AD. Our qRT-PCR results confirmed that 18α-GA increased both Nrf2 and Gclc levels in both non-Tg and 3xTg-AD neurons, an undoubtedly hundreds of other genes with ARE response elements (Lee et al., 2003). Although in 21 mo. 3xTg-AD neurons we failed to observe an increase in Gclc mRNA levels, we speculate that 18α-GA could increase other redox enzymes such as glutathione reductase to increase GSH levels. In neurons from 19 mo. non-Tg and 3xTg-AD mice stressed with BSO, the combination of nicotinamide and 18α-GA additively increased GSH levels and decreased ROS. Moreover, the combination drugs showed an additive protective effect against A-beta toxicity and GSH depletion. Since the 3xTg-AD GSH levels and survival rate, though improved, were still lower than the non-Tg treated groups, 3xTg-AD neurons may require further stimulation to relieve genetic repression for better neuroprotection.
4.4 The failure of anti-oxidant therapy and the rise of a redox perspective
Over two decades, attempts targeted toward decreasing ROS by overexpressing genes like SOD1, SOD2, catalase and glutathione peroxidase (GPx) have failed to increase longevity (Perez et al. 2009; Huang et al. 2000) or correspondingly improve memory (Lee et al., 2012). Further, antioxidant treatment with Vitamin E and/or C failed to improve cognition in AD (Petersen et al., 2005; Brewer, 2010b). These findings indicate that overexpressing antioxidants may not be the right approach for increasing neuroprotection possibly because ROS may be a late event that is off-target for neuroprotection while earlier upstream targets are more controlling such as redox (Jones and Go, 2010; Lee et al., 2012). Our findings support a dual nicotinamide/Nrf2 redox intervention as more functionally important in neuroprotection than targeting ROS. Redox balance requires both an adequate supply of substrates (here NADPH) as well as the enzymes to maintain a healthy redox state (here induced by 18α-GA). An imbalance between oxidized and reduced components of any redox couple may lead to higher ratio of pro-oxidants and eventually result in an oxidative redox shift and generation of excessive ROS, but the transcriptional and receptor effects of the redox shift may be more important than any repairable ROS damage (Brewer, 2010a). In support of this redox balance concept, Kanninen et al. (2009) showed that vector mediated Nrf2 expression in hippocampus improved cognition in APP/PS1 mice. Bodhinathan et al. (2010a,b) found intracellular redox state to enhance NMDA receptor activity, LTP and better control calcium dynamics in aged but not young rats. In an animal model of schizophrenia, Steullet et al. (2010) found a GSH deficit to cause a selective decrease in GABAergic neurons in the ventral rat hippocampus that increased stress-related behavior.
4.5 Implications and future prospects
Restoring balanced levels of redox sensitive transcription factors and enzymes through Nrf2 induction has been demonstrated in a number of mouse models of neurodegenerative disease (Jakel et al., 2007; Kanninen et al., 2009; Pareek et al., 2011; Neymotin et al., 2011), but perhaps confusing a downstream anti-oxidant activity with the upstream activation of redox controls, as we show here. The strategy of a combination of energy precursor and redox stimulators to induce multiple targets including NADH, NADPH, signaling pathways, metabolism, etc. shown here to be effective in vitro may provide a suitable environment for decreasing age-related neurodegeneration in vivo. Since decreased GSH, increased ROS and neurodegeneration along with A-beta toxicity are hallmarks of AD, attempts to reverse the deleterious effects with redox intervention may be clinically significant.
Supplementary Material
Time to reach hidden platform (seconds) in male non-Tg (grey cirles and dashed lines) and 3xTg-AD (black circles and solid line) mice does not show any significant genotype difference in memory/learning in A) 8 month (ANOVA (genotype) p = 0.084) or B) 17 month ( ANOVA (genotype) p =0.071). C) 20–21 month 3xTg-AD males took significantly more time to reach a hidden platform than the non-Tg males showing learning and memory deficits in old 3xTg-AD mice (ANOVA (genotype) p < 0.001). D) 12–15 month female non-Tg (gray open circles, dashed line) and 3xTg-AD (black open circles, solid lines), used as a gender control, did not show a genotype difference in learning and memory. * = p < 0.001, # p < 0.03, N= 8–14 animals per age/genotype.
Live dead assay on 21 month non-Tg neurons treated with vehicle or indicated concentrations of 18α-GA for 14 (grey dashed line, open circle) or 6 hrs (black solid line, filled circles). Black arrow indicates the dose and time used for other experiments. N = 180–210 neurons from 2 animals/dose.
Acknowledgments
This work was supported by NIH grants R01 AG032431 and the Stark Endowed Chair for Alzheimer’s Research. We thank Salvatore Oddo and Frank LaFerla for contributing the founder mice used in this study. We also thank members of the Center for Integrated Research in Cognitive and Neural Sciences (CIR-CNS) and Center for Alzheimer’s Disease and Related Disorders (CADRD) for helpful discussions.
Footnotes
Disclosure statement
The authors report no conflicts of interest.
Publisher's Disclaimer: This is a PDF file of an unedited manuscript that has been accepted for publication. As a service to our customers we are providing this early version of the manuscript. The manuscript will undergo copyediting, typesetting, and review of the resulting proof before it is published in its final citable form. Please note that during the production process errors maybe discovered which could affect the content, and all legal disclaimers that apply to the journal pertain.
References
- Billings LM, Oddo S, Green KN, McGaugh JL, LaFerla FM. Intraneuronal Abeta causes the onset of early Alzheimer’s disease-related cognitive deficits in transgenic mice. Neuron. 2005;45:675–88. doi: 10.1016/j.neuron.2005.01.040. [DOI] [PubMed] [Google Scholar]
- Blalock EM, Chen KC, Sharrow K, Herman JP, Porter NM, Foster TC, Landfield PW. Gene microarrays in hippocampal aging: statistical profiling identifies novel processes correlated with cognitive impairment. J Neurosci. 2003;23:3807–3819. doi: 10.1523/JNEUROSCI.23-09-03807.2003. [DOI] [PMC free article] [PubMed] [Google Scholar]
- Blanc EM, Bruce-Keller AJ, Mattson MP. Astrocytic gap junctional communication decreases neuronal vulnerability to oxidative stress-induced disruption of Ca 2+ homeostasis and cell death. J Neurochem. 1998;70:958–70. doi: 10.1046/j.1471-4159.1998.70030958.x. [DOI] [PubMed] [Google Scholar]
- Bodhinathan K, Kumar A, Foster TC. Intracellular Redox State Alters NMDA Receptor Response during Aging through Ca2+/Calmodulin-Dependent Protein Kinase II. J Neurosci. 2010;30:1914–1924. doi: 10.1523/JNEUROSCI.5485-09.2010. [DOI] [PMC free article] [PubMed] [Google Scholar]
- Bodhinathan K, Kumar A, Foster TC. Redox sensitive calcium stores underlie enhanced after hyperpolarization of aged neurons: role for ryanodine receptor mediated calcium signaling. J Neurophys. 2010;104:2586–2593. doi: 10.1152/jn.00577.2010. [DOI] [PMC free article] [PubMed] [Google Scholar]
- Brewer GJ. Isolation and culture of adult rat hippocampal neurons. J Neurosci Meth. 1997;71:143–155. doi: 10.1016/s0165-0270(96)00136-7. [DOI] [PubMed] [Google Scholar]
- Brewer GJ. Epigenetic oxidative redox shift (EORS) theory of aging unifies the free radical and insulin signaling theories. Exp Gerontol. 2010a;45:173–179. doi: 10.1016/j.exger.2009.11.007. [DOI] [PMC free article] [PubMed] [Google Scholar]
- Brewer GJ. Why vitamin E therapy fails for treatment of Alzheimer’s disease. J Alz Dis. 2010b;19:27–30. doi: 10.3233/JAD-2010-1238. [DOI] [PMC free article] [PubMed] [Google Scholar]
- Brewer GJ, Torricelli JR. Isolation and culture of adult neurons and neurospheres. Nat Prot. 2007;2:1490–1498. doi: 10.1038/nprot.2007.207. [DOI] [PubMed] [Google Scholar]
- Brewer GJ, Torricelli JR, Evege EK, Price PJ. Optimized survival of hippocampal neurons in B27-supplemented Neurobasal, a new serum-free medium combination. J Neurosci Res. 1993;35:567–576. doi: 10.1002/jnr.490350513. [DOI] [PubMed] [Google Scholar]
- Clinton LK, Billings LM, Green KN, Caccamo A, Ngo J, Oddo S, McGaugh JL, LaFerla FM. Age-dependent sexual dimorphism in cognition and stress response in the 3xTg-AD mice. Neurobiol Dis. 2007;28:76–82. doi: 10.1016/j.nbd.2007.06.013. [DOI] [PMC free article] [PubMed] [Google Scholar]
- Finkel T. Oxidant signals and oxidative stress. Curr Opin Cell Biol. 2003;15:247–254. doi: 10.1016/s0955-0674(03)00002-4. [DOI] [PubMed] [Google Scholar]
- Galasko DR, Peskind E, Clark CM, Quinn JF, Ringman JM, Jicha GA, Cotman C, Cottrell B, Montine TJ, Thomas RG, Aisen P for the Alzheimer’s Disease Cooperative Study. Antioxidants for Alzheimer Disease: A randomized clinical trial with cerebrospinal fluid biomarker measures. Arch Neurol. 2012;7:836–841. doi: 10.1001/archneurol.2012.85. [DOI] [PMC free article] [PubMed] [Google Scholar]
- Ghosh D, LeVault KR, Barnett AJ, Brewer GJ. A reversible early oxidized redox state that precedes macromolecular ROS damage in aging nontransgenic and 3xTg-AD mouse neurons. J Neurosci. 2012;32:5821–5832. doi: 10.1523/JNEUROSCI.6192-11.2012. [DOI] [PMC free article] [PubMed] [Google Scholar]
- Green KN, Steffan JS, Martinez-Coria H, Sun X, Schreiber SS, Thompson LM, LaFerla FM. Nicotinamide restores cognition in Alzheimer’s disease transgenic mice via a mechanism involving sirtuin inhibition and selective reduction of Thr231-phosphotau. J Neurosci. 2008;28:11500–11510. doi: 10.1523/JNEUROSCI.3203-08.2008. [DOI] [PMC free article] [PubMed] [Google Scholar]
- Griffith OW, Meister A. Glutathione: interorgan translocation, turnover, and metabolism. Proc Natl Acad Sci USA. 1979;76:5606–5610. doi: 10.1073/pnas.76.11.5606. [DOI] [PMC free article] [PubMed] [Google Scholar]
- Grolla AA, Sim JA, Lim D, Rodriguez JJ, Genazzani AA, Verkhratsky A. Amyloid-beta and Alzheimer’s disease type pathology differentially affects the calcium signalling toolkit in astrocytes from different brain regions. Cell death & disease. 2013;4:e623. doi: 10.1038/cddis.2013.145. [DOI] [PMC free article] [PubMed] [Google Scholar]
- Harman D. Free radicals in aging. Mol Cell Biochem. 1988;84:155–161. doi: 10.1007/BF00421050. [DOI] [PubMed] [Google Scholar]
- Huang TT, Carlson EJ, Gillespie AM, Shi Y, Epstein CJ. Ubiquitous overexpression of CuZn superoxide dismutase does not extend life span in mice. J Gerontol A Biol Sci Med Sci. 2000;55:B5–9. doi: 10.1093/gerona/55.1.b5. [DOI] [PubMed] [Google Scholar]
- Hulbert PB, Yakubu SI. Monobromobimane: a substrate for the fluorimetric assay of glutathione transferase. J Pharm Pharmacol. 1983;35:384–386. doi: 10.1111/j.2042-7158.1983.tb02962.x. [DOI] [PubMed] [Google Scholar]
- Jakel RJ, Townsend JA, Kraft AD, Johnson JA. Nrf2-mediated protection against 6- hydroxydopamine. Brain Res. 2007;1144:192–201. doi: 10.1016/j.brainres.2007.01.131. [DOI] [PMC free article] [PubMed] [Google Scholar]
- Jones DP. Extracellular redox state: refining the definition of oxidative stress in aging. Rejuvenation Res. 2006a;9:169–181. doi: 10.1089/rej.2006.9.169. [DOI] [PubMed] [Google Scholar]
- Jones DP. Redefining oxidative stress. Antioxid Redox Signal. 2006b;8:1865–1879. doi: 10.1089/ars.2006.8.1865. [DOI] [PubMed] [Google Scholar]
- Jones DP, Go YM. Redox compartmentalization and cellular stress. Diabetes, Obesity & Metab. 2010;12(Suppl 2):116–125. doi: 10.1111/j.1463-1326.2010.01266.x. [DOI] [PMC free article] [PubMed] [Google Scholar]
- Kanninen K, Heikkinen R, Malm T, Rolova T, Kuhmonen S, Leinonen H, Yla-Herttuala S, Tanila H, Levonen AL, Koistinaho M, Koistinaho J. Intrahippocampal injection of a lentiviral vector expressing Nrf2 improves spatial learning in a mouse model of Alzheimer’s disease. Proc Natl Acad Sci USA. 2009;106:16505–16510. doi: 10.1073/pnas.0908397106. [DOI] [PMC free article] [PubMed] [Google Scholar]
- Kapeta S, Chondrogianni N, Gonos ES. Nuclear erythroid factor 2-mediated proteasome activation delays senescence in human fibroblasts. J Biol Chem. 2010;285:8171–8184. doi: 10.1074/jbc.M109.031575. [DOI] [PMC free article] [PubMed] [Google Scholar]
- Kawahara M, Negishi-Kato M, Sadakane Y. Calcium dyshomeostasis and neurotoxicity of Alzheimer’s beta-amyloid protein. Expert Rev Neurotherap. 2009;9:681–93. doi: 10.1586/ern.09.28. [DOI] [PubMed] [Google Scholar]
- Klaidman LK, Mukherjee SK, Adams JD., Jr Oxidative changes in brain pyridine nucleotides and neuroprotection using nicotinamide. Biochim Biophys Acta. 2001;1525:136–148. doi: 10.1016/s0304-4165(00)00181-1. [DOI] [PubMed] [Google Scholar]
- Lee JM, Shih AY, Murphy TH, Johnson JA. NF-E2-related factor-2 mediates neuroprotection against mitochondrial complex I inhibitors and increased concentrations of intracellular calcium in primary cortical neurons. J Biol Chem. 2003;278:37948–37956. doi: 10.1074/jbc.M305204200. [DOI] [PubMed] [Google Scholar]
- Lee WH, Kumar A, Rani A, Herrera J, Xu J, Someya S, Foster TC. Influence of viral vector-mediated delivery of superoxide dismutase and catalase to the hippocampus on spatial learning and memory during aging. Antioxid Redox Signal. 2012;16:339–350. doi: 10.1089/ars.2011.4054. [DOI] [PMC free article] [PubMed] [Google Scholar]
- Liu D, Pitta M, Jiang H, Lee JH, Zhang G, Chen X, Kawamoto EM, Mattson MP. Nicotinamide forestalls pathology and cognitive decline in Alzheimer mice: evidence for improved neuronal bioenergetics and autophagy procession. Neurobiol Aging. 2012 doi: 10.1016/j.neurobiolaging.2012.11.020. [DOI] [PMC free article] [PubMed]
- Lloret A, Badia MC, Mora NJ, Pallardo FV, Alonso MD, Vina J. Vitamin E paradox in Alzheimer’s disease: it does not prevent loss of cognition and may even be detrimental. J Alz Dis. 2009;17:143–149. doi: 10.3233/JAD-2009-1033. [DOI] [PubMed] [Google Scholar]
- Markesbery WR, Lovell MA. Four-hydroxynonenal, a product of lipid peroxidation, is increased in the brain in Alzheimer’s disease. Neurobiol Aging. 1998;19:33–36. doi: 10.1016/s0197-4580(98)00009-8. [DOI] [PubMed] [Google Scholar]
- McKee AC, Carreras I, Hossain L, Ryu H, Klein WL, Oddo S, LaFerla FM, Jenkins BG, Kowall NW, Dedeoglu A. Ibuprofen reduces Abeta, hyperphosphorylated tau and memory deficits in Alzheimer mice. Brain Res. 2008;1207:225–36. doi: 10.1016/j.brainres.2008.01.095. [DOI] [PMC free article] [PubMed] [Google Scholar]
- Neymotin A, Calingasan NY, Wille E, Naseri N, Petri S, Damiano M, Liby KT, Risingsong R, Sporn M, Beal MF, Kiaei M. Neuroprotective effect of Nrf2/ARE activators, CDDO ethylamide and CDDO trifluoroethylamide, in a mouse model of amyotrophic lateral sclerosis. Free Radic Biol Med. 2011;51:88–96. doi: 10.1016/j.freeradbiomed.2011.03.027. [DOI] [PMC free article] [PubMed] [Google Scholar]
- Nunomura A, Perry G, Pappolla MA, Wade R, Hirai K, Chiba S, Smith MA. RNA oxidation is a prominent feature of vulnerable neurons in Alzheimer’s disease. J Neurosci. 1999;19:1959–1964. doi: 10.1523/JNEUROSCI.19-06-01959.1999. [DOI] [PMC free article] [PubMed] [Google Scholar]
- Oddo S, Caccamo A, Shepherd JD, Murphy MP, Golde TE, Kayed R, Metherate R, Mattson MP, Akbari Y, LaFerla FM. Triple-transgenic model of Alzheimer’s disease with plaques and tangles: intracellular Abeta and synaptic dysfunction. Neuron. 2003;39:409–421. doi: 10.1016/s0896-6273(03)00434-3. [DOI] [PubMed] [Google Scholar]
- Pareek TK, Belkadi A, Kesavapany S, Zaremba A, Loh SL, Bai L, Cohen ML, Meyer C, Liby KT, Miller RH, Sporn MB, Letterio JJ. Triterpenoid modulation of IL-17 and Nrf-2 expression ameliorates neuroinflammation and promotes remyelination in autoimmune encephalomyelitis. Scientific Rep. 2011;1:201. doi: 10.1038/srep00201. [DOI] [PMC free article] [PubMed] [Google Scholar]
- Parihar MS, Kunz EA, Brewer GJ. Age-related decreases in NAD(P)H and glutathione cause redox declines before ATP loss during glutamate treatment of hippocampal neurons. J Neurosci Res. 2008;86:2339–2352. doi: 10.1002/jnr.21679. [DOI] [PubMed] [Google Scholar]
- Perez VI, Van Remmen H, Bokov A, Epstein CJ, Vijg J, Richardson A. The overexpression of major antioxidant enzymes does not extend the lifespan of mice. Aging Cell. 2009;8:73–75. doi: 10.1111/j.1474-9726.2008.00449.x. [DOI] [PMC free article] [PubMed] [Google Scholar]
- Petersen RC, Thomas RG, Grundman M, Bennett D, Doody R, Ferris S, Galasko D, Jin S, Kaye J, Levey A, Pfeiffer E, Sano M, van Dyck CH, Thal LJ Alzheimer’s Disease Cooperative Study G. Vitamin E and donepezil for the treatment of mild cognitive impairment. N Engl J Med. 2005;352:2379–2388. doi: 10.1056/NEJMoa050151. [DOI] [PubMed] [Google Scholar]
- Ramsey CP, Glass CA, Montgomery MB, Lindl KA, Ritson GP, Chia LA, Hamilton RL, Chu CT, Jordan-Sciutto KL. Expression of Nrf2 in neurodegenerative diseases. J Neuropathol Exp Neurol. 2007;66:75–85. doi: 10.1097/nen.0b013e31802d6da9. [DOI] [PMC free article] [PubMed] [Google Scholar]
- Resende R, Moreira PI, Proenca T, Deshpande A, Busciglio J, Pereira C, Oliveira CR. Brain oxidative stress in a triple-transgenic mouse model of Alzheimer disease. Free Radic Biol Med. 2008;44:2051–2057. doi: 10.1016/j.freeradbiomed.2008.03.012. [DOI] [PubMed] [Google Scholar]
- Rigoulet M, Yoboue ED, Devin A. Mitochondrial ROS generation and its regulation: mechanisms involved in H(2)O(2) signaling. Antioxid Redox Signal. 2011;14:459–468. doi: 10.1089/ars.2010.3363. [DOI] [PubMed] [Google Scholar]
- Rost J, Rapoport S. Reduction-Potential of Glutathione. Nature. 1964;201:185. doi: 10.1038/201185a0. [DOI] [PubMed] [Google Scholar]
- Simic G, Kostovic I, Winblad B, Bogdanovic N. Volume and number of neurons of the human hippocampal formation in normal aging and Alzheimer’s disease. J Comp Neurol. 1997;379:482–494. doi: 10.1002/(sici)1096-9861(19970324)379:4<482::aid-cne2>3.0.co;2-z. [DOI] [PubMed] [Google Scholar]
- Sohal RS, Orr WC. The redox stress hypothesis of aging. Free Radic Biol Med. 2012;52:539–555. doi: 10.1016/j.freeradbiomed.2011.10.445. [DOI] [PMC free article] [PubMed] [Google Scholar]
- Soong R, Beyser K, Basten O, Kalbe A, Rueschoff J, Tabiti K. Quantitative reverse transcription-polymerase chain reaction detection of cytokeratin 20 in noncolorectal lymph nodes. Clin Cancer Res. 2001;7:3423–3429. [PubMed] [Google Scholar]
- Steullet P, Cabungcal JH, Kulak A, Kraftsik R, Chen Y, Dalton TP, Cuenod M, Do KQ. Redox dysregulation affects the ventral but not dorsal hippocampus: Impairment of parvalbumin neurons, gamma oscillations, and related behaviors. J Neurosci. 2010;30:2547–2558. doi: 10.1523/JNEUROSCI.3857-09.2010. [DOI] [PMC free article] [PubMed] [Google Scholar]
- Stutzmann GE, Caccamo A, LaFerla FM, Parker I. Dysregulated IP3 signaling in cortical neurons of knock-in mice expressing an Alzheimer’s-linked mutation in presenilin1 results in exaggerated Ca2+ signals and altered membrane excitability. J Neurosci. 2004;24:508–13. doi: 10.1523/JNEUROSCI.4386-03.2004. [DOI] [PMC free article] [PubMed] [Google Scholar]
- Sultana R, Butterfield DA. Oxidative Modification of Brain Proteins in Alzheimer’s Disease: Perspective on Future Studies Based on Results of Redox Proteomics Studies. J Alz Dis. 2012;33:s243–s251. doi: 10.3233/JAD-2012-129018. [DOI] [PubMed] [Google Scholar]
- Sultana R, Perluigi M, Butterfield DA. Redox proteomics identification of oxidatively modified proteins in Alzheimer’s disease brain and in vivo and in vitro models of AD centered around Abeta(1–42) J Chromatogr B Analyt Technol Biomed Life Sci. 2006;833:3–11. doi: 10.1016/j.jchromb.2005.09.024. [DOI] [PubMed] [Google Scholar]
- Walker MP, Laferla FM, Oddo SS, Brewer GJ. Reversible epigenetic histone modifications and Bdnf expression in neurons with aging and from a mouse model of Alzheimer’s disease. Age (Dordr) 2012 doi: 10.1007/s11357-011-9375-5. [DOI] [PMC free article] [PubMed] [Google Scholar]
- Zhu Y, Carvey PM, Ling Z. Age-related changes in glutathione and glutathione-related enzymes in rat brain. Brain Res. 2006;1090:35–44. doi: 10.1016/j.brainres.2006.03.063. [DOI] [PMC free article] [PubMed] [Google Scholar]
Associated Data
This section collects any data citations, data availability statements, or supplementary materials included in this article.
Supplementary Materials
Time to reach hidden platform (seconds) in male non-Tg (grey cirles and dashed lines) and 3xTg-AD (black circles and solid line) mice does not show any significant genotype difference in memory/learning in A) 8 month (ANOVA (genotype) p = 0.084) or B) 17 month ( ANOVA (genotype) p =0.071). C) 20–21 month 3xTg-AD males took significantly more time to reach a hidden platform than the non-Tg males showing learning and memory deficits in old 3xTg-AD mice (ANOVA (genotype) p < 0.001). D) 12–15 month female non-Tg (gray open circles, dashed line) and 3xTg-AD (black open circles, solid lines), used as a gender control, did not show a genotype difference in learning and memory. * = p < 0.001, # p < 0.03, N= 8–14 animals per age/genotype.
Live dead assay on 21 month non-Tg neurons treated with vehicle or indicated concentrations of 18α-GA for 14 (grey dashed line, open circle) or 6 hrs (black solid line, filled circles). Black arrow indicates the dose and time used for other experiments. N = 180–210 neurons from 2 animals/dose.