

Abstract
Aims
To evaluate dose levels for semaglutide, a glucagon‐like peptide‐1 analogue approved for the treatment of type 2 diabetes, by examining the effects of demographic factors on efficacy and safety in an exposure‐response analysis.
Methods
We analysed data from 1552 adults from four randomized phase III trials of 30 to 56 weeks' duration, investigating once‐weekly semaglutide doses 0.5 and 1.0 mg. Exposure‐response relationships were investigated using graphical and model‐based techniques to assess the two dose levels and subgroups with the highest and lowest exposure and response.
Results
The population had the following demographic characteristics: baseline mean age between 53.2 and 58.4 years, glycated haemoglobin (HbA1c) between 64 and 67 mmol/mol (8.0% and 8.3%), body weight between 71.3 and 96.2 kg, and diabetes duration between 4.2 and 8.9 years. Exposure‐response analysis showed a clear HbA1c and weight reduction across exposures after 30 weeks, irrespective of baseline values. The exposure‐response for HbA1c was influenced by baseline HbA1c, and body weight exposure‐response was influenced by sex, with limited impact of other factors. Analyses for relevant subgroups of baseline body weight, baseline HbA1c and sex indicated clinically relevant additional benefits with regard to HbA1c and weight with 1.0 vs 0.5 mg semaglutide. The proportion of participants reporting gastrointestinal (GI) side effects increased with increasing exposure, but was counteracted by tolerance development.
Conclusions
The analysis showed that all subgroups obtained a clinically relevant benefit with semaglutide 0.5 mg and an additional benefit with semaglutide 1.0 mg. The increase in GI side effects with higher exposure was mitigated by gradually increasing the dose.
Keywords: GLP‐1, GLP‐1 analogue, type 2 diabetes
1. INTRODUCTION
Glucagon‐like peptide‐1 (GLP‐1), an incretin hormone secreted by intestinal L cells after food intake,1, 2 inhibits glucagon secretion and stimulates insulin secretion in a glucose‐dependent manner.2, 3 Semaglutide (Novo Nordisk, Bagsværd, Denmark) is a GLP‐1 analogue approved for the treatment of type 2 diabetes mellitus (T2DM). With 94% amino acid sequence homology to native GLP‐1,4 semaglutide has three structural modifications that prolong its half‐life to ~1 week, making it appropriate for once‐weekly administration.4, 5 In the semaglutide clinical development programme, doses of 0.5 and 1.0 mg were tested based on results from a phase II trial,6 supported by a dose‐response model using data from the trial.
The aim of the present analysis was to extend the dose‐response analysis by defining the relationship between exposure (in terms of mean concentrations at steady‐state maintenance dose) and efficacy and safety. The phase III trials included one or two dose levels but, because of between‐subject variability including variability attributable to intrinsic and extrinsic factors (such as body weight, sex, age, race and baseline glycated haemoglobin [HbA1c] level), these doses lead to a continuum of exposure levels. This approach is helpful for examining the appropriateness of adjusting the treatment dose for specific population subsets, particularly those expected to have exposures at the low and high extremes, such as high vs low body weight, which has been shown to be of importance for semaglutide exposure.7
In the exposure‐response analyses, we aimed to evaluate the efficacy and safety/tolerability of semaglutide across a broad range of exposures generated from four trials in the clinical development programme with semaglutide doses 0.5 and 1.0 mg.8, 9, 10, 11 We wanted to determine if all subgroups of patients would obtain effective exposure levels with a semaglutide 0.5 mg dose, and if meaningful additional benefits could be obtained with the higher 1.0 mg dose.
2. METHODS
2.1. Trials providing data for exposure‐response analyses
The exposure‐response analyses included data from 1423 adults randomized to semaglutide in four trials from the semaglutide SUSTAIN (Semaglutide Unabated Sustainability in Treatment of Type 2 Diabetes) programme8, 9, 10, 11 (Table S1), and from 129 adults randomized to placebo (SUSTAIN 1). The trials investigated semaglutide doses 0.5 and 1.0 mg (SUSTAIN 3 only investigated semaglutide 1.0 mg) and included either placebo as the comparator (SUSTAIN 1) or an active comparator (SUSTAIN 2 and 3, SUSTAIN−Japan; Table S1).
Three trials were global and one was conducted in Japan (http://Clinicaltrials.gov identifiers: NCT02054897, NCT01930188, NCT01885208 and NCT02207374).8, 9, 10, 11 The trials enrolled men and women diagnosed with T2DM; in the global trials participants were aged ≥18 years and in the trial from Japan they were aged ≥20 years. No restrictions on body weight or body mass index (BMI) applied. Detailed enrolment criteria have been published previously.8, 9, 10, 11
2.2. Data sets for exposure‐response analyses
The data were from participants who had both pharmacokinetic and pharmacodynamic assessments; similar to a recent report,7 but excluding participants from one trial in which the background medication could freely be adjusted. Data for efficacy responses (HbA1c and body weight) comprised all participants exposed to at least one semaglutide dose with at least two valid pharmacokinetic observations, and participants treated with placebo. The safety analysis dataset (used for analyses of pulse rate, calcitonin and gastrointestinal [GI] adverse events [AEs]) comprised all participants in the data file for efficacy response with at least one valid pharmacokinetic observation. Calcitonin was selected as a biomarker for C‐cell activity and mass because of observed C‐cell changes in rodents with GLP‐1 receptor agonists (RAs).
Response values at week 30 were used for analysis of changes in HbA1c and body weight; pulse rate and calcitonin changes were analysed until end‐of‐treatment (Table S1). Estimates from a mixed model for repeated measurement analysis were used to impute missing response values (HbA1c: 10.3%, body weight: 9.6%, pulse rate: 16.6% of values imputed). For analysis of GI AEs (nausea, vomiting, diarrhoea and constipation), all events reported from baseline until week 30 were included in the analysis. For calcitonin, only participants with a normal baseline value and post‐baseline data were included in the analysis. No imputations were applied for GI AEs or calcitonin. A sensitivity analysis with exclusion of imputed response values showed only minor impact on the estimates for the variables.
Average semaglutide steady‐state concentrations (Cavg) were derived from the individual estimates of clearance following subcutaneous injection in a population‐pharmacokinetic analysis7 and were used as a measure of exposure. For the analyses of HbA1c, body weight, pulse rate, calcitonin and GI AEs, the Cavg value at the randomized maintenance dose was used.
2.3. Blood sampling and semaglutide exposure
In the trials, 4‐weekly dose escalations of semaglutide (0.25, 0.5, 1.0 mg) were performed. Blood samples for assessment of plasma semaglutide concentrations were taken on 4−5 occasions per participant at weeks 4, 8, 16 and 30 for each trial and, for all trials except SUSTAIN 1, at week 56.
Semaglutide plasma concentrations were measured using a validated liquid chromatography‐tandem mass spectrometry assay (Celerion Inc., Fehraltorf, Switzerland), as previously described.5 The lower limit of quantification was 0.729 nmol/L. Samples below the lower limit of quantification were excluded from the analysis. HbA1c was assayed in plasma using ion‐exchange high‐pressure liquid chromatography (assay range 3.1%‐18.5%). Calcitonin was assayed in serum using a chemiluminescent immunometric method (assay range 2.0‐2000 pg/mL).
2.4. Exposure‐response analyses
Exposure‐response relationships were visualized using quantile plots with model prediction overlays. The models included covariates that influence exposure and/or response. For each variable of interest, participants treated with semaglutide were divided into six quantiles based on their exposure values; with quantile 1 representing the lowest exposure and quantile 6, the highest, with an additional quantile for participants treated with placebo that was assigned a value of 0 exposure. If other stratifications were included in a plot, 3 or 4 exposure quantiles were used instead. For each exposure quantile, we plotted the mean and 95% confidence interval (CI) for the response variable of interest against the median semaglutide concentration (Cavg). The modelling approach has been described in detail elsewhere.12
The software program R (ver. 2.1.4.2, R Foundation; Revolution Analytics, Mountain View, California, ver. 6) was used for data file processing, explorative data analysis, plotting and exposure‐response analyses.
2.4.1. Analysis of change from baseline in HbA1c vs exposure
The exposure‐response model for HbA1c change from baseline until week 30 was developed as follows.
Initially, the presence of a significant slope was tested using a linear model. It was confirmed that the slope was significantly different from zero, hence an Emax model was developed as described below.
Pre‐selected covariates were included in the base model: trial; sex; age group; baseline body weight; and baseline HbA1c:
A Hill coefficient was not significantly different from 1 and hence it was not included in the model.
Baseline HbA1c was tested and found to be significant as a covariate on Emax and was therefore included in the model.
Additional covariates were explored graphically. None of these were found to have a significant effect (data not shown) and were therefore not included in the model.
The final model had baseline HbA1c and body weight, sex, age and trial as covariates and was parameterized as:
where CFB was the change from baseline, Etrial was an additive trial effect, Emax was the maximum drug effect, IHbA1c was the interaction effect of baseline HbA1c on Emax, Cavg was the estimated average steady‐state semaglutide concentration at the maintenance dose, EC50 was the exposure associated with half the maximum effect, Ecov was the sum of covariate effects on the overall response in subgroups, and e represented the residual error. For the calculation of Ecov, EHbA1c was the effect of HbA1c at baseline centred on 8%, Eweight was the effect of body weight centred on 85 kg, Esex was the effects of male sex, and Eage ≥ 65 was the effect of age group.
Interaction effects were also tested for the covariates sex, Asian, black or African American, Japanese and Hispanic or Latino. No clear effects were found; therefore, these covariates were not included.
2.4.2. Analysis of change from baseline in body weight
The exposure‐response model for body weight change from baseline to week 30 in percentage was developed as follows.
A test of slope was conducted for the linear model excluding placebo data and including trial, sex, age group, baseline body weight and baseline HbA1c as covariates. The test confirmed a significant slope.
An Emax model was estimated for body weight, but the EC50 was estimated to be a very high value, therefore no further development took place. This finding was in accordance with the graphical inspection of the data which indicated a linear relationship for semaglutide.
The linear model was developed further by testing covariate effects previously known to be relevant for body weight:
A sex‐Cavg interaction covariate was found to be significant and was included in the model.
Additional covariates on the exposure‐response slope were explored. None of these were found to have a significant effect (data not shown) and were therefore not included in the model.
The final linear model had the same covariates as for HbA1c:
where Isex was the interaction effect of sex on the slope; the other terms were as defined above.
The exposure‐response models for HbA1c responders, calcitonin and pulse rate are provided in Appendix S1.
2.4.3. Analysis of GI AEs vs time and exposure
In the development of the exposure‐response models for GI AEs, a test of slope was conducted for the logistic regression models excluding placebo data and including trial, sex, age group, escalation regimen and Japanese race as covariates. A covariate factor for dose escalation was included to adjust for the different escalation procedures for the 1.0 mg dose level, which was escalated in two steps, and the 0.5 mg dose level, which was escalated in one step. Furthermore, because differences in the GI AE profile were observed between Japanese and non‐Japanese participants, an additional covariate factor (EJapanese) was included. Baseline body weight was highly correlated to exposure within each dose group and could not be estimated accurately for GI AEs.
In the final model, the proportions of participants with reported nausea, vomiting, diarrhoea and constipation were analysed graphically vs time in a model‐independent evaluation. In addition, sensitivity analyses included (i) imputation of nausea using last‐observation‐carried‐forward (LOCF) imputation, i.e. the GI status (nausea reported or not) at the time of withdrawal was carried forward until week 30 for participants who discontinued, and (ii) an analysis of trial completers. The exposure‐response relationship was analysed for the proportion of participants reporting nausea, vomiting, diarrhoea and constipation between start of treatment and week 30. The following logistic regression models were used:
Nausea and constipation:
Vomiting and diarrhoea:
where p(GIevent) was the probability of reporting a GI event during 30 weeks of semaglutide treatment; α described the relationship of event probability to exposure; and EJapanese, Esex, Eage ≥ 65, Etrial and Eescalation were covariate effects of race, sex, age, trial and dose escalation, respectively. The Eescalation factor was introduced to adjust for the different escalation procedures for the 1.0 mg dose level (escalated in three steps via 0.25 and 0.5 mg), and the 0.5 mg dose level (escalated in two steps via 0.25 mg). The EJapanese factor was also included, as differences in the GI AE profile were observed between Japanese and non‐Japanese participants. The additional influence of baseline HbA1c and body weight was not included in the final model because of only minor improvements of the model fit.
3. RESULTS
3.1. Participant characteristics
The population included in the exposure‐response analyses covered a wide range of demographic characteristics (baseline mean age between 53.2 and 58.4 years, HbA1c between 64 and 67 mmol/mol (8.0% and 8.3%), body weight between 71.3 and 96.2 kg and diabetes duration between 4.2 and 8.9 years; Table S2).
3.2. Semaglutide exposure and HbA1c reduction
The exposure‐response relationship between semaglutide exposure and HbA1c change from baseline to week 30 is shown in Figure 1. HbA1c decreased in an exposure‐dependent manner in the concentration range associated with 0.5 and 1.0 mg semaglutide doses (~10‐50 nmol/L; Figure 1A). The HbA1c response levelled off at high concentrations and the mean (SE) concentration providing half the maximum effect (EC50) was estimated to be 6.5 (1.4) nmol/L. A substantial effect vs placebo was obtained also at the lower end of the exposure range.
Figure 1.
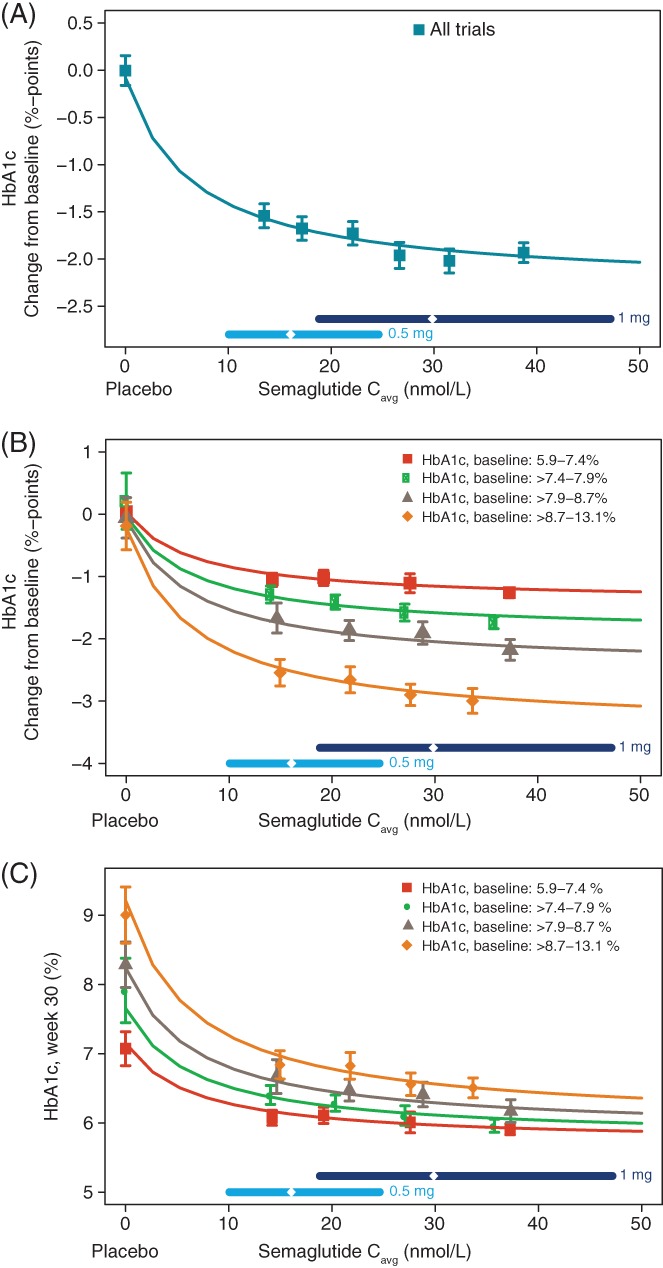
Semaglutide exposure and glycated haemoglobin (HbA1c). HbA1c change from baseline A, stratified by baseline HbA1c B, and treatment outcome in terms of absolute HbA1c after 30 weeks of treatment stratified by baseline HbA1c C, are shown vs semaglutide exposure. Data are mean values with 95% confidence interval (CI) vs exposure expressed as quantiles of Cavg, plus a value of 0 exposure assigned to participants treated with placebo. The sigmoidal curved lines through the data represent covariate‐adjusted model‐derived estimates for each population. Horizontal lines with diamonds along the x‐axis represent median and 95% exposure ranges for each dose level. To convert %‐points to mmol/mol, please use the following equation: IFCC (mmol/mol) = (10.93 * NGSP %‐points) ‐ 23.50. IFCC, International Federation of Clinical Chemistry and Laboratory Medicine; NGSP, National Glycohemoglobin Standardization Program; Cavg, average semaglutide concentrations at steady state
The relationship between the HbA1c response and semaglutide exposure was similar in men and women and across subgroups of body weight, age, race, ethnicity, diabetes duration, trial and renal function (Figure S1). The glycaemic control responder analysis indicated that the proportions of participants achieving American Diabetes Association (ADA) and American Association of Clinical Endocrinology (AACE) targets of HbA1c <53 mmol/mol (<7%) and ≤48 mmol/mol (≤6.5%), respectively,13, 14 increased with increasing semaglutide exposure and consistently across trials (Figure S2).
When stratifying by baseline HbA1c quartiles, a greater mean HbA1c change from baseline was seen with higher baseline HbA1c values for a given semaglutide exposure (Figure 1B); however, the treatment outcome in terms of the absolute HbA1c value achieved at week 30 was inversely correlated with baseline HbA1c (Figure 1C). It should be noted that, based on the model, even the group with the highest baseline HbA1c achieved mean HbA1c values of <53 mmol/mol (<7%) at week 30 at the highest exposure levels.
The exposure‐response model for HbA1c was evaluated by assessing standard goodness‐of‐fit plots, which were found to be acceptable (Figure S3).
3.3. Semaglutide exposure and body weight reduction
The exposure‐response relationship between semaglutide exposure and change from baseline to week 30 in body weight is shown in Figure 2. Body weight loss increased linearly with increasing semaglutide exposure, with a relative weight loss from baseline of ~6.5% for the highest exposure quantile and a predicted weight loss of ~8% for participants with exposure at the upper end of the exposure range (Figure 2A). The characteristics of the exposure‐response relationships were similar in each trial (data not shown). When stratifying by sex, body weight loss was greater in women than in men, with a steeper slope vs exposure for women compared to men (Figure 2B).
Figure 2.
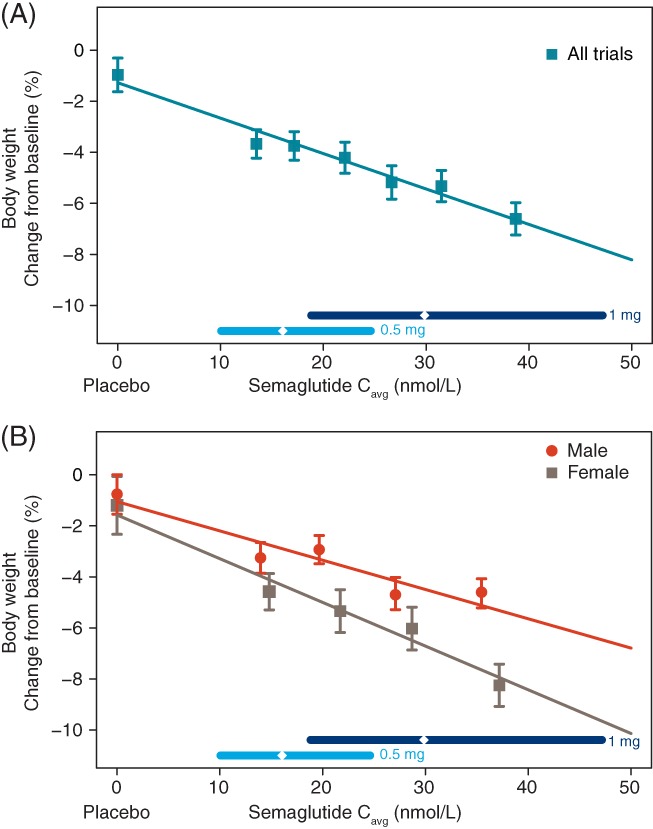
Semaglutide exposure and body weight. Data are mean values of body weight change from baseline with 95% confidence interval (CI) vs exposure expressed as 6 quantiles of Cavg A, or stratified by sex B, with four quantiles, plus a value of 0 exposure assigned to participants treated with placebo. The lines through the data represent covariate‐adjusted model‐derived estimates for each population. Horizontal lines with diamonds along the x‐axis represent median and 95% exposure ranges for each dose level. Cavg, average semaglutide concentrations at steady state
Standard goodness‐of‐fit plots were also used to evaluate the exposure‐response model for body weight and were found to be acceptable (Figure S4).
3.4. Exploration of HbA1c and body weight responses across populations
For the exposure‐response relationship for HbA1c and body weight, the most influential covariate factors were baseline HbA1c and baseline body weight and, moreover, body weight loss was influenced by sex. Therefore, we conducted additional subgroup analyses for these variables, investigating the exposure and the exposure‐response relationship for 0.5 and 1.0 mg semaglutide. Consistently greater model‐derived HbA1c and body weight responses were observed in participants dosed with 1.0 mg compared with 0.5 mg semaglutide, irrespective of baseline HbA1c, baseline body weight or sex (Table 1). We observed greater effects of semaglutide on HbA1c in the 10% of participants with the lowest body weight than in those with the 10% highest weight. Nevertheless, in the heaviest participants a substantial effect on HbA1c and body weight was observed with semaglutide 0.5 mg, despite the lower exposure.
Table 1.
Model‐derived estimates of exposure and response for glycated haemoglobin and body weight
| HbA1c | Body weight | |||||
|---|---|---|---|---|---|---|
| Subsets | Dose, mg | Semaglutide exposure, nmol/L | Mean change from baseline, %‐points | Mean (95% CI) change from 0.5 to 1.0 mg, %‐points | Mean change from baseline, % | Mean (95% CI) change from 0.5 to 1.0 mg, % |
| All participants | 0.5 | 15.3 | −1.65 | − | −3.4 | − |
| 1.0 | 30.6 | −1.92 | −0.27 (−0.17; −0.36) | −5.5 | −2.1 (−1.7; −2.5) | |
| All men | 0.5 1.0 |
15.0 29.9 |
−1.65 −1.93 |
− −0.28 (−0.18; −0.37) |
−2.8 −4.5 |
− −1.7 (−1.3; −2.1) |
| All women | 0.5 | 15.9 | −1.64 | − | −4.3 | − |
| 1.0 | 31.7 | −1.90 | −0.27 (−0.17; −0.36) | −7.0 | −2.7 (−2.2; −3.3) | |
| 10% participants | 0.5 | 10.5 | −1.50 | − | −3.6 | − |
| with highest BWa | 1.0 | 21.0 | −1.82 | −0.33 (−0.22; −0.41) | −5.0 | −1.4 (−1.2; −1.7) |
| 10% participants | 0.5 | 21.8 | −1.71 | − | −3.7 | − |
| with lowest BWb | 1.0 | 43.6 | −1.91 | −0.21 (−0.12; −0.29) | −7.0 | −3.3 (−2.7; −3.9) |
| 10% participants | 0.5 | 15.3 | −2.84 | − | −2.0 | − |
| with highest HbA1cc | 1.0 | 30.6 | −3.29 | −0.45 (−0.28; −0.61) | −4.2 | −2.2 (−1.8; −2.5) |
| 10% participants | 0.5 | 15.9 | −0.83 | − | −4.5 | − |
| with lowest HbA1cd | 1.0 | 31.7 | −0.98 | −0.15 (−0.09; −0.21) | −6.7 | −2.2 (−1.8; −2.6) |
Abbreviations: BW, body weight; CI, confidence interval; HbA1c, glycated haemoglobin.
Data are mean values of exposure and mean (95% CI) covariate‐adjusted values of response for each subset and dose. 95% CIs for the predicted response for the changes between 0.5 and 1.0 mg semaglutide in subsets of participants were obtained from the HbA1c and BW exposure‐response models, using stratified non‐parametric bootstrap methodology. Sampling was based on re‐sampling participants within trial and treatment, and thereby conserving the randomization structure. To convert %‐points to mmol/mol, please use the following equation: IFCC (mmol/mol) = (10.93 * NGSP %‐points) ‐ 23.50.
116.8‐198.3 kg at baseline.
39.7‐60.2 kg at baseline.
81−120 mmol/mol (9.6%−13.1%) points at baseline.
41−53 mmol/mol (5.9%−7.0%) points at baseline.
3.5. Semaglutide exposure and safety outcomes
An increase from baseline to end‐of‐trial in mean resting pulse rate of ~2−4 bpm was observed with semaglutide treatment (Figure S5A). The exposure‐response relationship for pulse rate was described by a linear model with a slope not significantly different from 0, indicating that the increase in pulse rate was exposure‐independent in the range of semaglutide exposures achieved with doses of 0.5 and 1.0 mg.
The proportion of participants with serum calcitonin concentrations above the reference ranges at any time after baseline until end‐of‐treatment is shown in Figure S5B and was low overall: 36 of 1395 participants (2.6%). The analysis suggested that elevated calcitonin levels were independent of exposure in the investigated range of semaglutide exposures achieved with 0.5 and 1.0 mg semaglutide, with no effect of semaglutide vs placebo.
Figure 3A shows the proportion of participants reporting nausea, the most frequent GI event, over the 30‐week period vs time. The proportion of participants reporting events of nausea increased following each dose escalation: at week 4 and at week 8 (Figure 3A). More participants with high exposure than participants with low exposure within the same dose group reported nausea. The proportion of participants reporting nausea started to decline after 8 to 12 weeks of treatment, depending on the allocated dose level, indicating tolerance development over time.
Figure 3.
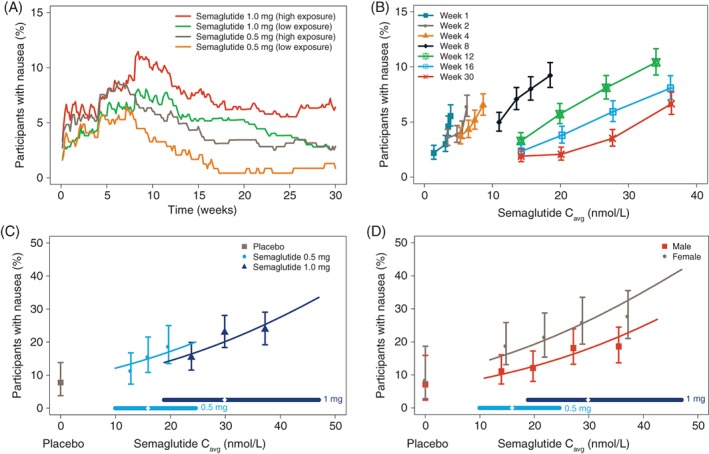
Semaglutide exposure and nausea. Data show the proportion of participants reporting nausea over time A, and vs exposure by week B, and the proportion of participants with nausea at any time vs steady‐state exposure by treatment C, and by sex D. Data in A are mean proportions for participants dosed with semaglutide 0.5 and 1.0 mg, respectively split into two quantiles with high/low exposures. Data in B‐D are mean response values with 95% confidence interval (CI) vs exposure expressed as quantiles of Cavg. The lines through the data represent covariate‐adjusted model‐derived estimates for each population. Horizontal lines with diamonds along the x‐axis represent median and 95% exposure ranges for each dose level. Cavg, average semaglutide concentrations at steady state
Nausea tolerance development is further illustrated in Figure 3B. The exposure‐response relationship at week 1 indicated an increase in nausea vs exposure. While the proportion of participants reporting nausea was higher with high vs low exposure during the first 4 weeks, the proportion remained below ~7%, also for participants with high exposure (Figure 3A). During subsequent weeks, the slope of the exposure‐response curve became right‐shifted and flatter. The concentration of semaglutide estimated to be tolerated without nausea by 95% of participants increased from <5 to >30 nmol/L from week 1 to week 30 (Figure 3B). The sensitivity analyses for nausea using LOCF imputation or the completer population supported the main results, with similar evidence of tolerance development over time (data not shown).
The proportion of participants with nausea at a given exposure level was slightly lower at the semaglutide 1.0 mg maintenance dose (escalated in 3 steps) compared with 0.5 mg (2 steps; Figure 3C). Nausea was more frequently reported in women than in men across the range of exposures (Figure 3D). The proportions of participants reporting nausea was lower in SUSTAIN−Japan than in the other trials, with smaller changes across the exposure range (data not shown).
As observed with nausea, the exposure‐response analysis of vomiting showed an increased proportion of participants with events and number of events with increasing exposure (data not shown), with an indication of tolerance development and similar differences between men/women and among trials. In contrast, the proportion of participants reporting diarrhoea and constipation was largely independent of exposure and with limited tolerance development (not shown).
4. DISCUSSION
The exposure‐response analyses revealed clinically relevant reductions in HbA1c and body weight across semaglutide exposures after 30 weeks of treatment, irrespective of baseline values, indicating that all subgroups will benefit from treatment with semaglutide 0.5 mg. The exposure‐response relationship for HbA1c was influenced by baseline HbA1c; greater effects were observed with higher baseline HbA1c values. Furthermore, the exposure‐response relationship for body weight was influenced by sex, with greater weight loss in women. Other factors had limited impact. The exposure, HbA1c reduction and weight loss for the three relevant subgroups (defined by baseline HbA1c, baseline body weight and sex) indicated that all subgroups obtained a clinically relevant additional benefit with semaglutide 1.0 vs 0.5 mg, supporting findings of improved glycaemic control with the 1.0 mg dose from the individual trials using the full dataset and other trials in the SUSTAIN programme.8, 9, 10, 11, 15, 16
The relationship between exposure and HbA1c reduction in this population with T2DM was similar in men and women and across the ranges of body weight, age, race, ethnicity, diabetes duration and renal function. The exposure range associated with semaglutide doses of 0.5 and 1.0 mg showed that clinically relevant effects on HbA1c reduction were obtained with both doses, even at the lower end of the exposure range. In fact, the vast majority of participants obtained HbA1c levels <53 mmol/mol (7%) throughout the exposure range. Nevertheless, the glycaemic response increased with increasing semaglutide exposure within the exposure range, indicating that increasing the dose from 0.5 to 1.0 mg will provide further improved glycaemic control, supporting previous findings.8, 9, 10, 11, 15, 16 The proportion of participants achieving ADA and AACE targets also increased with increasing exposure.
While the reduction in HbA1c from baseline increased with increasing baseline HbA1c, the treatment outcome in terms of the absolute value of HbA1c at week 30 was inversely correlated with baseline HbA1c. Thus, although the subgroup with the highest baseline HbA1c had the largest reduction from baseline in HbA1c, this subgroup achieved the lowest degree of glycaemic control in terms of HbA1c outcome after 30 weeks. This effect of greater reductions in HbA1c with higher baseline values has been observed with other GLP‐1RAs over a similar or longer duration.17, 18, 19 Hence, participants with a relatively high baseline HbA1c level are likely to benefit more from semaglutide dose escalation from 0.5 to 1.0 mg than those with lower baseline values.
A linear relationship between semaglutide exposure and body weight loss was observed, indicating that greater weight loss was achieved with higher exposures. Although the lightest participants achieved a higher exposure than that observed in heavy participants, they would be expected to also benefit from increasing the dose. In fact, weight loss benefits would be expected to be greater in lighter participants because the absolute increase in exposure was greatest for these participants. The steeper slope vs exposure for women was also seen with liraglutide;20 the reason for this is currently unknown.
Gastrointestinal AEs are a well‐known consequence of GLP‐1RA treatment.21, 22, 23 The exposure‐response profiles for nausea at early time points were steep, consistent with the higher nausea incidence reported in the phase II trial after treatment with 0.8 mg semaglutide without dose escalation.6 This regimen led to higher exposure at earlier time points, compared with phase III trials. In the phase III trials, in which semaglutide 1.0 mg was achieved by dose escalation, the exposure‐response profiles for nausea at comparable exposures as in the phase II trial (without dose escalation) were less steep, emphasizing the benefit of dose escalation as tolerance develops. The higher incidences of nausea and vomiting reported by women than men across the range of exposures were also observed with other GLP‐1RAs.24
The increased pulse rate from baseline to end‐of‐trial compared with placebo has been seen previously with semaglutide8, 9, 10, 11, 15, 16 and other GLP‐1RAs,25 although there is no evidence of an increased cardiovascular risk.16, 26 While the clinical significance of the increase remains unknown, the presence of GLP‐1 receptors on the sinoatrial node may indicate a direct chronotropic effect.27 In the present analysis, there was no evidence of an exposure‐pulse rate relationship at the exposure levels associated with 0.5 and 1.0 mg semaglutide, consistent with results for liraglutide.20 There was also no evidence of increased calcitonin levels with increasing semaglutide exposure. No evidence of increased calcitonin concentrations was likewise found with liraglutide compared with placebo after 3 years.28
Limitations of the present study include that maintenance doses were limited to 0.5 and 1.0 mg semaglutide and thus did not allow an assessment of the full exposure‐response relationships for body weight. The applied exposure‐response models were limited to response data at specific time points after the start of treatment and are therefore not suitable for evaluating changes in treatment responses over time. Furthermore, for the exposure‐response analysis of GI AEs, the average steady‐state concentration with the maintenance dose was used as a predictor for all events reported during the trials, including events at earlier time points during dose escalation; however, as the estimated exposure was based on individual drug clearance, this estimate would probably also reflect the individual exposure level during the dose escalation. Additional model analyses are needed to elucidate the complete picture for the tolerance development and nausea incidence over time.
Whereas the primary purpose of these analyses was to provide information supporting the relevance of the two investigated dose levels in the adult T2DM programme, the analyses also offer a hypothesis‐generating basis for evaluating dose selection in other indications, such as weight management and non‐alcoholic steatohepatitis, and are an important reference for evaluating paediatric data.
In summary, determining the optimal treatment dose with the optimal benefit‐risk ratio is complex and exposure‐response analyses can assist the decision‐making process. In this exposure‐response analysis, all subgroups obtained a clinically relevant benefit with semaglutide 0.5 mg and an additional benefit with the 1.0 mg semaglutide dose. Increasing the dose was shown to provide a modest increase in nausea and other GI side effects, which can be mitigated by dose escalation. Neither pulse rate nor increased calcitonin concentrations were dependent on the exposure level. The exposure‐response analysis therefore supports the use of the proposed therapeutic doses of 0.5 and 1.0 mg semaglutide across all subgroups for improving glycaemic control, depending on individual need for HbA1c reduction.
Supporting information
Supplementary Appendix.
Table S1 Summary of randomised, controlled trials included in the exposure‐response analyses.
Table S2 Demographics and baseline characteristics.
Figure S1 HbA1c change from baseline versus exposure of semaglutide stratified by sex (A) and baseline body weight (B), age (C), race (D), ethnicity (E), diabetes duration (F), trial (G) and renal function (H).
Data are mean values of HbA1c change from baseline with 95% CI versus exposure expressed as 4 quantiles of Cavg, plus a value of 0 exposure assigned to subjects treated with placebo. The sigmoidal curved lines through the data represent covariate‐adjusted model‐derived estimates for each population. Horizontal lines with diamonds along the x‐axis represent median and 95% exposure ranges for each dose level.
Cavg, average semaglutide concentrations at steady state; CI, confidence interval; HbA1c, glycated haemoglobin.
Figure S2 Proportions of subjects achieving target HbA1c <7% (A) and HbA1c ≤6.5% (B) after 30 weeks of treatment versus semaglutide exposure and by trial (panels C and D).
Data are mean proportions with 95% CI versus exposure expressed as 4 quantiles of Cavg, plus a value of 0 exposure assigned to subjects treated with placebo. The lines through the data represent covariate‐adjusted model‐derived estimates for each population. Horizontal lines with diamonds along the x‐axis represent median and 95% exposure ranges for each dose level.
Cavg, average semaglutide concentrations at steady state; CI, confidence interval; HbA1c, glycated haemoglobin; SUSTAIN, Semaglutide Unabated Sustainability in Treatment of Type 2 Diabetes.
Figure S3 Diagnostic plots for the HbA1c exposure‐response model.
Data are observed changes from baseline in HbA1c versus population predictions (top left), weighted residuals versus population predictions (top right), QQ‐plot of weighted residuals (bottom left) and distribution plot of weighted residuals (bottom right).
CFB, change from baseline; HbA1c, glycated haemoglobin.
Figure S4 Diagnostic plots for the body weight exposure‐response model.
Data are observed changes from baseline in body weight versus population (top left), weighted residuals versus population predictions (top right), QQ‐plot of weighted residuals (bottom left) and distribution plot of weighted residuals (bottom right).
BW, body weight; CFB, change from baseline.
Figure S5 Resting pulse rate change from baseline versus semaglutide exposure (A) and proportion of subjects with elevated calcitonin (B) versus semaglutide exposure.
Data are mean changes at end‐of‐trial (pulse rate) or mean proportions of subjects at any time until end‐of‐treatment (calcitonin) with 95% CI versus exposure expressed as quantiles of Cavg. A value of 0 exposure was assigned to subjects treated with placebo. The lines through the data represent covariate‐adjusted model‐derived estimates for each population. Horizontal lines with diamonds along the x‐axis represent median and 95% exposure ranges for each dose level.
ACKNOWLEDGMENTS
We thank Anders Strathe, PhD (Novo Nordisk) for his input to the GI AE analyses and Angela Stocks, PhD (Larix A/S, Copenhagen, Denmark) for editorial and medical writing services, which were funded by Novo Nordisk.
Conflict of interest
K.C.C.P., S.H.I., A.F., J.Z. and R.V.O. are employed by and hold stock in Novo Nordisk.
Author contributions
K.C.C.P. and R.V.O. planned the analysis with contribution from S.H.I., A.F. and J.Z. K.C.C.P. and R.V.O. were responsible for the data set collection and statistical analysis. All authors contributed to the interpretation of the data. All authors were involved in the writing, reviewing and editing of the manuscript, gave final approval and agreed to be accountable for all aspects of the work.
Petri KCC, Ingwersen SH, Flint A, Zacho J, Overgaard RV. Exposure‐response analysis for evaluation of semaglutide dose levels in type 2 diabetes. Diabetes Obes Metab. 2018;20:2238–2245. 10.1111/dom.13358
Funding information Funding for this trial and the trial products were provided by Novo Nordisk A/S, Bagsværd, Denmark.
REFERENCES
- 1. Flint A, Raben A, Astrup A, Holst JJ. Glucagon‐like peptide 1 promotes satiety and suppresses energy intake in humans. J Clin Invest. 1998;101:515‐520. [DOI] [PMC free article] [PubMed] [Google Scholar]
- 2. Holst JJ. The physiology of glucagon‐like peptide 1. Physiol Rev. 2007;87:1409‐1439. [DOI] [PubMed] [Google Scholar]
- 3. Drucker DJ, Nauck MA. The incretin system: glucagon‐like peptide‐1 receptor agonists and dipeptidyl peptidase‐4 inhibitors in type 2 diabetes. Lancet. 2006;368:1696‐1705. [DOI] [PubMed] [Google Scholar]
- 4. Lau J, Bloch P, Schaffer L, et al. Discovery of the once‐weekly glucagon‐like peptide‐1 (GLP‐1) analogue semaglutide. J Med Chem. 2015;58:7370‐7380. [DOI] [PubMed] [Google Scholar]
- 5. Kapitza C, Nosek L, Jensen L, Hartvig H, Jensen CB, Flint A. Semaglutide, a once‐weekly human GLP‐1 analog, does not reduce the bioavailability of the combined oral contraceptive, ethinylestradiol/levonorgestrel. J Clin Pharmacol. 2015;55:497‐504. [DOI] [PMC free article] [PubMed] [Google Scholar]
- 6. Nauck MA, Petrie JR, Sesti G, et al. A phase 2, randomized, dose‐finding study of the novel once‐weekly human GLP‐1 analog, semaglutide, compared with placebo and open‐label liraglutide in patients with type 2 diabetes. Diabetes Care. 2016;39:231‐241. [DOI] [PubMed] [Google Scholar]
- 7. Petri KCC, Ingwersen SH, Flint A, Zacho J, Overgaard RV. Semaglutide s.c. once‐weekly in type 2 diabetes: a population pharmacokinetic analysis. Diabetes Therapy. 2018. In Press. [DOI] [PMC free article] [PubMed] [Google Scholar]
- 8. Sorli C, Harashima S, Tsoukas GM, et al. Efficacy and safety of once‐weekly semaglutide monotherapy versus placebo in patients with type 2 diabetes (SUSTAIN 1): a double‐blind, randomised, placebo‐controlled, parallel‐group, multinational, multicentre phase 3a trial. Lancet Diabetes Endocrinol. 2017;5:251‐260. [DOI] [PubMed] [Google Scholar]
- 9. Ahren B, Masmiquel L, Kumar H, et al. Efficacy and safety of once weekly semaglutide versus sitagliptin as add‐on to metformin and/or thiazolidinediones in subjects with type 2 diabetes (SUSTAIN 2): a 56‐week randomised, controlled clinical trial. Lancet Diabetes Endocrinol. 2017;5:341‐354. [DOI] [PubMed] [Google Scholar]
- 10. Ahmann AJ, Capehorn M, Charpentier G, et al. Efficacy and safety of once‐weekly semaglutide versus exenatide ER in subjects with type 2 diabetes (SUSTAIN 3): a 56‐week, open‐label, randomized clinical trial. Diabetes Care. 2017;41:258‐266. [DOI] [PubMed] [Google Scholar]
- 11. Kaku K, Yamada Y, Watada H, et al. Safety and efficacy of once‐weekly semaglutide vs additional oral antidiabetic drugs, in Japanese people with inadequately controlled type 2 diabetes: a randomised trial. Diabetes Obes Metab. 2018;20(5):1202‐1212. [DOI] [PMC free article] [PubMed] [Google Scholar]
- 12. Overgaard RV, Ingwersen SH, Tornoe CW. Establishing good practices for exposure‐response analysis of clinical endpoints in drug development. CPT Pharmacometrics Syst Pharmacol. 2015;4:565‐575. [DOI] [PMC free article] [PubMed] [Google Scholar]
- 13. American Diabetes Association . Standards of medical care in diabetes‐2013. Diabetes Care. 2013;36(Suppl 1):11‐66. [PubMed] [Google Scholar]
- 14. Handelsman Y, Bloomgarden ZT, Grunberger G, et al. American association of clinical endocrinologists and American college of endocrinology ‐ clinical practice guidelines for developing a diabetes mellitus comprehensive care plan ‐ 2015. Endocr Pract. 2015;21(Suppl 1):1‐87. [DOI] [PMC free article] [PubMed] [Google Scholar]
- 15. Aroda VR, Bain SC, Cariou B, et al. Efficacy and safety of once‐weekly semaglutide versus once‐daily insulin glargine in insulin‐naïve subjects with type 2 diabetes (SUSTAIN 4): a randomised open‐label clinical trial. Lancet Diabetes Endocrinol. 2017;5:355‐366. [DOI] [PubMed] [Google Scholar]
- 16. Marso SP, Bain SC, Consoli A, et al. Semaglutide and cardiovascular outcomes in patients with type 2 diabetes. N Engl J Med. 2016;375:1834‐1844. [DOI] [PubMed] [Google Scholar]
- 17. Buse JB, Henry RR, Han J, Kim DD, Fineman MS, Baron AD. Effects of exenatide (exendin‐4) on glycemic control over 30 weeks in sulfonylurea‐treated patients with type 2 diabetes. Diabetes Care. 2004;27:2628‐2635. [DOI] [PubMed] [Google Scholar]
- 18. Blonde L, Klein EJ, Han J, et al. Interim analysis of the effects of exenatide treatment on A1c, weight and cardiovascular risk factors over 82 weeks in 314 overweight patients with type 2 diabetes. Diabetes Obes Metab. 2006;8:436‐447. [DOI] [PubMed] [Google Scholar]
- 19. Henry RR, Buse JB, Sesti G, et al. Efficacy of antihyperglycemic therapies and the influence of baseline hemoglobin A(1C): a meta‐analysis of the liraglutide development program. Endocr Pract. 2011;17:906‐913. [DOI] [PubMed] [Google Scholar]
- 20. Wilding JPH, Overgaard RV, Jacobsen LV, Jensen CB, le Roux CW. Exposure‐response analyses of liraglutide 3.0 mg for weight management. Diabetes Obes Metab. 2016;18:491‐499. [DOI] [PMC free article] [PubMed] [Google Scholar]
- 21. DeRosa G, Maffioli P. GLP‐1 agonists exenatide and liraglutide: a review about their safety and efficacy. Curr Clin Pharmacol. 2012;7:214‐228. [DOI] [PubMed] [Google Scholar]
- 22. Sun F, Chai S, Yu K, et al. Gastrointestinal adverse events of glucagon‐like peptide‐1 receptor agonists in patients with type 2 diabetes: a systematic review and network meta‐analysis. Diabetes Technol Ther. 2015;17:35‐42. [DOI] [PMC free article] [PubMed] [Google Scholar]
- 23. Lean ME, Carraro R, Finer N, et al. Tolerability of nausea and vomiting and associations with weight loss in a randomized trial of liraglutide in obese, non‐diabetic adults. Int J Obes (Lond). 2014;38:689‐697. [DOI] [PMC free article] [PubMed] [Google Scholar]
- 24. Horowitz M, Aroda VR, Han J, Hardy E, Rayner CK. Upper and/or lower gastrointestinal adverse events with glucagon‐like peptide‐1 receptor agonists: incidence and consequences. Diabetes Obes Metab. 2017;19:672‐681. [DOI] [PMC free article] [PubMed] [Google Scholar]
- 25. Ussher JR, Drucker DJ. Cardiovascular actions of incretin‐based therapies. Circ Res. 2014;114:1788‐1803. [DOI] [PubMed] [Google Scholar]
- 26. Marso SP, Daniels GH, Brown‐Frandsen K, et al. Liraglutide and Cardiovascular Outcomes in Type 2 Diabetes. N Engl J Med. 2016;375:311‐322. [DOI] [PMC free article] [PubMed] [Google Scholar]
- 27. Pyke C, Heller RS, Kirk RK, et al. GLP‐1 receptor localization in monkey and human tissue; Novel distribution revealed with extensively validated monoclonal antibody. Endocrinology. 2014;155:1280‐1290. [DOI] [PubMed] [Google Scholar]
- 28. Hegedus L, Sherman SI, Tuttle RM, et al. No evidence of increase in calcitonin concentrations or development of C‐cell malignancy in response to liraglutide for up to 5 years in the LEADER trial. Diabetes Care. 2018;41(3):620‐622. [DOI] [PubMed] [Google Scholar]
Associated Data
This section collects any data citations, data availability statements, or supplementary materials included in this article.
Supplementary Materials
Supplementary Appendix.
Table S1 Summary of randomised, controlled trials included in the exposure‐response analyses.
Table S2 Demographics and baseline characteristics.
Figure S1 HbA1c change from baseline versus exposure of semaglutide stratified by sex (A) and baseline body weight (B), age (C), race (D), ethnicity (E), diabetes duration (F), trial (G) and renal function (H).
Data are mean values of HbA1c change from baseline with 95% CI versus exposure expressed as 4 quantiles of Cavg, plus a value of 0 exposure assigned to subjects treated with placebo. The sigmoidal curved lines through the data represent covariate‐adjusted model‐derived estimates for each population. Horizontal lines with diamonds along the x‐axis represent median and 95% exposure ranges for each dose level.
Cavg, average semaglutide concentrations at steady state; CI, confidence interval; HbA1c, glycated haemoglobin.
Figure S2 Proportions of subjects achieving target HbA1c <7% (A) and HbA1c ≤6.5% (B) after 30 weeks of treatment versus semaglutide exposure and by trial (panels C and D).
Data are mean proportions with 95% CI versus exposure expressed as 4 quantiles of Cavg, plus a value of 0 exposure assigned to subjects treated with placebo. The lines through the data represent covariate‐adjusted model‐derived estimates for each population. Horizontal lines with diamonds along the x‐axis represent median and 95% exposure ranges for each dose level.
Cavg, average semaglutide concentrations at steady state; CI, confidence interval; HbA1c, glycated haemoglobin; SUSTAIN, Semaglutide Unabated Sustainability in Treatment of Type 2 Diabetes.
Figure S3 Diagnostic plots for the HbA1c exposure‐response model.
Data are observed changes from baseline in HbA1c versus population predictions (top left), weighted residuals versus population predictions (top right), QQ‐plot of weighted residuals (bottom left) and distribution plot of weighted residuals (bottom right).
CFB, change from baseline; HbA1c, glycated haemoglobin.
Figure S4 Diagnostic plots for the body weight exposure‐response model.
Data are observed changes from baseline in body weight versus population (top left), weighted residuals versus population predictions (top right), QQ‐plot of weighted residuals (bottom left) and distribution plot of weighted residuals (bottom right).
BW, body weight; CFB, change from baseline.
Figure S5 Resting pulse rate change from baseline versus semaglutide exposure (A) and proportion of subjects with elevated calcitonin (B) versus semaglutide exposure.
Data are mean changes at end‐of‐trial (pulse rate) or mean proportions of subjects at any time until end‐of‐treatment (calcitonin) with 95% CI versus exposure expressed as quantiles of Cavg. A value of 0 exposure was assigned to subjects treated with placebo. The lines through the data represent covariate‐adjusted model‐derived estimates for each population. Horizontal lines with diamonds along the x‐axis represent median and 95% exposure ranges for each dose level.